|
Page
|
|||
|
1
|
|||
|
ITEM 1.
|
1
|
||
|
1
|
|||
|
3
|
|||
|
7
|
|||
|
7
|
|||
|
13
|
|||
|
13
|
|||
|
14
|
|||
|
15
|
|||
|
ITEM 1A.
|
16
|
||
|
ITEM 1B.
|
38
|
||
|
ITEM 2.
|
39
|
||
|
ITEM 3.
|
39
|
||
|
ITEM 4.
|
39
|
||
|
40
|
|||
|
ITEM 5.
|
40
|
||
|
ITEM 6.
|
41
|
||
|
ITEM 7.
|
42 | ||
|
ITEM 7A.
|
53 | ||
|
ITEM 8.
|
55 | ||
|
ITEM 9.
|
86 | ||
|
ITEM 9A.
|
86
|
||
|
ITEM 9B.
|
86
|
||
|
ITEM 9C.
|
86 | ||
| 87 | |||
|
ITEM 10.
|
DIRECTORS, EXECUTIVE OFFICERS AND CORPORATE GOVERNANCE
|
87 | |
|
ITEM 11.
|
EXECUTIVE COMPENSATION
|
87 | |
|
ITEM 12.
|
SECURITY OWNERSHIP OF CERTAIN BENEFICIAL OWNERS AND MANAGEMENT AND RELATED STOCKHOLDER MATTERS
|
87 | |
|
ITEM 13.
|
CERTAIN RELATIONSHIPS AND RELATED TRANSACTIONS, AND DIRECTOR INDEPENDENCE
|
87 | |
|
ITEM 14.
|
PRINCIPAL ACCOUNTANT FEES AND SERVICES
|
87 | |
| 87 | |||
|
ITEM 15.
|
87 | ||
|
ITEM 16.
|
89 | ||
| 90 | |||
THIS ANNUAL REPORT ON FORM 10-K, IN PARTICULAR “ITEM 1. BUSINESS” AND “ITEM 7. MANAGEMENT’S DISCUSSION AND ANALYSIS OF FINANCIAL CONDITION AND RESULTS OF OPERATIONS,” CONTAINS FORWARD-LOOKING
STATEMENTS WITHIN THE MEANING OF SECTION 27A OF THE SECURITIES ACT OF 1933, AS AMENDED, AND SECTION 21E OF THE SECURITIES EXCHANGE ACT OF 1934, AS AMENDED, THAT REPRESENT OUR CURRENT EXPECTATIONS AND BELIEFS. ALL STATEMENTS OTHER THAN STATEMENTS OF
HISTORICAL FACT ARE “FORWARD-LOOKING STATEMENTS” FOR PURPOSES OF FEDERAL AND STATE SECURITIES LAWS AND INCLUDE, BUT ARE NOT LIMITED TO, STATEMENTS OF MANAGEMENT’S EXPECTATIONS REGARDING OUR PERFORMANCE, INITIATIVES, STRATEGIES, PRODUCTS, INGREDIENTS,
PRODUCT INTRODUCTIONS AND OFFERINGS, PRODUCT SOURCING, GROWTH, ACQUISITIONS AND ACQUIRED COMPANIES’ PERFORMANCE, GLOBAL ECONOMIC CONDITIONS, OPPORTUNITIES AND RISKS; STATEMENTS OF PROJECTIONS REGARDING FUTURE SALES, EXPENSES, OPERATING RESULTS, TAXES
AND DUTIES, CAPITAL EXPENDITURES, SOURCES AND USES OF CASH, FOREIGN-CURRENCY FLUCTUATIONS OR DEVALUATIONS, REPATRIATION OF UNDISTRIBUTED EARNINGS, AND OTHER FINANCIAL ITEMS; STATEMENTS OF MANAGEMENT’S EXPECTATIONS AND BELIEFS REGARDING OUR MARKETS,
SALES FORCE, SALES COMPENSATION PLAN AND CUSTOMER BASE; STATEMENTS REGARDING THE PAYMENT OF FUTURE DIVIDENDS AND STOCK REPURCHASES; STATEMENTS REGARDING THE OUTCOME OF LITIGATION, AUDITS, INVESTIGATIONS AND OTHER LEGAL MATTERS, INCLUDING GOVERNMENT
POLICIES AND REGULATIONS IN MAINLAND CHINA AND THE UNITED STATES; ACCOUNTING ESTIMATES AND ASSUMPTIONS; STATEMENTS OF BELIEF; AND STATEMENTS OF ASSUMPTIONS UNDERLYING ANY OF THE FOREGOING. IN SOME CASES, YOU CAN IDENTIFY THESE STATEMENTS BY
FORWARD-LOOKING WORDS SUCH AS “BELIEVE,” “EXPECT,” “PROJECT,” “ANTICIPATE,” “ESTIMATE,” “COMMIT,” “INTEND,” “PLAN,” “TARGETS,” “LIKELY,” “WILL,” “WOULD,” “COULD,” “MAY,” “MIGHT,” THE NEGATIVE OF THESE WORDS AND OTHER SIMILAR WORDS. WE UNDERTAKE NO
OBLIGATION TO PUBLICLY UPDATE OR REVISE ANY FORWARD-LOOKING STATEMENT, WHETHER AS A RESULT OF NEW INFORMATION, FUTURE EVENTS OR OTHERWISE, EXCEPT AS REQUIRED BY LAW. WE CAUTION AND ADVISE READERS THAT THESE STATEMENTS ARE BASED ON ASSUMPTIONS THAT
MAY NOT BE REALIZED AND INVOLVE RISKS AND UNCERTAINTIES THAT COULD CAUSE ACTUAL RESULTS TO DIFFER MATERIALLY FROM THE EXPECTATIONS AND BELIEFS CONTAINED HEREIN. FOR A SUMMARY OF THESE RISKS, SEE “ITEM 1A. RISK FACTORS.”
In this Annual Report on Form 10-K, references to “dollars” and “$” are to U.S. dollars.
Nu Skin, Pharmanex and ageLOC are our trademarks. The italicized product names used in this Annual Report on Form 10-K are product names and also, in certain cases, our
trademarks.
Nu Skin Enterprises, Inc. develops and distributes a comprehensive line of premium-quality beauty and wellness solutions in approximately 50 markets worldwide. In 2021, our revenue of
$2.7 billion was primarily generated by our three primary brands: our beauty brand, Nu Skin; our wellness brand, Pharmanex; and our anti-aging brand, ageLOC. We operate in the direct selling channel,
primarily utilizing person-to-person marketing to promote and sell our products, including through the use of social and digital platforms.
In addition to our core Nu Skin business, we also explore new areas of growth and opportunity through our strategic investment arm known as Rhyz Inc. Rhyz investments include beauty and wellness
product manufacturing companies and other investments. In 2021, the Rhyz companies generated $174.7 million, or 6%, of our 2021 reported revenue (excluding sales to our core Nu Skin business).
In 2021, we generated approximately 20% of our revenue from the United States and approximately 21% from Mainland China. Given the size of our international operations, our results, as reported
in U.S. dollars, are often impacted by foreign-currency fluctuations; in 2021, our revenue was positively impacted 2% from foreign-currency fluctuations compared to 2020. Our results also can be impacted by global economic, political, demographic
and business trends and conditions.
Our operations are subject to various laws and regulations globally, particularly with respect to our product categories and our distribution channel. See Item 1A. Risk Factors for a more
detailed description of the risks associated with our business.
We offer a branded, differentiated product portfolio. We believe our innovative approach to product development and distribution provides us with a competitive advantage in beauty and wellness
products and direct selling. We believe that our acquired and licensed technologies, manufacturing and innovation facilities, research collaborations and in-house research expertise enable us to introduce innovative, proprietary products. We seek to
offer products that are demonstrable and well suited for social sharing. Sustainability is also an important part of our product strategy; we take sustainability into account as we formulate our products, and we have an ongoing initiative to
transition to packaging that is recycled, recyclable, reusable, reduced or renewable.
Beginning in the second half of 2021 and continuing into 2022, we are launching our Beauty Focus Collagen+ skin care supplement and our ageLOC Meta nutritional supplement that helps support metabolic health.
During the past several years, we have generated success in our business with innovative beauty devices. Devices are becoming an increasingly important part of our strategy. During 2022, we
currently plan to launch two connected, “input/output” devices, which, subject to the consumer opting in, will gather data to provide insights into consumer behavior and needs, with the goal of enabling us to provide more personalized experiences for
our consumers. Please refer to “Distribution Channel” below for additional information about our connected devices and our business strategy that they fit into.
Product Categories
We have two primary product categories: beauty products and wellness products. We develop and distribute innovative, premium-quality products in these two categories under our Nu Skin and Pharmanex
brands, respectively. We also develop and distribute products under our ageLOC brand, which features innovative, premium-quality anti-aging products in both the beauty and wellness categories and in many cases is co-branded with our Nu Skin and
Pharmanex products. Our innovative beauty devices are among our ageLOC beauty products.
Presented below are the U.S. dollar amounts and associated revenue percentages from the sale of beauty and wellness products, as well as our Rhyz companies, for the last three years. This table
should be read in conjunction with the information presented in Item 7. Management’s Discussion and Analysis of Financial Condition and Results of Operations, which discusses the factors impacting revenue trends and the costs associated with
generating the aggregate revenue presented.
Revenue by Product Category
(U.S. dollars in millions)
|
Year Ended December 31,
|
||||||||||||||||||||||||
|
Product Category
|
2021
|
2020
|
2019
|
|||||||||||||||||||||
|
Beauty(1)
|
$
|
1,442.7
|
53.5
|
%
|
$
|
1,491.8
|
57.8
|
%
|
$
|
1,423.5
|
58.8
|
%
|
||||||||||||
|
Wellness(1)
|
1,062.5
|
39.4
|
%
|
922.6
|
35.7
|
%
|
863.1
|
35.7
|
%
|
|||||||||||||||
|
Other(2)
|
190.5
|
7.1
|
%
|
167.5
|
6.5
|
%
|
133.8
|
5.5
|
%
|
|||||||||||||||
|
$
|
2,695.7
|
100.0
|
%
|
$
|
2,581.9
|
100.0
|
%
|
$
|
2,420.4
|
100.0
|
%
|
|||||||||||||
| (1) |
Includes sales of beauty and wellness products in our core Nu Skin business. The beauty category includes $658 million, $712 million, $618 million in sales of devices and related
consumables for the years ended December 31, 2021, 2020 and 2019, respectively.
|
| (2) |
Other includes the external revenue from our Rhyz companies along with a limited number of other products and services, including household products and technology services.
|
Beauty Products. Our strategy for our beauty products category is to leverage our distribution channel to strengthen Nu Skin’s position
as an innovative leader in the masstige and premium beauty markets. Our products in this category include our innovative skin care devices, cosmetics and other personal care products. We are committed to continuously improving and evolving our
product formulations to develop and incorporate innovative and proven ingredients. We formulate many of the products in our beauty category with ingredients that are scientifically proven to provide visible results. In 2021, our top-selling products
by revenue in this category were two of our innovative skin care devices and related consumables: our ageLOC Spa systems and our ageLOC LumiSpa skin treatment and
cleansing device. Our ageLOC beauty products accounted for 48% of our beauty product category revenue and 26% of our total revenue in 2021.
Wellness Products. Our strategy for our wellness category is to continue to introduce innovative, substantiated nutritional
supplements based on research and development and quality manufacturing. Direct selling has proven to be an effective method of marketing our high-quality wellness products because our sales force can personally educate consumers on the quality and
benefits of our products, differentiating them from our competitors’ offerings. In 2021, our three top-selling products by revenue in this category were our LifePak nutritional supplements, our ageLOC Youth nutritional supplements and our ageLOC TR90 weight management and body shaping system. Our ageLOC wellness products accounted for 46% of our wellness
product category revenue and 18% of our total revenue in 2021.
Product Development
We are committed to developing and marketing innovative products. We have several products in development, including next-generation skin care products and nutritional supplements. In
our research and product development, we leverage the three disciplines of science, technology and sourcing to create innovative products that address consumer needs. In recent years, we have developed several technologies that pertain to
skin-treatment beauty devices including ageLOC LumiSpa and ageLOC Boost. These devices employ novel technologies related to skin health.
Our research and product development activities include:
| ● |
Global consumer research to identify needs and insights and refine product concepts;
|
| ● |
Internal research, product development and quality testing;
|
| ● |
Joint research projects, collaborations and clinical studies;
|
| ● |
Identification and assessment of technologies for potential licensing arrangements; and
|
| ● |
Acquisition of technologies.
|
We maintain research and product development facilities in the United States and Mainland China. We also contract with third parties for clinical studies and collaborate on basic research projects
with researchers from universities and other research institutions in the United States and Asia, whose staffs include scientists with basic research expertise in, among others, natural product chemistry, biochemistry, dermatology, nutrition,
pharmacology and clinical studies.
We also work to identify and assess innovative technologies developed by third parties for potential licensing, supply or acquisition arrangements. Because of the nature of our distribution
channel, which allows us to provide a high level of product information on a person-to-person basis, we often have third parties who are interested in licensing innovative technologies to us to incorporate into our products and commercialize through
our distribution channel. Licensing arrangements allow us to leverage the research activities of third parties that have provided demonstrated technologies, clinical support and/or proprietary innovation, without all of the upfront costs and
uncertainty associated with internal development. We have also invested in acquisitions to supplement our research capabilities and to acquire technologies.
Intellectual Property
Our major trademarks are registered in the United States and in each market where we operate or have plans to operate, and we consider trademark protection to be very important to our business. Our
major trademarks include Nu Skin®, our fountain logos, Pharmanex®, ageLOC®, LifePak®, Galvanic Spa®, TR90®, Epoch®, ageLOC Me®, LumiSpa® and ageLOC Boost®. In addition, a number of our products, including our facial spas, ageLOC Body Spa, LumiSpa, ageLOC Boost, TR90 and Pharmanex BioPhotonic
Scanner, are based on proprietary technologies and designs, some of which are patented or licensed from third parties. We also rely on patents and trade secret protection to protect our proprietary technology and other proprietary
information for our ageLOC and other products.
Sourcing and Production
For markets other than Mainland China, in 2021, we sourced most of our beauty and wellness products from trusted third-party suppliers and manufacturers, and approximately 18% from our
manufacturing subsidiaries. Our manufacturing entities also provide a cost of goods sold benefit and help us to maintain a more consistent supply source. In Mainland China, we operate manufacturing facilities where we produce the majority of our
beauty and wellness products sold in Mainland China. We also produce some products at these facilities that are exported to other markets.
In 2021, one of our manufacturing subsidiaries, but no third-party suppliers, accounted for more than 10% of our product purchases. We procure our ageLOC Spa
systems and other products or ingredients from single vendors that may own or control the product formulations, ingredients, or other intellectual property rights associated with the products or ingredients. While we generally maintain good
relationships with our suppliers, in the event we become unable to source any products or ingredients from our current suppliers, we believe that we would be able to locate alternative vendors, use substitute ingredients, or develop and manufacture
alternative products and source them from other suppliers, as applicable. Please refer to Item 1A. Risk Factors for a discussion of risks and uncertainties associated with our supplier relationships and with the sourcing of raw materials and
ingredients.
In 2021, we acquired a company that we anticipate will help to provide our company and Brand Affiliates with improved social selling capabilities. This business and our manufacturing subsidiaries
are owned by our Rhyz strategic investment arm. We plan to continue making strategic acquisitions going forward, as we believe these acquired companies allow us to vertically integrate our business and leverage their expertise to enhance our
innovation, sustainability, speed to market and supply chain capabilities.
We also currently own, through our Rhyz entity, a business that was pursuing the commercialization of controlled-environment agriculture technology for use in the agriculture feed industry. This
business was part of our Grow Tech segment. During the fourth quarter of 2021, we determined to exit the Grow Tech segment to focus more resources on key strategic initiatives in our core business. We are currently in the process of winding down this
segment.
In addition to the products and services provided to our core Nu Skin business, our Rhyz companies continue to operate outside of our core Nu Skin business, generating $174.7 million in revenue from sales to external
customers in 2021.
We operate in the direct selling channel, primarily utilizing person-to-person marketing to promote and sell our products. We believe that direct selling, which has traditionally
relied on face-to-face, word-of-mouth marketing, is currently being impacted by the convergence of social commerce, influencer and affiliate marketing, and the growing gig economy. These macroeconomic shifts have also disrupted traditional
advertising and retail business practices, as well as e-commerce generally, in favor of socially enabled and direct-to-consumer models. The COVID-19 pandemic has further accelerated disruption across many
industries by causing migration to remote work and online shopping.
We endeavor to transform and adapt our business to these trends by helping our sales force to become more socially enabled and to grow their businesses online. Social commerce helped to drive strong growth in our U.S.
and EMEA markets in 2020 and 2021, and we are currently working through a significant digital transformation in our business to achieve widespread adoption of social commerce in all of our markets, including further adoption in the U.S. and EMEA.
This transformation involves the development of new and enhanced digital tools for our Sales Leaders and consumers, including new digital apps and an improved website design and functionality. Our products also have served an important role in our
social commerce strategy as we have developed products that are shareable and demonstrable on social media platforms. Products continue to play an important role as we transform to a more digital and socially enabled business; in particular, we
believe that connected devices will provide data on consumer behaviors and needs that will engender a more personalized experience for our consumers and improved brand loyalty.
Our digital transformation will require significant expenditures over the next several years. It and social sharing also present certain risks and challenges to our business, and some social media platforms impose
restrictions or prohibitions on content related to multi-level marketing. For further information, see Item 1A. Risk Factors.
We believe our direct selling distribution channel is an effective vehicle to distribute our products because:
| ● |
our sales force has rapid reach to potential customers through their social networks and the social networks of those to whom they are connected;
|
| ● |
our sales force can personally educate and share company content with consumers about our products, which we believe is more effective for differentiating our products than using traditional mass-media
advertising;
|
| ● |
our distribution channel allows for personalized product demonstrations and trial by potential consumers;
|
| ● |
our distribution channel allows our sales force to provide personal testimonials of product efficacy; and
|
| ● |
our sales force has the opportunity to provide consumers personalized service based on consumers’ needs, including through providing personalized purchasing offers, discounts and regimens.
|
While our person-to-person marketing philosophy remains consistent globally, various aspects of our business may differ from market to market, including product mix and pricing, customer type mix,
the manner and tools used to engage potential customers, social media and third-party platforms, compensation structure, access to distribution outlets or product stores, the manner of getting products to consumers, product claims, branding and
product formulations. In addition, in Mainland China we have implemented a business model that, unlike the business model we use in our other markets, utilizes retail stores, sales employees, independent direct sellers and independent marketers to
market our products.
Given that members of our sales force are independent contractors in most markets, we do not control or direct their promotional efforts. We do, however, require that our sales force abide by
policies and procedures that require them to act in an ethical and consumer-protective manner and in compliance with applicable laws and regulations. As a member of direct selling associations globally, we promote and abide by the industry’s codes of
ethics and consumer-protective standards to support and protect those who sell and purchase our products through the direct selling channel.
In all of our markets besides Mainland China, we refer to members of our independent sales force as “Brand Affiliates” because their primary role is to promote our brand and products through their
personal and social networks.
Consumer Group and Sales Network
Our distribution channel is composed of two primary groups: our consumer group—individuals who buy our products primarily for personal or family consumption and share products with friends and
family; and our sales network—individuals who personally buy, use and resell products, and who also attract new consumers, and recruit, train and develop new sellers. We strive to develop both our consumer group and our sales network. Our strategy
for growing our consumer group is to offer high-quality, personalized, innovative products that provide demonstrable benefits. Our strategy for growing our sales network is to provide a business opportunity for those persons who demonstrate the
desire and ability to develop both a consumer group and a team of sellers, including through sales compensation, incentives and recognition.
To monitor the growth trends in our consumer group, we track the number of persons who purchased products directly from the company during the previous three months (“Customers”). We believe a
significant majority of Customers purchase our products primarily for personal or family consumption but are not actively pursuing the opportunity we offer to generate supplemental income by actively and consistently marketing and reselling products.
Our Customer numbers do not include consumers who purchase products directly from members of our sales force.
To monitor the growth in our sales network, we track the number of Brand Affiliates, and sales employees and independent marketers in Mainland China, who achieve certain qualification
requirements (“Sales Leaders”). Our Sales Leaders are also included in our Customer numbers, as they purchase products from the company and are within the definition of our “Customers.” The following chart
sets forth information concerning our Customers and Sales Leaders for the last three years. As we transform our business in the manners discussed above, we are considering additional metrics to help evaluate our business.
Total Number of Customers and Sales Leaders by Region
|
As of December 31, 2021
|
As of December 31, 2020
|
As of December 31, 2019
|
||||||||||||||||||||||
|
Customers
|
Sales Leaders
|
Customers
|
Sales Leaders
|
Customers
|
Sales Leaders
|
|||||||||||||||||||
|
Mainland China
|
315,418
|
17,658
|
381,460
|
21,990
|
292,812
|
17,987
|
||||||||||||||||||
|
Americas
|
336,564
|
10,340
|
366,688
|
12,754
|
195,646
|
6,573
|
||||||||||||||||||
|
South Korea
|
146,354
|
7,108
|
158,953
|
7,059
|
168,972
|
7,251
|
||||||||||||||||||
|
Southeast Asia/Pacific
|
169,601
|
10,386
|
192,622
|
10,588
|
160,919
|
8,514
|
||||||||||||||||||
|
EMEA
|
210,414
|
6,124
|
258,587
|
7,063
|
153,330
|
4,619
|
||||||||||||||||||
|
Japan
|
122,813
|
5,872
|
128,400
|
6,318
|
125,557
|
5,916
|
||||||||||||||||||
|
Hong Kong/Taiwan
|
66,395
|
4,027
|
70,592
|
4,663
|
65,669
|
3,900
|
||||||||||||||||||
|
Total
|
1,367,559
|
61,515
|
1,557,302
|
70,435
|
1,162,905
|
54,760
|
||||||||||||||||||
Global Direct Selling Channel
Outside of Mainland China, individuals can elect to participate in our business as follows:
| ● |
“Brand Affiliate-Direct Consumers”—Individuals who purchase products directly from a Brand Affiliate at a price established by the Brand Affiliate.
|
| ● |
“Company-Direct Consumers”—Individuals who purchase products directly from the company. These consumers are typically referred by a Brand Affiliate and may purchase at retail price or at a
discount. These individuals do not have the right to build a Nu Skin business by reselling product or by recruiting others.
|
| ● |
“Basic Brand Affiliates”—Brand Affiliates who purchase products for personal or family use or for resale to other consumers. These individuals are not eligible to receive compensation on a multi-level basis unless they elect to qualify as a Sales Leader under our global sales compensation plan. We consider these individuals to be part of our consumer group, as we believe a significant majority of these
Brand Affiliates are purchasing products for personal use and not actively recruiting others.
|
| ● |
“Sales Leaders and Qualifiers”—Brand Affiliates who have qualified or are trying to qualify as a Sales Leader. These Brand Affiliates have elected to pursue the business opportunity as a Sales Leader and are
actively attracting consumers, recruiting Brand Affiliates and building a sales network under our global sales compensation plan and constitute our sales network.
|
To become a Brand Affiliate, an individual signs a Brand Affiliate agreement and receives a business portfolio, which is free in most markets and in some cases is delivered in electronic form. In
some markets, we charge a small fee for the business portfolio, which is limited to our costs. The business portfolio generally consists of documentation concerning the business, including copies of the sales compensation plan, Brand Affiliate
policies and procedures, product catalog and other documentation, but does not include products. There are no requirements to purchase products or other materials to become a Brand Affiliate, and no commissions are paid on any purchase of a business
portfolio.
We offer a generous product return policy, which also includes returns of business support materials. In most markets, we offer a return policy that allows our Brand Affiliates to
return unopened and unused items for up to 30 days for a full refund, or 12 months subject to a 10% restocking fee. Brand Affiliates are not required to terminate their accounts to return product. Actual returns have historically been less
than 5% of annual revenue. We believe our generous return policy minimizes the financial risks associated with being a Brand Affiliate.
In addition to our product return policy, we strive to be as customer protective as possible. We seek to ensure that those who use our products or participate in our business opportunity are treated fairly and are not
misled by inappropriate product or earnings claims.
There are two fundamental ways in which our Brand Affiliates can earn money:
| ● |
through retail markups on resales of products purchased from the company; and
|
| ● |
through sales compensation earned on the sale of products under our global sales compensation plan.
|
We believe that our global sales compensation plan is among the most generous in the direct selling industry and is one of our competitive advantages. Our Sales Leaders can receive sales
compensation under our global sales compensation plan for product sales from the company to their own network of consumers as well as for product sales from the company to other Sales Leaders and their consumer
groups. This type of sales compensation is often referred to as “multi-level” compensation. Our sales force is not required to recruit or sponsor others, and we do not pay any sales compensation for
recruiting or sponsoring. While all of our Brand Affiliates can sponsor others at any time, our Sales Leaders and those in qualification to become Sales Leaders are those who generally are actively sponsoring others. Pursuant to our global sales
compensation plan, we pay consolidated sales compensation in a Sales Leader’s home market, in local currency, for product sales in the Sales Leader’s own consumer group and for product sales in the Sales
Leader’s team of Sales Leaders across all geographic markets.
Mainland China Business Model
Because of restrictions on direct selling and multi-level commissions in Mainland China, we have implemented a business model for that market that is different from the business model we use in our
other markets. We have structured our business model in Mainland China based on several factors: the guidance we have received from government officials, our interpretation of applicable regulations, our understanding of the practices of other
international direct selling companies operating in Mainland China, and our understanding as to how regulators are interpreting and enforcing the regulations.
In Mainland China, we utilize sales employees to sell products through our retail stores and website; independent direct sellers, who can sell away from our stores where we have a direct selling
license and a service center and can also sell through our website; and independent marketers, who are licensed business owners authorized to sell our products at their own approved premises or through our stores and website. Our business model in
Mainland China is still a person-to-person distribution channel as we rely on our sales employees, independent direct sellers and independent marketers to attract new consumers and promote repeat purchases, and to educate our sales force about our
products, culture and policies through frequent training meetings.
Our sales employees, independent direct sellers and independent marketers in Mainland China do not participate in our global sales compensation plan but are instead compensated according to a
separate compensation model established for Mainland China, which is separate and different from our global compensation plan. Independent direct sellers and sales employees who have not achieved certain qualification requirements receive direct
sales bonuses and retail sales bonuses, respectively, based on their monthly product sales. Sales employees who achieve qualification requirements and independent marketers earn (1) monthly retail bonuses on their product sales and other bonuses
based on various performance metrics; and (2) a salary (for sales employees, consisting of position pay and performance pay) or service fee (for independent marketers). The salary or service fee and position/title are reviewed and adjusted quarterly
based on their performance relative to other sales leaders, taking into account such factors as the sales productivity of the Sales Leader him/herself and of the sales force that such Sales Leader trains, collaborates with, supports and services. We
utilize our global system to track and assess the sales productivity of each Sales Leader him/herself and the sales force that such Sales Leader trains, collaborates with, supports and services and in connection with the evaluation of their
position/title. We generally compensate our Mainland China Sales Leaders at a level that is competitive with other direct selling companies in the market and comparable to the compensation of our Sales Leaders globally.
Operating in Mainland China entails certain risks and uncertainties to our business, as discussed further in Item 1. Business—“Regulation” and Item 1A. Risk Factors. We
endeavor to mitigate these risks and uncertainties through various measures, including by seeking to understand and obey laws and regulations, training our employees and sales force, engaging in dialogue with government officials to better understand
their goals and explain our plans, and cooperating in inquiries and other matters of interest to regulators. However, these efforts do not eliminate the significant risks associated with operating in Mainland China.
Our global sales compensation plan and our Mainland China business model, including our related know-how, processes and systems, play a significant role in helping us to attract and incentivize our
sales force. We have strategically developed and refined our global sales compensation plan and our Mainland China business model to distinguish the business opportunity that we offer from those of other companies and to seek to provide us with a
competitive advantage.
Sales Incentives, Meetings, Recognition and Training
An important part of our distribution channel is motivating our Sales Leaders and recognizing their achievements. We hold regular meetings and events globally to recognize Sales Leaders who have
achieved various levels of success in our business. These meetings also allow the company and key Sales Leaders to provide training to other Sales Leaders. Although we conduct these meetings and events either virtually or in-person, we are
increasingly conducting them virtually—and in 2021, most of them were virtual. We utilize a variety of sales incentives such as incentive trips to motivate Sales Leaders. In addition to rewarding performance, incentive trips provide Sales Leaders and
the company opportunities to share best practices and set goals, generate alignment of Sales Leaders around key initiatives and provide a high level of motivation and team building.
Product Launch Process
We use a variety of methods to launch our products, enabling us to tailor the launch process to the specific market and the specific product. Prior to making a key product generally available for purchase, we may do
one or more introductory offerings of the product, such as a preview of the product to our Sales Leaders or other product introduction or promotion. In some of these offerings, we may sell the product for a limited time, often in limited quantities,
and then remove it from the market for a period of time before making it generally available for purchase. We refer to this entire process, beginning with the introductory offering through general availability of the product, as a product launch or
our launch process.
Sales Leader previews and other product introductions and promotions may generate significant activity and a high level of purchasing, which can result in a higher-than-normal increase in revenue during the quarter and
can skew year-over-year and sequential comparisons. We believe our product launch process attracts new Customers and Sales Leaders to our business, increases consumer trial and provides us with important marketing and forecasting information about
our products. Please refer to Item 1A. Risk Factors for more information on risks related to our product launch process.
Beginning in the second half of 2021 and continuing into 2022, we are launching our Beauty Focus Collagen+ skin care supplement and our ageLOC Meta nutritional supplement that helps support metabolic health.
We currently sell and distribute our Nu Skin business’s products in approximately 50 markets. We have divided our markets into seven segments: Mainland China; South Korea;
Southeast Asia/Pacific, which includes Indonesia, Malaysia, the Philippines, Singapore, Thailand, Vietnam, Australia, New Zealand and other markets; Americas, which includes Canada, Latin America and the United States; Japan; Hong Kong/Taiwan,
which also includes Macau; and Europe, Middle East and Africa (“EMEA”), which includes markets in Europe as well as Israel, Russia and South Africa. Our Rhyz strategic investment arm also includes three additional
segments: Manufacturing, Grow Tech, and Rhyz other. The following table sets forth the revenue for each of the segments and the Other category for the last three years.
|
Year Ended December 31,
|
||||||||||||||||||||||||
|
(U.S. dollars in millions)
|
2021
|
2020
|
2019
|
|||||||||||||||||||||
|
Nu Skin
|
||||||||||||||||||||||||
|
Mainland China
|
$
|
568.8
|
21
|
%
|
$
|
625.5
|
24
|
%
|
$
|
722.5
|
30
|
%
|
||||||||||||
|
Americas
|
547.8
|
20
|
453.0
|
18
|
304.4
|
12
|
||||||||||||||||||
|
South Korea
|
354.3
|
13
|
326.5
|
13
|
330.0
|
14
|
||||||||||||||||||
|
Southeast Asia/Pacific
|
336.7
|
13
|
361.6
|
14
|
346.3
|
14
|
||||||||||||||||||
|
EMEA
|
283.2
|
11
|
230.2
|
9
|
167.2
|
7
|
||||||||||||||||||
|
Japan
|
266.2
|
10
|
273.7
|
10
|
260.0
|
11
|
||||||||||||||||||
|
Hong Kong/Taiwan
|
162.6
|
6
|
161.1
|
6
|
166.3
|
7
|
||||||||||||||||||
|
Other
|
1.4
|
—
|
0.1
|
—
|
1.7
|
—
|
||||||||||||||||||
|
Total Nu Skin
|
2,521.0
|
94
|
2,431.7
|
94
|
2,298.4
|
95
|
||||||||||||||||||
| Rhyz Investments |
||||||||||||||||||||||||
|
Manufacturing
|
172.1
|
6
|
149.3
|
6
|
121.9
|
5
|
||||||||||||||||||
|
Grow Tech
|
2.1
|
—
|
0.9
|
—
|
0.1
|
—
|
||||||||||||||||||
|
Rhyz other
|
0.5
|
—
|
—
|
—
|
—
|
—
|
||||||||||||||||||
|
Total Rhyz Investments
|
174.7
|
6
|
150.2
|
6
|
122.0
|
5
|
||||||||||||||||||
|
Total
|
$
|
2,695.7
|
100
|
%
|
$
|
2,581.9
|
100
|
%
|
$
|
2,420.4
|
100
|
%
|
||||||||||||
Additional comparative revenue and related financial information is presented in Note 15 to the consolidated financial statements contained in this report.
Our business is subject to various laws and regulations globally, particularly with respect to our direct selling business models and our product categories. In addition, as a United States entity
operating through subsidiaries in foreign jurisdictions, we are subject to foreign exchange control, transfer pricing and customs laws that regulate the flow of funds between us and our subsidiaries and for product purchases, management services and
contractual obligations, such as the payment of sales commissions. As is the case with most companies in our industry, we receive inquiries from time to time from government regulatory authorities regarding the nature of our business and other
issues, such as compliance with local direct selling, transfer pricing, customs, taxation, foreign exchange control, securities and other laws.
Direct Selling Regulations
Direct selling is regulated by various national, state and local government agencies in the United States and foreign markets. These laws and regulations are generally intended to
prevent fraudulent or deceptive schemes, including “pyramid” schemes, which compensate participants primarily for recruiting additional participants without significant emphasis on product sales
to consumers. The laws and regulations in our current markets generally:
| ● |
impose requirements related to order cancellations, product returns, inventory buy-backs and cooling-off periods for our sales force and consumers;
|
| ● |
require us, or our sales force, to register with government agencies;
|
| ● |
impose limits on the amount of sales compensation we can pay;
|
| ● |
impose reporting requirements; and
|
| ● |
require that our sales force is compensated for sales of products and not for recruiting others.
|
The laws and regulations governing direct selling may be modified or reinterpreted from time to time, which may cause us to modify our sales compensation and business models.
In almost all of our markets, regulations are subject to discretionary interpretation by regulators and judicial authorities. There is often ambiguity and uncertainty with respect to the state of direct
selling and anti-pyramiding laws and regulations. In the United States, for example, federal law provides law enforcement agencies, such as the Federal Trade Commission (“FTC”), broad latitude in policing unfair or deceptive trade practices, but does
not provide a bright-line test for identifying a pyramid scheme. A number of states have passed legislation that more clearly distinguishes between illegal pyramid schemes and legitimate multi-level marketing business models. Recent settlements
between the FTC and other direct selling companies and guidance from the FTC have addressed inappropriate earnings and lifestyle claims, problematic compensation structures and the importance of focusing on consumers. In addition, during 2021 the FTC
announced that it is initiating a review of its Business Opportunity Rule, which imposes certain obligations on business opportunity sellers in their dealings with prospective buyers. Currently, multi-level marketing companies are exempted from this
rule. If this exemption is eliminated or if new regulations are adopted for multi-level marketing companies, it could negatively impact the growth of our sales force and our revenue. Also during 2021, the FTC sent a notice to more than 1,100
companies, including us and two of our subsidiaries (Pharmanex, LLC and Big Planet, Inc.), that outlined several practices that the FTC determined to be unfair or deceptive in prior administrative cases. These practices relate to earnings claims,
other money-making opportunity claims, and endorsements and testimonials. Pursuant to the FTC’s “penalty offense authority,” companies that received the notice are expected to comply with the standards set in the prior administrative cases and could
incur significant civil penalties if they or their representatives fail to do so. The penalties could be up to $43,792 per violation, and there is some ambiguity in how a “violation” would be defined for these purposes. For more information about
these matters, other regulatory actions, and their potential impact on our business, see Item 1A. Risk Factors—“Challenges to the form of our network marketing system could harm our business” and “Laws and regulations may prohibit or severely
restrict direct selling and cause our revenue and profitability to decline, and regulators could adopt new regulations that harm our business.”
The regulatory environment in Mainland China is particularly complex and continues to evolve. Mainland China’s direct selling and anti-pyramiding regulations contain various
restrictions, including a prohibition on the payment of multi-level compensation. The regulations are subject to discretionary interpretation by state, provincial and local regulators as well as local customs and practices. Regulators continue to
act cautiously as they monitor the development of direct selling in Mainland China. To expand our direct selling model into additional provinces in Mainland China, we currently must obtain a series of approvals from the local Department of Commerce
in such provinces, the Shanghai Municipal Commission of Commerce (our supervisory authority), as well as the Ministry of Commerce, PRC (“MOFCOM”), which is the national governmental authority overseeing direct selling. In the course of obtaining
these approvals, the respective authorities under MOFCOM must also consult and seek opinions on our business operations from the Ministry of Public Security and the Administration for Market Regulation at both provincial and state levels. Government
authorities have not been issuing new licenses for direct selling since the beginning of the 100-day action in early 2019.
Our operations in Mainland China are subject to significant government and media scrutiny and investigations. At times, investigations and other regulatory actions have limited our ability to conduct business in
Mainland China. For example, the government’s scrutiny of activities within the health products and direct selling industries has been at higher levels since 2019, following negative media coverage about the healthcare-related product claims made by
another direct selling company in Mainland China. During this time, we have been receiving and addressing an increased number of government reviews, inspections, and inquiries and consumer complaints in Mainland China; our ability to hold certain
business meetings has been limited; and negative media coverage has spread to include additional companies, including ours. Another example occurred in 2014. In response to media and government scrutiny of our Mainland China business in 2014, we
voluntarily took a number of actions in Mainland China, including temporarily suspending our business meetings, temporarily suspending acceptance of applications for any new sales representatives, and extending our product refund and return policies.
These voluntary measures and the adverse publicity had a significant negative impact on our business. We face a risk that future investigations and other regulatory actions may result in fines, revocation of licenses or other significant sanctions.
For more information about these matters, other regulatory actions, and their potential impact on our business, see Item 1A. Risk Factors, “Risks Associated with Our Operations in Mainland China.”
Several markets, including Mainland China, South Korea, Indonesia and Vietnam, impose limits on the amount of sales compensation we can pay to our sales force. For example, under regulations in Mainland China, direct
selling companies may pay independent direct sellers in Mainland China up to a maximum 30% of the revenue they generate through their own sales of products to consumers. Additionally, in South Korea, local regulations limit sales compensation to 35%
of our total value of goods or services supplied in South Korea. We have implemented various measures to comply with these limits.
In some markets, regulations applicable to the activities of our Sales Leaders may affect our business because we are, or regulators may assert that we are, responsible for our Sales Leaders’ conduct. In these markets,
regulators may request or require that we take steps to ensure that our Sales Leaders comply with local regulations. For example, in Japan, we have taken steps to comply with strict requirements regarding how Brand Affiliates approach prospective
customers. From time to time, we receive information from consumer centers in certain prefectures about the number of general inquiries and complaints about us and our Brand Affiliates, and we also sometimes receive warnings to reduce such
complaints. Based on this information, we continually evaluate and enhance our Brand Affiliate compliance, education and training efforts in Japan.
Our sales force is required to comply with work authorization and other local legal requirements prior to working in a market. Some markets, including Mainland China and Vietnam, also prohibit or restrict participation
of overseas personnel or foreigners in direct selling activities. We have implemented policies that are designed to comply with these regulations and inform our sales force regarding the types of activities that are not permitted. However, we cannot
assure that actions of our sales force will not violate local laws or regulations or our policies.
Please refer to Item 1A. Risk Factors for more information on regulatory and other risks associated with our business.
Product Regulations
Our beauty and wellness products and related promotional and marketing activities are subject to extensive government regulation by numerous federal, state and local government agencies and
authorities, including the United States Food and Drug Administration (the “FDA”), the FTC, the Consumer Product Safety Commission, the Department of Agriculture, United States and State Attorneys General and other state regulatory agencies in the
United States, as well as the State Administration for Market Regulation in Mainland China, the Food and Drug Administration in Taiwan, the Ministry of Food and Drug Safety in South Korea, the Ministry of Health, Labour and Welfare in Japan and
similar government agencies in all other markets in which we operate. In the United States, the FDA, in particular, regulates the formulation, manufacture and labeling of over-the-counter (“OTC”) drugs, cosmetics, dietary supplements, foods and
medical devices such as those distributed by us.
Regulation of Beauty Products in the United States. Our beauty products are subject to various laws and regulations that regulate
cosmetic and personal care products and set forth regulations that, among other things, determine whether a product can be marketed as a “cosmetic” or requires further approval as an OTC drug. In the United States, the regulation of cosmetic content
and labeling is under the primary jurisdiction of the FDA. Cosmetics are not subject to pre-market approval by the FDA, but their ingredients and their label and labeling content are regulated by the FDA, and it is the burden of those who sell
cosmetics to ensure that they are safe for use as directed and not adulterated or misbranded. The labeling of cosmetic products is subject to the requirements of the Federal Food, Drug, and Cosmetic Act (“FDCA”), the Fair Packaging and Labeling Act
and other FDA regulations.
The FDCA defines cosmetics by their intended use, as “articles intended to be rubbed, poured, sprinkled, or sprayed on, introduced into, or otherwise applied to the human body . . . for cleansing,
beautifying, promoting attractiveness, or altering the appearance.” Among the products included in this definition are skin moisturizers, perfumes, lipsticks, fingernail polishes, eye and facial makeup preparations, shampoos, permanent waves, hair
colors, toothpastes and deodorants, as well as material intended for use as a component of a cosmetic product. A product may be considered a drug if it is intended for use in the diagnosis, cure, mitigation, treatment, or prevention of disease, or is
intended to affect the structure or any function of the body (“structure/function claims”). A product’s intended use can be inferred from marketing or product claims, and regulators may consider the marketing claims of our sales force.
Structure/function claims are generally prohibited for cosmetic products as are disease prevention and treatment claims. The FDA prohibits certain ingredients from being included in cosmetic products. It is possible that cosmetic product ingredients
now commonly in use that are the product of certain scientific advancements or production processes may be restricted or prohibited in the future as more is learned about such ingredients.
In recent years, the FDA has issued warning letters to many cosmetic companies alleging improper structure/function claims regarding their cosmetic products, including, for example, product claims
regarding gene activity, cellular rejuvenation, and rebuilding collagen. Cosmetic companies confront difficulty in determining whether a claim would be considered by the FDA to be an improper structure/function claim. Given this difficulty, and our
research and product development focus on the sources of aging and the influence of certain ingredients on gene expression, there is a risk that we could receive a warning letter, be required to modify our product claims or take other actions to
satisfy the FDA if the FDA determines any of our marketing materials contain improper structure/function claims for our cosmetic products. In addition, plaintiffs’ lawyers have filed class action lawsuits against some of our competitors after our
competitors received these FDA warning letters. There can be no assurance that we will not be subject to government actions or lawsuits, which could harm our business.
Certain products, such as sunscreens and acne treatments, are classified as OTC drugs (and cosmetics, depending on claims) and have specific ingredient, labeling and manufacturing requirements. OTC
drug products may be marketed if they conform to the requirements of an FDA-established OTC drug monograph that is applicable to that drug. Drug products not conforming to monograph requirements require an approved New Drug Application (“NDA”) before
marketing may begin. Under these provisions, if the agency were to find that a product or ingredient of one of our OTC drug products is not generally recognized as safe and effective or is not included in a final monograph that is applicable to one
of our OTC drug products, we may be required to reformulate or cease marketing that product until it is the subject of an approved NDA or until the time, if ever, that the monograph is amended to include such product. The labeling of these products
is subject to the requirements of the FDCA and the Fair Packaging and Labeling Act and other FDA regulations.
Regulation of Beauty Products in Other Markets. The other markets in which we operate have similar regulations. In Mainland China,
beauty products, other than devices, are placed into one of two categories, “special-purpose cosmetics” and “general cosmetics.” Products in both categories require adequate substantiation of efficacy, which must be made available to authorities
prior to marketing a product and which can be reviewed and enforced upon at any time thereafter. The product registration process for some categories of beauty products in Mainland China can be unpredictable and generally takes from 9 to 18 months to
complete. However, in some cases, product registration in Mainland China has taken several years. In Japan, the Ministry of Health, Labour and Welfare regulates the sale and distribution of cosmetics and requires us to have an import business license
and to register each beauty product imported into Japan. In Taiwan, all “medicated” cosmetic products require registration. In South Korea, all “functional” cosmetics are required to either undergo examination by or be reported to the Ministry of
Food and Drug Safety. The sale of cosmetic products is regulated in the European Union (the “EU”) under the EU Cosmetics Directive, which requires a uniform application for foreign companies making beauty product sales. Similar regulations in any of
our markets may limit our ability to import products or utilize key ingredients or technologies globally and may delay product launches while the registration and approval process is pending. Changing regulations may require us to stop selling,
discontinue or reformulate and re-register products in order to sell those products.
Regulation of Wellness Products in the United States. Our wellness products are also subject to applicable regulations of government
agencies in the markets in which we operate. In the United States, we generally market our wellness products as conventional foods or dietary supplements. The FDA has jurisdiction over this regulatory area. The FDA imposes specific requirements for
the labels and labeling of food and dietary supplements, including the requirements of the Food Allergen Labeling and Consumer Protection Act of 2004, which mandates declaration of the presence of major food allergens. In addition, the Public Health
Security and Bioterrorism Preparedness and Response Act of 2002 contains requirements with regard to the sale and importation of food products in the United States.
The FDA Food Safety Modernization Act (“FSMA”), which was signed into law in 2011, also increased the FDA’s authority with respect to food safety and made significant changes to the
FDCA with respect to strengthening the U.S. food safety system. It enables the FDA to focus more on preventing food safety problems rather than primarily reacting to problems after they occur. The law also provides the FDA with enforcement
authorities designed to achieve higher rates of compliance with prevention- and risk-based food safety standards and to better respond to and contain problems when they do occur. The law also gives the FDA important tools to hold imported foods to
the same standards as domestic foods and directs the FDA to build an integrated national food safety system in partnership with state and local authorities. The FDA is actively enforcing FSMA requirements,
subjecting food and nutritional supplements to increased regulatory scrutiny. Pursuant to FSMA, the FDA is authorized, among other things, to order mandatory recalls, issue “administrative detention” orders, and revoke manufacturing facility
registrations (effectively preventing the operation of a food or dietary supplement manufacturing facility), and importers of foods and nutritional supplements are subject to Foreign Supplier Verification Program requirements.
The FDA regulates dietary supplements principally under the Dietary Supplement Health and Education Act of 1994 (“DSHEA”). DSHEA formally defines what may be sold as a dietary supplement, defines
statements of nutritional support and the conditions under which they may lawfully be used, and includes provisions that permit the FDA to regulate manufacturing practices and labeling claims applicable to dietary supplements. Because the majority of
our wellness products are regulated under DSHEA, we are generally not required to obtain regulatory approval prior to introducing a dietary supplement into the United States market. Prior to marketing a product, we are obligated to notify the FDA of
any structure/function claims that we intend to make about the product in any product-related materials.
Generally, under DSHEA, dietary ingredients that were on the market before October 15, 1994 may be used in dietary supplements without notifying the FDA. However, a “new” dietary ingredient (i.e.,
a dietary ingredient that was not marketed in the United States before October 15, 1994) must be the subject of a new dietary ingredient notification submitted to the FDA unless the ingredient has been “present in the food supply as an article used
for food” without having been “chemically altered.” The enforcement of the term “chemically altered” has been and continues to evolve within the FDA. As such, an ingredient that is deemed today not to be “chemically altered” may be viewed otherwise
in the future, which could lead to our being required to reformulate or cease marketing the product until such time that we can find a suitable replacement. A new dietary ingredient notification must provide the FDA with evidence of a “history of use
or other evidence of safety” which establishes that use of the dietary ingredient “will reasonably be expected to be safe.” A new dietary ingredient notification must be submitted to the FDA at least 75 days before the new dietary ingredient can be
marketed. Under DSHEA, the FDA may seek to remove from the market any new dietary ingredient that the FDA determines to be unsafe. In addition, the FDA may also deem a dietary supplement an unapproved drug where the marketing claims made in
connection with the sale or promotion of the product effectively place it in the drug category.
Regulation of Wellness Products Globally. In our foreign markets, nutritional supplements are generally regulated by similar government
agencies, such as the Mainland China State Administration for Market Regulation, the South Korea Ministry of Food and Drug Safety; the Japan Ministry of Health, Labour and Welfare and the Taiwan Department of Health. We typically market our wellness
products in international markets as foods, health foods, dietary supplements, food supplements or other similar categorizations under applicable regulatory regimes. With few exceptions, in the event a product or ingredient is classified as a drug or
pharmaceutical product in any market, we will generally not be able to distribute that product in that market through our distribution channel because of pre-market approvals and strict regulations applicable to drug and pharmaceutical products.
Mainland China also has highly restrictive nutritional supplement product regulations. Products marketed as “health foods” are subject to extensive laboratory and clinical analysis by government authorities, and the product registration process in
Mainland China takes a minimum of two years and may be substantially longer. In some cases it has taken us four years or longer to obtain product registrations. A pre-market process has been established for “health foods,” which allows products with
only basic nutritional ingredients (some vitamins and minerals) to be notified rather than registered. We market both “health foods” and “general foods” in Mainland China. There is some risk associated with the common practice in Mainland China of
marketing a product as a “general food” while seeking “health food” classification. If government officials feel the categorization of our products is inconsistent with product claims, form of delivery, ingredients or function, this could end or
limit our ability to market such products in Mainland China in their current form. In addition, we are not permitted to market or sell “general foods” through our direct sales channel in Mainland China and any efforts by our independent direct
sellers to do so could result in negative publicity, fines and other government sanctions being imposed against us.
The markets in which we operate all have varied regulations that distinguish foods and nutritional supplements from “pharmaceutical products.” Because of the varied regulations, some products or
ingredients that are recognized as a “food” in certain markets may be treated as a “pharmaceutical” in other markets. In Japan, for example, if a specified ingredient is not listed as a “food” by the Ministry of Health and Welfare, we must either
modify the product to eliminate or substitute that ingredient, or petition the government to treat such ingredient as a food. We experience similar issues in our other markets. This is particularly a challenge in Europe, where regulations often still
differ from member state to member state, despite EU regulations designed to harmonize the laws of EU member states. As a result, we often must modify the ingredients and/or the levels of ingredients in our products for certain markets or create
unique formulations for multiple markets. In some circumstances, the regulations in foreign markets may require us to obtain regulatory approval prior to introduction of a new product or limit our use of certain ingredients altogether.
Because of negative publicity associated with some adulterated or misbranded supplements, including pharmaceutical drugs marketed as dietary supplements, there has been an increased movement in the
United States and other markets to expand the regulation of dietary supplements, which could lead to additional restrictions or requirements in the future. In general, the regulatory environment is becoming more complex with increasingly stricter
regulations each year.
Manufacturing Process. In 2008, and as subsequently updated under the regulations implementing the FSMA, the FDA established
regulations to require current “good manufacturing practices” for dietary supplements and food products in the United States. The regulations ensure that dietary supplements and food products are produced in a quality manner, do not contain
contaminants or impurities above pre-established levels, and are accurately labeled. The regulations include requirements for establishing quality control procedures for us and our vendors and suppliers, designing and constructing manufacturing
plants, and testing ingredients and finished products throughout our supply chain. The regulations also include requirements for record keeping and handling consumer product complaints. If dietary supplements or food products contain contaminants
or allergens or do not contain the type or quantity of dietary ingredient they are represented to contain, the FDA would consider those products to be adulterated or misbranded. Our business is subject to additional FDA regulations, such as new
dietary ingredient regulations and adverse event reporting regulations that require us to document and track adverse events and report serious adverse events that involve hospitalization, permanent impairment or death associated with consumers’ use
of certain of our products. Compliance with these regulations has increased, and may further increase, the cost of manufacturing and selling certain of our products as we incur internal costs, oversee and inspect more aspects of third-party
manufacturing and work with our vendors to assure they are in compliance and maintain accurate recordkeeping to establish controls. Failure to comply with good manufacturing practices could also result in product recalls.
Advertising and Product Claims. Most of our major markets also regulate advertising and product claims regarding the efficacy and quality
of products and require adequate and reliable scientific substantiation of all claims. In most of our foreign markets, we are typically not able to make any “medicinal” claims with respect to our wellness products. In some cases, such regulations may
limit our ability to inform consumers of some of the benefits our products offer.
In the United States, the FDA generally prohibits disease diagnosis, prevention and treatment claims when made for a dietary supplement. DSHEA, however, permits substantiated,
truthful and non-misleading “statements of nutritional support” to be included in labeling for dietary supplements without FDA pre-approval. Such statements may describe how a particular dietary ingredient affects the structure, function or
general well-being of the body, or the mechanism of action by which a dietary ingredient may affect the structure, function or well-being of the body, but such statements may not state that a dietary supplement will reduce the risk or incidence of a
disease unless such claim has been reviewed and approved by the FDA. In addition, the FDA permits companies to use FDA-approved full and qualified health claims for products containing specific ingredients that meet stated requirements.
A company that uses a statement of nutritional support in labeling must possess evidence substantiating that the statement is truthful and not misleading. The FDA has issued guidance defining a manufacturer’s
obligations to substantiate structure/function claims. Such statements, when used in labeling, must also be submitted to the FDA no later than thirty days after first marketing the product with the statement that they possess the necessary evidence
and must be accompanied by an FDA mandated label disclaimer that “This statement has not been evaluated by the FDA. This product is not intended to diagnose, treat, cure or prevent any disease.” There can be no assurance, however, that the FDA or FTC
will not determine that a particular statement of nutritional support that we want to use is an unacceptable disease claim or an unauthorized nutrient-disease relationship claim otherwise permitted with FDA approval as a “health claim” or that such
claims have competent and reliable scientific evidence. Such a determination might prevent the use of such a claim or result in additional FDA enforcement.
We are aware of media reports regarding dietary supplements, which call for the repeal or amendment of DSHEA. Individuals or groups that are opposed to supplements or question their safety or efficacy may attempt to
use these media reports to propose legislation intended to amend or repeal DSHEA. Some of the legislative proposals may include variations on premarket approval, enhanced premarket safety or substantiation required and changing the definition of a
“dietary ingredient” to remove either botanicals or selected classes of ingredients now treated as dietary ingredients.
Most of the other markets in which we operate have not adopted legislation like DSHEA, and we may be subject to more restrictive limitations on the claims we can make about our products in these
markets. For example, in Japan, our nutritional supplements are marketed as food products, which significantly limits our ability to make claims regarding these products. If marketing materials produced or used by us or our sales force globally make
claims that exceed the scope of allowed claims for nutritional supplements, the FDA or other regulatory authorities could deem our products to be unapproved drugs. In Mainland China, we also face significant restrictions on our ability to make
product claims regarding the efficacy of our products. Violations, alleged violations, or negative media attention related to our compliance with these restrictions could harm consumers’ perception of our business and products and could negatively
impact the registration, licensing status and sales of our products.
The FTC, which exercises primary jurisdiction over the advertising of all of our products in the United States, has instituted enforcement actions against dietary supplement, food, and cosmetic
companies for, among other things, deceptive advertising and lack of adequate scientific substantiation for claims. We also face limitations on our use of the scientific experts who have helped us develop and test some of our products. In the United
States, for example, the FTC’s Guides Concerning the Use of Endorsements and Testimonials in Advertising may restrict marketing to those results obtained by a “typical” consumer and require disclosure of any material connections between an endorser
and the company or products they are endorsing. In Mainland China, some media outlets have questioned the nature and extent of our connections with our Scientific Advisory Board and others who have helped in developing our scientific approach or
testing our products. This negative publicity could harm consumers’ perception of our business and our products, which could negatively impact our revenue. We cannot be sure that the FTC, or comparable foreign agencies, will not question our
advertising or other operations in the future.
In recent years, the FTC has initiated numerous investigations of and actions against companies that sell dietary supplements and cosmetic products. The FTC may enforce compliance
with the law in a variety of ways, both administratively and judicially, using compulsory process, cease and desist orders, and injunctions. FTC enforcement can result in consent decrees or orders requiring, among other things, injunctive
provisions, corrective advertising, consumer redress, and such other relief as the agency deems necessary to protect the public. Violation of these consent decrees or orders could result in substantial financial or other penalties. The FTC also
sends warning letters as it monitors companies’ activities. For example, during 2020 and 2021 the FTC issued letters that warned several direct-selling companies to remove and address claims that they or members of their sales force were
making about their products’ ability to treat or prevent COVID-19 and/or about the earnings that people who have recently lost income could make. No assurance can be given that the FTC will not question our
advertising or other operations in the United States in the future. Any action in the future by the FTC could materially and adversely affect our ability to successfully market our products in the United States.
In connection with investigations that occurred in the early 1990s of certain alleged unsubstantiated product and earnings claims made by our Brand Affiliates, we entered into a
consent decree with the FTC and various agreements with state regulatory agencies. The consent decree requires us to, among other things, supplement our procedures to enforce our policies, not allow our Brand Affiliates to make earnings
representations without making certain average earnings disclosures and not allow our Brand Affiliates to make unsubstantiated product claims. The FTC could initiate an enforcement action to the extent the
FTC determines that our advertising or promotional practices are deceptive or contrary to the requirements of the consent decree.
Regulation of Medical Devices. In 2014, our facial spa was cleared for marketing through the 510(k) process with the FDA as a medical
device with cosmetic benefit. Medical devices are highly regulated by the FDA. Manufacturers of medical devices must register and list their products with the FDA annually, whether they are located domestically or overseas. Foreign jurisdictions may
take note of the fact that we have registered a medical device in the United States and require us to register in their market as well. The FDA has broad regulatory powers in the areas of clinical testing, manufacturing and labeling of medical
devices. Medical devices must be labeled in accordance with the FDA’s general device labeling requirements and whatever particular label requirements the FDA may designate for that type of device.
In addition, medical device manufacturers must adhere to certain “good manufacturing practices” in accordance with the FDA’s Quality System Regulation, which regulates the manufacture of medical
devices, prescribes record-keeping procedures and provides for the routine inspection of facilities for compliance with such regulations. If in connection with these inspections, the FDA believes the manufacturer has failed to comply with applicable
regulations and/or procedures, it may issue observations that would necessitate prompt corrective action. If the FDA inspection observations are not addressed and/or corrective action taken in a timely manner and to the FDA’s satisfaction, the FDA
may issue a warning letter (which would similarly necessitate prompt corrective action) and/or proceed directly to other forms of enforcement action. Failure to respond timely to FDA inspection observations, a warning letter or other notice of
noncompliance and to promptly come into compliance could result in the FDA bringing enforcement action against us, which could include the shutdown of our production facilities, denial of importation rights to the United States for products
manufactured in overseas locations and criminal and civil fines.
Our Pharmanex BioPhotonic Scanner, ageLOC LumiSpa, ageLOC Boost, ageLOC Spa systems and any future devices may be subject to the regulations of various health, consumer-protection and other government authorities around the world. These
regulations vary from market to market and affect whether our products are required to be registered as medical devices, the claims that can be made with respect to these products, who can use them, and where they can be used. We have been required
to register our ageLOC Spa systems as medical devices in a few markets. We have registered ageLOC Boost as a medical device
in Thailand, and we intend to do so in the United States as well. We have been subject to regulatory inquiries in the United States, Japan and other markets with respect to the status of the Pharmanex BioPhotonic
Scanner as a non-medical device. Any determination that medical device clearance is required for one of our products, in a market where we currently market and sell such product as a cosmetic or non-medical device, could require us to expend
significant time and resources in order to meet the additional stringent standards imposed on medical device companies or prevent us from marketing the product.
Under applicable direct selling regulations in Mainland China, our Pharmanex BioPhotonic Scanner, ageLOC LumiSpa and ageLOC Spa systems are registered as “health care equipment” or “household appliances,” which enables us to market and sell them through our direct sales channel in that market. The process for registering products for the direct
sales channel in Mainland China is subject to delays. However, this process and registration requirement do not apply to all of our sales channels in Mainland China; although our independent direct sellers are prohibited from earning commissions by
selling products that are not so registered, sales by our sales employees or independent marketers are not subject to this requirement. Please refer to Item 1A. Risk Factors for more information on the regulatory risks associated with our
device products.
The markets for our products are highly competitive. Our competitors include a broad array of marketers of beauty and wellness products and pharmaceutical companies, such as L’Oréal, Clinique,
Estée Lauder, Nature’s Way, Avon Products and Mary Kay, many of which have longer operating histories and greater name recognition and financial resources than we do. We compete in these markets by emphasizing the innovation, value and premium
quality of our products and the reach, convenience and customer servicing of our distribution system.
Direct Selling
We compete with other direct selling organizations, some of which have a longer operating history, and greater visibility, name recognition and financial resources than we do. Leading global direct
selling companies include Amway, Natura Cosmeticos and Herbalife. We also compete with local direct selling companies in the markets in which we operate. We compete with these companies to attract and retain our sales force and consumers based on the
strength of our product offerings, sales compensation, multiple business opportunities, management and international operations.
As of December 31, 2021, we had approximately 4,600 full- and part-time employees worldwide. This does not include approximately 15,000 sales employees in our Mainland China operations. Although we
have statutory employee representation obligations in certain markets, our employees are generally not represented by labor unions except where expressly required by law. We believe that our relationship with our employees is good, and we do not
foresee a shortage in qualified personnel necessary to operate our business.
All of our full- and part-time employees are responsible for upholding the Nu Skin Code of Conduct and for striving to perpetuate the Nu Skin Way, our global culture aspiration, which includes the
following principles:
|
● A force for good
● Accountable and empowered
● Bold innovators
● Customer obsessed
|
● Direct and decisive
● Exceptional
● Fast speed
● One global team
|
The Nu Skin Way forms the foundation of our human capital strategy and objectives. The three primary objectives of our human capital strategy are:
| 1. |
Support the transformation of our business and culture to align with our business strategies and the Nu Skin Way;
|
| 2. |
Leverage global diversity and build inclusion; and
|
| 3. |
Simplify the employee experience through global alignment and optimization.
|
To measure our progress in achieving these objectives, we conduct a global employee survey every four months, which also gathers employee feedback for purposes of designing our talent programs,
rewards and benefits. Averaging an approximately 86% response rate during 2021, this survey generates valuable information for us to analyze and to act upon when appropriate. Each survey cycle yielded more than 70,000 data points, consisting of
employee responses to each survey question and employee comments. We also conducted focus groups with our employees to gather their feedback on the employee experience, including diversity, equity and inclusion (DEI) matters.
We regularly review our employees’ feedback to better align our human capital initiatives to the needs of our employees. For example, employee feedback has helped guide improvements in diversity,
equity and inclusion; manager development; and employee wellness efforts.
Our Board’s committees engage with our senior management and head of Human Resources regarding human capital management on a regular basis. Working with management, our Board’s committees oversee
and receive reports on matters including culture, compensation, benefits, key talent succession planning, employee engagement, and DEI. Each year, our management also reports to the Compensation and Human Capital Committee on management’s annual
assessment of risks related to our compensation policies and practices. In addition, our Nominating and Corporate Governance Committee conducts annual performance reviews for our key executive officers, and these performance reviews include their
performance on human capital management initiatives.
Evidencing the success of our human capital management initiatives, in 2021 we were recognized by the Direct Selling News as one of the best places to work in direct selling, the sixth consecutive year we have received this honor. In addition, Forbes
magazine named us to its list of the World’s Top Female-Friendly Companies for 2021 and to the Forbes list of America’s Best Employers for 2022.
In addition to our employees, our human capital resources also include our sales force. For information about our sales force, see Item 1. Business—“Distribution Channel.”
Our website address is www.nuskin.com. We make available, free of charge on our Investor Relations website, ir.nuskin.com, our Annual Reports on Form 10-K, Quarterly Reports on Form 10-Q, Current Reports on Form 8-K,
and amendments to those reports filed or furnished pursuant to Section 13(a) or 15(d) of the Securities Exchange Act of 1934 as soon as reasonably practicable after we electronically file such material with, or furnish it to, the Securities and
Exchange Commission.
We also use our Investor Relations website, ir.nuskin.com, as a channel of distribution of additional Company information that may be deemed material. Accordingly, investors should monitor this channel, in addition to
following our press releases, Securities and Exchange Commission filings and public conference calls and webcasts. The contents of our website shall not be deemed to be incorporated herein by reference.
We have adopted a Code of Conduct that applies to all of our employees, officers and directors, including those of our subsidiaries. Our Code of Conduct is available in the “Corporate Governance” section of our
Investor Relations website at ir.nuskin.com. In addition, stockholders may obtain a copy, free of charge, by making a written request to Investor Relations, Nu Skin Enterprises, Inc., 75 West Center Street, Provo, Utah 84601. Any amendments or
waivers (including implicit waivers) regarding the Code of Conduct requiring disclosure under applicable SEC rules or NYSE listing standards will be disclosed in the same section of our website.
Our executive officers as of February 14, 2022 are as follows:
|
Name
|
Age
|
Position
|
||
|
Steven J. Lund
|
68
|
Executive Chairman of the Board
|
||
|
Ryan S. Napierski
|
48
|
President and Chief Executive Officer
|
||
|
Connie M. Tang
|
51
|
Executive Vice President, Chief Global Growth and Customer Experience Officer
|
||
|
Mark H. Lawrence
|
52
|
Executive Vice President and Chief Financial Officer
|
||
|
Joseph Y. Chang
|
69
|
Executive Vice President and Chief Scientific Officer
|
||
|
Chayce D. Clark
|
39
|
Executive Vice President and General Counsel
|
||
|
Steven K. Hatchett
|
50
|
Executive Vice President and Chief Product Officer
|
Steven J. Lund has served as Executive Chairman of our board of directors since 2012. Mr. Lund previously served as Vice Chairman of our board of directors from 2006 to 2012
and as President, Chief Executive Officer and a member of our board of directors from 1996, when we went public, until 2003. Mr. Lund is a trustee of the Nu Skin Force for Good Foundation, a charitable organization established in 1996 by our company
to help encourage and drive the philanthropic efforts of our company and its sales force and employees to enrich the lives of others. Mr. Lund worked as an attorney in private practice prior to joining our company as Vice President and General
Counsel. He received a B.A. degree from Brigham Young University and a J.D. degree from Brigham Young University’s J. Reuben Clark Law School.
Ryan S. Napierski has served as our Company’s President since 2017 and as our CEO since September 2021. Previously, he served as President of Global Sales and Operations from
2015 to 2017. Prior to serving in that position, he served as both President of our North Asia region since 2014 and President of Nu Skin Japan since 2010. Mr. Napierski has fulfilled multiple leadership positions for Nu Skin since joining our
company in 1995, including Vice President of Business Development for Nu Skin EMEA and General Manager of the United Kingdom. Mr. Napierski has a Bachelor’s degree in business, a Master’s degree in business administration from Duke University and a
Master’s degree in international business from Goethe Universitat in Germany.
Connie M. Tang has served as our Executive Vice President, Chief Global Growth and Customer Experience Officer since April 2021. From 2012 to 2019, she served as president and
CEO of Princess House, a kitchen products company that markets and sells its products through the direct selling channel, and she founded Gritty Executive Consulting, LLC in 2020. Previously, she served as president of the U.S. division of JAFRA
Cosmetics and in management roles at BeautiControl. Ms. Tang received a B.A. degree from City University of New York – Brooklyn College.
Mark H. Lawrence has served as our Chief Financial Officer since 2017. From 2016 to 2017, Mr. Lawrence served as vice president of finance for the Innovation Center at Vivint
Smart Home, a home automation company. From 2013 to 2016, Mr. Lawrence was head of finance at Amazon Lab126, a consumer electronics research and development company that is a subsidiary of Amazon.com. During 2013, he served as senior vice president
of worldwide finance at Polycom, a voice and video communications company, and from 2002 to 2013 he served in various financial positions at Brocade Communications Systems, a networking hardware, software and services company. Mr. Lawrence holds a
bachelor’s degree from Brigham Young University and a Master of Business Administration degree from the University of California, Davis.
Joseph Y. Chang has served as our Chief Scientific Officer and Executive Vice President of Product Development since 2006. Dr. Chang served as President of our Pharmanex
division from 2000 to 2006. From 1997 to 2000, he served as Vice President of Clinical Studies and Pharmacology of Pharmanex. Dr. Chang has approximately 40 years of pharmaceutical experience. He received a B.S. degree from Portsmouth University and
a Ph.D. degree from the University of London.
Chayce D. Clark has served as our Executive Vice President and General Counsel since August 2021. Mr. Clark joined our company in 2015 as Assistant General Counsel and later
served as Vice President and Deputy General Counsel before beginning his current role. Prior to joining our company, he was a litigation attorney in private practice in Salt Lake City, Utah. He received a B.S. degree from Southern Utah University and
a J.D. degree from the University of Utah.
Steven K. Hatchett joined our company in 2018 and served as Senior Vice President of Global Manufacturing until January 2021, when he began serving as Senior Vice President of
Global Products. He became Executive Vice President of Global Products in January 2022. From 2015 to 2018, he served as CEO of a nutritional supplement manufacturer that our company acquired in 2018, at which time he began serving as president until
December 2020. Previously, he served as vice president of manufacturing and product innovation at Forever Living Products, and as CEO and president at Cornerstone Research and Development.
Risk Factor Summary
We are providing the following summary of the risk factors contained in this Annual Report on Form 10-K to enhance the readability and accessibility of our risk factor
disclosures. We encourage you to carefully review the full risk factors contained after this summary for additional information regarding the material factors that make an investment in our securities speculative or risky. These risks include the
following:
Risks Associated with Direct Selling and Our Sales Force
| ● |
Challenges to the form of our network marketing system could harm our business.
|
| ● |
Laws and regulations may prohibit or severely restrict direct selling and cause our revenue and profitability to decline, and regulators could adopt new regulations that harm our business.
|
| ● |
Improper sales force actions could harm our business.
|
| ● |
Social media platforms’ decisions to prohibit, block or decrease the prominence of our sales force’s content could harm our business.
|
| ● |
If our business practices or policies or the actions of our sales force are deemed to be in violation of applicable local regulations regarding foreigners, then we could be sanctioned and/or required to
change our business model, which could significantly harm our business.
|
| ● |
Our sales compensation plans or other incentives could be viewed negatively by some of our sales force, could fail to achieve desired long-term results and have a negative impact on revenue.
|
| ● |
Limits on the amount of sales compensation we pay could inhibit our ability to attract and retain our sales force, negatively impact our revenue and cause regulatory risks.
|
| ● |
We may be held responsible for certain taxes or assessments relating to the activities of our sales force, which could harm our financial condition and operating results.
|
Risks Associated with Our Operations in Mainland China
| ● |
Our operations in Mainland China are subject to significant government scrutiny, and we could be subject to fines or other penalties.
|
| ● |
If direct selling regulations in Mainland China are modified, interpreted or enforced in a manner that results in negative changes to our business model or the imposition of a range of potential penalties,
our business could be significantly negatively impacted.
|
| ● |
Our ability to expand our business in Mainland China could be negatively impacted if we are unable to obtain additional necessary national and local government approvals in Mainland China.
|
| ● |
If we are not able to register products for sale in Mainland China, our business could be harmed.
|
Risks Associated with Market Conditions and Competition
| ● |
Our markets are intensely competitive, and market conditions and the strengths of competitors may harm our business.
|
| ● |
Adverse publicity concerning our business, marketing plan, products or people could harm our business and reputation.
|
| ● |
Inability of products, platforms, business opportunities and other initiatives to gain or maintain sales force and market acceptance could harm our business.
|
| ● |
Product diversion may have a negative impact on our business.
|
Risks Associated with COVID-19
| ● |
Epidemics, including COVID-19, and other crises have and may continue to negatively impact our business.
|
International Risks
| ● |
Our ability to conduct business in international markets may be affected by political, legal, tax and regulatory risks.
|
| ● |
We are subject to financial risks as a result of our international operations, including exposure to foreign-currency fluctuations, currency controls and inflation in foreign markets, all of which could
impact our financial position and results of operations.
|
| ● |
Potential changes to tariff and import/export regulations, and ongoing trade disputes between the United States and other jurisdictions may have a negative effect on global economic conditions and our
business, financial results and financial condition.
|
Human Capital Risks
| ● |
If we are unable to retain our existing sales force and recruit additional people to join our sales force, our revenue may not increase and may even decline.
|
| ● |
We depend on our key personnel and Sales Leaders, and the loss of the services provided by any of our executive officers, other key employees or key Sales Leaders could harm our business and results of
operations.
|
Risks Associated with Our Manufacturing and Operations
| ● |
Production difficulties, quality control problems, inaccurate forecasting, shortages in ingredients, and reliance on our suppliers could harm our business.
|
| ● |
The loss of or a disruption in our manufacturing and distribution operations, or significant expenses or violations incurred by such operations, could adversely affect our business.
|
| ● |
Our business could be negatively impacted if we fail to execute our product launch process or ongoing product sales due to difficulty in forecasting or increased pressure on our supply chain, information
systems and management.
|
| ● |
If we are unable to effectively manage our growth in certain markets, our operations could be harmed.
|
| ● |
System failures, capacity constraints and other information technology difficulties could harm our business.
|
| ● |
Any acquired companies or future acquisitions may expose us to additional risks.
|
Product Legal and Regulatory Risks
| ● |
Regulations governing our products, including the formulation, registration, pre-approval, marketing and sale of our products, could harm our business.
|
| ● |
Government regulations and private party actions relating to the marketing and advertising of our products and services may restrict, inhibit or delay our ability to sell our products and harm our business.
|
| ● |
Our operations could be harmed if we fail to comply with Good Manufacturing Practices.
|
| ● |
If our current or any future device products are determined to be medical devices in a particular geographic market, or if our sales force uses these products for medical purposes or makes improper medical
claims, our ability to continue to market and distribute such devices could be harmed, and we could face legal or regulatory actions.
|
| ● |
We may incur product liability claims that could harm our business.
|
Legal, Regulatory and Compliance Risks
| ● |
We may become involved in legal proceedings and other matters that could adversely affect our operations or financial results.
|
| ● |
Non-compliance with anti-corruption laws could harm our business.
|
| ● |
A failure of our internal controls over financial reporting or our regulatory compliance efforts could harm our stock price and our financial and operating results or could result in fines or penalties.
|
Risks Associated with Taxes, Customs and Interest
| ● |
Government authorities may question our tax or customs positions or change their laws in a manner that could increase our effective tax rate or otherwise harm our business.
|
| ● |
We could be subject to changes in our tax rates, the adoption of new U.S. or international tax legislation or exposure to additional tax liabilities, which could have a material and adverse impact on our
operating results, cash flows and financial condition.
|
| ● |
Transition from LIBOR to an alternative benchmark interest rate could have an adverse effect on our overall financial position.
|
Intellectual Property Risks
| ● |
We may be subject to claims of infringement on the intellectual property rights or trade secrets of others, resulting in costly litigation.
|
| ● |
If we are unable to protect our intellectual property rights or our proprietary information and know-how, our ability to compete could be negatively impacted and the value of our products could be adversely
affected.
|
Data Security and Privacy Risks
| ● |
Cyber security risks and the failure to maintain the integrity of company, employee, sales force or guest data could expose us to data loss, litigation, liability and harm to our reputation.
|
Sustainability Risks
| ● |
Our business could be negatively impacted by corporate citizenship and sustainability matters.
|
Risks Related to Our Common Stock
| ● |
The market price of our Class A common stock is subject to significant fluctuations due to a number of factors that are beyond our control.
|
General Risk Factors
| ● |
Difficult economic conditions could harm our business.
|
Risk Factors
We face a number of substantial risks. Our business, financial condition or results of operations could be harmed by any of these risks. The trading price of our common stock could decline due to
any of these risks, which should be considered together with the other items in this Annual Report on Form 10-K, including Item 1. Business and Item 7. Management’s Discussion and Analysis of Financial Condition and Results of Operations.
Risks Associated with Direct Selling and Our Sales Force
Challenges to the form of our network marketing system could harm our business.
We may be subject to challenges by government regulators regarding the form of our network marketing system. Legal and regulatory requirements concerning the direct selling industry generally do not include “bright
line” rules and are inherently fact-based and subject to interpretation. As a result, regulators and courts have discretion in their application of these laws and regulations, and the enforcement or interpretation of these laws and regulations by
government agencies or courts can change.
Recent settlements between the U.S. Federal Trade Commission (“FTC”) and other direct selling companies and guidance from the FTC have addressed inappropriate earnings and lifestyle claims, problematic compensation
structures and the importance of focusing on consumers. These developments have created ambiguity as to the proper interpretation of the law and related court decisions. The FTC has been active in its enforcement activities, and any adverse rulings
or legal actions could impact our business if direct selling laws or anti-pyramid laws are interpreted more narrowly or in a manner that results in additional burdens or restrictions on direct selling companies. For example:
| ● |
In 2015, the FTC took aggressive actions against a multi-level marketing company, alleging an illegal business model and inappropriate earnings claims.
|
| ● |
In 2016, the FTC entered into a settlement with a multi-level marketing company, requiring the company to modify its business model, including basing sales compensation and qualification only on sales to retail and preferred customers
and on purchases by a distributor for personal consumption within allowable limits. Although this settlement does not represent judicial precedent or a new FTC rule, the FTC has indicated that the industry should look at this settlement,
and the principles underlying its specific measures, for guidance.
|
| ● |
In 2019, the FTC entered into a settlement with a multi-level marketing company, alleging an illegal business model and compensation structure and inappropriate earnings claims. The company agreed to a prohibition from engaging in
multi-level marketing. The FTC and another multi-level marketing company are currently in litigation, and that company had indicated the FTC was seeking to limit the levels of payment in its compensation structure as a condition to
settlement.
|
| ● |
During 2020 and 2021, the FTC issued letters that warned several direct-selling companies to remove and address claims that they or members of their sales force were making about their products’ ability to treat or prevent COVID-19
and/or about the earnings that people who have recently lost income could make.
|
| ● |
In 2021, the FTC sent a notice to more than 1,100 companies, including us and two of our subsidiaries (Pharmanex, LLC and Big Planet, Inc.), that outlined several practices that the FTC determined to be unfair or deceptive in prior
administrative cases. These practices relate to earnings claims, other money-making opportunity claims, and endorsements and testimonials. Pursuant to the FTC’s “penalty offense authority,” companies that received the notice are expected to
comply with the standards set in the prior administrative cases and could incur significant civil penalties if they or their representatives fail to do so. The penalties could be up to $43,792 per violation, and there is some ambiguity in
how a “violation” would be defined for these purposes.
|
Although we take steps to educate our Brand Affiliates on proper claims, if our Brand Affiliates make improper claims, or if regulators determine we are making any improper claims, this could lead to an FTC
investigation and could harm our business. In addition, if the requirements related to compensation structures in the actions listed above lead to new industry standards or new rules, or if they limit the levels in the network for which payments can
be made, our business could be impacted and we may need to amend our global sales compensation plan. With a majority of our revenue in the United States coming from sales to retail customers and preferred customers, we believe that we can demonstrate
consumer demand for our products, but we continue to monitor developments to assess whether we should make any changes to our business or global sales compensation plan. If we are required to make changes or if the FTC seeks to enforce similar
measures in the industry, either through rulemaking or an enforcement action against our company, our business could be harmed.
We could also be subject to challenges by private parties in civil actions. We are aware of civil actions against other direct-selling companies in the United States, that have, and may in the future, resulted in
significant settlements. Allegations directed at us and our competitors regarding the legality of multi-level marketing in various markets and adverse media reports have also created intense public scrutiny of us and our industry. Our business has
also been subject to formal and informal inquiries from various government regulatory authorities in the past regarding our business and our compliance with local laws and regulations. All of these actions and any future scrutiny of us or our
industry could generate negative publicity or further regulatory actions that could result in fines, restrict our ability to conduct our business in our various markets, enter into new markets, motivate our sales force and attract consumers.
Laws and regulations may prohibit or severely restrict direct selling and cause our revenue and profitability to decline, and regulators could adopt new regulations that harm our business.
Various government agencies throughout the world regulate direct sales practices. Laws and regulations in the United States, Japan, South Korea and Mainland China are particularly stringent and subject to broad
discretion in enforcement by regulators. These laws and regulations are generally intended to prevent fraudulent or deceptive schemes, often referred to as “pyramid schemes,” that compensate participants primarily for recruiting additional
participants without significant emphasis on product sales to consumers. The laws and regulations in our current markets often:
| ● |
impose requirements related to sign-up, order cancellations, product returns, inventory buy-backs and cooling-off periods for our sales force and consumers;
|
| ● |
require us, or our sales force, to register with government agencies;
|
| ● |
impose limits on the amount of sales compensation we can pay;
|
| ● |
impose reporting requirements; and
|
| ● |
require that our sales force is compensated for selling products and not for recruiting others.
|
Complying with these widely varying and sometimes inconsistent rules and regulations can be difficult, time-consuming and expensive, and requires significant resources. The laws and regulations governing direct selling
are modified from time to time, and like other direct selling companies, we are subject from time to time to government inquiries and investigations in our various markets related to our direct selling activities. This can require us to make changes
to our business model and aspects of our sales compensation plan in the markets impacted by such changes and investigations. During 2021, the U.S. Federal Trade Commission (“FTC”) announced that it is initiating a review of its Business Opportunity
Rule, which imposes certain obligations on business opportunity sellers in their dealings with prospective buyers. Currently, multi-level marketing companies are exempted from this rule. If this exemption is eliminated or if new regulations are
adopted for multi-level marketing companies, it could negatively impact the growth of our sales force and our revenue. In addition, markets where we currently do business could change their laws or regulations to prohibit direct selling. If we are
unable to obtain necessary licenses and certifications within required deadlines or continue business in existing markets or commence operations in new markets because of these laws, our revenue and profitability may decline. Any delay could
negatively impact our revenue.
Improper sales force actions could harm our business.
Sales force activities that violate applicable laws, regulations or policies, or that are alleged to do so, have, and could in the future, harmed our business and reputation and resulted in government or third-party
actions against us.
For example, in 2014, allegations were made by various media outlets that certain of our sales representatives in Mainland China failed to adequately follow and enforce our policies and regulations. This adverse
publicity, as well as a government review and actions that we voluntarily took to address the situation, resulted in a significant negative impact on our revenue and the number of Sales Leaders and Customers in the region. Similar or more extreme
actions by government agencies in Mainland China or other markets in the future could have a significant adverse impact on our business and results of operations.
The direct selling industry in Japan continues to experience regulatory and media scrutiny, and other direct selling companies have been suspended from sponsoring activities. Japan imposes strict requirements regarding
how Brand Affiliates approach prospective customers. From time to time, we receive information from consumer centers in certain prefectures about the number of general inquiries and complaints about us and our Brand Affiliates, and we also sometimes
receive warnings to reduce such complaints. Based on this information, we continually evaluate and enhance our Brand Affiliate compliance, education and training efforts in Japan. However, we cannot be certain that our efforts will successfully
prevent regulatory actions against us, including fines, suspensions or other sanctions, or that the company and the direct selling industry will not receive further negative media attention, all of which could harm our business.
Except in Mainland China, members of our sales force are not employees and act independently of us. The most significant area of risk for such activities relates to improper product claims and claims regarding the
business opportunity of joining our sales force. For example:
| ● |
During 2020 and 2021, the FTC issued letters that warned several direct-selling companies to remove and address claims that they or members of their sales force were making about their products’
ability to treat or prevent COVID-19 and/or about the earnings that people who have recently lost income could make.
|
| ● |
In 2021, the FTC sent a notice to more than 1,100 companies, including us and two of our subsidiaries (Pharmanex, LLC and Big Planet, Inc.), that outlined several practices that the FTC determined to be unfair or deceptive in prior
administrative cases. These practices relate to earnings claims, other money-making opportunity claims, and endorsements and testimonials. Pursuant to the FTC’s “penalty offense authority,” companies that received the notice are expected to comply with the standards set in the prior administrative cases and could incur significant civil penalties if they or their representatives fail to do so. The penalties could be up to
$43,792 per violation, and there is some ambiguity in how a “violation” would be defined for these purposes.
|
We implement strict policies and procedures to ensure our sales force complies with legal requirements. However, given the size of our sales force, we experience problems from time to time. For example, product claims
made by some of our sales force in 1990 and 1991 led to a FTC investigation that resulted in our entering into a consent agreement with the FTC and various agreements with state regulatory agencies. In addition, rulings by the South Korean Fair Trade
Commission and by judicial authorities against us and other companies in South Korea indicate that, if our sales force engages in criminal activity, we may be held liable or penalized for failure to supervise them adequately. Our sales force may
attempt to anticipate which markets we will open in the future and begin marketing and sponsoring activities in markets where we are not qualified to conduct business. We could face fines, suspensions or other legal action if our sales force violates
applicable laws and regulations, and our reputation and brand could be negatively impacted.
In addition, as our sales force increasingly uses social media to promote our business opportunity and products, this increases the burden on us to monitor compliance of such activities. It also increases the risk that
such social media content could contain problematic claims in violation of our policies and applicable regulations. For example, due to the borderless nature of social media, a claim that is allowed in one market may ultimately reach another market
where it is not allowed.
Social media platforms’ decisions to prohibit, block or decrease the prominence of our sales force’s content could harm our business.
Social media platforms have, and could in the future, decided to prohibit, block or decrease the prominence of our sales force’s content for any reason. For example, due to concerns with multi-level marketing, the
TikTok and WhatsApp Business platforms have updated their policies to prohibit content related to multi-level marketing. In addition, Pinterest and Facebook prohibit ads that promote multi-level marketing opportunities, and Pinterest has also imposed
restrictions on weight loss products, claims and photos. Our business is becoming increasingly dependent on social commerce. Additional social media platforms’ adoption of similar or stricter policies could significantly hamper our sales force’s
ability to promote our products and attract consumers, which could cause our revenue to decline. Our reputation could also be harmed if our sales force violates any social media platform’s policies.
If our business practices or policies or the actions of our sales force are deemed to be in violation of applicable local regulations regarding foreigners, then we could be
sanctioned and/or required to change our business model, which could significantly harm our business.
Our sales force is required to comply with work authorization and other local legal requirements prior to working in a market. Some markets, including Mainland China and Vietnam, also prohibit or restrict participation
of foreigners in direct selling activities. We have implemented policies that are designed to comply with these regulations and inform our sales force regarding the types of activities that are not permitted. However, we cannot assure that actions of
our sales force will not violate local laws or regulations or our policies. If our business practices or policies or the actions of our sales force are deemed to be in violation of applicable regulations as they may be interpreted or enforced, then
we could be sanctioned and/or required to change our business model, which could result in adverse publicity and significantly harm our business.
Our sales compensation plans or other incentives could be viewed negatively by some of our sales force, could fail to achieve desired long-term results and have a negative
impact on revenue.
Our sales compensation includes some components that differ from market to market. We modify components of our sales compensation from time to time to keep our sales compensation plans and business models competitive
and attractive to our existing sales force and people interested in joining our sales force, to address changing market dynamics, to provide incentives to our sales force that we believe will help grow our business, to conform to local regulations
and to address other business needs. Because of the size of our sales force and the complexity of our sales compensation plans, it is difficult to predict how such changes will be viewed by our sales force and whether such changes will achieve their
desired results. It also is difficult to predict how such changes may impact our ability to attract a larger potential target market of opportunity seekers. Certain changes we have made to our global sales compensation plan in the past, which were
successful in several markets, did not achieve anticipated results in certain other markets, were not viewed positively by some segments of our sales force, and negatively impacted our business. Similarly, we face the risk that we could fail to make
changes to our compensation plans that would be necessary to keep our compensation competitive with the market and allow us to attract new opportunity seekers or segments of opportunity seekers, which could have a negative impact on our sales force.
In addition, we have been required to modify our sales compensation plan in certain markets, including South Korea and Vietnam, from time to time to remain in compliance with applicable sales compensation limits.
Changes to reduce sales compensation have had a negative impact on the sales force in the past and could in the future.
We have announced that we will be making some changes to our compensation plan in the United States to limit the amount of volume from internal sales to our sales force that can be used in the calculation of their
compensation and performance measurements. To facilitate these changes, we are working to implement digital tools to allow our sales force to more easily document resales and also to encourage a shift in behavior through incentives and recognition.
To the extent these proposed changes are more difficult to implement and transition than anticipated, our sales force could be distracted or have their commission impacted, all of which could negatively impact our business.
Limits on the amount of sales compensation we pay could inhibit our ability to attract and retain our sales force, negatively impact our revenue and cause regulatory risks.
Several markets, including Mainland China, South Korea, Indonesia and Vietnam, impose limits on the amount of sales compensation we can pay to our sales force. For example, under regulations in Mainland China, direct
selling companies may pay independent direct sellers in Mainland China up to a maximum 30% of the revenue they generate through their own sales of products to consumers. Additionally, in South Korea, local regulations limit sales compensation to 35%
of our total value of goods or services supplied in South Korea. These regulations may limit the incentive for people to join our sales force and may reduce our ability to differentiate ourselves from our competitors in attracting and retaining our
sales force.
In addition, we have been required to modify our sales compensation plan in certain markets, including South Korea, from time to time to remain in compliance with applicable sales compensation limits. Because sales
compensation, as a percentage of revenue, can fluctuate as sales force productivity fluctuates, we may be required to make further changes to stay within applicable sales compensation limits or may be at risk of exceeding them. In addition, which
revenues and expenses are within the scope of these regulations is not always clear, and interpretation and enforcement of these laws are subject to change, which could require us to make further changes or result in non-compliance with these
regulations. Any failure to keep sales compensation within legal limits in Mainland China, South Korea, Indonesia, Vietnam or any other market that imposes a sales compensation limit could result in fines or other sanctions, including suspensions.
We may be held responsible for certain taxes or assessments relating to the activities of our sales force, which could harm our financial condition and operating results.
We are subject to the risk in some jurisdictions of being responsible for social security, withholding or other taxes with respect to payments to our sales force. This would occur if a jurisdiction classifies our sales
force as our employees rather than as independent contractors, or if a jurisdiction expands the categories of personnel to whom these tax obligations apply. Some jurisdictions have begun taking these positions with respect to the distributors of
direct selling companies, and they may continue to do so. For example, some jurisdictions have, without challenging the “independent contractor” status, taken the position that direct sellers must nonetheless pay certain taxes with respect to
payments to their sales force.
In addition, authorities in some jurisdictions have challenged the “independent contractor” status of distributors of some multi-level marketing companies. In the event that local laws and regulations, or the
interpretation of local laws and regulations, change to require us to treat members of our sales force as employees rather than independent contractors, or that our Brand Affiliates are deemed by local regulatory authorities in one or more of the
jurisdictions in which we operate to be our employees rather than independent contractors under existing laws and interpretations, we may be held responsible for a variety of obligations that are imposed upon employers relating to their employees,
including social security, withholding and related taxes, minimum wage laws, and any related assessments and penalties, which could harm our financial condition and operating results. This risk increases as our sales force increases its use of social
sharing, as several jurisdictions’ regulations protect in-person or in-home sales demonstrations from creating an employment relationship but are less protective of online demonstrations. If our Brand Affiliates were deemed to be employees rather
than independent contractors, we would also face the risk of increased liability for their actions.
Risks Associated with Our Operations in Mainland China
Our operations in Mainland China are subject to significant government scrutiny, and we could be subject to fines or other penalties.
Our operations in Mainland China are subject to significant regulatory scrutiny. The legal system in Mainland China provides government authorities broad latitude to conduct investigations, and many Chinese
regulations, including those governing our business, are subject to significant interpretation, which may vary from jurisdiction to jurisdiction. Because of significant government concerns in Mainland China regarding improper direct selling
activities, government regulators closely scrutinize activities of direct selling companies and activities that resemble direct selling. The government in Mainland China continues to inspect and review companies in the direct selling industry on a
regular basis, which has and may continue to increase regulatory scrutiny of the industry and our business.
The government’s scrutiny of activities within the health products and direct selling industries has been at higher levels since 2019, when the government conducted a 100-day campaign
to review and inspect the health products and direct selling industries following negative media coverage generated by the healthcare-related product claims made by another direct selling company in Mainland China. Since 2019, we have been receiving
and addressing an increased number of government reviews, inspections, and inquiries and consumer complaints in Mainland China; our ability to hold certain business meetings has been limited; and negative media coverage has spread to include
additional companies, including ours.
Government regulators frequently make inquiries into our business activities and investigate complaints from consumers and others regarding our business. Some of these inquiries and investigations in the past have
resulted in the payment of fines by us or members of our sales force, interruption of sales activities at stores and warnings. Any determination by government regulators in these inquiries or investigations that our operations or activities, or the
activities of our sales force, are not in compliance with applicable regulations could result in substantial fines, extended interruptions of business, and termination of necessary licenses and permits, including our direct selling and other
licenses, all of which could harm our business.
We train our sales force in Mainland China on how our Mainland China business model differs from our global business model. However, Sales Leaders in Mainland China may attend regional and global events or interact
with Sales Leaders from other markets. Although our global model and Mainland China business model differ, mistakes may be made as to how those working in Mainland China should promote the business in Mainland China. These mistakes by our sales
force, or allegations of such mistakes, have, and may in the future, led to government reviews and investigations of our operations in Mainland China, as well as adverse publicity, reputational harm and adjustments or interruptions to our operations,
all of which has and could in the future have a significant negative impact on our revenue and the number of Sales Leaders and Customers in the region.
If direct selling regulations in Mainland China are modified, interpreted or enforced in a manner that results in negative changes to our business model or the imposition of a
range of potential penalties, our business could be significantly negatively impacted.
The government of Mainland China has adopted direct selling and anti-pyramiding regulations that impose significant restrictions and limitations on businesses in our industry. Most notably, the regulations prohibit
multi-level compensation, which is the basis of how we compensate our sales force outside of Mainland China. The regulations also prohibit overseas personnel from participating in direct selling in Mainland China. We have structured our business
model in Mainland China based on several factors: the guidance we have received from government officials, our interpretation of applicable regulations, our understanding of the practices of other international direct selling companies operating in
Mainland China, and our understanding as to how regulators are interpreting and enforcing the regulations. In Mainland China, we utilize sales employees to sell products through our retail stores and website; independent
direct sellers, who can sell away from our stores where we have a direct selling license and a service center and can also sell through our website; and independent marketers, who are licensed business owners authorized to sell our products
at their own approved premises or through our stores and website. We generally compensate our Sales Leaders at a level that is competitive with other direct selling companies in the market and comparable to the compensation of our Sales Leaders
globally.
Other than our direct selling subsidiary, we also have a separate subsidiary in Mainland China that is a registered independent entity that engages in
cross-border e-commerce, through which we can sell a limited selection of products to consumers for their personal consumption. Cross-border e-commerce is not a permitted sales channel for direct selling in Mainland China. Members of our sales
force can contract with this entity, promote products on its behalf and receive compensation. Through this entity, we sell our ageLOC Meta
product, which is not currently registered in Mainland China and, therefore, can only be sold to consumers for their personal consumption. Although we take measures (1) to maintain legal separation between our cross-border e-commerce entity and our
direct selling entity; and (2) to ensure the products sold on our cross-border e-commerce platform are for consumers’ personal consumption only, our business in Mainland China could be negatively impacted if regulatory authorities elect to
attribute these cross-border e-commerce sales activities and related product claims, or the accompanying actions of our sales force, to our direct selling business, and make a determination they are in violation of direct selling or other
applicable laws.
The nature of the political, regulatory and legal systems in Mainland China gives regulatory agencies at both the local and central levels of government broad discretion to interpret and enforce regulations as they
deem appropriate to promote social stability. We face a risk that regulators may change the way in which they currently interpret and enforce the direct selling regulations, or that such regulations may be modified. If our business practices are
deemed to be in violation of applicable regulations as they may be interpreted or enforced, in particular our use of the sales productivity of a Sales Leader him/herself and of the sales force that such Sales Leader trains, collaborates with,
supports and services in setting his/her salary or service fee and determining their position/title on a quarterly basis, then we could be sanctioned, required to change our business model, and/or have our direct selling license revoked, any of which
could significantly harm our business.
In January 2019, the Mainland China government announced a 100-day campaign to review and inspect the health products and direct selling industries. This campaign involved a number of regulatory agencies. Although the
100-day period has ended, there has continued to be a heightened level of regulatory scrutiny of these industries and of our business and products. For example, government authorities have not been issuing new licenses for direct selling since the
beginning of the 100-day action in early 2019. There is also uncertainty whether any changes to the regulations that apply to these industries will be made based on the review. If changes are made to any of the regulations that apply to our business
model, products or operations, our business could be harmed.
Our ability to expand our business in Mainland China could be negatively impacted if we are unable to obtain additional necessary national and local government approvals in
Mainland China.
To expand our direct selling model into additional provinces in Mainland China, we currently must obtain a series of approvals from district, city, provincial and national government agencies with respect to each
province in which we wish to expand. Government authorities have not been issuing new licenses since the beginning of the 100-day action in early 2019. When the process for obtaining government approvals to conduct direct selling is operational, it
often evolves and is lengthy, as we are required to work with a large number of provincial, city, district and national government authorities. The complexity of the approval process as well as the government’s continued cautious approach as direct
selling develops in Mainland China makes it difficult to predict the timeline for obtaining these approvals. Furthermore, any media or regulatory scrutiny of our business in Mainland China could increase the time and difficulty we may face in
obtaining additional licenses. If media or regulatory scrutiny of our business in Mainland China results in significant delays in obtaining licenses elsewhere in Mainland China, or if the current processes for obtaining approvals are delayed further
for any reason or are changed or interpreted differently than currently understood, our ability to receive direct selling licenses in Mainland China and our growth prospects in this market could be negatively impacted.
If we are not able to register products for sale in Mainland China, our business could be harmed.
We face lengthy timelines with respect to product registrations in Mainland China. The process for obtaining product permits and licenses may require extended periods of time that may prevent us from launching new
product initiatives in Mainland China on the same timelines as other markets around the world. For example, products marketed in Mainland China as “health foods” are subject to extensive laboratory and clinical analysis by government authorities, and
with a few exceptions, the product registration process in Mainland China takes a minimum of two years and may be substantially longer. If the recent media and government scrutiny of the healthcare industry results in more burdensome regulations
related to product registration, we may have more difficulty getting new wellness products registered for sale in Mainland China. We market both “health foods” and “general foods” in Mainland China. There is some risk associated with the common
practice in Mainland China of marketing a product as a “general food” while seeking “health food” classification. If government officials feel the categorization of our products is inconsistent with product claims, form of delivery, ingredients or
function, we could be prohibited or limited in marketing such products in Mainland China in their current form.
As we expand our direct selling channel, we face additional product marketing restrictions compared to our retail store channel. Under applicable direct selling regulations in Mainland China, we can only register
products for direct selling if we manufacture them and if they fall within categories that are authorized for direct selling, such as cosmetics, cleaning supplies, health foods, healthcare devices, small kitchen utensils and household appliances.
Products that are not categorized as direct selling products and products that are manufactured by third parties are prohibited from being marketed or sold through our direct sales channel, and the process for
registering products for the direct sales channel in Mainland China is subject to delays. If we cannot successfully manufacture our own direct selling products, we will not be able to sell these products through the direct sales channel.
Any marketing or sale of non-direct selling products by our independent direct sellers could result in negative publicity, fines and other government sanctions being imposed against us, including if a product is initially classified as a direct
selling product but is later re-classified.
Risks Associated with Market Conditions and Competition
Our markets are intensely competitive, and market conditions and the strengths of competitors may harm our business.
The markets for our products are intensely competitive. The success of our products is dependent on our ability to anticipate and respond to market trends and changes in consumer preferences and to maintain a product
offering and pipeline that is relevant and priced accessibly to consumers. Many competitors have much greater name recognition and financial resources than we have, which may give them a competitive advantage. For example, our Nu Skin products
compete directly with branded, premium retail products and with the products of other direct selling companies. Because of regulatory restrictions concerning claims about the efficacy of beauty and wellness products, we may have difficulty
differentiating our products from our competitors’ products, and competing products entering the beauty and wellness market could harm our revenue. In addition, our business may be negatively impacted if we fail to adequately adapt to trends in
consumer behavior and technologies to meet consumers’ needs and demands and reach a wider audience.
We also compete with other direct selling companies and gig economy companies to attract and retain our sales force and consumers. Some of these competitors have longer
operating histories and greater visibility, name recognition and financial resources than we do. Some of our competitors have also adopted and could continue to adopt some of our successful business strategies, including our global sales compensation plan. Consequently, to successfully compete in this industry, and attract and retain our sales force and consumers, we must ensure that our business
opportunities and sales compensation plans are financially rewarding and innovative. Although we believe we have significant competitive advantages, we cannot assure that we will be able to continue to
successfully compete in this industry.
Adverse publicity concerning our business, marketing plan, products or people could harm our business and reputation.
Growth in our sales force and consumers and our results of operations can be particularly impacted by adverse publicity. Given the nature of our operations, lack of clarity on applicable legal requirements and
standards, and our continuous need to recruit and retain consumers and members of our sales force, we are particularly vulnerable to adverse publicity. Specifically, we are susceptible to adverse publicity concerning:
| ● |
suspicions about the legality and ethics of network marketing;
|
| ● |
media or regulatory scrutiny regarding our business and our business models, including in Mainland China;
|
| ● |
the safety or effectiveness of our or our competitors’ products or the ingredients in such products;
|
| ● |
inquiries, investigations, fines, legal actions, or mandatory or voluntary product recalls involving us, our competitors, our business models or our respective products;
|
| ● |
the actions of our current or former sales force and employees, including any allegations that our sales force or employees have overstated or made false product claims or earnings representations, or engaged
in unethical or illegal activity;
|
| ● |
misperceptions about the types and magnitude of economic benefits offered at different levels of sales engagement in our business; and
|
| ● |
public, governmental or media perceptions of the direct selling, beauty product, or wellness product industries generally.
|
These issues have previously resulted in negative publicity and have harmed our business.
Critics of our industry, consumer protection groups, short sellers and other individuals have in the past and may in the future utilize the internet, the press and other means to publish criticisms of the industry, our
company and our competitors, or make allegations regarding our business and operations, or the business and operations of our competitors. In some cases, such adverse publicity or allegations can lead to government and regulatory scrutiny. We
continue to see adverse publicity regarding our company and the direct selling and healthcare products industries. We or others in our industry may receive similar negative publicity or allegations in the future, and it may harm our business and
reputation. Furthermore, the availability of social media channels can increase the likelihood of negative publicity because these channels are an easily accessible public forum. For example, if a member of our sales force makes an improper claim
about our products or business opportunity on social media, or if a critic of our company posts negative information about our company on social media, it is more likely to be disseminated widely and potentially noticed by the media or regulators.
Inability of products, platforms, business opportunities and other initiatives to gain or maintain sales force and market acceptance could harm our business.
Our ability to improve our financial performance depends on our ability to proactively anticipate, gauge and react in a timely and effective manner to changes in consumer spending
patterns and preferences regarding products, platforms and business opportunities. Our operating results could be adversely affected if our products, platforms, business opportunities and other initiatives do not generate sufficient
enthusiasm and economic benefit to retain our existing consumers and sales force or to attract new consumers and sales force members. Potential factors affecting the attractiveness of our products, platforms, business opportunities and other
initiatives include, among other things, shifting consumer demands, perceived product quality and value, product exclusivity or effectiveness, demographic trends, the strength of our brand and public image, sustainability factors, DEI initiatives,
economic success in our business opportunity, the quality and accuracy of the data we use in running our business, our technology infrastructure and capabilities, restrictions in social or digital media for sharing products and attracting consumers,
adverse media attention or regulatory restrictions on claims. If we are unable to anticipate changes in consumer preferences and trends, our business, financial condition and operating results could be materially
adversely affected. Likewise, if we are unable to anticipate changes in the gig and sharing economies and adapt our business opportunity accordingly, our ability to capture growth trends in the social commerce marketplace could be materially
adversely affected.
In addition, our ability to develop and introduce new products could be impacted by, among other things, government regulations, changing policies in social media and other communications platforms, the inability to
attract and retain qualified staff, the termination of third-party research and collaborative arrangements, intellectual property of competitors that may limit our ability to offer innovative products or that challenge our own intellectual property,
problems related to manufacturing or quality control, and difficulties in anticipating changes in consumer tastes and buying preferences. Our operating results could be adversely impacted if our products fail to gain or maintain sales force and
market acceptance or if our successful new products undercut the sales of our other products.
To adapt our business to current macroeconomic trends, we are currently working
through a significant digital transformation in our business to achieve widespread adoption of social commerce in all of our markets. This transformation involves the development of new and enhanced digital tools for our Sales Leaders and
consumers, including new digital apps and an improved website design and functionality, as well as new products, including connected devices. Our digital transformation will require significant expenditures over the next several years. We
also face the risk that we will ultimately be unable to develop these items, that their development will be more costly than anticipated, or that the tools and products we develop will not meet the expectations of our sales force and/or consumers.
Any of these eventualities could have a material negative impact on our business, sales force, consumer development and revenue.
In addition, in our more mature markets, one of the challenges we face is keeping Sales Leaders with established businesses and high-income levels motivated and actively engaged in business building activities and in
developing new Sales Leaders. We may also face challenges retaining our sales force as the population of our markets transitions to a younger, millennial/Gen Z demographic, with its associated new and different dynamics of connection through social
media platforms, gratification and loyalty behaviors, particularly as this segment becomes a greater share of our revenue. Moreover, if sales through social sharing do not generate repeat purchases or subscriptions at the same rate as other sales,
this could create revenue volatility. Many in the younger demographic are particularly savvy with social sharing across multiple business opportunity platforms. There can be no assurance that our initiatives will generate lasting excitement and
engagement among our sales force in the long term or that planned initiatives will be successful in maintaining sales force activity and productivity or in
motivating Sales Leaders to remain engaged in business building and developing new Sales Leaders. Some initiatives may have unanticipated negative impacts on our sales force, particularly changes to our sales compensation plans. The introduction of a new product or key initiative can also negatively impact other product lines to the extent our Sales Leaders focus their efforts on the new product or initiative.
In addition, if any of our products fails to gain acceptance, we could see an increase in product returns.
Product diversion may have a negative impact on our business.
We see our products being sold through online marketplace sites and other distribution channels in certain markets. Although we continually take steps to control product diversion, including products sold in Mainland
China, this activity continues to be a challenge, and we believe that changes to our global sales compensation plan or increased use of online channels for conducting sales transactions have and may continue to lead to increased product diversion.
Product diversion causes confusion regarding our distribution channels and negatively impacts the ability of our sales force to sell our products. It also creates a negative impression regarding the
viability of the business opportunity for our sales force, which can harm our ability to recruit new people to join our sales force. Product diversion may also
cause brand erosion and negatively impact the brand value perception. Product diversion schemes may also involve illegal importation, investment or other activities and harm our brand if gray market or counterfeit goods are passed off as our own. If
we are unable to effectively address this issue or if diversion increases, our business could be harmed.
Risks Associated with COVID-19
Epidemics, including COVID-19, and other crises have and may continue to negatively impact our business.
Due to the person-to-person nature of direct selling, our results of operations have been, and will likely continue to be, harmed if the fear of a communicable and rapidly spreading disease or other crises such as
natural disasters result in travel restrictions or cause people to avoid group meetings or gatherings or interaction with other people. It is difficult to predict the impact on our business, if any, of the emergence of new epidemics or other crises.
The outbreak of COVID-19 in 2020 and ensuing pandemic resulted in significant contraction of economies around the world and interrupted global supply chains as many governments issued stay-at-home orders to combat COVID-19. Government-imposed
restrictions and public hesitance regarding in-person gatherings, travel and visiting public places have reduced our sales force’s ability to hold sales meetings, resulted in cancellations of key sales leader events and incentive trips, and required
us to temporarily close our walk-in and fulfillment locations in some markets where we have such properties. The outbreak has also impacted our ability to obtain some ingredients and packaging as well as ship products in some markets. Our supply
chain and logistics have incurred some interruptions and cost impacts to date, and we could experience more significant interruptions and cost impacts or face more significant closures in the future, whether due to COVID-19 directly, workforce
(including the workforce of our supply chain) resistance to vaccination requirements, or other related factors. These factors and other events related to COVID-19 have negatively impacted our sales and operations and will likely continue to
negatively affect our business and our financial results. Although some of the negative impacts of COVID-19 have recently improved, this situation continues to be fluid and there is uncertainty regarding its duration and future impacts. For example,
COVID-19 variants have caused some of the pandemic’s negative impacts to worsen or return. In addition, the productivity of our sales force has been, and could continue to be, negatively impacted as restrictions are lifted and our sales force is able
to more freely travel and take vacations.
Any significant decline in our operating results in the future could also adversely affect our financial position and liquidity. Under the terms of our existing credit facility, we are required to maintain certain
interest coverage and leverage ratios. In addition, our outstanding borrowings under our credit facility and related term loan impose debt service and amortization requirements. A significant deterioration in our results of operations in the future
as a result of the COVID-19 pandemic could impact our ability to comply with our financial covenants and debt service and amortization obligations, which could result in an event of default under the terms of our credit facility. An event of default
under our credit facility could result in an inability to access funding under the agreement and the acceleration of our obligations, which would have a material adverse effect on our financial condition and liquidity.
In addition, regulatory authorities closely scrutinize the product- and earnings-related claims made by direct-selling companies and their sales force, including claims related to the COVID-19 pandemic. For example,
during 2020 and 2021, the FTC issued letters that warned several direct-selling companies to remove and address claims that they or members of their sales force were making about their products’ ability to treat or prevent COVID-19 and/or about the
earnings that people who have recently lost income could make. Although we take steps to educate our Brand Affiliates on proper claims, if our Brand Affiliates make improper claims, or if regulators determine we are making any improper claims, this
could lead to an FTC investigation and could harm our business and reputation.
International Risks
Our ability to conduct business in international markets may be affected by political, legal, tax and regulatory risks.
Our ability to capitalize on growth in new international markets and to maintain the current level of operations in our existing international markets is exposed to risks associated with our
international operations, including:
| ● |
the possibility that a government might ban or severely restrict our sales compensation and business models;
|
| ● |
the possibility that local civil unrest, political instability, or changes in diplomatic or trade relationships might disrupt our operations in one or more markets;
|
| ● |
the lack of well-established or reliable legal systems in certain areas where we operate;
|
| ● |
the presence of high inflation in the economies of international markets in which we operate;
|
| ● |
the possibility that a government authority might impose legal, tax, customs, or other financial burdens on us or our sales force, due, for example, to the structure of our operations in various markets;
|
| ● |
the possibility that a government authority might challenge the status of our sales force as independent contractors or impose employment or social taxes on our sales force; and
|
| ● |
the possibility that governments may impose currency remittance restrictions limiting our ability to repatriate cash.
|
There has been an increasing level of tension in U.S.-China relations over the last few years. Given the significant size of our China business, our business could be harmed if relations continue
to deteriorate or additional sanctions or restrictions are imposed by either government. In addition, there have been adverse public reaction and media attention to statements made by representatives of other businesses related to these issues that
have adversely affected business. We could similarly face adverse public or media attention, and potentially increased regulatory scrutiny, as a result of increased trade or political tensions or any statements or actions by employees or our sales
force that generate publicity with respect to these issues.
We are subject to financial risks as a result of our international operations, including exposure to foreign-currency fluctuations, currency controls and inflation in foreign
markets, all of which could impact our financial position and results of operations.
In 2021, approximately 80% of our sales occurred in markets outside of the United States in each market’s respective local currency. Foreign-currency fluctuations affect our
financial position and results of operations. We purchase inventory primarily in the United States in U.S. dollars. In preparing our financial statements, we translate revenue and expenses in our markets outside the United States from their local
currencies into U.S. dollars using weighted-average exchange rates. If the U.S. dollar strengthens relative to local currencies, our reported revenue, gross profit and net income will likely be reduced. Foreign-currency fluctuations also cause losses
and gains resulting from translation of foreign-currency-denominated balances on our balance sheet.
We also face the risk of currency controls. If foreign governments restrict transfers of cash out of their country and control exchange rates, we may be limited as to the timing and amount of cash we can repatriate and
may not be able to repatriate cash at beneficial exchange rates, which could have a material adverse effect on our financial position, results of operations or cash flows. We typically fund the cash requirements of our operations in the United States
through intercompany dividends, intercompany loans and intercompany charges for products, use of intangible property, and corporate services. However, some markets impose government-approval or other requirements for the repatriation of dividends.
For example, in Mainland China, we are unable to repatriate cash from current operations in the form of dividends until we file the necessary statutory financial statements for the relevant period. We also have experienced delays in repatriating cash
from Argentina. As of December 31, 2021, we had $50.3 million in cash denominated in Chinese RMB, and our intercompany receivable with our Argentina subsidiary was $11.3 million.
In addition, high levels of inflation and currency devaluations in any of our markets could negatively impact our balance sheet and results of operations. Gains and losses resulting from the remeasurement of non-U.S.
dollar monetary assets and liabilities of our subsidiaries operating in highly inflationary economies are recorded in our net earnings. For example, during 2018, Argentina was designated as a highly inflationary economy under U.S. generally accepted
accounting principles; accordingly, beginning with the third quarter of 2018, we began to apply highly inflationary accounting for our Argentina operations, which has resulted in additional foreign-currency charges. Other markets may be designated as
highly inflationary economies in the future, which could result in further foreign-currency charges.
Although we may engage in transactions intended to reduce our exposure to foreign-currency fluctuations, there can be no assurance that these transactions will be effective. Complex global political and economic
dynamics can affect exchange rate fluctuations. For example, the implementation of tariffs, border taxes or other measures related to the level of trade between the United States and other markets could impact the value of the U.S. dollar. It is
difficult to predict future fluctuations and the effect these fluctuations may have upon future reported results or our overall financial condition.
Potential changes to tariff and import/export regulations, and ongoing trade disputes between the United States and other jurisdictions may have a negative effect on global
economic conditions and our business, financial results and financial condition.
The United States and other foreign jurisdictions may change customs regulations or tariff rates that are applied to our imports or exports at any time. Tariff changes are difficult to predict and may cause us material
short-term or long-term cost fluctuations. We rely on the use of Free Trade Agreements that may experience alterations, suspensions or cancellations, which could increase our customs expense or otherwise harm our business. In addition to tariffs, any
actions taken by the United States or by foreign countries to further implement trade policy changes, including limiting foreign investment or trade, increasing regulatory scrutiny, or other actions that impact our ability to obtain necessary
licenses or approvals could negatively impact our business. These actions are unpredictable, and any of them could also have a material adverse effect on global economic conditions and the stability of global financial markets, significantly reduce
global trade, restrict our access to suppliers or customers, and have a material adverse effect on our business, financial condition and results of operations.
Human Capital Risks
If we are unable to retain our existing sales force and recruit additional people to join our sales force, our revenue may not increase and may even decline.
Our products are primarily marketed by our sales force, and we depend on them to generate virtually all of our revenue. Our sales force may terminate their services at any time, and like most direct selling companies,
we experience high turnover among our sales force from year to year. People who join our company to purchase our products for personal consumption or for short-term income goals frequently only stay with us for a short time. Sales Leaders who have
committed time and effort to build a sales organization will generally stay for longer periods. To increase our revenue, we must increase the number of and/or the productivity of our sales force. We must also expand our outreach and outbound efforts
to attract, connect and nurture new customers for a wider consumer base who purchase product and whom we can foster along a consumer journey to promote retention and higher lifetime value.
We have experienced periodic fluctuations in both Sales Leaders and Customers in the past and could experience such fluctuations again in the future. For example, our Sales Leaders in Mainland China declined 46% from
December 31, 2018 to December 31, 2019 due to such factors as meeting restrictions and negative media scrutiny. Our ability to retain our Sales Leaders and Customers could be affected as our sales force makes increased use of social sharing channels,
which may allow them to more easily engage their consumers and sales network in other opportunities. If our initiatives do not drive growth in both Sales Leaders and Customers, our operating results could be harmed. While we take many steps to help
train, motivate and retain our sales force, we cannot accurately predict how the number and productivity of our sales force may fluctuate because we rely primarily upon our Sales Leaders to find new consumers and to find, train and develop new Sales
Leaders. Our operating results could be harmed if we and our Sales Leaders do not generate sufficient interest in our business and its products to retain and motivate our existing sales force and attract new people to join our sales force.
The number and productivity of our sales force is negatively impacted by several additional factors, including:
| ● |
any adverse publicity or negative public perception regarding us, our products or ingredients, our distribution channel, or our industry or competitors;
|
| ● |
lack of interest in, dissatisfaction with, or the technical failure of, existing or new products;
|
| ● |
lack of compelling products or income opportunities, including through our sales compensation plans and incentive trips and other offerings;
|
| ● |
negative sales force reaction to changes in our sales compensation plans or to our failure to make changes that would be necessary to keep our compensation competitive with the market;
|
| ● |
interactions with our company, including our actions to enforce our policies and procedures and the quality of our customer service;
|
| ● |
any regulatory actions or charges against us or others in our industry, as well as regulatory changes that impact product formulations and sales viability;
|
| ● |
general economic, business and public health conditions, including employment levels, employment trends such as the gig and sharing economies, and pandemics or other conditions that curtail person-to-person
interactions;
|
| ● |
changes in the policies of social media platforms used to prospect or recruit potential consumers and sales force participants;
|
| ● |
recruiting efforts of our competitors and changes in consumer-loyalty trends; and
|
| ● |
potential saturation or maturity levels in a given market, which could negatively impact our ability to attract and retain our sales force in such market.
|
We depend on our key personnel and Sales Leaders, and the loss of the services provided by any of our executive officers, other key employees or key Sales Leaders could harm
our business and results of operations.
Our success depends to a significant degree upon the continued contributions of our senior and regional management, many of whom would be difficult to replace. Our senior and regional management employees may
voluntarily terminate their employment with us at any time, and it is not uncommon for employees of direct-selling companies, including employees of our company, to terminate their employment and begin working for another direct-selling company. In
addition, we need to continue to attract and develop qualified management personnel to sustain growth in our markets. Attracting and retaining qualified personnel has been an increased challenge during the current competitive employment environment.
If we are not able to successfully retain existing personnel and identify, hire and integrate new personnel, our business and growth prospects could be harmed.
The success of our business also depends on our key Sales Leaders. As of December 31, 2021, we had a global network of 1,367,559 Customers. Approximately 61,515 of our Customers were
Sales Leaders. As of December 31, 2021, approximately 456 Sales Leaders occupied the highest levels under our global sales compensation plan, and in Mainland China we have approximately 184 key Sales Leaders who play a significant role in managing,
training and servicing our sales force in that market and driving sales. We rely on these Sales Leaders (or other sales force members that they train, collaborate with, support and service) for a substantial majority of our revenue. As a
result, the loss of a high-level or key Sales Leader or a group of leading Sales Leaders, whether by their own choice or through disciplinary actions by us for violations of our policies and procedures, could negatively impact our growth and our
revenue.
Risks Associated with Our Manufacturing and Operations
Production difficulties, quality control problems, inaccurate forecasting, shortages in ingredients, and reliance on our suppliers could harm our business.
Production difficulties, quality control problems, inaccurate forecasting and our reliance on third-party suppliers to manufacture and deliver products that meet our specifications in a timely manner could harm our
business. Occasionally, we have experienced production difficulties with respect to our products, including the availability of labor, raw materials, components, packaging and products that do not meet our specifications and quality control
standards. These production difficulties and quality problems have in the past, and could in the future, result in stock outages or shortages in our markets with respect to such products, harm our sales, or create inventory write-downs for unusable
products.
In addition, we and our supply chain acquire ingredients, components, products and packaging from third-party suppliers and manufacturers. A loss of any of these suppliers and any difficulties in finding or
transitioning to alternative suppliers could harm our business. In addition, we obtain some of our products and ingredients from sole suppliers that own or control the product formulations, ingredients or other intellectual property rights associated
with such products. We also license the right to distribute some of our products from third parties. In the event we are unable to maintain or renew our contracts with any of these suppliers, manufacturers or other third parties, we may need to
discontinue some products or develop substitute products, which could harm our revenue. In addition, if we experience supply shortages, price increases or regulatory impediments with respect to the raw materials, ingredients, components or packaging
we use for our products, we may need to seek alternative supplies or suppliers and may experience difficulties in finding replacements that are comparable in quality and price. For example, some of our wellness products, including g3 juice, ReishiMax, ageLOC Meta and ageLOC Youth (Youthspan
or Y-Span in some markets), incorporate unique natural ingredients that are only harvested once per year and/or may have limited global supplies. If demand exceeds forecasts, we may have difficulties in
obtaining additional supplies to meet the excess demand until the next growing season. If we are unable to successfully respond to such issues, our business could be harmed.
The loss of or a disruption in our manufacturing, supply chain and distribution operations, or significant expenses or violations incurred by such operations, could adversely
affect our business.
As a company engaged in manufacturing, distribution, and research and development on a global scale, we are subject to the risks inherent in such activities, including industrial accidents, climate or environmental
events, fires, floods, earthquakes, labor shortages, strikes and other labor or industrial disputes, disruptions in logistics or information systems, loss or impairment of key manufacturing or distribution sites, import and export restrictions or
delays, product quality control, safety, licensing requirements and other regulatory or government issues, as well as natural disasters, pandemics, border disputes, global uncertainties, acts of terrorism and other external or macroeconomic factors
over which we have no control. These risks may be heightened if we consolidate certain of our manufacturing, distribution or supply facilities or if we are unable to successfully enhance our disaster recovery planning. These risks also increase as we
pursue our current strategy of acquiring manufacturing companies and thereby conducting more of our manufacturing in-house. The loss of, or disruption or damage to, any of our facilities or centers or those of our third-party manufacturers could have
a material adverse effect on our business, reputation, results of operations and financial condition.
We have experienced, and may continue to experience, disruptions to the transportation channels used in our supply chain and distribution operations, including increased airport and shipping port congestion, a lack of
transportation capacity, increased fuel expenses, import or export controls or delays, and labor disputes or shortages. Disruptions in our container shipments may result in increased costs, including the additional use of air freight to meet demand.
Congestion to ports can affect previously negotiated contracts with shipping companies, resulting in unexpected increases in shipping costs and reduction in our profitability. For example, the COVID-19 pandemic has resulted in several disruptions and
delays, as well as quantity limits and price increases, in our global transportation channels.
In addition, our manufacturing facilities are subject to numerous regulations, including labor regulations and environmental regulations that govern the storage, discharge, handling, emission, generation, manufacture,
use and disposal of chemicals and other materials. We will also likely become subject to new regulations in these areas, which could require substantial expenditures. Violations of existing or new requirements could result in financial penalties and
other enforcement actions and could require us to halt one or more portions of our operations until a violation is cured. The costs of curing incidents of non-compliance, resolving enforcement actions or private-party actions that might be initiated
against us, or of satisfying new legal requirements could have a material adverse effect on our business, financial condition, or results of operations.
Our business could be negatively impacted if we fail to execute our product launch process or ongoing product sales due to difficulty in forecasting or increased pressure on
our supply chain, information systems and management.
Prior to making a key product generally available for purchase, we typically do one or more introductory offerings of the product, such as a preview of the product to our Sales Leaders or other product introduction or
promotion. These offerings sometimes generate significant activity and a high level of purchasing, which results in a higher-than-normal increase in revenue during the quarter and skew year-over-year and sequential comparisons. These offerings may
also increase our product return rate. We have, and may in the future, experienced difficulty effectively managing growth associated with these offerings and may face
increased risk of improper sales force activities and related government scrutiny.
In addition, the size and condensed schedule of these product offerings increase pressure on our supply chain and order processing systems. We have, and may in the future, failed to appropriately
scale our system capacity and operations in response to unanticipated changes in demand for our existing products or to the demand for new products, which reduces our sales force’s confidence in our business and could harm our reputation and
profitability.
As our sales force increases its use of social platforms to interact with customers, our business results could be adversely affected if our implementation of new platforms and processes to support
our sales force is delayed. In addition, we are dependent on third parties for testing and delivery of portions of these and other of our information system platforms. Unanticipated changes or system failures by third parties could harm our ability
to meet the expectations of our sales force, thus resulting in harm to our revenue, reputation and sales force confidence in our systems.
If we do not accurately forecast sales levels in each market for product launches or ongoing product sales, obtain sufficient ingredients, components or packaging, or produce a sufficient supply to
meet demand, we may incur higher expedited shipping costs and we may temporarily run out of stock of certain products, which could negatively impact the enthusiasm of our sales force and consumers. Conversely, if demand does not meet our expectations
for a product launch or ongoing product sales or if we change our planned launch strategies or initiatives, we could incur inventory write-downs. Each of these issues has impacted us in the past, and they could again occur with our ongoing product
launches. If we fail to effectively forecast product demand in the product launch process or for ongoing product sales, our reputation and profitability could be negatively impacted.
If we are unable to effectively manage our growth in certain markets, our operations could be harmed.
At times, we can experience significant growth in one or more of our markets. For example, during 2020 we experienced significant growth in some of the markets in our Americas and EMEA segments.
Growth can strain our ability to effectively manage our operations, as it requires us to expand our management team, labor force, technology bandwidth and capabilities, and manufacturing operations. Insufficient management execution to support
growth could result in, among other things, product delays or shortages, decreases in product quality, service level challenges, operating mistakes and errors, inadequate customer service, inappropriate claims or promotions by our sales force, and
governmental inquires and investigations, all of which could harm our revenue and ability to generate sustained growth and result in unanticipated expenses. In addition, we need to continue to attract and develop qualified management personnel to
sustain growth. If we are not able to successfully retain existing personnel and identify, hire and integrate new personnel, our business and growth prospects could be harmed.
System failures, capacity constraints and other information technology difficulties could harm our business.
With global operations and a complex sales compensation plan, our business is highly dependent on efficiently functioning information technology systems, including websites, mobile applications, cloud providers, data
centers, databases, networks and other systems. We rely on these systems for accepting and processing sales orders, operating our sales force and customer support operations, tracking and compensating our sales force, conducting our corporate and
regional operations, preparing our financial statements, and other aspects of our business. Accordingly, the performance, reliability and availability of our systems are critical to our business, reputation, financial reporting, and ability to
attract and retain our sales force and customers.
Our systems may be damaged or disrupted by fires, floods, earthquakes or other natural disasters, human error, telecommunications failures, power loss, physical or electronic break-ins, computer viruses, cyber attacks,
changes in our information technology systems or organization, and other events. We have, and may in the future, experienced system failures and outages. We cannot guarantee that the preventive measures we take, including redundancies, security
protocols, network protection mechanisms and other procedures currently in place, or that may be in place in the future, will be adequate to prevent or remedy system failure or interruption, data loss, security breaches or other data security
incidents. Furthermore, any mitigation process could take several days or more, thus resulting in a loss of revenue, loss of confidence of our sales force and harm to our reputation.
In addition, we make significant expenditures on our information technology infrastructure and other technology initiatives, and these items could become obsolete or impaired, which has and may in the future cause us
to incur significant expenses to address. For example, in 2018, following an evaluation of our information technology infrastructure and organization and our social sharing and digital initiatives, we determined to alter our strategic direction with
respect to some of our systems and tools, resulting in impairment charges of approximately $49 million. We also incurred approximately $22 million in severance payments and other expenses related to the reorganization of our Information Technology
Department and other corporate and regional offices. Additional cash outlay and new personnel were also necessary for execution of new plans and strategy. In this strategic shift in direction, we continue to identify and re-architect additional
legacy systems to help mitigate the risk and exposure these systems introduce to our business. We also continue to allocate resources to new technology and digital initiatives. There can be no assurance that we will be able to build and roll-out our
new technology and digital tools on a global scale or that they will function as intended, and these initiatives may entail significant expenses and could cause disruptions in our business.
Our systems could also be strained by growth in our business. Although we work to expand and enhance our ecommerce features, network infrastructure and other technologies to accommodate increases in the volume of
traffic to our ecommerce channels, we may be unsuccessful in these efforts. Our failure, or our suppliers’ failure, to achieve or maintain system capacity could significantly reduce our ability to fulfill orders and could harm our business,
reputation, revenue and financial condition.
Any acquired companies or future acquisitions may expose us to additional risks.
We have acquired certain businesses, and we plan to continue to do so in the future as we encounter acquisition prospects that would complement our current product offerings, increase the size and geographic scope of
our operations or otherwise offer growth and operating efficiency opportunities. At any particular time, we may be in various stages of assessment, discussion and/or negotiation with regard to one or more potential acquisitions or investments, not
all of which will be consummated. Acquisitions involve numerous risks and uncertainties and may be of businesses in which we lack operational or market experience. The financing for any of these acquisitions could dilute the interests of our
stockholders, result in an increase in our indebtedness or both. Our past acquisitions have, and future acquisitions could, entailed numerous risks, including:
| ● |
difficulties in integrating acquired operations or products;
|
| ● |
the difficulties of imposing financial and operating controls on the acquired companies and their management and the potential costs of doing so;
|
| ● |
the potential loss of key employees, customers, suppliers or distributors from acquired businesses and disruption to our direct selling channel;
|
| ● |
diversion of management’s attention from our core business;
|
| ● |
the failure to achieve the strategic objectives of these acquisitions;
|
| ● |
increased fixed costs;
|
| ● |
the failure of the acquired businesses to achieve the results we have projected in either the near or long term;
|
| ● |
the assumption of unexpected liabilities, including litigation risks;
|
| ● |
adverse effects on existing business relationships with our suppliers, sales force or consumers; and
|
| ● |
risks associated with entering markets or industries in which we have limited or no prior experience, including limited expertise in running the business, developing the technology, and selling and servicing
the products.
|
Our failure to successfully complete the integration of any acquired business, or a failure to adjust our fixed costs quickly enough or sufficiently to adapt to rapidly changing market conditions, could have a material
adverse effect on our business, financial condition and operating results. In addition, there can be no assurance that we will be able to identify suitable acquisition candidates, consummate acquisitions on favorable terms or realize the anticipated
benefits of an acquisition. It is also possible that our acquired companies could sell products or utilize a business model similar to that of our Nu Skin business, which could be viewed negatively by our sales force and result in a reduction in our
revenue.
Product Legal and Regulatory Risks
Regulations governing our products, including the formulation, registration, pre-approval, marketing and sale of our products, could harm our business.
Our products are subject to extensive government regulation by numerous federal, state and local government agencies and authorities. Many of these laws and regulations involve a high level of subjectivity, are subject
to interpretation, and vary significantly from market to market. These laws and regulations can, and often do, have several impacts on our business, including but not limited to:
| ● |
delays, or altogether prohibitions, in introducing or selling a product or ingredient in one or more markets;
|
| ● |
delays and expenses associated with the registration and approval process for a product;
|
| ● |
limitations on our ability to import products into a market;
|
| ● |
delays and expenses associated with compliance, such as record keeping, documentation of the properties of certain products, labeling, and scientific substantiation;
|
| ● |
limitations on the claims we can make regarding our products; and
|
| ● |
product reformulations, or the recall or discontinuation of certain products that cannot be reformulated to comply with new regulations.
|
We have observed a general increase in regulatory activity and activism in the United States and across many markets globally where we operate, and the regulatory landscape is becoming more complex with increasingly
strict requirements. In particular, the requirements are impacting the ingredients we can include in our products, the accepted quantities of those ingredients and the quality and characterization of the ingredients. Global regulators have in recent
years become overall more restrictive on the accepted levels of active ingredients that we can use in our product, in some cases banning them outright. They have also become more restrictive on permitted contaminant levels in ingredients and, in many
cases, have forced complete removal of such contaminants. In certain cases, such as regarding some pesticides which are virtually ubiquitous in nature, it has proven difficult to comply with the requirements. Further, many of the restrictions
regarding ingredient quality are not directly applicable to our products, leaving the possibility that our interpretation of compliance may not match that of the enforcing authorities. Often there is a lack of an equivalent active ingredient present
in the marketplace. In other cases, the removal or reduction of a technical ingredient, such as various types of parabens, leads to a significant change to the character of the product that may make it no longer desirable or safe to the consumer. If
this trend in new regulations continues, we may find it necessary to alter some of the ways we have traditionally marketed our products in order to stay in compliance with a changing regulatory landscape and this could add to the costs of our
operations and/or have an adverse impact on our business.
Many laws and regulations govern the registration, pre-market approval or other aspects of regulatory oversight of our products. For example, in the United States, some legislators and industry critics have pushed for
years to increase regulatory authority by the FDA over nutritional supplements. In 2011, the FDA proposed draft guidance to clarify the FDA’s interpretation of the dietary ingredient notification requirements, and in 2016, the FDA issued a revised
draft guidance that superseded the 2011 version. This draft guidance is not yet final but appears to indicate that the FDA is expanding its definition of what is considered a “new dietary ingredient” in the United States. The industry has worked with
the FDA for several years, providing comments to the FDA to modify this guidance. While still in flux, if enacted in final form as proposed, this guidance could impose new and significant regulatory barriers for our nutritional supplement products or
unique ingredients, which could delay or inhibit our ability to formulate, introduce and sell nutritional supplements as we have in the past. We face similar pressures in our other markets, which continue to set restrictions on ingredients and their
acceptable maximum levels, as well as on ingredient characterization, quality and levels. In Europe, for example, we are unable to market supplements that contain ingredients that were not marketed in Europe prior to May 1997 (“novel foods”) without
going through an extensive registration and pre-market approval process.
The FDA currently does not have a pre-market approval system for cosmetics. However, cosmetic products may become subject to more extensive regulation in the future. These events could interrupt the marketing and sale
of our products, severely damage our brand reputation and image in the marketplace, increase the cost of our products, cause us to fail to meet customer expectations or cause us to be unable to deliver merchandise in sufficient quantities or of
sufficient quality to our stores, any of which could result in lost sales.
Our operations could be harmed if new laws or regulations are enacted that restrict our ability to market or distribute our products or impose additional burdens or requirements on us in order to continue selling our
products. In addition, the adoption of new regulations or changes in the interpretations and enforcement of existing regulations may result in significant compliance costs or discontinuation of product sales and may impair the marketability of our
products, resulting in significant loss of net sales. We cannot predict the nature of any future laws, regulations, interpretations, or applications, nor can we determine what effect additional governmental regulations or administrative orders, when
and if promulgated, would have on our business. If new or existing laws and regulations restrict, inhibit or delay our ability to introduce or market our products or limit the claims we are able to make regarding our products, this could have a
material adverse effect on our business, financial condition, and operating results. If we fail to comply with the laws and regulations governing our products, we could face enforcement action, and we could be fined or forced to alter or stop selling
our products.
Government regulations and private party actions relating to the marketing and advertising of our products and services may restrict, inhibit or delay our ability to sell our
products and harm our business.
Government authorities regulate advertising and product claims regarding the efficacy and benefits of our products. These regulatory authorities typically require adequate and reliable scientific substantiation to
support any marketing claims. What constitutes such reliable scientific substantiation can vary widely from market to market and there is no assurance that the research and development efforts that we undertake to support our claims will be deemed
adequate for any particular product or claim. If we are unable to show adequate and reliable scientific substantiation for our product claims, or if our marketing materials or the marketing materials of our sales
force make claims that exceed the scope of allowed claims for dietary supplements, cosmetics or devices that we offer, the United States Food and Drug Administration (the “FDA”) or other regulatory authorities could take enforcement action
requiring us to revise our marketing materials, amend our claims or stop selling certain products, which could harm our business.
For example, in recent years, the FDA has issued warning letters to many cosmetic companies alleging improper structure/function claims regarding their cosmetic products, including, for example, product claims
regarding gene activity, cellular rejuvenation, and rebuilding collagen. There is a degree of subjectivity in determining whether a claim is an improper structure/function claim. Given this subjectivity and our research and development focus on the
sources of aging and the influence of certain ingredients on gene expression, there is a risk that we could receive a warning letter, be required to modify our product claims or take other actions to satisfy the FDA if the FDA determines any of our
marketing materials include improper structure/function claims for our cosmetic products. In addition, plaintiffs’ lawyers have filed class action lawsuits against some of our competitors after our competitors received these FDA warning letters.
There can be no assurance that we will not be subject to government actions or class action lawsuits, which could harm our business.
In the United States, the FTC’s Guides Concerning the Use of Endorsements and Testimonials in Advertising (“Guides”) require disclosure of material connections between an endorser and the company they are endorsing,
and they generally do not allow marketing using atypical results. Our sales force has historically used testimonials and “before and after” photos to market and sell some of our popular products such as our ageLOC Spa systems and ageLOC Transformation anti-aging skin care system. We intend to continue to use testimonials for our popular products,
including weight management products and beauty products. In highly regulated and scrutinized product categories such as weight management, if we or our sales force fails to comply with the Guides
or makes improper product claims, the FTC could bring an enforcement action against us and we could be fined and/or forced to alter our marketing materials.
Our operations could be harmed if we fail to comply with Good Manufacturing Practices.
Across our markets, there are regulations on a diverse range of Good Manufacturing Practices that apply to us and to our vendors covering product categories such as dietary supplements, cosmetics, foods,
over-the-counter drugs and medical devices. The Good Manufacturing Practices impose stringent requirements on a variety of topics, including vendor qualifications, ingredient identification, manufacturing controls and record keeping. Ingredient
identification requirements, which often require us to confirm the levels, identity and potency of ingredients listed on our product labels within a narrow range, are particularly burdensome and difficult for us because our products contain many
different ingredients. Additionally, certain Good Manufacturing Practices obligate us to track and periodically report adverse events to government agencies. Compliance with these increasing regulations may further increase the cost of manufacturing
certain of our products as we work with our vendors to assure they are qualified and in compliance. In addition, our operations could be harmed if regulatory authorities determine that we or our vendors are not in compliance with these regulations or
if public reporting of adverse events harms our reputation for quality and safety. A finding of noncompliance may result in administrative warnings, penalties or actions impacting our ability to continue selling certain products, including public
withdrawals, seizures and recalls. For example, in prior years, we have had product recalls in the United States based on labeling issues. Problems associated with product recalls could be exacerbated due to the
global nature of our business because a recall in one jurisdiction could lead to recalls in other jurisdictions. In addition, these risks associated with noncompliance could increase as we acquire businesses, including the businesses in our Rhyz
strategic investment arm and any businesses we may acquire in the future.
If our current or any future device products are determined to be medical devices in a particular geographic market, or if our sales force uses these products for medical
purposes or makes improper medical claims, our ability to continue to market and distribute such devices could be harmed, and we could face legal or regulatory actions.
One of our strategies is to market unique and innovative products that allow our sales force to distinguish our products, including our ageLOC Spa systems,
Pharmanex BioPhotonic Scanner, ageLOC LumiSpa and ageLOC Boost. Any determination by
regulatory authorities in our markets that these products or any future devices must receive clearance or be registered as medical devices could restrict our ability to import or sell the product in such market until registration is obtained. While
we have not been required to register our ageLOC Spa systems, Pharmanex BioPhotonic Scanner, ageLOC LumiSpa or ageLOC Boost as medical devices in most of our markets, we have registered our ageLOC Spa systems as a medical device in Indonesia, Thailand, Peru and Colombia. In
addition, we have received clearance from the United States Food and Drug Administration to market our facial spa for over-the-counter use. We have registered ageLOC Boost as a medical device in Thailand, and
we intend to do so in the United States as well. There have been legislative proposals in the Philippines relating to the regulation of medical devices that could affect the way we market our ageLOC Spa
systems, Pharmanex BioPhotonic Scanner, ageLOC LumiSpa and ageLOC Boost in this market. In addition, if our sales force
attempts to import or export products from one market to another in violation of our policy, makes medical claims regarding our products or uses our products to perform medical diagnoses or other activities limited to licensed professionals or
approved medical devices (in markets where the product is not approved), it could negatively impact our ability to market or sell these products and subject us to legal or regulatory actions.
Where necessary, obtaining medical device registrations and clearances could require us to provide documentation concerning product manufacturing and clinical utility, to make design,
specification and manufacturing process modifications to meet standards imposed on medical device companies, and to modify our marketing claims regarding the registered product. While we successfully obtained clearance to market our facial spa for
over-the-counter use in the United States, and registered our ageLOC Spa systems as a medical device in Indonesia, Thailand, Peru and Colombia, because medical device regulations vary widely from market to
market, there can be no assurance we will not face challenges or delays in obtaining clearance in other markets, or that we will be able to make any required modifications or provide documentation necessary to obtain clearance. If we obtain such
medical device clearance in order to sell a product in one market, such clearance may be used as precedent for requiring similar approval for the product in another market, or for similar products in the same market. These additional requirements
could increase the cost associated with manufacturing and selling these products as non-medical devices in such markets.
We may incur product liability claims that could harm our business.
We sell a variety of different products for human consumption and use, including cosmetics, dietary supplements, conventional foods, OTC drugs and devices. Our cosmetics and conventional foods, as well as some of our
dietary supplements, are not generally subject to pre-market approval or registration processes so we cannot rely upon a government safety panel to qualify or approve our products for use, and some ingredients may not have long histories of human
consumption or use. We rely upon published and unpublished safety information including clinical studies on ingredients used in our products and conduct our own clinical and safety studies on some key ingredients and products, but not all products. A
product may be safe for the general population when consumed or used as directed but could cause an adverse reaction for some individuals, such as a person who has a health condition or allergies or who is taking a prescription medication. While we
include what we believe are adequate instructions and warnings and we have historically had low numbers of reported reactions, previously unknown adverse reactions could occur. If we discover that our products are causing adverse reactions, or if we
determine that any of our employees have not properly handled reports of adverse reactions, we could suffer further adverse publicity or government sanctions.
As a result of the type of products that we sell, we may be subject to various product liability claims, including that the products fail to meet quality or manufacturing specifications, contain contaminants, include
inadequate instructions as to their proper use, include inadequate warnings concerning side effects and interactions with other substances or for persons with health conditions or allergies, or cause adverse reactions or side effects. Consumer
protection laws and regulations governing our business continue to expand, and in some states such as California, class-action lawsuits based on increasingly novel theories of liability are expanding. Product liability claims could increase our
costs, cause negative publicity, and adversely affect our business and financial results. As we continue to offer an increasing number of new products through large product offerings our product liability risk may increase.
If our sales force or employees provide improper or inappropriate advice regarding our products, their use or safety, we may be subject to additional product liability.
We have generally elected to self-insure our product liability risks. We continue to periodically evaluate whether we can and should obtain product liability insurance. Based upon our current approach to product
liability risk management, if any of our products are found to cause any injury or damage or we become subject to product liability claims, we will be subject to the full amount of liability associated with any injuries or damages. This liability
could be substantial and may exceed our existing reserves and harm our business.
Legal, Regulatory and Compliance Risks
We may become involved in legal proceedings and other matters that could adversely affect our operations or financial results.
We have been, and regularly are, a party to litigation, government inquiries or investigations, audits or other legal matters. These legal proceedings may include, among other things, claims alleging violation of the
federal securities laws or state corporate laws, or claims related to employment matters, intellectual property, fair-competition/anti-trust laws, our products, business opportunity or advertising, or other matters. Claims may be brought by a
regulator, investor, member of our sales force, consumer, employee or other private parties and in some cases may be brought as class action lawsuits. For example, in 2014, we were named as a defendant in a purported class action complaint relating
to negative media and regulatory scrutiny of our business in Mainland China and as a nominal defendant in a shareholder derivative suit relating to the same issues. Also, beginning in 2014, we were in discussions with the Securities and Exchange
Commission (“SEC”), which discussions were focused on a charitable donation we made in Mainland China in 2013 and issues related thereto. In April 2015, the SEC informed us that it was initiating a non-public, formal investigation into these issues.
We also have been involved in two separate disputes with customs authorities in Japan with respect to customs assessments on several of our products. Although we settled the purported class action, shareholder derivative action and SEC investigation
during 2016 and the Japan courts reached final decisions on the customs disputes in 2013 and 2018, these matters were, and any future matters that we may become involved in may be, expensive and time consuming.
Our increased activity during the past several years with acquisitions, divestments and other investment-related activities introduces an additional area of litigation risk, and we have had litigation and threats of
litigation related to these matters. Other parties in the transactions or potential transactions, or other parties involved in the businesses themselves, could bring claims against us. For example, we are currently
in litigation with Don Roberts, a dairy farmer who claims he is a general partner in our indoor-growing business and related businesses. Mr. Roberts also seeks damages exceeding $250 million. Although we believe Mr. Roberts’s claims are without
merit and we intend to continue to vigorously defend ourselves, there can be no assurance that the resolution of this or other cases will be favorable to us.
In general, litigation claims, regulatory actions or other legal matters are expensive and time consuming and can result in settlements, adverse rulings or damages that could significantly affect financial results and
the conduct of our business. It is not possible to predict the final resolution of any legal proceeding to which we may become party, and the impact of these matters on our business, results of operations and financial condition could be material.
Non-compliance with anti-corruption laws could harm our business.
Our international operations are subject to various anti-corruption laws, including principally the U.S. Foreign Corrupt Practices Act (the “FCPA”). The FCPA and the anti-corruption laws of other jurisdictions where we
operate generally prohibit companies and their agents or intermediaries from making improper payments for the purpose of obtaining or retaining business, and they require companies to maintain accurate books and records and internal accounting
controls. We dedicate time and resources to internal investigations of any allegation that we are not or may not be in compliance with anti-corruption laws. Additionally, such allegations, even if untrue, may result in a government investigation,
particularly given the trend in recent years of increased anti-corruption law enforcement activity and regulatory investigative actions by regulators in numerous jurisdictions, including the U.S. Department of Justice and the SEC. Our corporate
policies require all employees to comply with the FCPA and other applicable anti-corruption laws, including the FCPA’s books-and-records and internal-accounting-controls requirements. Any regulatory determination, however, that our operations or
activities are not in compliance with existing anti-corruption laws or regulations could result in the imposition of substantial fines and other penalties from U.S. or other regulatory entities.
In 2016, we reached a resolution with the SEC to pay $765,688 to settle the SEC’s allegations that our books and records and internal controls related to a charitable contribution in Mainland China in 2013 were
insufficient. In agreeing to this settlement, we neither admitted nor denied the SEC’s findings. Although we have implemented additional anti-corruption policies, controls and training globally to prevent similar situations from arising in the
future, we cannot be certain that these efforts will be effective or prevent future fines or penalties under the FCPA or other anti-corruption laws. Our competitors operating in Mainland China have also faced similar allegations from U.S. regulators
and been fined accordingly in some circumstances. For example, in 2020, one of our competitors entered into a large settlement with U.S. regulators related to allegations that its employees violated the FCPA in Mainland China.
Additionally, we cannot predict the nature, scope or effect of future regulatory requirements to which our international operations might be subject or the manner in which existing or new laws might be administered or
interpreted. Alleged or actual violations of any such existing or future laws (either due to our own acts or our inadvertence, or due to the acts or inadvertence of others) may result in criminal or civil sanctions or reputational harm, which could
have a material adverse effect on our business, financial condition and results of operations.
A failure of our internal controls over financial reporting or our regulatory compliance efforts could harm our stock price and our financial and operating results or could
result in fines or penalties.
We have implemented internal controls to help ensure the completeness and accuracy of our financial reporting and to detect and prevent fraudulent actions within our financial and accounting processes. We have also
implemented compliance policies and programs to help ensure that our employees and sales force comply with applicable laws and regulations. Our internal audit team regularly audits our internal controls and
various aspects of our business and compliance program, and we regularly assess the effectiveness of our internal controls. There can be no assurance, however, that our internal or external assessments and audits will identify all fraud,
misstatements in our financial reporting, and significant deficiencies or material weaknesses in our internal controls. Material weaknesses have in the past, and may in the future, resulted in a material misstatement of our financial results,
requiring us to restate our financial statements.
From time to time, we initiate further investigations into our business operations to further bolster our regulatory compliance efforts or based on the results of our internal and external audits or on complaints,
questions or allegations made by employees or other parties regarding our business practices and operations. In addition, our business and operations may be investigated by applicable government authorities. In the event any of these investigations
identify material violations of applicable laws by our employees, sales force or affiliates, we could be subject to adverse publicity, fines, penalties or loss of licenses or permits.
Risks Associated with Taxes, Customs and Interest
Government authorities may question our tax or customs positions or change their laws in a manner that could increase our effective tax rate or otherwise harm our business.
As a U.S. company doing business globally, we are subject to applicable tax and customs laws, including those relating to intercompany pricing regulations and transactions between our corporate entities in the
jurisdictions in which we do business. Periodically, we are audited by tax and customs authorities around the world. If authorities challenge our tax or customs positions, including those regarding transfer pricing, customs valuation and
classification, value added taxes (VAT), withholding taxes, payroll taxes, and other applicable taxes, we may be subject to penalties, interest and payment of back taxes or customs duties. The tax and customs laws in each jurisdiction change from
time to time and are further subject to interpretation by the local government agencies. Despite our best efforts to be aware of and comply with tax and customs laws, including changes to and interpretations thereof, there is a potential risk that
the local authorities may argue that we are out of compliance. Such situations may require that we defend our positions and/or adjust our operating procedures in response to such changes. We are currently subject to ongoing audits that are at various
levels of review, assessment, or appeal in different markets involving issues of transfer pricing, income taxes, VAT, withholding taxes, payroll taxes, and other taxes. In some circumstances, additional taxes, interest and penalties have been
assessed. We have reserved in our consolidated financial statements an amount that we believe represents the most likely outcome of the resolution of these audits, but if we are incorrect in our assessment, we may have to pay additional amounts,
which could potentially be material. Ultimate resolution of these ongoing audits may take several years, and the outcome is uncertain. Any or all of these potential risks may increase our effective tax rate, increase our overall tax or customs
expense or otherwise harm our business.
We could be subject to changes in our tax rates, the adoption of new U.S. or international tax legislation or exposure to additional tax liabilities, which could have a
material and adverse impact on our operating results, cash flows and financial condition.
We are subject to taxes in the United States and numerous foreign jurisdictions, where our subsidiaries are organized. Tax laws, regulations, administrative practices and interpretations in various jurisdictions may be
subject to change, with or without notice, due to economic, political and other conditions. As a result, significant judgment is required in evaluating and estimating our provision for income taxes. Our future effective tax rates could be affected by
numerous factors, such as intercompany transactions, changes in our business operations, acquisitions and dispositions, entry into new markets, the amount of our earnings and where earned, losses incurred in jurisdictions, the inability to realize
tax benefits, changes in foreign currency exchange rates, changes in our stock price, uncertain tax positions, allocation and apportionment of state taxes, changes in our deferred tax assets and liabilities and their valuation. In addition, U.S. and
foreign governments may enact tax laws or enter into tax treaties that could result in further changes to global taxation and may materially affect our operating results and financial condition.
We are currently subject to tax controversies in various jurisdictions, and these jurisdictions may assess additional income tax liabilities against us. Developments in an audit, investigation or other tax controversy
could have a material effect on our operating results, cash flows or financial condition in the period or periods for which that development occurs, as well as for prior and subsequent periods. We regularly assess the likelihood of an adverse outcome
resulting from these proceedings to determine the adequacy of our tax accruals. Although we believe our estimates for the tax accruals are reasonable, the outcome of audits, investigations and any other tax controversies could be materially different
from our tax accruals, which could materially impact our financial results.
Transition from LIBOR to an alternative benchmark interest rate could have an adverse effect on our overall financial position.
Our indebtedness levels and the required payments on such indebtedness may be impacted by expected reforms related to LIBOR. The variable interest rates payable under our credit facility are linked to LIBOR as the
benchmark for establishing such rates. Recent national, international and other regulatory guidance and reform proposals regarding LIBOR are expected to ultimately cause LIBOR to be discontinued or become unavailable as a benchmark rate. Although our
credit facility includes mechanics to facilitate the adoption by us and our lenders of an alternative benchmark rate for use in place of LIBOR, no assurance can be made that such alternative rate will perform in a manner similar to LIBOR and may
result in interest rates that are higher or lower than those that would have resulted had LIBOR remained in effect. In addition, as previously disclosed, we currently plan to refinance our credit facility during 2022. There can be no assurance that
credit will be available on favorable terms, including a favorable interest rate, which could negatively impact our liquidity and ability to fund our business initiatives.
Intellectual Property Risks
We may be subject to claims of infringement on the intellectual property rights or trade secrets of others, resulting in costly litigation.
In recent years, there has been significant litigation in the United States involving patents and other intellectual property rights. In particular, there has been an increase in the filing of suits alleging
infringement of intellectual property rights, which pressure defendants into entering into settlement arrangements quickly to dispose of such suits, regardless of their merit. Other companies or individuals may allege that we, or our sales force, consumers, licensees or other parties indemnified by us, infringe on their intellectual property rights. Even if we believe that such claims are without merit, defending such intellectual property
litigation can be costly, distract management’s attention and resources, and the outcome is inherently uncertain. Claims of intellectual property infringement also might require us to redesign affected products, enter into costly settlement or
license agreements, pay costly damage awards, or face a temporary or permanent injunction prohibiting us from marketing or selling certain of our products. Any of these results may adversely affect our financial condition.
We employ individuals who were previously employed at other beauty or wellness product companies, including our competitors or potential competitors. To the extent that our employees are involved in research areas that
are similar to those in which they were involved with their former employers, we may be subject to claims that such employees have inadvertently or otherwise used or disclosed the alleged trade secrets or other proprietary information of the former
employers. Litigation may be necessary to defend against such claims.
If we are unable to protect our intellectual property rights or our proprietary information and know-how, our ability to compete could be negatively impacted and the value of
our products could be adversely affected.
The market for our products depends to a significant extent upon the value associated with our product innovations and our brand equity. We rely upon patent, copyright, trademark and trade secret laws in the United
States and other markets, and non-disclosure, confidentiality and other types of agreements with our employees, sales force, customers, suppliers and other parties, to establish, maintain and enforce our
intellectual property rights. Despite these measures, any of our intellectual property rights could be challenged, invalidated, circumvented or misappropriated, or such intellectual property rights may not be sufficient to permit us to provide
competitive advantages, which could result in costly product redesign efforts, discontinuance of certain product offerings or other competitive harm. In addition, the laws of certain foreign markets where we have significant business, including
markets such as Mainland China, do not protect our intellectual property rights to the same extent as the laws of the United States.
The costs required to protect our patents and trademarks may be substantial or even not practical. We have filed patent and trademark applications globally to protect our intellectual property rights in our new
technologies; however, there can be no assurance that our patent and trademark applications will be approved and issue, that any patents and trademarks issued will adequately protect our intellectual property, or that such patents and trademarks will
not be challenged by third parties or found by a judicial authority to be invalid or unenforceable. Moreover, many of our products rely on technologies developed or licensed by third parties, and we may not be able to obtain or continue to obtain
licenses and technologies from these third parties on reasonable terms or at all.
From time to time, we become aware of potential violations of our intellectual property rights. For example, we are aware of some products that may infringe on our intellectual property related to the ageLOC LumiSpa device. To enforce and protect our intellectual property rights, we may initiate litigation against third parties, such as patent, copyright and trademark infringement suits or interference
proceedings and seek indemnification by contract or otherwise. Any lawsuits that we initiate could be expensive, take significant time and divert management’s attention from other business concerns, and we may ultimately fail to prevail or recover on
any indemnification claim. Litigation also puts our patents and trademarks at risk of being invalidated or interpreted narrowly and our patent and trademark applications at risk of not issuing. Additionally, we may provoke third parties to assert
claims against us. We may not prevail in any lawsuits that we initiate and the damages or other remedies awarded, if any, may not be commercially valuable. The occurrence of any of these events may adversely affect our financial condition or diminish
our investments in this area.
In addition to patented technology, we rely on our unpatented proprietary technology, trade secrets, processes and know-how. We generally seek to protect this information by confidentiality, non-disclosure and
assignment of invention agreements with our employees, consultants, scientific advisors and third parties. Our employees may leave to work for competitors. Our sales force members may seek other opportunities. These agreements may be breached, and we
may not have adequate remedies for any such breach. In addition, our trade secrets may be disclosed to or otherwise become known or be independently developed by competitors. To the extent that our current or former employees, sales force,
consultants or contractors use intellectual property owned by others in their work for us, disputes may arise as to the rights in related or resulting know-how and inventions. If, for any of the above reasons, our intellectual property is disclosed
or misappropriated, it would harm our ability to protect our rights and adversely affect our financial condition.
Data Security and Privacy Risks
Cyber security risks and the failure to maintain the integrity of company, employee, sales force or guest data could expose us to data loss, litigation, liability and harm to
our reputation.
We collect, store and transmit large volumes of company, employee, sales force and guest data, including payment card information, personally identifiable information and other personal
information, for business purposes, including for transactional and promotional purposes, and our various information technology systems enter, process, summarize and report such data. The connected devices that we are developing and plan to
introduce will also collect consumer data. The integrity and protection of this data is critical to our business.
We are subject to significant security and privacy regulations, as well as requirements imposed by the payment card industry. For example, during 2018, the General Data Protection Regulation went
into effect in the European Union, imposing increased data protection regulations, the violation of which could result in fines of up to 4% of our annual consolidated revenue. Many other jurisdictions have similarly enacted security and privacy
regulations, including California and Mainland China, and we believe this trend will continue. In the United States, congressional committees have held preliminary hearings about the advisability of a federal data privacy law, but it is uncertain
whether the federal government will adopt such a law and whether it would preempt state data privacy laws. The prospect of new data privacy laws and ambiguity regarding the interpretation of existing laws has resulted in significant uncertainty and
compliance costs. In addition to laws specifically governing privacy and data security, in some cases, federal and state regulators and state attorneys general and administrative agencies have interpreted more general consumer protection laws to
impose standards for the online collection, use, dissemination and security of data. Although we monitor regulatory developments in this area, any actual or perceived failure by us to comply with these requirements could subject us to significant
penalties, lawsuits and negative publicity and require changes to our business practices. In particular, maintaining compliance with these and other evolving regulations and requirements around the world often requires changes to our information
system architecture and data storage processes. Making these changes is, and will likely continue to be, difficult and expensive. Investigations by the regulators of data security laws could also result in the payment of fines and harm our
reputation. Private actions by affected individuals could also result in significant monetary or reputational damage.
Similarly, a failure to adhere to the payment card industry’s data security standards could cause us to incur penalties from payment card associations, termination of our ability to accept credit
or debit card payments, litigation and adverse publicity, any of which could have a material adverse effect on our business and financial condition.
In addition, a penetrated or compromised data system or the intentional, inadvertent or negligent release, misuse or disclosure of data could result in theft, loss, or fraudulent or unlawful use of
company, employee, sales force or guest data. Although we take measures to protect the security, integrity and confidentiality of our data systems, we experience cyber attacks of varying degrees and types on a regular basis. Our infrastructure may be
vulnerable to these attacks, and in some cases it could take time to discover them. Our security measures may also be breached due to employee error or malfeasance, system errors or otherwise. This risk is heightened as a result of the current
COVID-19 pandemic as many of our employees are working remotely. Additionally, outside parties may attempt to fraudulently induce employees, users, or customers to disclose sensitive information to gain access to our data or our users’ or customers’
data. Any such breach or unauthorized access could result in the unauthorized disclosure, misuse or loss of sensitive information and lead to significant legal and financial exposure, regulatory inquiries or investigations, loss of confidence by our
sales force and customers, disruption of our operations, damage to our reputation, and costs associated with remediating the incident. These risks are heightened as we work with third-party providers, including providers of mobile and cloud
technologies, and as our sales force uses social media, as the providers and social media platforms could be vulnerable to the same types of breaches and other risks. Acquisition activity, which we have engaged in and which we may continue to engage
in, may also heighten these risks, as the systems of the companies we acquire are not under our control prior to the acquisitions and it may take time to evaluate these systems and implement appropriate modifications to them.
Sustainability Risks
Our business could be negatively impacted by corporate citizenship and sustainability matters.
There are increased and increasing expectations and focus from certain investors, Brand Affiliates, consumers, employees, regulators and other stakeholders concerning corporate citizenship and sustainability matters, including environmental,
social and governance matters; packaging; responsible sourcing; and diversity, equity and inclusion matters. From time to time, we announce certain initiatives and goals in these areas. We could fail, or be perceived to fail, in our achievement of
such initiatives or goals or in meeting stakeholders’ expectations, or we could fail in accurately reporting our progress on such initiatives, goals and expectations. Moreover, the standards by which corporate citizenship and sustainability efforts
and related matters are measured are developing and evolving, and certain areas are subject to assumptions. The standards or assumptions could change over time. In addition, we could be criticized for the scope of our initiatives or goals or
perceived as not acting responsibly in connection with these matters, such as with our carbon footprint, recyclability of our packaging, ingredients used in our products or the sourcing of such ingredients. Any such matters, or related corporate
citizenship and sustainability matters, could have a material adverse effect on our business.
Risks Related to Our Common Stock
The market price of our Class A common stock is subject to significant fluctuations due to a number of factors that are beyond our control.
Our Class A common stock closed at $32.59 per share on January 31, 2020 and closed at $48.19 per share on January 31, 2022. During this two-year period, our common stock traded as low as $12.31 per share and as high as
$63.85 per share. Many factors, including some we may be unable to control, could cause the market price of our Class A common stock to fall. Some of these factors include:
| ● |
fluctuations in our operating results;
|
| ● |
government investigations of our business;
|
| ● |
trends or adverse publicity related to our business, products, industry or competitors;
|
| ● |
the sale of shares of Class A common stock by significant stockholders;
|
| ● |
demand, and general trends in the market, for our products;
|
| ● |
acquisitions by us or our competitors;
|
| ● |
economic or currency exchange issues in markets in which we operate;
|
| ● |
changes in estimates of our operating performance or changes in recommendations by securities analysts;
|
| ● |
speculative trading, including short selling and options trading; and
|
| ● |
general economic, business, regulatory and political conditions.
|
Broad market fluctuations could also lower the market price of our Class A common stock regardless of our actual operating performance.
General Risk Factors
Difficult economic conditions could harm our business.
Difficult economic conditions, such as high unemployment levels, inflation, or recession, could adversely affect our business by causing a decline in demand for our products, particularly if the economic conditions are prolonged or worsen. For
example, an increase in oil prices would likely cause our shipping expenses to increase, which would negatively affect our profitability. In addition, economic conditions may adversely impact access to capital for us and our suppliers, may decrease
the ability of our sales force and consumers to obtain or maintain credit cards, and may otherwise adversely impact our operations and overall financial condition. There also appears to be increased concerns about potential inflationary pressures,
which could have a negative impact on our business if it impacts the discretionary spending of our consumers.
None.
Our principal properties consist of the following:
Offices
Our principal administrative offices are our corporate headquarters in Provo, Utah and our offices in Shanghai, China.
Distribution Centers
We distribute our products through distribution centers and warehouses in many of our markets, with our principal facilities being in Provo, Utah and Mainland China.
Research and Development Centers
We operate research and development centers in Provo, Utah and Shanghai, China.
Manufacturing Facilities
We operate manufacturing facilities in Mainland China, and two of the companies in our Rhyz strategic investment arm (Manufacturing segment) operate manufacturing facilities in Provo, Utah,
Draper, Utah and West Valley City, Utah.
We own the above properties, except we lease the manufacturing facilities in Provo, Utah and West Valley City, Utah, certain of the manufacturing facilities in China, and the land for our
facilities in Shanghai, China.
We are currently in litigation with Don Roberts, a dairy farmer. Mr. Roberts claims he is a general partner in the indoor-growing business and related businesses that we are now in the process of
winding down. He also claims he was instrumental in developing some of the business’s intellectual property. In May 2019, we filed a lawsuit in the U.S. District Court for the District of Utah, seeking a declaratory judgment that Mr. Roberts is not
an inventor of any of the business’s intellectual property and is not a partner in the business. This lawsuit was dismissed on jurisdictional grounds in December 2019. We appealed that dismissal to the U.S. Court of Appeals for the Tenth Circuit.
While the appeal was pending, Mr. Roberts filed an irrevocable covenant not to sue on the claims that gave rise to federal jurisdiction. We therefore informed the court that our appeal was moot, and the court dismissed our appeal in November 2020.
In addition to these proceedings in the federal courts, this matter also involves proceedings in Utah state courts. In November 2019, Mr. Roberts filed suit in Utah’s Fifth Judicial District Court, seeking a declaratory judgment that he is a
general partner in the business. Mr. Roberts also seeks damages exceeding $250 million. We filed a motion to dismiss this action in state court or, in the alternative, to transfer venue to Utah’s Fourth Judicial District Court. The court denied our
motion, and we were unable to have the denial reversed on appeal. Discovery is ongoing in this case. We believe Mr. Roberts’s claims are without merit, and we intend to continue to vigorously defend ourselves.
From time to time, we are involved in other legal proceedings arising in the ordinary course of business.
Not applicable.
| ITEM 5. |
MARKET FOR REGISTRANT’S COMMON EQUITY, RELATED STOCKHOLDER MATTERS AND ISSUER PURCHASES OF EQUITY SECURITIES
|
Market Information and Holders
Our Class A common stock is listed on the New York Stock Exchange and trades under the symbol “NUS.” The approximate number of holders of record of our Class A common stock as of January 31, 2022
was 231. This number of holders of record does not represent the actual number of beneficial owners of shares of our Class A common stock because shares are frequently held in “street name” by securities dealers and others for the benefit of
individual owners who have the right to vote their shares.
Purchases of Equity Securities by the Issuer
|
(a)
|
(b)
|
(c)
|
(d)
|
|||||||||||||
|
Period
|
Total
Number
of Shares
Purchased
|
Average
Price Paid
per Share
|
Total Number of
Shares Purchased
as Part of Publicly
Announced Plans
or Programs
|
Approximate Dollar
Value of Shares that May
Yet Be Purchased Under
the Plans or Programs
(in millions)(1)
|
||||||||||||
|
October 1 – 31, 2021
|
244,482
|
$
|
40.92
|
244,482
|
$
|
245.4
|
||||||||||
|
November 1 – 30, 2021
|
—
|
—
|
—
|
$
|
245.4
|
|||||||||||
|
December 1 – 31, 2021
|
—
|
—
|
—
|
$
|
245.4
|
|||||||||||
|
Total
|
244,482
|
$
|
40.92
|
244,482
|
||||||||||||
| (1) |
In August 2018, we announced that our board of directors approved a stock repurchase plan. Under this plan, our board of directors authorized the repurchase of up to $500 million of our outstanding Class A
common stock on the open market or in privately negotiated transactions.
|
Recent Sales of Unregistered Securities
None.
Stock Performance Graph
The following graph shows the changes in value over the five-year period ended December 31, 2021 of an assumed $100 investment in our Class A common stock, the S&P MidCap 400 Consumer Staples Index and the S&P
500 Index.
COMPARISON OF 5 YEAR CUMULATIVE TOTAL RETURN
Among Nu Skin Enterprises, Inc., the S&P 500 Index, and the S&P MidCap 400 Consumer Staples Index
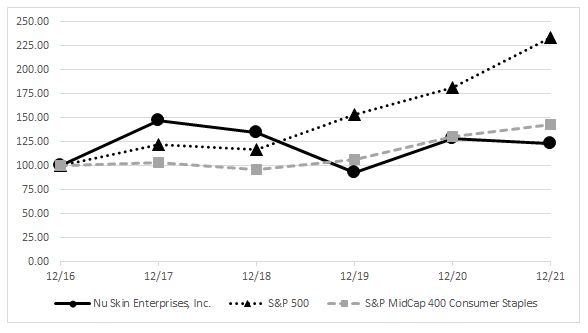
|
Measured Period
|
Nu Skin
|
S&P 500 Index
|
S&P MidCap 400 Consumer Staples
Index
|
|||
|
December 31, 2016
|
100.00
|
100.00
|
100.00
|
|||
|
December 31, 2017
|
146.54
|
121.83
|
103.28
|
|||
|
December 31, 2018
|
134.34
|
116.49
|
95.90
|
|||
|
December 31, 2019
|
92.69
|
153.17
|
106.30
|
|||
|
December 31, 2020
|
128.63
|
181.35
|
129.94
|
|||
|
December 31, 2021
|
123.05
|
233.41
|
143.04
|
The stock performance graph above shall not be deemed to be “soliciting material” or to be “filed” with the U.S. Securities and Exchange Commission or subject to the liabilities of Section 18
under the Securities Exchange Act of 1934, as amended (the “Exchange Act”). In addition, it shall not be deemed incorporated by reference by any statement that incorporates this Annual Report on Form 10-K by reference into any filing under the
Securities Act of 1933 (the “Securities Act”) or the Exchange Act, except to the extent that we specifically incorporate this information by reference.
Not applicable.
The following discussion of our financial condition and results of operations should be read in conjunction with the consolidated financial statements and related notes, which are included in
this Annual Report on Form 10-K.
Business Overview
Our Products
Nu Skin Enterprises, Inc. develops and distributes a comprehensive line of premium-quality beauty and wellness solutions in approximately 50 markets worldwide. In 2021, our revenue of
$2.7 billion was primarily generated by our three primary brands: our beauty products brand, Nu Skin; our wellness products brand, Pharmanex; and our anti-aging brand, ageLOC. We operate in the direct
selling channel, primarily utilizing person-to-person marketing to promote and sell our products, including through the use of social and digital platforms. In all of our markets besides Mainland China, we refer to members of our independent sales
force as “Brand Affiliates” because their primary role is to promote our brand and products through their personal and social networks.
In addition to our core Nu Skin business, we also explore new areas of growth and opportunity through our strategic investment arm known as Rhyz Inc. Rhyz investments include beauty and wellness
product manufacturing companies and other investments. In 2021, the Rhyz companies generated $174.7 million, or 6%, of our 2021 reported revenue (excluding sales to our core Nu Skin business).
Our Global Operations
In 2021, we generated approximately 20% of our revenue from the United States and approximately 21% from Mainland China. Given the size of our international operations, our results, as reported
in U.S. dollars, are often impacted by foreign-currency fluctuations; in 2021, our revenue was positively impacted 2% from foreign-currency fluctuations compared to 2020. In addition, our results can be impacted by global economic, political,
demographic and business trends and conditions.
A Global Network of Sales Leaders and Customers
As of December 31, 2021, we had 1,367,559 persons who purchased products directly from the company during the previous three months (“Customers”). We believe a significant majority of Customers
purchase our products primarily for personal or family consumption but are not actively pursuing the opportunity to generate supplemental income by marketing and reselling products.
Our revenue is highly influenced by the number and productivity of our Sales Leaders. “Sales Leaders” are our Brand Affiliates, and sales employees and independent marketers in Mainland China,
who achieve certain qualification requirements. Our Sales Leaders are also included in our Customer numbers, as they purchase products from the company and are within the definition of our “Customers.”
We have been successful in attracting and motivating our sales force by:
| ● |
developing and marketing innovative, technologically and scientifically advanced products;
|
| ● |
providing compelling initiatives and strong support; and
|
| ● |
offering an attractive sales compensation structure.
|
Our global sales force helps us to rapidly introduce products and penetrate our markets with modest up-front promotional expense. We rely on our sales force to create consumer demand for our
products, as opposed to a traditional approach of advertising-generated consumer awareness. Our approach is particularly effective with products that benefit from personal education and demonstration. Similar to other companies in our industry, we
experience relatively high turnover among our sales force.
To enhance customer retention, we have developed product subscription and loyalty programs that provide incentives for consumers to commit to purchase a specific amount of product on a monthly
basis. All purchases under these programs are subject to our standard product payment and return policies. We believe these subscription and loyalty programs have improved consumer retention, have had a stabilizing impact on revenue and have helped
generate recurring sales.
Product Innovation
Our sales force markets and sells our products, and attracts others to the opportunity, based on the distinguishing benefits and innovative characteristics of our products. As a result, we
leverage our scientific expertise and product development resources to introduce innovative beauty, wellness and anti-aging products. Our sales force is increasingly using social media to market and sell our products. To continue to leverage social
media, it is imperative that we develop demonstrable products that are unique and engaging to younger consumers.
Any delays or difficulties in introducing compelling products or attractive initiatives or tools into our markets may have a negative impact on our revenue and our number of Customers and Sales
Leaders.
Our Product Launch Process
We use a variety of methods to launch our products, enabling us to tailor the launch process to the specific market and the specific product. Prior to making a key product generally available for
purchase, we may do one or more introductory offerings of the product, such as a preview of the product to our Sales Leaders or other product introduction or promotion. These offerings may generate significant activity and a high level of
purchasing, which can result in a higher-than-normal increase in revenue during the quarter and can skew year-over-year and sequential comparisons. We believe our product launch process attracts new Customers and Sales Leaders to our business,
increases consumer trial and provides important marketing and forecasting information about the products to our company.
Beginning in the second half of 2021 and continuing into 2022, we are launching our Beauty Focus Collagen+ skin care supplement and our ageLOC Meta nutritional supplement that helps support metabolic health.
Income Statement Presentation
We report revenue in ten segments, and we translate revenue from each market’s local currency into U.S. dollars using weighted-average exchange rates. Revenue is measured as the amount of
consideration we expect to receive in exchange for transferring products. All revenue is recognized when we satisfy our performance obligations under the contract. We recognize revenue by transferring the promised products to the customer, with
revenue recognized at shipping point, the point in time the customer obtains control of the products. We recognize revenue for shipping and handling charges at the time the products are delivered to or picked up by the customer. In most markets, we
offer a return policy that allows our sales force to return unopened and unused product for up to 12 months subject to a 10% restocking fee. Reported revenue is net of returns, which have historically been less than 5% of annual revenue. Sales
taxes and value added taxes in foreign jurisdictions that are collected from customers and remitted to governmental authorities are accounted for on a net basis and therefore are excluded from net sales.
Cost of sales primarily consists of:
| ● |
cost of products purchased from third-party vendors;
|
| ● |
costs of self-manufactured products;
|
| ● |
cost of adjustments to inventory carrying value;
|
| ● |
freight cost of shipping products to our sales force and import duties for the products; and
|
| ● |
royalties and related expenses for licensed technologies.
|
For markets other than Mainland China, in 2021, we sourced most of our beauty products and wellness products from trusted third-party suppliers and manufacturers. In Mainland China, we operate
manufacturing facilities where we produce the majority of our beauty and wellness products sold in Mainland China. We also produce some products at these facilities that are exported to other markets. In the United States, we have beauty and wellness
manufacturing companies that sell to third-party vendors and are also producing some of our products. Cost of sales and gross profit, on a consolidated basis, may fluctuate as a result of changes in the ratio between self-manufactured products and
products sourced from third-party vendors. In addition, because we purchase a significant amount of our goods in U.S. dollars and recognize revenue in local currencies, our gross margin is subject to exchange rate risks. Because our gross margins
vary from product to product and due to higher pricing in some markets, changes in product mix and geographic revenue mix can impact our gross margin on a consolidated basis.
Selling expenses are our most significant expense and are classified as operating expenses. Selling expenses include sales commissions paid to our sales force, special incentives, costs for
incentive trips and other rewards, as well as salaries, service fees, benefits, bonuses and other labor and unemployment expenses we pay to our sales force in Mainland China. Selling expenses do not include amounts we pay to our sales force based
on their personal purchases; rather, such amounts are reflected as reductions to revenue. Our global sales compensation plan, which we employ in all our markets except Mainland China, is an important factor in our ability to attract and retain our
Sales Leaders. Under our global sales compensation plan, Sales Leaders can earn “multi-level” compensation, where they earn commissions for product sales to their consumer groups as well as the product sales made through the sales network they have
developed and trained. We do not pay commissions on sales materials. Fluctuations occur in the amount of commissions paid as our numbers of Customers and Sales Leaders change from month to month, but the fluctuation in the overall payout as a
percentage of revenue tends to be relatively small. Selling expenses as a percentage of revenue typically increase in connection with a significant product offering, due to growth in the number of Sales Leaders qualifying for increased sales
compensation and promotional incentives. From time to time, we make modifications and enhancements to our global sales compensation plan in an effort to help motivate our sales force and develop leadership characteristics, which can have an impact
on selling expenses. For example, in the fourth quarter of 2017, we began to implement significant enhancements to our global sales compensation plan, which we have now rolled out across all markets other than Mainland China. One of the changes is
a new bonus program for our sales force, which has an increasing effect on our selling expenses as a percentage of revenue.
Outside of Mainland China, Brand Affiliates also have the opportunity to make profits by purchasing products from us at a discount and selling them to consumers with a mark-up. We do not account
for, nor pay, additional commissions on these mark-ups received by Brand Affiliates. In many markets, we also allow individuals who are not part of our sales force, whom we refer to as “preferred customers,” to buy products directly from us at a
discount. We pay commissions on preferred customer purchases to the referring member of our sales force.
General and administrative expenses include:
| ● |
wages and benefits;
|
| ● |
rents and utilities;
|
| ● |
depreciation and amortization;
|
| ● |
promotion and advertising;
|
| ● |
professional fees;
|
| ● |
travel;
|
| ● |
research and development; and
|
| ● |
other operating expenses.
|
Labor expenses are the most significant portion of our general and administrative expenses. Promotion and advertising expenses include costs of sales force conventions held in various markets
worldwide, which we generally expense in the period in which they are incurred. Because our various sales force conventions are not held during each fiscal year, or in the same period each year, their impact on our general and administrative
expenses may vary from year to year and from quarter to quarter. For example, we held our global convention in October 2019 and will have another global convention in the fall of 2023, as we currently plan to hold a global convention every other
year. Our 2021 global convention was held virtually due to the ongoing pandemic. In addition, we hold regional conventions and conventions in our major markets at different times during the year. These conventions have significant expenses
associated with them. Because we have not incurred expenses for these conventions during every fiscal year or in comparable interim periods, year-over-year comparisons have been impacted accordingly.
Provision for income taxes depends on the statutory tax rates and the withholding taxes in each of the jurisdictions in which we operate. For example, statutory tax rates in 2021 were
approximately 17% in Hong Kong, 20% in Taiwan, 25% in South Korea, 32% in Japan and 25% in Mainland China. We are subject to taxation in the United States at the statutory corporate federal tax rate of 21% in 2021, and we pay taxes in multiple
states within the United States at various tax rates. Our overall effective tax rate was 36.6% for the year ended December 31, 2021.
Critical Accounting Policies and Estimates
The following critical accounting policies and estimates should be read in conjunction with our audited consolidated financial statements and related notes thereto. Management considers our
critical accounting policies to be accounting for income taxes and accounting for intangible assets. In each of these areas, management makes estimates based on historical results, current trends and future projections.
Income Taxes. We account for income taxes in accordance with the Income Taxes Topic of the Financial Accounting Standards Codification. This Topic
establishes financial accounting and reporting standards for the effects of income taxes that result from an enterprise’s activities during the current and preceding years. We take an asset and liability approach for financial accounting and
reporting of income taxes. We pay income taxes in many foreign jurisdictions based on the profits realized in those jurisdictions, which can be significantly impacted by terms of intercompany transactions between Nu Skin affiliates around the
world. Deferred tax assets and liabilities are created in this process. As of December 31, 2021, we had net deferred tax assets of $24.1 million. We net these deferred tax assets and deferred tax liabilities by jurisdiction. Valuation allowances
are established when necessary to reduce deferred tax assets to the amounts expected to be ultimately realized. These deferred tax assets assume sufficient future earnings will exist for their realization, and are calculated using anticipated tax
rates. In certain jurisdictions, valuation allowances have been recorded against the deferred tax assets specifically related to use of foreign tax credits, research and development credits and net operating losses. When we determine that there is
sufficient taxable income to utilize the foreign tax credits, the research and development credits, or the net operating losses, the valuation allowances will be released. In the event we were to determine that we would not be able to realize all
or part of our deferred tax assets in the future, an adjustment to the deferred tax assets would be charged to earnings in the period such determination was made.
We evaluate our indefinite reinvestment assertions with respect to foreign earnings for each period. Other than earnings we intend to reinvest indefinitely, we accrue for the U.S. federal and
state income taxes applicable to the earnings. For all foreign earnings, we accrue the applicable foreign income taxes. We intend to utilize the offshore earnings to fund foreign investments, specifically capital expenditures. Undistributed
earnings that we have indefinitely reinvested aggregate to $60.0 million as of December 31, 2021. If this amount were repatriated to the United States, the amount of incremental taxes would be approximately $6.0 million.
We file income tax returns in the U.S. federal jurisdiction and in various state and foreign jurisdictions. In 2009, we entered into a voluntary program with the IRS called Compliance Assurance
Process (“CAP”). Under the CAP program, the IRS audits the tax position of the Company to identify and resolve any tax issues that may arise throughout the tax year. As of December 31, 2021, tax years through 2020 have been audited and are
effectively closed to further examination. For tax years 2021 and 2022, the Company is in the Bridge phase of the CAP program, pursuant to which the IRS will not accept disclosures, will not conduct reviews and will not provide letters of assurance
for the Bridge years. There are limited circumstances that tax years in the Bridge phase will be opened for examination. With a few exceptions, we are no longer subject to state and local income tax examination by tax authorities for the years
before 2018. In major foreign jurisdictions, we are generally not subject to income tax examinations for years before 2015. However, statutes in certain markets may be as long as ten years for transfer pricing related issues. We are currently under
examination in certain foreign jurisdictions; however, the outcomes of those reviews are not yet determinable.
Our unrecognized tax benefits are related to multiple foreign and domestic jurisdictions. Due to potential changes in unrecognized tax benefits from the multiple jurisdictions in which we
operate, as well as the expiration of various statutes of limitation, it is reasonably possible that our gross unrecognized tax benefits, net of foreign currency adjustments, may increase within the next 12 months by a range of approximately $0.1
to $1.0 million.
At December 31, 2021, we had $15.1 million in unrecognized tax benefits of which $15.1 million, if recognized, would affect the effective tax rate. In comparison, at December 31, 2020, we had
$17.6 million in unrecognized tax benefits of which $17.6 million, if recognized, would affect the effective tax rate. We recognized an increase of approximately $1.6 million in interest and penalties expense during the year ended December 31, 2021
and $1.5 million in interest and penalties during the year ended December 31, 2020. We had approximately $6.7 million, $5.1 million and $3.6 million of accrued interest and penalties related to uncertain tax positions at December 31, 2021, 2020 and
2019, respectively. Interest and penalties related to uncertain tax positions are recognized as a component of income tax expense.
We are subject to regular audits by federal, state and foreign tax authorities. These audits may result in additional tax liabilities. We account for such contingent liabilities in accordance
with relevant accounting standards and believe we have appropriately provided for income taxes for all years. Several factors drive the calculation of our tax reserves. Some of these factors include: (i) the expiration of various statutes of
limitations; (ii) changes in tax law and regulations; (iii) issuance of tax rulings; and (iv) settlements with tax authorities. Changes in any of these factors may result in adjustments to our reserves, which would impact our reported financial
results.
Intangible Assets. Acquired intangible assets may represent indefinite-lived assets, determinable-lived intangibles or goodwill. Of these, only the costs of determinable-lived intangibles
are amortized to expense over their estimated life. The value of indefinite-lived intangible assets and residual goodwill is not amortized, but is tested at least annually for impairment. Our impairment testing for goodwill is performed separately
from our impairment testing of indefinite-lived intangibles. We test goodwill for impairment, at least annually, by reviewing the book value compared to the fair value at the reportable unit level. We have the option to perform a qualitative
assessment to determine whether further impairment testing is necessary or to perform a quantitative assessment by comparing the fair value of a reporting unit to its carrying amount, including goodwill. Under the qualitative assessment, an entity
is not required to calculate the fair value of a reporting unit unless the entity determines that it is more likely than not that its fair value is less than its carrying amount. If under the quantitative assessment the fair value of a reporting
unit is less than its carrying amount, then the amount of the impairment loss, if any, must be measured. We elected to perform the qualitative assessment for fiscal years 2021 and 2019. We used the quantitative assessment for fiscal year 2020.
Considerable management judgment is necessary to measure fair value. During 2021, we recognized an impairment charge associated with our exit of the Grow Tech segment. We did not recognize any impairment charges for goodwill or intangible assets
during 2020 and 2019.
Results of Operations
The following table sets forth our operating results as a percentage of revenue for the periods indicated:
|
Year Ended December 31,
|
||||||||||||
|
2021
|
2020
|
2019
|
||||||||||
|
Revenue
|
100.0
|
%
|
100.0
|
%
|
100.0
|
%
|
||||||
|
Cost of sales
|
25.0
|
25.5
|
24.0
|
|||||||||
|
Gross profit
|
75.0
|
74.5
|
76.0
|
|||||||||
|
Operating expenses:
|
||||||||||||
|
Selling expenses
|
39.6
|
39.5
|
39.5
|
|||||||||
|
General and administrative expenses
|
24.7
|
25.0
|
25.4
|
|||||||||
|
Restructuring and impairment expenses
|
2.0
|
—
|
—
|
|||||||||
|
Total operating expenses
|
66.3
|
64.5
|
64.9
|
|||||||||
|
Operating income
|
8.7
|
10.0
|
11.0
|
|||||||||
|
Other income (expense), net
|
(0.1
|
)
|
(0.1
|
)
|
(0.5
|
)
|
||||||
|
Income before provision for income taxes
|
8.6
|
9.9
|
10.5
|
|||||||||
|
Provision for income taxes
|
3.1
|
2.5
|
3.4
|
|||||||||
|
Net income
|
5.5
|
%
|
7.4
|
%
|
7.2
|
%
|
||||||
2021 Compared to 2020
Overview
Revenue in 2021 increased 4% to $2.70 billion from $2.58 billion in 2020. As of the end of the fourth quarter of 2021, Sales Leaders decreased 13% and Customers decreased 12% compared to the
prior year.
Our results benefited from continued growth in social commerce, along with strong product launches of Beauty Focus Collagen+ and ageLOC
Meta, which combined generated approximately $119 million in revenue for 2021. The decline in Customers and Sales Leaders is primarily attributable to continued declines in our Mainland China business, ongoing COVID-related operational
disruptions in Southeast Asia and economical challenges in Latin America. The decline in Customers and Sales Leaders is consistent with our 10% decline in revenue for the fourth quarter of 2021, compared to the same period in 2020. During the
second half of 2022, we currently plan to launch two connected, “input/output” devices.
Earnings per share in 2021 decreased 21% to $2.86 from $3.63 in 2020. In the fourth quarter of 2021, we adopted a restructuring program as we determined to exit our Grow Tech segment, resulting in charges totaling
$65.5 million. The impact of these charges was partially offset by increased revenue in 2021, lower weighted-average outstanding shares due to our stock repurchases.
Segment Results
We report our business in ten segments to reflect our current management approach. These segments consist of our seven geographic Nu Skin segments—Mainland China, Americas, South Korea, Southeast Asia/Pacific, EMEA,
Japan and Hong Kong/Taiwan—and our three Rhyz Investment segments—Manufacturing, Grow Tech and Rhyz other. The Nu Skin Other category includes miscellaneous corporate revenue and related adjustments. The Rhyz other segment includes other investments
by our Rhyz strategic investment arm, which were entered into during 2021.
The following table sets forth revenue for the years ended December 31, 2021 and 2020 for each of our reportable segments (U.S. dollars in thousands):
|
Constant
|
||||||||||||||||
|
Year Ended December 31,
|
Currency
|
|||||||||||||||
|
2021
|
2020
|
Change
|
Change(1)
|
|||||||||||||
|
Nu Skin
|
||||||||||||||||
|
Mainland China
|
$
|
568,774
|
$
|
625,538
|
(9
|
)%
|
(15
|
)%
|
||||||||
|
Americas
|
547,755
|
453,022
|
21
|
%
|
20
|
%
|
||||||||||
|
South Korea
|
354,252
|
326,478
|
9
|
%
|
6
|
%
|
||||||||||
|
Southeast Asia/Pacific
|
336,651
|
361,627
|
(7
|
)%
|
(9
|
)%
|
||||||||||
|
EMEA
|
283,200
|
230,246
|
23
|
%
|
18
|
%
|
||||||||||
|
Japan
|
266,216
|
273,681
|
(3
|
)%
|
—
|
|||||||||||
|
Hong Kong/ Taiwan
|
162,611
|
161,117
|
1
|
%
|
(2
|
)%
|
||||||||||
|
Other
|
1,549
|
(17
|
)
|
9,212
|
%
|
9,212
|
%
|
|||||||||
|
Total Nu Skin
|
2,521,008
|
2,431,692
|
4
|
%
|
1
|
%
|
||||||||||
|
Rhyz Investments
|
||||||||||||||||
|
Manufacturing
|
172,120
|
149,339
|
15
|
%
|
15
|
%
|
||||||||||
|
Grow Tech
|
2,104
|
903
|
133
|
%
|
133
|
%
|
||||||||||
|
Rhyz Other
|
437
|
—
|
||||||||||||||
|
Total Rhyz Investments
|
174,661
|
150,242
|
16
|
%
|
16
|
%
|
||||||||||
|
Total
|
$
|
2,695,669
|
$
|
2,581,934
|
4
|
%
|
2
|
%
|
||||||||
| (1) |
Constant-currency revenue change is a non-GAAP financial measure. See “Non-GAAP Financial Measures,” below.
|
The table below sets forth segment contribution for the years ended December 31, 2021 and 2020 for each of our reportable segments (U.S. dollars in thousands). Segment contribution excludes
certain intercompany charges, specifically royalties, license fees, transfer pricing and other miscellaneous items. We use segment contribution to measure the portion of profitability that the segment managers have the ability to control for their
respective segments. For additional information regarding our segments and the calculation of segment contribution, see Note 15 to the consolidated financial statements contained in this report.
|
Year Ended December 31,
|
||||||||||||
|
2021
|
2020
|
Change
|
||||||||||
|
Nu Skin
|
||||||||||||
|
Mainland China
|
$
|
151,645
|
$
|
181,024
|
(16
|
)%
|
||||||
|
Americas
|
116,265
|
86,386
|
35
|
%
|
||||||||
|
South Korea
|
114,034
|
100,933
|
13
|
%
|
||||||||
|
Southeast Asia/Pacific
|
81,779
|
87,753
|
(7
|
)%
|
||||||||
|
EMEA
|
41,988
|
24,078
|
74
|
%
|
||||||||
|
Japan
|
67,511
|
68,027
|
(1
|
)%
|
||||||||
|
Hong Kong/Taiwan
|
37,330
|
33,466
|
12
|
%
|
||||||||
|
Total Nu Skin
|
610,552
|
573,039
|
7
|
%
|
||||||||
|
Rhyz Investments
|
||||||||||||
|
Manufacturing
|
18,346
|
21,168
|
(13
|
)%
|
||||||||
|
Grow Tech
|
(83,907
|
)
|
(22,430
|
)
|
(274
|
)%
|
||||||
|
Rhyz Other
|
(1,813
|
)
|
—
|
|||||||||
|
Total Rhyz Investments
|
(67,374
|
)
|
(1,262
|
)
|
(5,236
|
)%
|
||||||
The following table provides information concerning the number of Customers and Sales Leaders as of December 31, 2021 and 2020. “Customers” are persons who have purchased products directly from
the Company during the three months ended as of the date indicated. Our Customer numbers do not include consumers who purchase products directly from members of our sales force. “Sales Leaders” are our Brand Affiliates, and sales employees and
independent marketers in Mainland China, who achieve certain qualification requirements.
|
As of December 31, 2021
|
As of December 31, 2020
|
% Increase (Decrease)
|
||||||||||||||||||||||
|
Customers
|
Sales Leaders
|
Customers
|
Sales Leaders
|
Customers
|
Sales Leaders
|
|||||||||||||||||||
|
Mainland China
|
315,418
|
17,658
|
381,460
|
21,990
|
(17
|
)%
|
(20
|
)%
|
||||||||||||||||
|
Americas
|
336,564
|
10,340
|
366,688
|
12,754
|
(8
|
)%
|
(19
|
)%
|
||||||||||||||||
|
South Korea
|
146,354
|
7,108
|
158,953
|
7,059
|
(8
|
)%
|
1
|
%
|
||||||||||||||||
|
Southeast Asia/Pacific
|
169,601
|
10,386
|
192,622
|
10,588
|
(12
|
)%
|
(2
|
)%
|
||||||||||||||||
|
EMEA
|
210,414
|
6,124
|
258,587
|
7,063
|
(19
|
)%
|
(13
|
)%
|
||||||||||||||||
|
Japan
|
122,813
|
5,872
|
128,400
|
6,318
|
(4
|
)%
|
(7
|
)%
|
||||||||||||||||
|
Hong Kong/Taiwan
|
66,395
|
4,027
|
70,592
|
4,663
|
(6
|
)%
|
(14
|
)%
|
||||||||||||||||
|
Total
|
1,367,559
|
61,515
|
1,557,302
|
70,435
|
(12
|
)%
|
(13
|
)%
|
||||||||||||||||
Following is a narrative discussion of our results in each segment, which supplements the tables above.
Mainland China. Our Mainland China market continued to be challenged during 2021, as the COVID-19 delta and omicron variants and corresponding government restrictions negatively impacted our
selling and promotional activities. Our reported revenue benefited 6% from favorable foreign currency fluctuations. While we continue to invest in technology solutions to better support our social commerce business model in the Mainland China market,
we are anticipating the challenges will remain in 2022.
The year-over-year decrease in segment contribution primarily reflects lower revenue in 2021 and a 2.2 percentage point increase in selling expenses as a percentage of revenue. The salaries and
service fees of our Sales Leaders in Mainland China are fixed until they are adjusted in a quarterly evaluation process. As a result, we have variations in our selling expenses as percentage of revenue, particularly when there is a sequential
change in revenue.
Americas. Our Americas segment continued to benefit from increased sharing of innovative products by our Brand Affiliates via the social
commerce business model, which drove increased revenue in 2021. In addition, approximately $33 million of the increase in revenue is attributable to new product launches during 2021. The decline in Customers and Sales Leaders is predominately
attributable to the economic challenges being felt in our Latin America markets. The U.S. market, through strong social commerce adoption increased revenue 32% in 2021.
The year-over-year increase in segment contribution primarily reflects the increase in revenue in our U.S. market, which carries a more favorable gross margin than our Latin America markets.
South Korea. Our South Korea market grew 9% in 2021, as it benefited from successful product promotions and the fourth quarter launch of ageLOC Meta, which
contributed $29 million in revenue. The 8% decline in Customers is primarily a result of the types of promotions we ran during the year, which focused more on increasing the number and productivity of our Sales Leaders.
The year-over-year increase in segment contribution primarily reflects the increased revenue, along with the fixed nature of general and administrative expenses on increased revenue.
Southeast Asia/Pacific. Our Southeast Asia/Pacific segment continued to be challenged by the COVID-19 outbreak and the associated government restrictions in 2021, which led to a decline in
revenue, Customers and Sales Leaders. We are experiencing slower adoption of our social commerce business in our Southeast Asia markets, which is also contributing to the decline in revenue.
The year-over-year decrease in segment contribution for 2021 primarily reflects the decline in revenue.
EMEA. The increase in revenue is primarily attributable to strong adoption by Brand Affiliates of the social commerce business model. In addition, approximately $17 million of the increase
in revenue is attributable to new product launches during 2021. Our reported revenue reflects a 5% benefit from favorable foreign-currency fluctuations. The decline in our Customers and Sales Leaders is primarily attributable to a strong first half
of 2021, followed by some softening of momentum attributable to the loosening of COVID-19 restrictions, which resulted in a prolonged summer vacation period. The softening of momentum also contributed to an 18% decline in revenue for the fourth
quarter of 2021, compared to the prior-year period.
The year-over-year increase in segment contribution primarily reflects the increased revenue for 2021, along with a 2.0 percentage point increase in gross margin, attributable to a more favorable
product mix along with reduced air freight expense in 2021, and the fixed nature of general and administrative expenses on increased revenue.
Japan. The decline in revenue is primarily attributable to unfavorable foreign-currency fluctuations. The decline in Customers and Sales Leaders is attributable to the ongoing COVID-19
outbreak, as our Japan market is more reliant on the in-person connections.
The year-over-year decrease in segment contribution is primarily attributable to the decline in reported revenue, partially offset by a decline in general and administrative expenses from lower
labor expenses in 2021.
Hong Kong/Taiwan. Our Hong Kong /Taiwan segment reported a 1% increase in revenue for 2021, with a 3% benefit from favorable foreign-currency fluctuations. Our Customers and Sales Leaders
decline is primarily attributable to the continued pressure from COVID-19 and a higher reliance on in-person business.
The year-over-year increase in segment contribution is primarily attributable a 1.1 percentage point decrease in selling expenses and a $1.7 million decline in general and administrative expenses
from cost saving measures and lower labor expense for the year.
Manufacturing. Our Manufacturing segment generated a 15% increase in revenue for 2021. Our previous investments in additional capacity have allowed our manufacturing
companies to continue to increase revenue as the demand for nutrition and personal care products continues to expand.
The 13% decline in segment contribution primarily reflects a $4.8 million increase in inventory reserve.
Grow Tech. On December 22, 2021, we determined to exit our Grow Tech segment, which had been pursuing the commercialization of
controlled-environment agriculture technology for use in the agriculture feed industry. We believe this decision will help us to focus more resources on key strategic initiatives to achieve our future growth objectives and priorities in our core
business. We expect that the actions to wind down this segment’s operations will be substantially completed during the first half of 2022. It is possible that certain contract terminations and legal matters might continue for additional time.
During the fourth quarter of 2021, we recognized a $58.5 million pre-tax charge in connection with the exit, with $6.6 million recorded in cost of goods sold, associated with inventory write-off, $51.9 million in restructuring and impairment, and
a $6.4 million income tax charge. The segment contribution for 2021 includes the $58.5 million impact from the write-off.
Consolidated Results
Revenue
Revenue for the year ended December 31, 2021 increased 4% to $2.70 billion, compared to $2.58 billion in the prior-year period. For a discussion and analysis of this increase in revenue, see
“Overview” and “Segment Results,” above.
Gross profit
Gross profit as a percentage of revenue increased to 75.0% in 2021, compared to 74.5% in 2020. Gross profit as a percentage of revenue for core Nu Skin increased 1.2 percentage points
to 78.2%, reflecting lower freight cost as compared to 2020, when we needed to expedite more orders to meet a spike in demand. Our consolidated gross profit was negatively impacted $6.6 million from inventory write-off associated with our
fourth quarter 2021 restructuring and our increase in inventory reserve at our Manufacturing segment.
Selling expenses
Selling expenses as a percentage of revenue increased to 39.6% in 2021, compared to 39.5% for 2020. Our core Nu Skin business’s selling expense as a percentage of revenue increased 0.5
percentage points to 42.4% for 2021, compared to 41.9% for 2020. Selling expenses for our core Nu Skin business are driven by the specific performance of our individual Sales Leaders. Given the size of our sales force and the various components of
our compensation and incentive programs, selling expenses as a percentage of revenue typically fluctuate plus or minus approximately 100 basis points from period to period.
General and administrative expenses
General and administrative expenses increased to $666.4 million in 2021, compared to $646.8 million in 2020. The $19.6 million increase primarily relates to an increase in
IT expense, associated with our cloud transition and ongoing development of digital tools. As a percentage of revenue, general and administrative decreased 0.3 percentage points to 24.7% for 2021, compared to
25.0% for 2020.
Restructuring and impairment expenses
In the fourth quarter of 2021, we adopted a restructuring program. We determined to exit our Grow Tech segment, as a strategic shift to better align our resources on key strategic initiatives to
achieve the future growth objectives and priorities of the core Nu Skin business. As a result of the restructuring program, we recorded $51.9 million in restructuring and impairment charges in 2021, consisting primarily of a non-cash charge of
$31.9 million for impairment of goodwill, intangibles and fixed assets, and $20.0 million of cash charges, including $6.5 million for employee severance and $13.5 million for other related cash charges associated with our restructuring. The
restructuring charges were recorded in the Grow Tech segment.
Other income (expense), net
Other income (expense), net for 2021 was $(1.5) million of expense, compared to $(1.3) million of expense in 2020.
Provision for income taxes
Provision for income taxes increased to $85.2 million in 2021 from $64.9 million in 2020. Our effective tax rate increased to 36.6% of pre-tax income in 2021 from 25.3% in 2020. The
increase in the effective tax rate for 2021 is primarily due to the disposal of the Grow Tech segment.
For 2022, we currently anticipate that our effective tax rate will be approximately 24-30%. Our actual 2022 effective tax rate could differ materially from this estimate. Our future effective tax
rates could fluctuate significantly, being affected by numerous factors, such as intercompany transactions, changes in our business operations, foreign audits, increases in uncertain tax positions, acquisitions, entry into new markets, the amount
of our foreign earnings, including earnings being lower than anticipated in jurisdictions where we have a lower statutory rate and higher than anticipated in jurisdictions where we have a higher statutory rate, losses incurred in jurisdictions, the
inability to realize tax benefits, withholding taxes, changes in foreign currency exchange rates, changes in our stock price, changes in our deferred tax assets and liabilities and their valuation.
Net income
As a result of the foregoing factors, net income in 2021 decreased to $147.3 million, compared to $191.4 million in 2020.
2020 Compared to 2019
For a comparison of our operating results for 2020 compared to 2019, see Item 7. Management’s Discussion and Analysis of Financial Condition and Results of Operations beginning on page 42 of our Annual Report on Form
10-K for the fiscal year ended December 31, 2020, as filed with the SEC on February 11, 2021.
Liquidity and Capital Resources
Historically, our principal uses of cash have included operating expenses (particularly selling expenses) and working capital (principally inventory purchases), as well as capital
expenditures, stock repurchases, dividends, debt repayment and the development of operations in new markets. We have at times incurred long-term debt, or drawn on our revolving line of credit, to fund strategic transactions, stock repurchases,
capital investments and short-term operating needs. We typically generate positive cash flow from operations due to favorable margins and have generally relied on cash from operations to fund operating activities. We generated $141.6 million in
cash from operations during 2021, compared to $379.1 million in cash from operations during 2020. The decrease in cash flow from operations primarily reflects an increase in inventory partially attributable to our strategic decision to
carry more inventory to meet customer demand for our new products and build some protection from potential supply chain disruptions, along with the first quarter of 2021 payout of the accrued commission and accrued employee incentive payments
attributable to our growth in the fourth quarter of 2020.
As of December 31, 2021, cash and cash equivalents, including current investments, were $354.8 million compared to $423.9 million as of December 31, 2020. The decrease in cash and
cash equivalents primarily reflects the purchases of property and equipment, our quarterly dividend payments and repurchases of our stock, partially offset by our operating cash flow described above and our net borrowings under our revolving
credit facility during the year, which were primarily to fund our acquisitions, stock repurchases and other expenses for operations. Working capital as of December 31, 2021 was $343.3 million compared to $360.3 million as of December 31, 2020.
The decrease in working capital was primarily attributable to the decrease in cash and cash equivalents, and borrowings under our revolving credit facility during the year, partially offset by increased inventory and lower accrued
expenses, as discussed above.
Cash requirements. For 2022, we currently expect that our material cash requirements will include the following:
| ● |
Cash requirements for operating activities. Our operating expenses typically total approximately 85%-90% of our revenue, with compensation to our sales force constituting 40%-42% of our core Nu Skin revenue.
These compensation expenses consist primarily of commission payments, which we generally pay to our sales force within approximately one to two months of the sale. Inventory purchases have historically constituted approximately 15%-20% of
our revenue. On average, we purchase our inventory approximately three to six months prior to sale. While our actual cash usage may vary based on the timing of payments, we currently expect these approximate percentages and payment
practices to continue in 2022. In addition, we expect our 2022 lease payments will be approximately $38 million.
|
| ● |
Cash requirements for investing activities. As discussed in more detail below, our capital expenditures are expected to be $85-105 million for 2022.
|
| ● |
Cash requirements for financing activities. In 2022 we are obligated to make a total of $37.5 million in quarterly principal payments plus the associated interest on our term loan. We also anticipate paying
quarterly cash dividends throughout 2022, approximating $19-20 million per quarter depending on the number of shares outstanding as of record date. Additional details about our dividends and term loan are provided below.
|
For 2023 and onward, we currently expect the above material cash requirements will remain. See Note 6 and Note 7 to the consolidated financial statements contained in this report for our future
cash requirements related to our debt principal repayment and our maturities of lease liabilities.
We intend to fund the aforementioned cash requirements with our cash from operations and draw on our revolving credit facility, as needed, to address any short-term funding requirements.
Capital expenditures. Capital expenditures in 2021 totaled $68.6 million. As with 2021, we expect that the capital expenditures in 2022 will be primarily related to:
| ● |
purchases and expenditures for computer systems and equipment, software, and application development;
|
| ● |
the expansion and upgrade of facilities in our various markets; and
|
| ● |
a new manufacturing plant in Mainland China.
|
We estimate that capital expenditures for the uses listed above will total approximately $85–105 million for 2022. We are currently in the building phase of the new manufacturing plant in
Mainland China. We have spent approximately $37.3 million on this project through the end of 2021, and expect that our capital expenditures for this project will total approximately $52-57 million, including $15-20 million during 2022.
Credit agreement. In April 2018, we entered into a Credit Agreement (the “Credit Agreement”) with various financial institutions as lenders and Bank of America, N.A., as administrative agent. The Credit
Agreement provides for a $400.0 million term loan facility and a $350.0 million revolving credit facility, each with a term of five years. We used the proceeds of the term loan and the draw on the revolving facility to pay off our previous credit
agreement and the outstanding balance on our 2016 convertible notes that were converted at the election of the holder in the first quarter of 2018. The interest rate applicable to the facilities is subject to adjustments based on our consolidated
leverage ratio. The term loan facility amortizes in quarterly installments in amounts resulting in an annual amortization of 5.0% during the first and second years, 7.5% during the third and fourth years and 10.0% during the fifth year after the
closing date of the Credit Agreement, with the remainder payable at final maturity. As of December 31, 2021 and 2020, $70.0 million and no outstanding borrowings under our revolving credit facility, and $307.5 million and $337.5 million remaining
balance on our term loan facility. The carrying value of the debt also reflects debt issuance costs of $1.2 million and $2.1 million as of December 31, 2021 and 2020, respectively, related to the Credit Agreement. The Credit Agreement requires us to
maintain a consolidated leverage ratio not exceeding 2.25 to 1.00 and a consolidated interest coverage ratio of no less than 3.00 to 1.00. We are currently in compliance with all debt covenants under the Credit Agreement. We are planning to
refinance our Credit Agreement during the first half of 2022.
Derivative instruments. As of December 31, 2021, we had four interest rate swaps, with a total notional principal amount of $200 million and a maturity date of July 31, 2025. We entered into these interest rate
swap arrangements during the third quarter of 2020 to hedge the variable cash flows associated with our variable-rate debt under the Credit Agreement.
Stock repurchase plan. In 2018, our board of directors approved a stock repurchase plan authorizing us to repurchase up to $500.0 million of our outstanding shares of Class A common stock on
the open market or in private transactions. During 2021, we repurchased approximately 1.6 million shares of our Class A common stock under the plan for $80.4 million. As of December 31, 2021, $245.4 million was available for repurchases under the
plan. Our stock repurchases are used primarily to offset dilution from our equity incentive plans and for strategic initiatives.
Dividends. We paid quarterly cash dividends of $0.38 per share in March, June, September and December of 2021, for a total of $19.3 million, $19.0 million, $19.0 million
and $18.9 million, respectively. In February 2022, our board of directors declared a quarterly cash dividend of $0.385 per share to be paid on March 9, 2022 to stockholders of record on February 28, 2022. Currently, we anticipate that our board of
directors will continue to declare quarterly cash dividends and that the cash flows from operations will be sufficient to fund our future dividend payments. However, the continued declaration of dividends is subject to the discretion of our board of
directors and will depend upon various factors, including our net earnings, financial condition, cash requirements, future prospects and other relevant factors.
Cash from foreign subsidiaries. As of December 31, 2021 and 2020, we held $354.8 million and $423.9 million, respectively, in cash and cash equivalents, including current investments.
These amounts include $274.9 million and $374.7 million as of December 31, 2021 and 2020, respectively, held in our operations outside of the United States. Substantially all of our non-U.S. cash and cash equivalents are readily convertible into
U.S. dollars or other currencies, subject to procedural or other requirements in certain markets, as well as an indefinite-reinvestment designation, as described below.
We typically fund the cash requirements of our operations in the United States through intercompany dividends, intercompany loans and intercompany charges for products, use of
intangible property, and corporate services. However, some markets impose government-approval or other requirements for the repatriation of dividends. For example, in Mainland China, we are unable to repatriate cash from current operations in the
form of dividends until we file the necessary statutory financial statements for the relevant period. As of December 31, 2021 and 2020, we had $50.3 million and $103.0 million, respectively, in cash denominated in Chinese RMB. We also
have experienced delays in repatriating cash from Argentina. As of December 31, 2021 and 2020, we had $11.3 million and $10.6 million, respectively, in intercompany receivable with our Argentina subsidiary. We
also have intercompany loan arrangements with some of our markets, including Mainland China, that allow us to access available cash, subject to certain limits in Mainland China and other jurisdictions. We also have drawn on our revolving line of
credit to address cash needs until we can repatriate cash from Mainland China or other markets, and we may continue to do so. Except for $60 million of earnings in Mainland China that we designated as indefinitely reinvested during the second
quarter of 2018, we currently plan to repatriate undistributed earnings from our non-U.S. operations as necessary, considering the cash needs of our non-U.S. operations and the cash needs of our U.S. operations for dividends, stock repurchases,
capital investments, debt repayment and strategic transactions. Repatriation of non-U.S. earnings is subject to withholding taxes in certain foreign jurisdictions. Accordingly, we have accrued the necessary withholding taxes related to the
non-U.S. earnings.
We currently believe that existing cash balances, future cash flows from operations and existing lines of credit will be adequate to fund our cash needs on both a short- and long-term basis. The
majority of our historical expenses have been variable in nature and as such, a potential reduction in the level of revenue would reduce our cash flow needs. In the event that our current cash balances, future cash flow from operations and current
lines of credit are not sufficient to meet our obligations or strategic needs, we would consider raising additional funds in the debt or equity markets or restructuring our current debt obligations. Additionally, we would consider realigning our
strategic plans, including a reduction in capital spending, stock repurchases or dividend payments.
Non-GAAP Financial Measures
Constant-currency revenue change is a non-GAAP financial measure that removes the impact of fluctuations in foreign-currency exchange rates, thereby facilitating period-to-period comparisons of the Company’s
performance. It is calculated by translating the current period’s revenue at the same average exchange rates in effect during the applicable prior-year period and then comparing that amount to the prior-year period’s revenue. We believe that
constant-currency revenue change is useful to investors, lenders, and analysts because such information enables them to gauge the impact of foreign-currency fluctuations on our revenue from period to period.
Contingent Liabilities
Please refer to Note 16 to the consolidated financial statements contained in this report for information regarding our contingent liabilities.
Seasonality and Cyclicality
In addition to general economic factors, we are impacted by seasonal factors and trends such as major cultural events and vacation patterns. For example, most Asian markets celebrate their
respective local New Year in the first quarter, which generally has a negative impact on that quarter. We believe that direct selling is also generally negatively impacted during the third quarter, when many individuals, including our sales force,
traditionally take vacations.
Prior to making a key product generally available for purchase, we often do one or more introductory offerings of the product, such as a preview of the product to our Sales Leaders or other
product introduction or promotion. These offerings may generate significant activity and a high level of purchasing, which can result in a higher-than-normal increase in revenue, Sales Leaders and/or Customers during the quarter and can skew
year-over-year and sequential comparisons.
Recent Accounting Pronouncements
A description of new accounting pronouncements is contained in Note 2 to consolidated financial statements contained in this report..
Currency Risk and Exchange Rate Information
A majority of our revenue and many of our expenses are recognized outside of the United States, except for inventory purchases, a significant portion of which are primarily transacted in U.S.
dollars from vendors in the United States. The local currency of each of our Subsidiaries’ primary markets is considered the functional currency with the exception of our Asia product-distribution subsidiary in Singapore and, as discussed below,
our subsidiary in Argentina. All revenue and expenses are translated at weighted-average exchange rates for the periods reported. Therefore, our reported revenue and earnings will be positively impacted by a weakening of the U.S. dollar and will be
negatively impacted by a strengthening of the U.S. dollar. These impacts may be significant because a large portion of our business is derived from outside of the United States. Given the uncertainty of exchange rate fluctuations, it is difficult
to predict the effect of these fluctuations on our future business, product pricing and results of operations or financial condition.
In the second quarter of 2018, published inflation indices indicated that the three-year cumulative inflation in Argentina exceeded 100%, and as of July 1, 2018, we elected to adopt highly
inflationary accounting for our subsidiary in Argentina. Under highly inflationary accounting, Argentina’s functional currency became the U.S. dollar, and its income statement and balance sheet have been measured in U.S. dollars using both current
and historical rates of exchange. The effect of changes in exchange rates on peso-denominated monetary assets and liabilities has been reflected in earnings in Other income (expense), net and was not material. As of December 31, 2021, our Argentina
subsidiary had a small net peso monetary position. Net sales of Argentina were less than 2% of our consolidated net sales for 2021, 2020 and 2019.
We may seek to reduce our exposure to fluctuations in foreign currency exchange rates through the use of foreign currency exchange contracts and through intercompany loans of foreign currency. We
do not use derivative financial instruments for trading or speculative purposes. We regularly monitor our foreign currency risks and periodically take measures to reduce the impact of foreign exchange fluctuations on our operating results. As of
December 31, 2021, and 2020, we did not hold non-designated mark-to-market forward derivative contracts to hedge foreign-denominated intercompany positions or third-party foreign debt. As of December 31, 2021 and 2020, we did not hold any forward
contracts designated as foreign-currency cash flow hedges. We continue to evaluate our foreign currency hedging policy.
Following are the weighted-average currency exchange rates of U.S. $1 into local currency for each of our international or foreign markets in which revenue exceeded U.S. $5.0 million for at least
one of the quarters listed:
|
2021
|
2020
|
|||||||||||||||||||||||||||||||
|
4th Quarter
|
3rd Quarter
|
2nd Quarter
|
1st Quarter
|
4th Quarter
|
3rd Quarter
|
2nd Quarter
|
1st Quarter
|
|||||||||||||||||||||||||
|
Argentina
|
100.5
|
97.4
|
93.9
|
88.8
|
79.5
|
73.0
|
67.4
|
61.4
|
||||||||||||||||||||||||
|
Australia
|
1.4
|
1.4
|
1.3
|
1.3
|
1.4
|
1.4
|
1.5
|
1.5
|
||||||||||||||||||||||||
|
Canada
|
1.3
|
1.3
|
1.2
|
1.3
|
1.3
|
1.3
|
1.4
|
1.3
|
||||||||||||||||||||||||
|
Colombia
|
3,882.7
|
3,840.4
|
3,690.7
|
3,560.4
|
3,694.6
|
3,717.7
|
3,694.6
|
3,515.3
|
||||||||||||||||||||||||
|
Chile
|
827.4
|
773.6
|
716.8
|
724.0
|
757.0
|
780.5
|
818.1
|
801.1
|
||||||||||||||||||||||||
|
Eurozone countries
|
0.9
|
0.8
|
0.8
|
0.8
|
0.8
|
0.9
|
0.9
|
0.9
|
||||||||||||||||||||||||
|
Hong Kong
|
7.8
|
7.8
|
7.8
|
7.8
|
7.8
|
7.8
|
7.8
|
7.8
|
||||||||||||||||||||||||
|
Indonesia
|
14,274
|
14,373
|
14,393
|
14,202
|
14,339
|
14,722
|
14,880
|
14,265
|
||||||||||||||||||||||||
|
Japan
|
113.6
|
110.1
|
109.5
|
106.0
|
104.4
|
106.1
|
107.6
|
108.9
|
||||||||||||||||||||||||
|
Mainland China
|
6.4
|
6.5
|
6.5
|
6.5
|
6.6
|
6.9
|
7.1
|
7.0
|
||||||||||||||||||||||||
|
Malaysia
|
4.2
|
4.2
|
4.1
|
4.1
|
4.1
|
4.2
|
4.3
|
4.2
|
||||||||||||||||||||||||
|
Mexico
|
20.7
|
20.0
|
20.0
|
20.4
|
20.6
|
22.1
|
23.2
|
19.8
|
||||||||||||||||||||||||
|
Philippines
|
50.4
|
50.2
|
48.2
|
48.3
|
48.3
|
48.9
|
50.4
|
50.9
|
||||||||||||||||||||||||
|
Singapore
|
1.4
|
1.4
|
1.3
|
1.3
|
1.3
|
1.4
|
1.4
|
1.4
|
||||||||||||||||||||||||
|
South Africa
|
15.4
|
14.6
|
14.1
|
15.0
|
15.6
|
16.9
|
17.7
|
15.3
|
||||||||||||||||||||||||
|
South Korea
|
1,183.8
|
1,159.7
|
1,121.2
|
1,115.3
|
1,117.2
|
1,188.8
|
1,219.9
|
1,192.3
|
||||||||||||||||||||||||
|
Taiwan
|
27.8
|
27.9
|
28.0
|
28.1
|
28.4
|
29.3
|
29.9
|
30.1
|
||||||||||||||||||||||||
|
Thailand
|
33.3
|
32.9
|
31.4
|
30.3
|
30.6
|
31.3
|
31.9
|
31.3
|
||||||||||||||||||||||||
|
Vietnam
|
22,780
|
22,889
|
23,041
|
23,052
|
23,154
|
23,182
|
23,353
|
23,235
|
||||||||||||||||||||||||
Interest Rate Risk
We are exposed to risks related to fluctuations in interest rates on our outstanding variable rate debt. As of December 31, 2021, we had $376.3 million outstanding on the term loan, net of unamortized debt issuance cost and outstanding borrowings
on our revolving credit facility. Our four interest rate swaps reduce our exposure to interest rate risk on our term loan by $200.0 million as of December 31, 2021. As a result, the total variable debt of $176.3 million was exposed to market risks
as of December 31, 2021. A hypothetical one percentage point increase (decrease) in interest rates on our variable rate debt would increase (decrease) our annual interest expense by approximately $1.8 million.
For variable rate debt, interest rate changes generally do not affect the fair value of the debt instrument, but do impact future earnings and cash flows, assuming other factors are held constant. We have not entered
into and currently do not hold derivatives for trading or speculative purposes.
LIBOR is used as a reference rate for our term loan, revolving credit facility and our interest rate swap agreements we use to hedge our interest rate exposure. In 2017, the Financial Conduct Authority announced that
it intends to stop compelling banks to submit rates for the calculation of LIBOR after 2021, and it is unclear whether new methods of calculating LIBOR will be established. Our Credit Agreement includes a provision related to the potential
discontinuance of LIBOR to be replaced with one or more Secured Overnight Financing Rate (SOFR) values or another alternate benchmark rate. However, if LIBOR ceases to exist after 2021, the interest rates under the alternative rate could be higher
than LIBOR. In addition, the value of derivative instruments tied to LIBOR could also be impacted if LIBOR is limited or discontinued. We continue to review the impact the LIBOR phase-out will have on the Company.
For additional information about our market risk see Note 14 to the consolidated financial statements contained in this report.