PART I
ITEM 1. BUSINESS.
BUSINESS OVERVIEW
We help organizations around the world protect their information, reduce storage costs, comply with regulations, facilitate corporate disaster recovery, and better use their information and IT infrastructure for business advantages, regardless of its format, location or life cycle stage. We do this by storing physical records and data backup media, offering information management solutions, and providing data center space for enterprise-class colocation and hyperscale deployments. We offer comprehensive records and information management services and data management services, along with the expertise and experience to address complex storage and information management challenges such as rising storage rental costs, legal and regulatory compliance, and disaster recovery requirements. We provide secure and reliable data center facilities to protect digital information and ensure the continued operation of our customers’ IT infrastructure, with reliable and flexible deployment options.
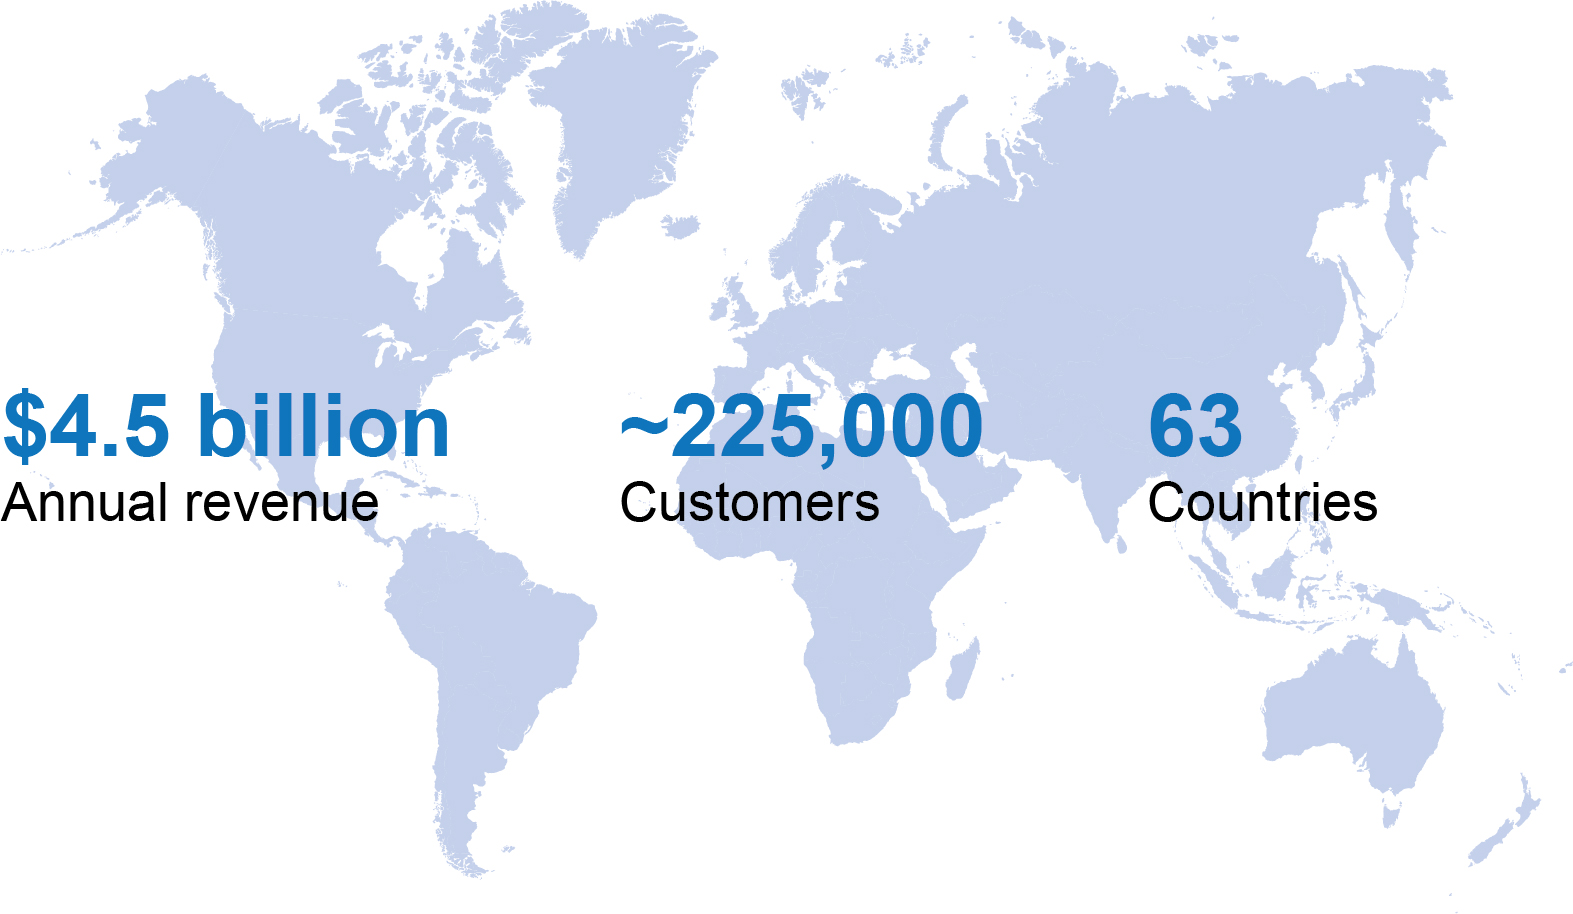
Founded in an underground facility near Hudson, New York in 1951, Iron Mountain Incorporated, a Delaware corporation, has approximately 225,000 customers in a variety of industries in 63 countries around the world, as of December 31, 2021. We currently serve customers across an array of market verticals - commercial, legal, financial, healthcare, insurance, life sciences, energy, business services, entertainment and government organizations, including approximately 95% of the Fortune 1000. As of December 31, 2021, we employed approximately 25,000 people. We are listed on the New York Stock Exchange (the “NYSE”) and are a constituent of the Standard & Poor’s 500 Index and the MSCI REIT index. As of December 31, 2021, we were number 605 on the Fortune 1000.
We have been organized and have operated as a REIT beginning with our taxable year ended December 31, 2014.
BUSINESS STRATEGY
OVERVIEW
Our company has been a market leader in the physical ecosystem supporting information storage and retrieval, as most businesses have relied on paper documents or computer tapes to store their valuable information. Over time, customers are increasing their digital information, with the new information storage ecosystem being a hybrid of physical and digital mediums. We are a different company than the one we have been historically. The strategic journey we are on is driving this change and our focus remains on four pillars outlined below to grow our business.
| | | | | |
| |
Continued growth in physical storage through revenue management as well as volume growth achieved in faster growing emerging markets and consumer and adjacent business growth in developed markets | •We are establishing and enhancing leadership positions in higher-growth markets such as central and eastern Europe, Latin America, Asia and Africa, through both organic expansion and acquisitions in countries where GDP growth is faster and outsourcing information management is at an earlier stage. •We continue to identify, acquire, incubate and scale complementary businesses and products to support our long-term growth objectives and drive solid returns on invested capital. These opportunities include our digital services and our ALM, Entertainment Services, Fine Arts and Consumer Storage (each as defined below) businesses. |
| |
| |
Utilizing our global scale as well as 70 years of customer trust to deliver differentiated data center offerings | •We have made significant progress in scaling our Global Data Center Business through acquisitions and organic growth, with 19 operating data centers across 16 global markets. •As of December 31, 2021, approximately 89% of our data center capacity was leased. With total potential capacity of 604 megawatts ("MW") in land and buildings currently owned or operated by us, we are among the largest global data center operators. |
| |
Developing and offering new products and services that allow our customers to achieve reliable and secure information management solutions in an increasingly hybrid physical and digital world | •Our customers are faced with navigating a more complex regulatory environment, and one in which hybrid physical and digital solutions have become the norm. Our strategy is underpinned by our persistent focus on best-in-class customer experience, as we continue to seek innovative solutions to help our customers progress on their journey from physical storage to a digital ecosystem. |
| |
| | | | | |
| Increased investment in our business and customer-centric solutions | •We have established an investment strategy to fuel our growth. The investments are enabled by the success of Project Summit and informed by our established leadership position in the physical storage business, expanding services, and our significant progress in the Global Data Center business. |
| |
| |
PROJECT SUMMIT
In October 2019, we announced our global program ("Project Summit") designed to better position us for future growth and achievement of our strategic objectives. We expanded Project Summit during the first quarter of 2020 to include additional opportunities to streamline our business and operations, as well as accelerated the timing of certain opportunities previously identified. As a result of this initiative, we simplified our global structure, rebalanced resources to focus on higher growth areas, realigned our management structure to create a more dynamic, agile organization, and made investments to enhance the customer experience. All Project Summit activities were completed in 2021, resulting in $375.0 million in annual Adjusted EBITDA benefits of which $165.0 million were delivered in 2020 and $160.0 million were delivered in 2021, with the remainder to come in 2022. Project Summit charges totaled approximately $450.0 million since the program's inception. For further details on Project Summit, see the "Overview" section of “Item 7. Management’s Discussion and Analysis of Financial Condition and Results of Operations” in this Exhibit 99.1 to this Current Report.
BUSINESS SEGMENTS
The amount of revenues derived from our business segments and other relevant data, including financial information about geographic areas and product and service lines, for the years ended December 31, 2021, 2020 and 2019, are set forth in Note 11 to Notes to Consolidated Financial Statements included in this Exhibit 99.1 to this Current Report.
The Global RIM Business segment includes several distinct offerings.
Records Management, stores physical records and provides healthcare information services, vital records services, courier operations, and the collection, handling and disposal of sensitive documents (collectively, “Records Management”) for customers in 63 countries around the globe. As of December 31, 2021, we stored approximately 740 million cubic feet of hardcopy records.
Data Management, provides storage and rotation of backup computer media as part of corporate disaster recovery plans, including service and courier operations (“Data Protection & Recovery”); server and computer backup services; and related services offerings, (collectively, “Data Management”).
Global Digital Solutions (“GDS”), develops, implements and supports comprehensive storage and information management solutions for the complete lifecycle of our customers’ information, including the management of physical records, conversion of documents to digital formats and digital storage of information, primarily in the United States and Canada.
Secure Shredding, includes the scheduled pick-up of office records that customers accumulate in specially designed secure containers we provide and is a natural extension of our hardcopy records management operations, completing the lifecycle of a record. Through a combination of shredding facilities and mobile shredding units consisting of custom built trucks, we are able to offer secure shredding services to our customers throughout the United States, Canada and South Africa.
Entertainment Services, entertainment and media services which help industry clients store, safeguard and deliver physical media of all types, and provides digital content repository systems that house, distribute, and archive key media assets, throughout the United States, Canada, France, China - Hong Kong S.A.R, the Netherlands and the United Kingdom.
Consumer Storage, provides on-demand, valet storage for consumers (“Consumer Storage”) across 31 markets in North America through a strategic partnership that utilizes data analytics and machine learning to provide effective customer acquisition and a convenient and seamless consumer storage experience.
| | |
|
| GLOBAL DATA CENTER BUSINESS |
|
The Global Data Center Business segment provides enterprise-class data center facilities and hyperscale-ready capacity to protect mission-critical assets and ensure the continued operation of our customers’ IT infrastructure, with secure, reliable and flexible data center options. The world’s most heavily regulated organizations have trusted us with their data centers for over 15 years, and as of December 31, 2021, five of the top 10 global cloud providers were Iron Mountain Data Center customers.
As of December 31, 2021, our Global Data Center Business footprint spans nine markets in the United States and seven international markets.
| | | | | |
| |
| UNITED STATES | INTERNATIONAL MARKETS |
Denver, Colorado | Amsterdam |
Kansas City, Missouri | London |
Boston, Massachusetts | Singapore |
Boyers, Pennsylvania | Frankfurt (directly and through an unconsolidated joint venture) |
Manassas, Virginia | Mumbai (through an unconsolidated joint venture) |
Edison, New Jersey | Pune (through an unconsolidated joint venture) |
Columbus, Ohio | Noida (through an unconsolidated joint venture) |
Phoenix and Scottsdale, Arizona | |
| | |
|
| CORPORATE AND OTHER BUSINESS |
|
Corporate and Other Business consists primarily of our Fine Arts and Asset Lifecycle Management businesses and other corporate items.
Fine Arts, provides technical expertise in the handling, installation and storing of art in the United States, Canada and Europe.
Asset Lifecycle Management ("ALM"), provides hyperscale and corporate IT infrastructure managers with services and solutions that enable the decommissioning and disposition or sale of IT hardware and component assets. ALM services are enabled by: secure logistics and chain of custody practices, environmentally-responsible asset processing and recycling, and data sanitization and asset refurbishment services that enable value recovery through asset remarketing. Our ALM services focus on protecting and eradicating customer data while maintaining strong, auditable and transparent chain of custody practices.
Corporate and Other Business also includes costs related to executive and staff functions, including finance, human resources and IT, which benefit the enterprise as a whole.
BUSINESS ATTRIBUTES
Our business has the following attributes:
| | | | | |
| |
Large, Diversified, Global Business | The world’s most heavily regulated organizations trust us with the storage of their records. Our mission-critical storage offerings and related services generated approximately $4.5 billion in annual revenue in 2021. Our business has a highly diverse customer base of approximately 225,000 customers - with no single customer accounting for more than approximately 1% of revenue during the year ended December 31, 2021 - and operates in 63 countries globally. This presents a significant cross-sell opportunity for our Global Data Center, Global Digital Solutions and ALM businesses. |
| |
| |
Recurring, Durable Revenue Stream | We generate a majority of our revenues from contracted storage rental fees, via agreements that generally range from one to five years in length. Historically, in our Records Management business, we have seen strong customer retention (of approximately 98%) and solid physical records retention; more than 50% of physical records that entered our facilities 15 years ago are still with us today. We have also seen strong customer retention in our Global Data Center Business. |
| |
| |
Comprehensive Information Management Solution | As an S&P 500 REIT with approximately 1,450 locations globally and with offerings spanning physical storage, digitization solutions and digital storage, we are positioned to provide a holistic offering to our customers. We are able to cater to our customers’ physical and digital needs and to help guide their digital transformation journey. |
| |
| |
Significant Owner and Operator of Real Estate | We operate approximately 95 million square feet of real estate worldwide. Our owned real estate footprint spans nearly 25 million square feet and is concentrated in major metropolitan statistical areas in North America, Western Europe and Latin America. |
| |
| |
Limited Revenue Cyclicality | Historically, economic downturns have not significantly affected our storage rental business. Due to the durability of our total global physical volumes, the success of our revenue management initiatives, and the growth of our Global Data Center Business, we believe we can continue to grow organic storage rental revenue over time. |
| |
| |
Shifting Revenue Mix | We have identified a number of areas where we see opportunity for growth as we position ourselves to unlock greater value for our customers. These business lines, including Data Center, Fine Arts and Entertainment Services, Consumer Storage and ALM, represent markets with strong secular growth. |
| |
In addition, our Global Data Center business has the following attributes:
| | | | | |
| |
Large Data Center Platform with Significant Expansion Opportunity | As of December 31, 2021, we had 177 MW of leasable capacity with an additional 427 MW under construction or held for development. |
| |
| |
Differentiated Compliance and Security | We offer comprehensive compliance support and physical and cyber security. Our Security-in-Depth approach to security includes a combination of technical and human security measures, and experienced senior military and public sector security leaders oversee our security. As of December 31, 2021, our data centers comply with one of the most comprehensive compliance programs in the industry, including enterprise-wide certified ISO 14001 and 50001 environmental and energy management systems. We also report globally on service organizational controls, as well as global ISO 27001 certification, and PCI-DSS compliance, and met FISMA HIGH and FedRAMP controls in the United States. |
| |
| |
Efficient Access and Flexibility | We have the ability to provide customers with a range of deployment options from one cabinet to an entire building, leveraging our global portfolio of hyperscale-ready and underground data centers. We also provide access to numerous carriers, cloud providers and peering exchanges with migration support and IT. |
| |
| |
100% Green Powered Data Centers | As of December 31, 2021, our Global Data Center platform was powered by 100% renewable energy, with carbon credit assistance and low power usage effectiveness (“PUE"). We are one of the top 30 buyers of renewable energy among the Fortune 1000 and now offer the Green Power Pass, which allows customers to include the power they consume at any Iron Mountain data centers as green power in their CDP, RE100, GRI, or other sustainability reporting. |
| |
COMPETITION
We compete with thousands of storage and information management services providers around the world as well as storage and information management services managed and operated internally by organizations. We believe that competition for records and information customers is based on price, reputation and reliability, quality and security of storage, quality of service and scope and scale of technology. While the majority of our competitors operate in only one market or region, we believe we provide a differentiated global offering that competes effectively in these areas.
We also compete with numerous data center developers, owners and operators, many of whom own properties similar to ours in some of the same metropolitan areas where our facilities are located. We believe that competition for data center customers is based on availability of power, security considerations, location, connectivity and rental rates, and we generally believe we compete effectively in each of these areas. Additionally, we believe our strong brand, global footprint and excellent commercial relationships enable us to compete successfully and provide significant cross-sell opportunities with our existing customer base.
HUMAN CAPITAL MANAGEMENT
EMPLOYEES
As of December 31, 2021, we employed approximately 9,000 employees in the United States and approximately 16,000 employees outside of the United States. As of December 31, 2021, approximately 500 employees were represented by unions in North America and approximately 1,250 employees were represented by unions in Latin America. All union employees are currently under renewed labor agreements or operating under an extension agreement.
BENEFIT PROGRAMS
We provide our employees with benefits that are designed to support their overall physical, financial, emotional and social well-being. These benefits vary by location but may include health and welfare benefits, paid time off, and programs to support financial security. Additionally, employees are able to access emotional well-being resources through global employee assistance programs. Certain unionized employees receive benefits through unions and are not eligible to participate in our benefit programs. In addition to base compensation and other usual benefits, a significant portion of full-time employees participate in some form of incentive-based compensation program that provides payments based on revenues, profits or attainment of specific objectives for the unit in which they work.
DIVERSITY, EQUITY AND INCLUSION
At Iron Mountain, we believe that an inclusive environment with diverse teams produces more creative solutions, results in better, more innovative products and services and is crucial to our efforts to attract and retain key talent. As one of our five core company values, Promoting Including and Teamwork is a behavior all of our employees are expected to demonstrate every day. We have prioritized diversity, equity and inclusion ("DEI") as part of our corporate-wide strategic goals. Steps we have taken to create and sustain a more diverse, equitable and inclusive environment include: hiring a Global Chief Diversity, Equity & Inclusion Officer with significant DEI experience to lead our cultural transformation, the path to creating an environment of inclusiveness and belonging. We review and revise our systems, policies and processes to assure that our structures facilitate inclusiveness and accountability. We ensure that our recruiting efforts reflect our diversity goals and we launch, expand and support our Employee Resource Groups, who meet and connect on shared characteristics and life experiences that can prove impactful to our business, our customers and our employees.
COMPANY CULTURE
We recognize that an inspired culture is foundational to how we deliver on our purpose and create sustained growth and value for our shareholders. Iron Mountain's culture is deeply rooted in its enduring values: Act with Integrity, Own Safety and Security, Build Customer Value, Take Ownership and Promote Inclusion and Teamwork. While Iron Mountain is a culture of learning, collaboration, diversity and well-being, we know that culture overall comes down to what it feels like to work at Iron Mountain. This is why we celebrate our employees who consistently demonstrate Iron Mountain's values in measurable ways while inspiring others to do the same. We commit significant resources to sustaining a culture that enables innovation and facilitates trust, engagement, belonging and performance. We regularly survey our employees on a range of topics to measure our effectiveness and to obtain their views. In addition, headcount data and cost analyses offer insights into how and where our employees work. We use all of this information to refine our approach when necessary to drive increased employee engagement and success.
COMMUNITY INVOLVEMENT
We are committed to integrating responsible and sustainable practices throughout our organization to help our operations to have a positive impact on the environment and the communities in which we operate. We aim to give back to the communities where we live and work, and believe that this commitment helps in our efforts to attract and retain employees. We offer philanthropic support to our global community through our Living Legacy Initiative, which is our commitment to help preserve and make accessible cultural and historical information and artifacts. We encourage volunteerism in the communities in which we live and work through our Moving Mountains volunteer program, offering paid time off for employees to help community-based and civic-minded organizations.
INSURANCE
For strategic risk transfer purposes, we maintain a comprehensive insurance program with insurers that we believe to be reputable and that have adequate capitalization in amounts that we believe to be appropriate. Property insurance is purchased on a comprehensive basis, including flood and earthquake (including excess coverage), subject to certain policy conditions, sublimits and deductibles. Property is insured based upon the replacement cost of real and personal property, including leasehold improvements, business income loss and extra expense. Other types of insurance that we carry, which are also subject to certain policy conditions, sublimits and deductibles, include medical, workers’ compensation, general liability, umbrella, automobile, professional, warehouse legal liability and directors’ and officers’ liability policies.
GOVERNMENT REGULATION
We are required to comply with numerous U.S. federal, state, and foreign laws and regulations covering a wide variety of subject matters which may have a material effect on our capital expenditures, earnings and competitive position.
For example, some of our current and formerly owned or leased properties were previously used by entities other than us for industrial or other purposes, or were affected by waste generated from nearby properties, that involved the use, storage, generation and/or disposal of hazardous substances and wastes, including petroleum products. In some instances, this prior use involved the operation of underground storage tanks or the presence of asbestos-containing materials. Where we are aware of environmental conditions that require remediation, we undertake appropriate activity, in accordance with all legal requirements. Although we have from time to time conducted limited environmental investigations and remedial activities at some of our former and current facilities, we have not undertaken an environmental review of all of our properties, including those we have acquired. We therefore may be potentially liable for environmental cost and may be unable to sell, rent, mortgage or use contaminated real estate owned or leased by us. Under various federal, state and local environmental laws, we may be liable for environmental compliance and remediation costs to address contamination, if any, located at owned and leased properties as well as damages arising from such contamination, whether or not we know of, or were responsible for, the contamination, or the contamination occurred while we owned or leased the property. Environmental conditions for which we might be liable may also exist at properties that we may acquire in the future. In addition, future regulatory action and environmental laws may impose costs for environmental compliance that do not exist today.
We transfer a portion of our risk of financial loss due to currently undetected environmental matters by purchasing an environmental impairment liability insurance policy, which covers all owned and leased locations. Coverage is provided for both liability and remediation costs.
In addition, we are subject to numerous U.S. federal, state, local and foreign laws and regulations relating to data privacy and cybersecurity, which are complex, change frequently and have tended to become more stringent over time. We devote substantial resources, and may in the future have to devote significant additional resources, to facilitate compliance with these laws and regulations, and to investigate, defend or remedy actual or alleged violations or breaches. Any failure by us to comply with, or remedy any violations or breaches of, these laws and regulations could result in the curtailment of certain of our operations, the imposition of fines and penalties, liability resulting from litigation, restrictions on our ability to carry on or expand our operations, significant costs and expenses and reputational harm.
For more information about laws and regulations that could affect our business, see “Item 1A. Risk Factors” included in our Original Annual Report (as defined below).
CORPORATE SOCIAL RESPONSIBILITY
Through our approach to Corporate Social Responsibility, we not only see ourselves as having our own responsibility to society, but also in helping our customers with their own environmental, social and governance (ESG) goals, and helping them gain value, make improvements and save costs. We are committed to responsible, sustainable growth. To that end, we have publicly adopted 20 goals to address our environmental footprint, corporate philanthropy and volunteerism and DEI practices. As signatories of The Climate Pledge, we are on a path to reach net zero carbon emissions by 2040. We are committed to the safety and well-being of our employees and strive to cultivate a culture of inclusion that values diverse perspectives across our global workforce. Iron Mountain and its employees also make a social impact in the communities in which we operate through charitable giving and volunteerism.
We have been recognized for our commitment to Corporate Social Responsibility. We ranked 93rd on Newsweek’s 2022 list of America’s Most Responsible Companies. We were a top scorer on the Disability Equality Index in 2020 and 2021. We received a 100% on the Human Rights Campaign Corporate Equality Index for each of the years 2018 through 2022.
We are committed to transparent reporting on sustainability and corporate responsibility efforts in accordance with the guidelines of the Global Reporting Initiative. Our corporate responsibility report highlights our progress against key measures of success for our efforts in the community, our environment, and for our people. We are a member of the FTSE4 Good Index, MSCI World ESG Index, MSCI World Climate Change Index and MSCI USA ESG Select Index, each of which include companies that meet globally recognized corporate responsibility standards. A copy of our corporate responsibility report is available on the “About Us” section of our website, www.ironmountain.com, under the heading “Corporate Social Responsibility." We are not including the information contained on or available through our website as part of, or incorporating such information by reference into, this Exhibit 99.1 to this Current Report. In addition, we continue to work to further align our reporting with the recommendations of the Financial Stability Board’s Task Force on Climate-related Financial Disclosures to disclose climate-related financial risks and opportunities.
| | | | | |
| |
STRONG SUSTAINABILITY FOCUS •Green Power Pass solution in Data Center market to help customers manage their carbon footprint. •Part of RE100 Initiative — commitment to using renewable energy sources for 100% of our worldwide electricity. •Founding signatory of the 24/7 Carbon-Free Energy (CFE) Compact committed to consuming carbon-free electricity every hour on every grid where we operate. •81% of our global electricity use - including 100% of the electricity used to power our Data Center business was from renewable sources in 2020. •Reduced GHG emissions by 62% (since 2016) as part of our Science Based Target and net zero by 2040 commitment. •Received a 100% on the Human Rights Campaign Corporate Equality Index for each of the years 2018 through 2022. |
|
|
INTERNET WEBSITE
Our Internet address is www.ironmountain.com. Under the “Investors” section on our website, we make available, free of charge, our Annual Reports on Form 10-K, our Quarterly Reports on Form 10-Q, our Current Reports on Form 8-K and amendments to those reports filed or furnished pursuant to Section 13(a) or 15(d) of the Securities Exchange Act of 1934 (the “Exchange Act”) as soon as reasonably practicable after such forms are filed with or furnished to the SEC. We are not including the information contained on or available through our website as a part of, or incorporating such information by reference into, this Exhibit 99.1 to this Current Report. Copies of our corporate governance guidelines, code of ethics and the charters of our audit, compensation, finance, nominating and governance, risk and safety, and technology committees are available on the “Investors” section of our website, www.ironmountain.com, under the heading “Corporate Governance."
ITEM 2. PROPERTIES.
As of December 31, 2021, we conducted operations through 1,184 leased facilities and 263 owned facilities. Our facilities are divided among our reportable operating segments as follows: Global RIM Business (1,386), Global Data Center Business (17) and Corporate and Other Business (44). These facilities contain a total of approximately 94.6 million square feet of space. A breakdown of owned and leased facilities by country (and by state within the United States) is listed below:
| | | | | | | | | | | | | | | | | | | | | | | | | | | | | | | | | | | | | | | | | | | | | | | | | | | | | | | | | | | | | | | | | | | | | | | |
| | LEASED | | OWNED | | TOTAL |
| COUNTRY/STATE | NUMBER | | SQUARE FEET | | NUMBER | | SQUARE FEET | | NUMBER | | SQUARE FEET |
| North America | | | | | | | | | | | | | | | | | | | | | | | |
| United States (Including Puerto Rico) | | | | | | | | | | | | | | | | | | | | | | | |
| Alabama | | 3 | | | | | 312,473 | | | | | 1 | | | | | 12,621 | | | | | 4 | | | | | 325,094 | | |
| Arizona | | 8 | | | | | 496,448 | | | | | 6 | | | | | 1,207,281 | | | | | 14 | | | | | 1,703,729 | | |
| Arkansas | | 2 | | | | | 63,604 | | | | | — | | | | | — | | | | | 2 | | | | | 63,604 | | |
| California | | 67 | | | | | 5,908,150 | | | | | 10 | | | | | 958,856 | | | | | 77 | | | | | 6,867,006 | | |
| Colorado | | 8 | | | | | 466,336 | | | | | 4 | | | | | 484,490 | | | | | 12 | | | | | 950,826 | | |
| Connecticut | | 6 | | | | | 309,836 | | | | | 3 | | | | | 527,666 | | | | | 9 | | | | | 837,502 | | |
| Delaware | | 3 | | | | | 239,640 | | | | | 1 | | | | | 120,921 | | | | | 4 | | | | | 360,561 | | |
| District of Columbia | | 1 | | | | | 1,670 | | | | | — | | | | | — | | | | | 1 | | | | | 1,670 | | |
| Florida | | 31 | | | | | 2,240,035 | | | | | 5 | | | | | 263,930 | | | | | 36 | | | | | 2,503,965 | | |
| Georgia | | 9 | | | | | 798,880 | | | | | 5 | | | | | 265,049 | | | | | 14 | | | | | 1,063,929 | | |
| Idaho | | 2 | | | | | 105,021 | | | | | — | | | | | — | | | | | 2 | | | | | 105,021 | | |
| Illinois | | 15 | | | | | 1,213,808 | | | | | 7 | | | | | 1,309,975 | | | | | 22 | | | | | 2,523,783 | | |
| Indiana | | 6 | | | | | 344,516 | | | | | — | | | | | — | | | | | 6 | | | | | 344,516 | | |
| Iowa | | 2 | | | | | 145,138 | | | | | 1 | | | | | 14,200 | | | | | 3 | | | | | 159,338 | | |
| Kansas | | 3 | | | | | 253,919 | | | | | — | | | | | — | | | | | 3 | | | | | 253,919 | | |
| Kentucky | | 2 | | | | | 64,000 | | | | | 4 | | | | | 418,760 | | | | | 6 | | | | | 482,760 | | |
| Louisiana | | 4 | | | | | 388,475 | | | | | — | | | | | — | | | | | 4 | | | | | 388,475 | | |
| Maine | | — | | | | | — | | | | | 1 | | | | | 95,000 | | | | | 1 | | | | | 95,000 | | |
| Maryland | | 20 | | | | | 2,139,060 | | | | | 2 | | | | | 83,442 | | | | | 22 | | | | | 2,222,502 | | |
| Massachusetts (including Corporate Headquarters) | | 8 | | | | | 545,039 | | | | | 7 | | | | | 1,025,167 | | | | | 15 | | | | | 1,570,206 | | |
| Michigan | | 17 | | | | | 1,068,499 | | | | | 2 | | | | | 62,300 | | | | | 19 | | | | | 1,130,799 | | |
| Minnesota | | 12 | | | | | 908,474 | | | | | — | | | | | — | | | | | 12 | | | | | 908,474 | | |
| Mississippi | | 3 | | | | | 201,300 | | | | | — | | | | | — | | | | | 3 | | | | | 201,300 | | |
| Missouri | | 13 | | | | | 1,548,828 | | | | | 1 | | | | | 25,120 | | | | | 14 | | | | | 1,573,948 | | |
| Montana | | 3 | | | | | 38,548 | | | | | — | | | | | — | | | | | 3 | | | | | 38,548 | | |
| Nebraska | | 1 | | | | | 34,560 | | | | | 2 | | | | | 266,733 | | | | | 3 | | | | | 301,293 | | |
| Nevada | | 7 | | | | | 276,520 | | | | | 1 | | | | | 107,041 | | | | | 8 | | | | | 383,561 | | |
| New Hampshire | | — | | | | | — | | | | | 1 | | | | | 146,467 | | | | | 1 | | | | | 146,467 | | |
| New Jersey | | 33 | | | | | 3,074,071 | | | | | 8 | | | | | 2,476,635 | | | | | 41 | | | | | 5,550,706 | | |
| New Mexico | | 3 | | | | | 151,473 | | | | | — | | | | | — | | | | | 3 | | | | | 151,473 | | |
| New York | | 18 | | | | | 877,103 | | | | | 12 | | | | | 1,166,558 | | | | | 30 | | | | | 2,043,661 | | |
| North Carolina | | 19 | | | | | 976,504 | | | | | 3 | | | | | 150,624 | | | | | 22 | | | | | 1,127,128 | | |
| Ohio | | 14 | | | | | 1,074,262 | | | | | 4 | | | | | 250,291 | | | | | 18 | | | | | 1,324,553 | | |
| Oklahoma | | 5 | | | | | 228,425 | | | | | — | | | | | — | | | | | 5 | | | | | 228,425 | | |
| Oregon | | 11 | | | | | 384,296 | | | | | 1 | | | | | 55,621 | | | | | 12 | | | | | 439,917 | | |
| Pennsylvania | | 23 | | | | | 2,181,786 | | | | | 3 | | | | | 2,062,761 | | | | | 26 | | | | | 4,244,547 | | |
| Puerto Rico | | 4 | | | | | 237,969 | | | | | 1 | | | | | 54,352 | | | | | 5 | | | | | 292,321 | | |
| Rhode Island | | 1 | | | | | 70,159 | | | | | 1 | | | | | 12,748 | | | | | 2 | | | | | 82,907 | | |
| South Carolina | | 5 | | | | | 261,011 | | | | | 2 | | | | | 214,238 | | | | | 7 | | | | | 475,249 | | |
| Tennessee | | 5 | | | | | 256,743 | | | | | 4 | | | | | 63,909 | | | | | 9 | | | | | 320,652 | | |
| Texas | | 43 | | | | | 2,349,451 | | | | | 21 | | | | | 1,894,453 | | | | | 64 | | | | | 4,243,904 | | |
| Utah | | 2 | | | | | 78,148 | | | | | 1 | | | | | 90,553 | | | | | 3 | | | | | 168,701 | | |
| Vermont | | 2 | | | | | 55,200 | | | | | — | | | | | — | | | | | 2 | | | | | 55,200 | | |
| Virginia | | 12 | | | | | 685,369 | | | | | 7 | | | | | 795,036 | | | | | 19 | | | | | 1,480,405 | | |
| Washington | | 6 | | | | | 701,991 | | | | | 5 | | | | | 196,028 | | | | | 11 | | | | | 898,019 | | |
| West Virginia | | 2 | | | | | 105,502 | | | | | — | | | | | — | | | | | 2 | | | | | 105,502 | | |
| Wisconsin | | 5 | | | | | 379,857 | | | | | 1 | | | | | 10,655 | | | | | 6 | | | | | 390,512 | | |
| Total United States | | 469 | | | | | 34,242,097 | | | | | 138 | | | | | 16,889,481 | | | | | 607 | | | | | 51,131,578 | | |
| Canada | | 46 | | | | | 3,081,804 | | | | | 16 | | | | | 1,783,258 | | | | | 62 | | | | | 4,865,062 | | |
| Total North America | | 515 | | | | | 37,323,901 | | | | | 154 | | | | | 18,672,739 | | | | | 669 | | | | | 55,996,640 | | |
| | | | | | | | | | | | | | | | | | | | | | | | | | | | | | | | | | | | | | | | | | | | | | | | | | | | | | | | | | | | | | | | | | | | | | | |
| | | | | |
| | | | | | | | | | | |
| LEASED | | OWNED | | TOTAL |
| COUNTRY/STATE | NUMBER | | SQUARE FEET | | NUMBER | | SQUARE FEET | | NUMBER | | SQUARE FEET |
| International | | | | | | | | | | | | | | | | | | | | | | | |
| Argentina | | 2 | | | | | 134,753 | | | | | 4 | | | | | 298,864 | | | | | 6 | | | | | 433,617 | | |
| Armenia | | 3 | | | | | 13,712 | | | | | — | | | | | — | | | | | 3 | | | | | 13,712 | | |
| Australia | | 41 | | | | | 2,888,639 | | | | | 2 | | | | | 33,845 | | | | | 43 | | | | | 2,922,484 | | |
| Austria | | 3 | | | | | 92,296 | | | | | 1 | | | | | 58,771 | | | | | 4 | | | | | 151,067 | | |
| Bahrain | | 2 | | | | | 33,659 | | | | | — | | | | | — | | | | | 2 | | | | | 33,659 | | |
| Belarus | | 4 | | | | | 18,472 | | | | | — | | | | | — | | | | | 4 | | | | | 18,472 | | |
| Belgium | | 4 | | | | | 202,106 | | | | | 1 | | | | | 104,391 | | | | | 5 | | | | | 306,497 | | |
| Brazil | | 41 | | | | | 2,813,259 | | | | | 6 | | | | | 291,280 | | | | | 47 | | | | | 3,104,539 | | |
| Bulgaria | | 1 | | | | | 68,889 | | | | | — | | | | | — | | | | | 1 | | | | | 68,889 | | |
| Chile | | 2 | | | | | 6,846 | | | | | 17 | | | | | 667,790 | | | | | 19 | | | | | 674,636 | | |
| China Mainland (including China - Hong Kong S.A.R., China-Taiwan and China-Macau S.A.R.) | | 46 | | | | | 1,960,751 | | | | | 1 | | | | | 20,518 | | | | | 47 | | | | | 1,981,269 | | |
| Colombia | | 21 | | | | | 799,378 | | | | | — | | | | | — | | | | | 21 | | | | | 799,378 | | |
| Croatia | | 2 | | | | | 62,786 | | | | | 1 | | | | | 36,447 | | | | | 3 | | | | | 99,233 | | |
| Cyprus | | 2 | | | | | 51,118 | | | | | 2 | | | | | 46,246 | | | | | 4 | | | | | 97,364 | | |
| Czech Republic | | 7 | | | | | 152,889 | | | | | — | | | | | — | | | | | 7 | | | | | 152,889 | | |
| Denmark | | 3 | | | | | 161,361 | | | | | — | | | | | — | | | | | 3 | | | | | 161,361 | | |
| Egypt | | — | | | | | — | | | | | 1 | | | | | 163,611 | | | | | 1 | | | | | 163,611 | | |
| England | | 66 | | | | | 3,551,854 | | | | | 18 | | | | | 598,009 | | | | | 84 | | | | | 4,149,863 | | |
| Estonia | | 1 | | | | | 38,861 | | | | | — | | | | | — | | | | | 1 | | | | | 38,861 | | |
| Eswatini | | 3 | | | | | 6,997 | | | | | — | | | | | — | | | | | 3 | | | | | 6,997 | | |
| Finland | | 3 | | | | | 95,896 | | | | | — | | | | | — | | | | | 3 | | | | | 95,896 | | |
| France | | 31 | | | | | 2,078,227 | | | | | 12 | | | | | 936,486 | | | | | 43 | | | | | 3,014,713 | | |
| Germany | | 15 | | | | | 698,593 | | | | | 3 | | | | | 308,504 | | | | | 18 | | | | | 1,007,097 | | |
| Greece | | 5 | | | | | 314,894 | | | | | — | | | | | — | | | | | 5 | | | | | 314,894 | | |
| Hungary | | 8 | | | | | 388,033 | | | | | — | | | | | — | | | | | 8 | | | | | 388,033 | | |
| India | | 70 | | | | | 3,147,462 | | | | | — | | | | | — | | | | | 70 | | | | | 3,147,462 | | |
| Indonesia | | 15 | | | | | 485,809 | | | | | 2 | | | | | 58,965 | | | | | 17 | | | | | 544,774 | | |
| Ireland | | 2 | | | | | 118,831 | | | | | 3 | | | | | 158,558 | | | | | 5 | | | | | 277,389 | | |
| Jordan | | — | | | | | — | | | | | 1 | | | | | 24,757 | | | | | 1 | | | | | 24,757 | | |
| Kazakhstan | | 4 | | | | | 46,482 | | | | | — | | | | | — | | | | | 4 | | | | | 46,482 | | |
| Latvia | | 2 | | | | | 50,681 | | | | | — | | | | | — | | | | | 2 | | | | | 50,681 | | |
| Lesotho | | 2 | | | | | 4,736 | | | | | — | | | | | — | | | | | 2 | | | | | 4,736 | | |
| Lithuania | | 2 | | | | | 60,543 | | | | | — | | | | | — | | | | | 2 | | | | | 60,543 | | |
| Malaysia | | 8 | | | | | 443,149 | | | | | — | | | | | — | | | | | 8 | | | | | 443,149 | | |
| Mexico | | 10 | | | | | 478,471 | | | | | 8 | | | | | 585,885 | | | | | 18 | | | | | 1,064,356 | | |
| Morocco | | 6 | | | | | 554,439 | | | | | — | | | | | — | | | | | 6 | | | | | 554,439 | | |
| The Netherlands | | 7 | | | | | 522,687 | | | | | 1 | | | | | 37,355 | | | | | 8 | | | | | 560,042 | | |
| New Zealand | | 6 | | | | | 413,959 | | | | | — | | | | | — | | | | | 6 | | | | | 413,959 | | |
| Northern Ireland | | 3 | | | | | 129,083 | | | | | — | | | | | — | | | | | 3 | | | | | 129,083 | | |
| Norway | | 5 | | | | | 194,321 | | | | | — | | | | | — | | | | | 5 | | | | | 194,321 | | |
| Oman | | 2 | | | | | 60,202 | | | | | — | | | | | — | | | | | 2 | | | | | 60,202 | | |
| Peru | | 3 | | | | | 60,720 | | | | | 10 | | | | | 433,770 | | | | | 13 | | | | | 494,490 | | |
| Philippines | | 9 | | | | | 338,040 | | | | | — | | | | | — | | | | | 9 | | | | | 338,040 | | |
| Poland | | 19 | | | | | 796,561 | | | | | — | | | | | — | | | | | 19 | | | | | 796,561 | | |
| Romania | | 8 | | | | | 451,954 | | | | | — | | | | | — | | | | | 8 | | | | | 451,954 | | |
| Russia | | 42 | | | | | 1,811,370 | | | | | — | | | | | — | | | | | 42 | | | | | 1,811,370 | | |
| Saudi Arabia | | 7 | | | | | 400,687 | | | | | — | | | | | — | | | | | 7 | | | | | 400,687 | | |
| Scotland | | 1 | | | | | 67,191 | | | | | 4 | | | | | 375,294 | | | | | 5 | | | | | 442,485 | | |
| Serbia | | 3 | | | | | 98,876 | | | | | — | | | | | — | | | | | 3 | | | | | 98,876 | | |
| Singapore | | 6 | | | | | 297,581 | | | | | 3 | | | | | 345,056 | | | | | 9 | | | | | 642,637 | | |
| Slovakia | | 5 | | | | | 173,792 | | | | | — | | | | | — | | | | | 5 | | | | | 173,792 | | |
| South Africa | | 16 | | | | | 477,046 | | | | | — | | | | | — | | | | | 16 | | | | | 477,046 | | |
| South Korea | | 8 | | | | | 257,233 | | | | | — | | | | | — | | | | | 8 | | | | | 257,233 | | |
| Spain | | 30 | | | | | 754,667 | | | | | 5 | | | | | 170,707 | | | | | 35 | | | | | 925,374 | | |
| Sweden | | 6 | | | | | 759,793 | | | | | — | | | | | — | | | | | 6 | | | | | 759,793 | | |
| Switzerland | | 12 | | | | | 283,857 | | | | | — | | | | | — | | | | | 12 | | | | | 283,857 | | |
| | | | | | | | | | | | | | | | | | | | | | | |
| | | | | | | | | | | | | | | | | | | | | | | | | | | | | | | | | | | | | | | | | | | | | | | | | | | | | | | | | | | | | | | | | | | | | | | |
| | | | | | | | | | | | | | | | | | | | | | | |
| LEASED | | OWNED | | TOTAL |
| COUNTRY/STATE | NUMBER | | SQUARE FEET | | NUMBER | | SQUARE FEET | | NUMBER | | SQUARE FEET |
| International (Continued) | | | | | | | | | | | | | | | | | | | | | | | |
| Thailand | | 4 | | | | | 267,989 | | | | | 2 | | | | | 105,487 | | | | | 6 | | | | | 373,476 | | |
| Turkey | | 9 | | | | | 683,641 | | | | | — | | | | | — | | | | | 9 | | | | | 683,641 | | |
| Ukraine | | 10 | | | | | 208,050 | | | | | — | | | | | — | | | | | 10 | | | | | 208,050 | | |
| United Arab Emirates | | 10 | | | | | 833,421 | | | | | 1 | | | | | 349,526 | | | | | 11 | | | | | 1,182,947 | | |
| Vietnam | | 1 | | | | | 54,767 | | | | | — | | | | | — | | | | | 1 | | | | | 54,767 | | |
| Total International | | 669 | | | | | 32,422,360 | | | | | 109 | | | | | 6,210,122 | | | | | 778 | | | | | 38,632,482 | | |
| Total | | 1,184 | | | | | 69,746,261 | | | | | 263 | | | | | 24,882,861 | | | | | 1,447 | | | | | 94,629,122 | | |
The leased facilities typically have initial lease terms of five to 10 years with one or more renewal options. In addition, some of the leases contain either a purchase option or a right of first refusal upon the sale of the property. We believe that the space available in our facilities is adequate to meet our current needs, although future growth may require that we lease or purchase additional real property.
Our total building utilization and total racking utilization by region as of December 31, 2021 in Records Management and Data Management are as follows:
| | | | | | | | | | | | | | | | | | | | | | | | | | |
| | | RECORDS MANAGEMENT(1) | | DATA MANAGEMENT |
| REGION | | BUILDING
UTILIZATION | | RACKING
UTILIZATION | | BUILDING
UTILIZATION | | RACKING
UTILIZATION |
| North America | | 80% | | 87% | | 58% | | 66% |
| Europe | | 85% | | 91% | | 40% | | 59% |
| Latin America | | 87% | | 90% | | 73% | | 75% |
| Asia | | 84% | | 92% | | 58% | | 70% |
| Total | | 82% | | 89% | | 55% | | 66% |
(1)Total building utilization and total racking utilization for Records Management includes the utilization for GDS and Consumer Storage.
See Note 2.i. to Notes to Consolidated Financial Statements included in this Exhibit 99.1 to this Current Report for information regarding our minimum annual lease commitments as a lessee.
See Schedule III—Schedule of Real Estate and Accumulated Depreciation in this Exhibit 99.1 to this Current Report for information regarding the cost, accumulated depreciation and encumbrances associated with our owned real estate.
The following table sets forth a summary of the lease expirations for leases in place related to our Global Data Center Business, for which we are the lessor, as of December 31, 2021. The information set forth in the table assumes that tenants exercise no renewal options and all early termination rights.
| | | | | | | | | | | | | | | | | | | | | | | | | | | | | | | | |
| YEAR | | NUMBER OF LEASES EXPIRING | | TOTAL MEGAWATTS
EXPIRING | | PERCENTAGE
OF TOTAL MEGAWATTS
EXPIRING | | ANNUALIZED
TOTAL CONTRACT
RENT EXPIRING
(IN THOUSANDS) | | PERCENTAGE OF
TOTAL CONTRACT
VALUE ANNUALIZED
RENT |
| 2022 | | 556 | | | 15.1 | | | 8.4 | % | | $ | 47,646 | | | 14.7 | % |
| 2023 | | 350 | | | 22.7 | | | 12.6 | % | | 63,540 | | | 19.6 | % |
| 2024 | | 237 | | | 12.9 | | | 7.2 | % | | 32,704 | | | 10.1 | % |
| 2025 | | 77 | | | 20.0 | | | 11.1 | % | | 43,748 | | | 13.5 | % |
| 2026 | | 63 | | | 20.0 | | | 11.1 | % | | 33,746 | | | 10.4 | % |
| 2027 | | 10 | | | 3.2 | | | 1.8 | % | | 6,429 | | | 2.0 | % |
| 2028 | | 13 | | | 37.7 | | | 20.9 | % | | 47,216 | | | 14.6 | % |
| Thereafter | | 14 | | | 48.5 | | | 26.9 | % | | 48,715 | | | 15.1 | % |
| Total | | 1,320 | | | 180.1 | | | 100.0 | % | | $ | 323,744 | | | 100.0 | % |
PART II
ITEM 7. MANAGEMENT'S DISCUSSION AND ANALYSIS OF FINANCIAL CONDITION AND RESULTS OF OPERATIONS.
The following discussion should be read in conjunction with the Consolidated Financial Statements and Notes thereto and the other financial and operating information included elsewhere in this Exhibit 99.1 to this Current Report.
This discussion contains “forward-looking statements” as that term is defined in the Private Securities Litigation Reform Act of 1995 and in other securities laws. See “Cautionary Note Regarding Forward-Looking Statements” on page iii of our Annual Report on Form 10-K, filed with the SEC on February 24, 2022 (our “Original Annual Report”) and “Item 1A. Risk Factors” beginning on page 9 of our Original Annual Report.
OVERVIEW
COVID-19
In March 2020, the World Health Organization declared a novel strain of coronavirus (“COVID-19”) a pandemic. While we have broad geographic and customer diversification with operations in 63 countries and no single customer accounting for more than approximately 1% of revenue during the year ended December 31, 2021, COVID-19 is a global pandemic impacting numerous industries and geographies. While our service operations have increased from the reductions we experienced during the first and second quarter of 2020, future service revenues remain uncertain and will be dependent on the severity of the COVID-19 pandemic, including new variants of COVID-19 that may emerge.
PROJECT SUMMIT
In October 2019, we announced Project Summit, our global program designed to better position us for future growth and achievement of our strategic objectives. As of December 31, 2021, we have completed Project Summit. As a result of the program we have simplified our global structure, rebalanced resources to focus on higher growth areas, realigned our management structure to create a more dynamic, agile organization, made investments to enhance the customer experience and leveraged new technology solutions that enabled us to modernize our service delivery model and more efficiently utilize our fleet, labor and real estate. Project Summit has improved annual Adjusted EBITDA (as defined below) by approximately $375.0 million exiting 2021, of which approximately $160.0 million and $165.0 million were realized in 2021 and 2020, respectively, with the remainder to come in 2022.
| | | | | | | | |
| 2021 | | $160 million |
| Exiting 2021 | | $375 million |
The implementation of Project Summit resulted in total operating expenditures ("Restructuring Charges") of approximately $450.0 million that primarily consisted of: (1) employee severance costs; (2) internal costs associated with the development and implementation of Project Summit initiatives; (3) professional fees, primarily related to third party consultants who assisted with the design and execution of various initiatives as well as project management activities and (4) system implementation and data conversion costs. The following table presents (in millions) total Restructuring Charges related to Project Summit from the inception of Project Summit through December 31, 2021 and for the years ended December 31, 2021, 2020 and 2019:
| | | | | | |
From the Inception of
Project Summit through
December 31, 2021 | | |
For the Year Ended
December 31, 2021 | | |
For the Year Ended
December 31, 2020 | | |
For the Year Ended
December 31, 2019 | | |
We have also incurred approximately $33.8 million in capital expenditures related to Project Summit from the inception of Project Summit through December 31, 2021.
DIVESTMENTS
INTELLECTUAL PROPERTY MANAGEMENT BUSINESS
On June 7, 2021, we sold our Intellectual Property Management ("IPM") business, also known as our technology escrow services business, which we predominantly operated in the United States, for total gross consideration of approximately $215.4 million (the “IPM Divestment”). As a result of the IPM Divestment, we recorded a gain on sale of approximately $179.0 million to Other (income) expense, net, during the year ended December 31, 2021, the substantial majority of which was recorded during the second quarter of 2021, representing the excess of the fair value of the consideration received over the sum of the carrying value of the IPM business. Our IPM business represented approximately $14.2 million, $32.8 million and $33.2 million of total revenues for the years ended December 31, 2021, 2020 and 2019, respectively, and approximately $6.8 million, $16.0 million and $17.2 million of total net income for the years ended December 31, 2021, 2020 and 2019, respectively.
IRON MOUNTAIN CONSUMER STORAGE
In March 2019, we contributed our customer contracts and certain intellectual property and other assets used by us to operate our consumer storage business in the United States and Canada (the “IM Consumer Storage Assets”) and approximately $20.0 million in cash (gross of certain transaction expenses) (the “Cash Contribution”) to a strategic partnership (the “MakeSpace JV”) established by us and MakeSpace Labs, Inc. (“MakeSpace”) pursuant to a transaction which closed on March 19, 2019 (the "Consumer Storage Transaction"). Upon the closing of the Consumer Storage Transaction, the MakeSpace JV owned (i) the IM Consumer Storage Assets, (ii) the Cash Contribution and (iii) the customer contracts, intellectual property and certain other assets used by MakeSpace to operate its consumer storage business in the United States. As part of the Consumer Storage Transaction, we received an initial equity interest of approximately 34% in the MakeSpace JV (the “MakeSpace Investment”). In the second quarter of 2020, we committed to participate in a round of equity funding for the MakeSpace JV whereby we contributed $36.0 million of the $45.0 million being raised in installments between May 2020 through October 2021. At December 31, 2021, we owned 49.99% of the outstanding equity in the MakeSpace JV.
In connection with the Consumer Storage Transaction and the MakeSpace Investment, we also entered into a storage and service agreement with the MakeSpace JV to provide certain storage and related services to the MakeSpace JV (the “MakeSpace Agreement”). Revenues and expenses associated with the MakeSpace Agreement are presented as a component of our Global RIM Business segment. During the years ended December 31, 2021, 2020 and 2019, we recognized revenue of approximately $34.7 million, $33.6 million and $22.5 million, respectively, associated with the MakeSpace Agreement.
As a result of the Consumer Storage Transaction, we recorded a gain on sale of approximately $4.2 million to Other (income) expense, net, during the first quarter of 2019, representing the excess of the fair value of the consideration received over the sum of the carrying value of our consumer storage operations and (ii) the Cash Contribution.
________________________________________________________
As described in Note 4 to Notes to Consolidated Financial Statements included in this Exhibit 99.1 to this Current Report, we have concluded that the divestments of IPM and the IM Consumer Storage Assets in the Consumer Storage Transaction do not meet the criteria to be reported as discontinued operations in our consolidated financial statements.
GENERAL
RESULTS OF OPERATIONS - KEY TRENDS
•In spite of the COVID-19 pandemic, we have experienced relatively steady volume in our Global RIM Business segment, with organic storage rental revenue growth driven primarily by revenue management. We expect organic storage rental revenue growth to benefit from revenue management and volume to be relatively stable in the near term.
•Our organic service revenue growth is primarily due to increases in our service activity, particularly in regions where governments have lifted or eased COVID-19-related restrictions on our customers’ non-essential business operations. We expect organic service revenue growth in 2022 to benefit from our new and existing digital offerings.
•We expect revenue and Adjusted EBITDA growth to accelerate in 2022 with continued focus on new product and service offerings, innovation, customer solutions and market expansion.
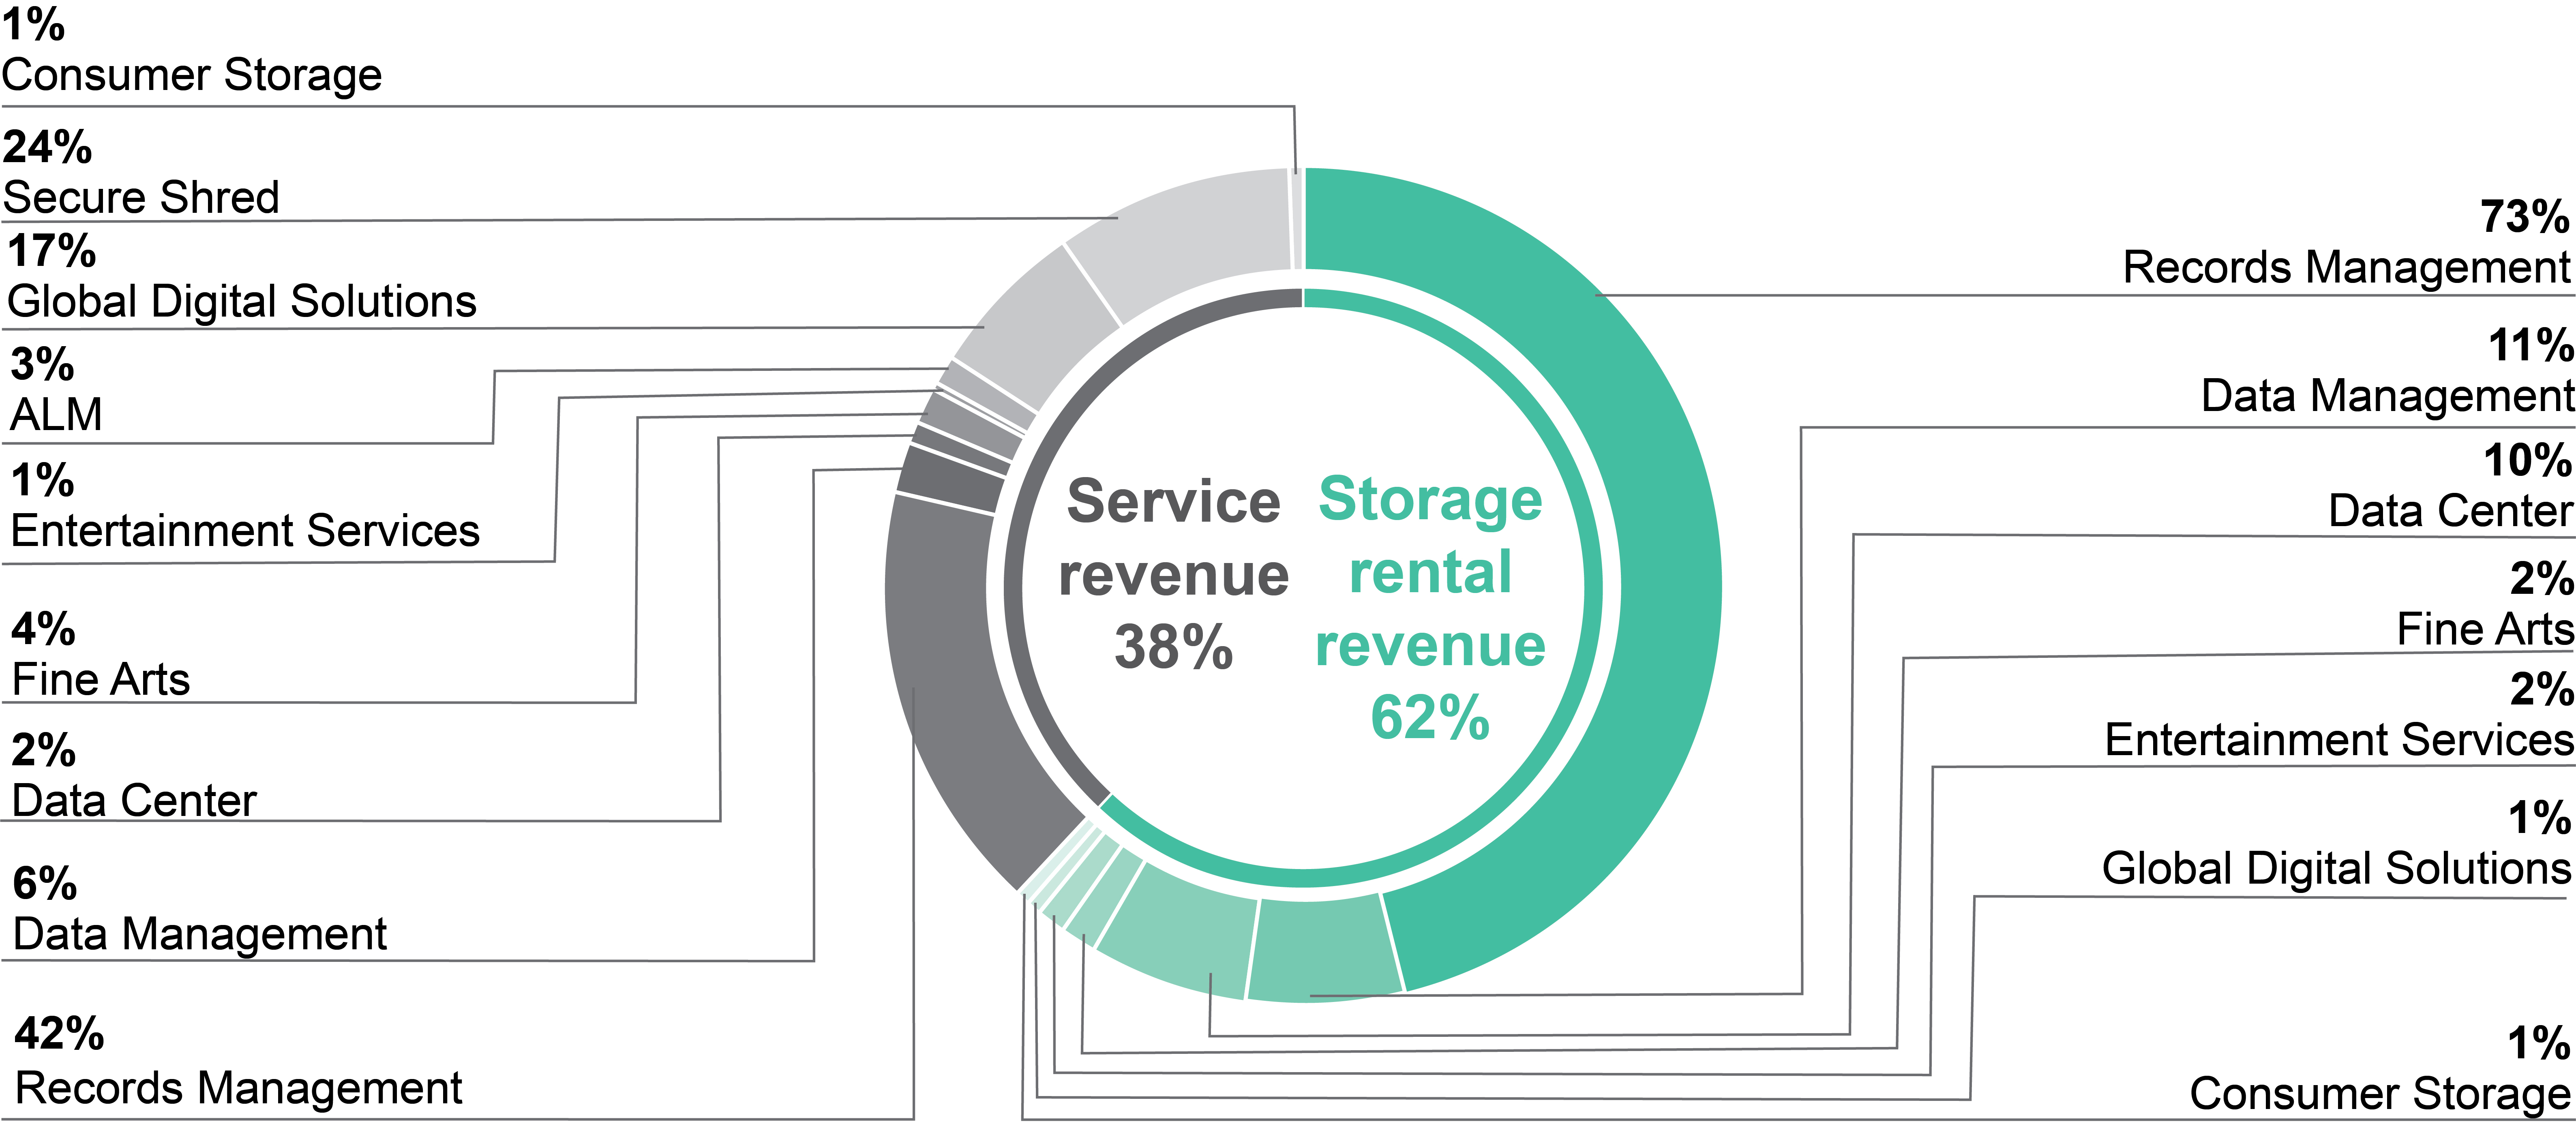
Our revenues consist of storage rental revenues as well as service revenues and are reflected net of sales and value-added taxes. Storage rental revenues, which are considered a key driver of financial performance for the storage and information management services industry, consist primarily of recurring periodic rental charges related to the storage of materials or data (generally on a per unit basis) that are typically retained by customers for many years and revenues associated with our data center operations. Service revenues include charges for related service activities, the most significant of which include: (1) the handling of records, including the addition of new records, temporary removal of records from storage, refiling of removed records, customer termination and permanent withdrawal fees, project revenues, and courier operations, consisting primarily of the pickup and delivery of records upon customer request; (2) destruction services, consisting primarily of secure shredding of sensitive documents and the subsequent sale of shredded paper for recycling, the price of which can fluctuate from period to period; (3) digital solutions, including the scanning, imaging and document conversion services of active and inactive records, and consulting services; and (4) data center services, including set up, monitoring and support of our customers' assets which are protected in our data center facilities, and special project services, including data center fitout. Our service revenue growth has been negatively impacted by declining activity rates as stored records are becoming less active. While customers continue to store their records and tapes with us, they are less likely than they have been in the past to retrieve records for research and other purposes, thereby reducing service activity levels.
BREAKDOWN OF REVENUES
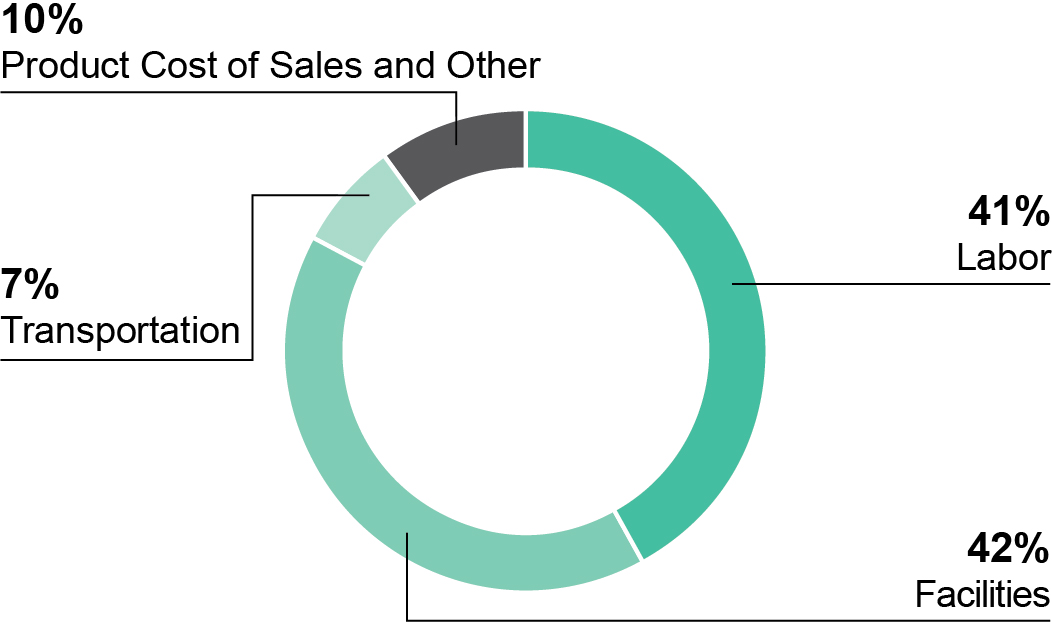
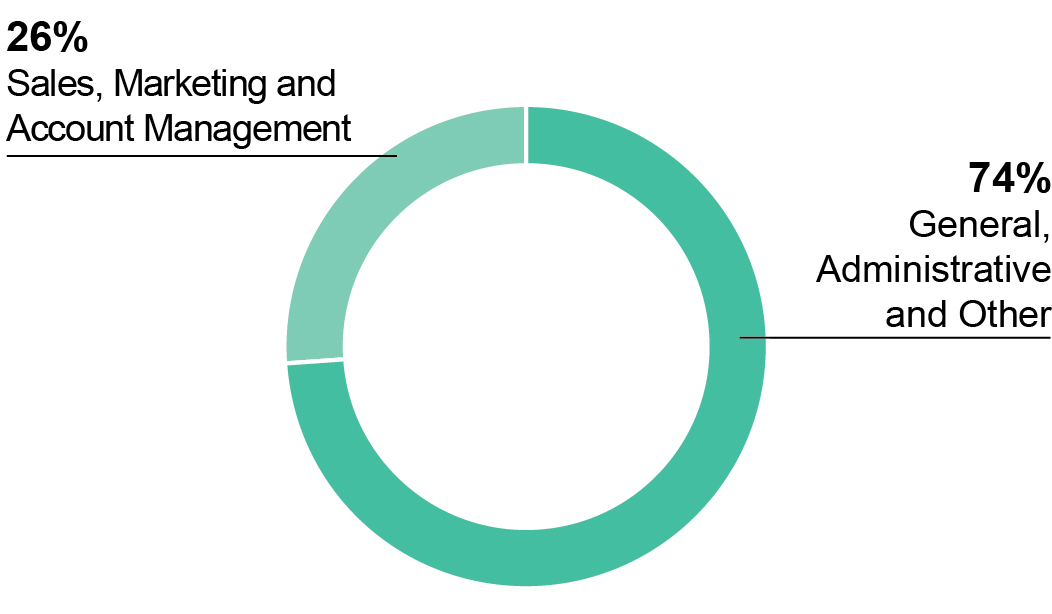
Cost of sales (excluding depreciation and amortization) consists primarily of labor, including wages and benefits for field personnel, facility occupancy costs (including rent and utilities), transportation expenses (including vehicle leases and fuel), other product cost of sales and other equipment costs and supplies. Of these, labor and facility occupancy costs are the most significant. Selling, general and administrative expenses consist primarily of wages and benefits for management, administrative, IT, sales, account management and marketing personnel, as well as expenses related to communications and data processing, travel, professional fees, bad debts, training, office equipment and supplies.
Cost of sales (excluding depreciation and amortization) and Selling, general and administrative expenses for the year ended December 31, 2021 consists of the following:
| | | | | | | | |
| COST OF SALES | | SELLING, GENERAL AND ADMINISTRATIVE EXPENSES |
| | |
| | | | | |
| |
Trends in facility occupancy costs are impacted by: •the total number of facilities we occupy; •the mix of properties we own versus properties we lease; •fluctuations in per square foot occupancy costs; and •the levels of utilization of these properties. Trends in total wages and benefits in dollars and as a percentage of total consolidated revenue are influenced by: •changes in headcount and compensation levels; •achievement of incentive compensation targets; •workforce productivity; and •variability in costs associated with medical insurance and workers’ compensation. The expansion of our international businesses has impacted the major cost of sales components and selling, general and administrative expenses. •Our international operations are more labor intensive relative to revenue than our operations in North America and, therefore, labor costs are a higher percentage of international operational revenue. •The overhead structure of our expanding international operations has generally not achieved the same level of overhead leverage as our North American operations, which may result in an increase in selling, general and administrative expenses as a percentage of consolidated revenue as our international operations become a larger percentage of our consolidated results. | |
| |
Our depreciation and amortization charges result primarily from depreciation related to storage systems, which include racking structures, buildings, building and leasehold improvements and computer systems hardware and software. Amortization relates primarily to customer relationship intangible assets, contract fulfillment costs and data center lease-based intangible assets. Both depreciation and amortization are impacted by the timing of acquisitions.
Our consolidated revenues and expenses are subject to the net effect of foreign currency translation related to our operations outside the United States. It is difficult to predict the future fluctuations of foreign currency exchange rates and how those fluctuations will impact our Consolidated Statements of Operations. As a result of the relative size of our international operations, these fluctuations may be material on individual balances. Our revenues and expenses from our international operations are generally denominated in the local currency of the country in which they are derived or incurred. Therefore, the impact of currency fluctuations on our operating income and operating margin is partially mitigated. In order to provide a framework for assessing how our underlying businesses performed excluding the effect of foreign currency fluctuations, we compare the percentage change in the results from one period to another period in this report using constant currency presentation. The constant currency growth rates are calculated by translating the 2020 results at the 2021 average exchange rates and the 2019 results at the 2020 average exchange rates. Constant currency growth rates are a non-GAAP measure.
The following table is a comparison of underlying average exchange rates of the foreign currencies that had the most significant impact on our United States dollar-reported revenues and expenses:
| | | | | | | | | | | | | | | | | | | | | | | | | | | | | |
| | PERCENTAGE OF
UNITED STATES DOLLAR-
REPORTED REVENUE FOR THE
YEAR ENDED DECEMBER 31, | | AVERAGE EXCHANGE RATES
FOR THE YEAR ENDED
DECEMBER 31, | | PERCENTAGE
STRENGTHENING /
(WEAKENING) OF
FOREIGN CURRENCY |
| | 2021 | | 2020 | | 2021 | | 2020 |
| Australian dollar | 3.3 | % | | 3.2 | % | | $ | 0.751 | | | $ | 0.690 | | | 8.8 | % |
| Brazilian real | 1.8 | % | | 1.9 | % | | $ | 0.186 | | | $ | 0.196 | | | (5.1) | % |
| British pound sterling | 6.6 | % | | 6.0 | % | | $ | 1.376 | | | $ | 1.283 | | | 7.2 | % |
| Canadian dollar | 5.6 | % | | 5.4 | % | | $ | 0.798 | | | $ | 0.746 | | | 7.0 | % |
| Euro | 7.7 | % | | 7.5 | % | | $ | 1.183 | | | $ | 1.141 | | | 3.7 | % |
| | | | | | | | | | | | | | | | | | | | | | | | | | | | | |
| | PERCENTAGE OF
UNITED STATES DOLLAR-
REPORTED REVENUE FOR THE
YEAR ENDED DECEMBER 31, | | AVERAGE EXCHANGE RATES
FOR THE YEAR ENDED
DECEMBER 31, | | PERCENTAGE
STRENGTHENING /
(WEAKENING) OF
FOREIGN CURRENCY |
| | 2020 | | 2019 | | 2020 | | 2019 |
| Australian dollar | 3.2 | % | | 3.4 | % | | $ | 0.690 | | | $ | 0.695 | | | (0.7) | % |
| Brazilian real | 1.9 | % | | 2.6 | % | | $ | 0.196 | | | $ | 0.254 | | | (22.8) | % |
| British pound sterling | 6.0 | % | | 6.4 | % | | $ | 1.283 | | | $ | 1.277 | | | 0.5 | % |
| Canadian dollar | 5.4 | % | | 5.7 | % | | $ | 0.746 | | | $ | 0.754 | | | (1.1) | % |
| Euro | 7.5 | % | | 7.4 | % | | $ | 1.141 | | | $ | 1.120 | | | 1.9 | % |
The percentage of United States dollar-reported revenues for all other foreign currencies was 14.6%, 13.8% and 12.7% for the years ended December 31, 2021, 2020 and 2019, respectively.
NON-GAAP MEASURES
ADJUSTED EBITDA
Adjusted EBITDA is defined as income (loss) from continuing operations before interest expense, net, provision (benefit) for income taxes, depreciation and amortization (inclusive of our share of Adjusted EBITDA from our unconsolidated joint ventures), and excluding certain items we do not believe to be indicative of our core operating results, specifically:
| | | | | |
| |
| EXCLUDED | |
•Acquisition and Integration Costs •Restructuring Charges •Intangible impairments •(Gain) loss on disposal/write-down of property, plant and equipment, net (including real estate)
| •Other (income) expense, net •Stock-based compensation expense •COVID-19 Costs (as defined below)
|
| |
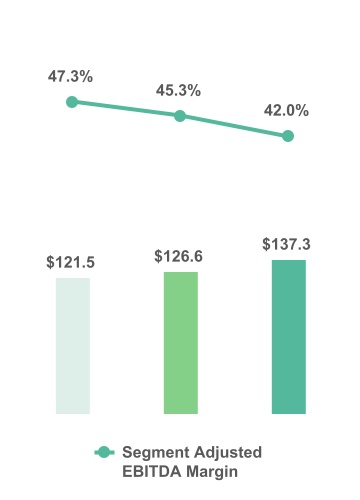
Adjusted EBITDA Margin is calculated by dividing Adjusted EBITDA by total revenues. We also show Adjusted EBITDA and Adjusted EBITDA Margin for each of our reportable operating segments under “Results of Operations – Segment Analysis” below.
Adjusted EBITDA excludes both interest expense, net and the provision (benefit) for income taxes. These expenses are associated with our capitalization and tax structures, which we do not consider when evaluating the operating profitability of our core operations. Adjusted EBITDA also does not include depreciation and amortization expenses, in order to eliminate the impact of capital investments, which we evaluate by comparing capital expenditures to incremental revenue generated and as a percentage of total revenues. Adjusted EBITDA and Adjusted EBITDA Margin should be considered in addition to, but not as a substitute for, other measures of financial performance reported in accordance with accounting principles generally accepted in the United States of America (“GAAP”), such as operating income, income (loss) from continuing operations, net income (loss) or cash flows from operating activities from continuing operations (as determined in accordance with GAAP).
RECONCILIATION OF INCOME (LOSS) FROM CONTINUING OPERATIONS TO ADJUSTED EBITDA (IN THOUSANDS):
| | | | | | | | | | | | | | | | | |
| | | | | |
| | YEAR ENDED DECEMBER 31, |
| | 2021 | | 2020 | | 2019 |
| Income (Loss) from Continuing Operations | $ | 452,725 | | | $ | 343,096 | | | $ | 268,211 | |
| Add/(Deduct): | | | | | |
| Interest expense, net | 417,961 | | | 418,535 | | | 419,298 | |
| Provision (benefit) for income taxes | 176,290 | | | 29,609 | | | 59,931 | |
| Depreciation and amortization | 680,422 | | | 652,069 | | | 658,201 | |
| Acquisition and Integration Costs | 12,764 | | | — | | | 13,293 | |
| Restructuring Charges | 206,426 | | | 194,396 | | | 48,597 | |
| Intangible impairments | — | | | 23,000 | | | — | |
| (Gain) loss on disposal/write-down of property, plant and equipment, net (including real estate) | (172,041) | | | (363,537) | | | (63,824) | |
Other (income) expense, net, excluding our share of losses (gains) from our unconsolidated joint ventures(1) | (205,746) | | | 133,611 | | | 25,720 | |
| Stock-based compensation expense | 61,001 | | | 34,272 | | | 36,194 | |
COVID-19 Costs(2) | — | | | 9,285 | | | — | |
| Our share of Adjusted EBITDA reconciling items from our unconsolidated joint ventures | 4,897 | | | 1,385 | | | 3,388 | |
| Adjusted EBITDA | $ | 1,634,699 | | | $ | 1,475,721 | | | $ | 1,469,009 | |
(1)Includes foreign currency transaction losses (gains), net, debt extinguishment expense and other, net. See Note 2.u. to Notes to Consolidated Financial Statements included in this Exhibit 99.1 to this Current Report for additional information regarding the components of Other (income) expense, net.
(2)Costs that are incremental and directly attributable to the COVID-19 pandemic which are not expected to recur once the pandemic ends (“COVID-19 Costs”). These costs include the purchase of personal protective equipment for our employees and incremental cleaning costs of our facilities, among other direct costs.
ADJUSTED EPS
Adjusted EPS is defined as reported earnings per share fully diluted from continuing operations (inclusive of our share of adjusted losses (gains) from our unconsolidated joint ventures) and excluding certain items, specifically:
| | | | | |
| |
| EXCLUDED | |
•Acquisition and Integration Costs •Restructuring Charges •Intangible impairments •(Gain) loss on disposal/write-down of property, plant and equipment, net (including real estate)
| •Other (income) expense, net •Stock-based compensation expense •COVID-19 Costs •Tax impact of reconciling items and discrete tax items |
| |
We do not believe these excluded items to be indicative of our ongoing operating results, and they are not considered when we are forecasting our future results. We believe Adjusted EPS is of value to our current and potential investors when comparing our results from past, present and future periods.
RECONCILIATION OF REPORTED EPS—FULLY DILUTED FROM CONTINUING OPERATIONS TO ADJUSTED EPS—FULLY DILUTED FROM CONTINUING OPERATIONS:
| | | | | | | | | | | | | | | | | |
| | | | | |
| | YEAR ENDED DECEMBER 31, |
| | 2021 | | 2020 | | 2019 |
| Reported EPS—Fully Diluted from Continuing Operations | $ | 1.55 | | | $ | 1.19 | | | $ | 0.93 | |
| Add/(Deduct): | | | | | |
| Acquisition and Integration Costs | 0.04 | | | — | | | 0.05 | |
| Restructuring Charges | 0.71 | | | 0.67 | | | 0.17 | |
| Intangible impairments | — | | | 0.08 | | | — | |
| (Gain) loss on disposal/write-down of property, plant and equipment, net (including real estate) | (0.59) | | | (1.26) | | | (0.22) | |
| Other (income) expense, net, excluding our share of losses (gains) from our unconsolidated joint ventures | (0.71) | | | 0.46 | | | 0.09 | |
| Stock-based compensation expense | 0.21 | | | 0.12 | | | 0.13 | |
COVID-19 Costs(1) | — | | | 0.03 | | | — | |
| | | | | |
Tax impact of reconciling items and discrete tax items(2) | 0.28 | | | (0.11) | | | (0.03) | |
| Income (loss) Attributable to Noncontrolling Interests | 0.01 | | | — | | | — | |
Adjusted EPS—Fully Diluted from Continuing Operations(3) | $ | 1.51 | | | $ | 1.19 | | | $ | 1.11 | |
(1)These costs include the purchase of personal protective equipment for our employees and incremental cleaning costs of our facilities, among other direct costs.
(2)The difference between our effective tax rate and our structural tax rate (or adjusted effective tax rate) for the years ended December 31, 2021, 2020, and 2019 is primarily due to (i) the reconciling items above, which impact our reported income (loss) from continuing operations before provision (benefit) for income taxes but have an insignificant impact on our reported provision (benefit) for income taxes and (ii) other discrete tax items. Our structural tax rate for purposes of the calculation of Adjusted EPS for the years ended December 31, 2021, 2020 and 2019 was 17.7%, 15.1%, and 17.6%, respectively.
(3)Columns may not foot due to rounding.
FFO (NAREIT) AND FFO (NORMALIZED)
Funds from operations ("FFO") is defined by the National Association of Real Estate Investment Trusts (“Nareit”) as net income (loss) excluding depreciation on real estate assets, gains on sale of real estate, net of tax, and amortization of data center leased-based intangibles. FFO (Nareit) does not give effect to real estate depreciation because these amounts are computed, under GAAP, to allocate the cost of a property over its useful life. Because values for well-maintained real estate assets have historically increased or decreased based upon prevailing market conditions, we believe that FFO (Nareit) provides investors with a clearer view of our operating performance. Our most directly comparable GAAP measure to FFO (Nareit) is net income (loss).
Although Nareit has published a definition of FFO, we modify FFO (Nareit), as is common among REITs seeking to provide financial measures that most meaningfully reflect their particular business ("FFO (Normalized)"). Our definition of FFO (Normalized) excludes certain items included in FFO (Nareit) that we believe are not indicative of our core operating results, specifically:
| | | | | |
| |
| EXCLUDED | |
•Acquisition and Integration Costs •Restructuring Charges •Intangible impairments •(Gain) loss on disposal/write-down of property, plant and equipment, net (excluding real estate) •Other (income) expense, net | •Stock-based compensation expense •COVID-19 Costs •Real estate financing lease depreciation •Tax impact of reconciling items and discrete tax items •(Income) loss from discontinued operations, net of tax
|
| |
RECONCILIATION OF NET INCOME (LOSS) TO FFO (NAREIT) AND FFO (NORMALIZED) (IN THOUSANDS):
| | | | | | | | | | | | | | | | | | | | | |
| YEAR ENDED DECEMBER 31, | | | | |
| 2021 | | 2020 | | 2019 | | | | |
| Net Income (Loss) | $ | 452,725 | | | $ | 343,096 | | | $ | 268,315 | | | | | |
| Add/(Deduct): | | | | | | | | | |
Real estate depreciation(1) | 307,717 | | | 298,943 | | | 303,415 | | | | | |
Gain on sale of real estate, net of tax(2) | (142,892) | | | (365,709) | | | (99,194) | | | | | |
Data center lease-based intangible assets amortization(3) | 42,333 | | | 42,637 | | | 46,696 | | | | | |
| Our share of FFO (Nareit) reconciling items from our unconsolidated joint ventures | — | | | — | | | 1,284 | | | | | |
| FFO (Nareit) | 659,883 | | | 318,967 | | | 520,516 | | | | | |
| Add/(Deduct): | | | | | | | | | |
| Acquisition and Integration Costs | 12,764 | | | — | | | 13,293 | | | | | |
| Restructuring Charges | 206,426 | | | 194,396 | | | 48,597 | | | | | |
| Intangible impairments | — | | | 23,000 | | | — | | | | | |
| (Gain) loss on disposal/write-down of property, plant and equipment, net (excluding real estate) | (3,751) | | | 2,523 | | | 40,763 | | | | | |
Other (income) expense, net, excluding our share of losses (gains) from our unconsolidated joint ventures(4) | (205,746) | | | 133,611 | | | 25,720 | | | | | |
| Stock-based compensation expense | 61,001 | | | 34,272 | | | 36,194 | | | | | |
COVID-19 Costs(5) | — | | | 9,285 | | | — | | | | | |
| Real estate financing lease depreciation | 14,635 | | | 13,801 | | | 13,364 | | | | | |
Tax impact of reconciling items and discrete tax items(6) | 56,822 | | | (31,825) | | | (13,095) | | | | | |
| (Income) loss from discontinued operations, net of tax | — | | | — | | | (104) | | | | | |
| Our share of FFO (Normalized) reconciling items from our unconsolidated joint ventures | (38) | | | (38) | | | 148 | | | | | |
| FFO (Normalized) | $ | 801,996 | | | $ | 697,992 | | | $ | 685,396 | | | | | |
(1)Includes depreciation expense related to owned real estate assets (land improvements, buildings, building improvements, leasehold improvements and racking), excluding depreciation related to real estate financing leases.
(2)Tax expense associated with the gain on sale of real estate for the years ended December 31, 2021, 2020, and 2019, was $25.4 million, $0.4 million, and $5.4 million, respectively.
(3)Includes amortization expense for Data Center In-Place Lease Intangible Assets and Data Center Tenant Relationship Intangible Assets as defined in Note 2.l. to Notes to Consolidated Financial Statements included in this Exhibit 99.1 to this Current Report.
(4)Includes foreign currency transaction (gains) losses, net, debt extinguishment expense and other, net. See Note 2.u. to Notes to Consolidated Financial Statements included in this Exhibit 99.1 to this Current Report for additional information regarding the components of Other (income) expense, net.
(5)These costs include the purchase of personal protective equipment for our employees and incremental cleaning costs of our facilities, among other direct costs.
(6)Represents the tax impact of (i) the reconciling items above, which impacts our reported income (loss) from continuing operations before provision (benefit) for income taxes but has an insignificant impact on our reported provision (benefit) for income taxes and (ii) other discrete tax items. Discrete tax items resulted in a provision (benefit) for income taxes of $19.2 million, $(16.8) million and $(1.5) million for the years ended December 31, 2021, 2020 and 2019, respectively.
CRITICAL ACCOUNTING ESTIMATES
Our discussion and analysis of our financial condition and results of operations are based upon our Consolidated Financial Statements, which have been prepared in accordance with GAAP. The preparation of these financial statements requires us to make estimates, judgments and assumptions that affect the reported amounts of assets, liabilities, revenues and expenses, and related disclosure of contingent assets and liabilities at the date of the financial statements and for the period then ended. On an ongoing basis, we evaluate the estimates used. We base our estimates on historical experience, actuarial estimates, current conditions and various other assumptions that we believe to be reasonable under the circumstances. These estimates form the basis for making judgments about the carrying values of assets and liabilities and are not readily apparent from other sources. Actual results may differ from these estimates. The following should be read in conjunction with Note 2 to Notes to Consolidated Financial Statements included in this Exhibit 99.1 to this Current Report, which provides a summary of our significant accounting policies. Our critical accounting estimates include the following, which are listed in no particular order:
REVENUE RECOGNITION
Revenue is recognized when or as control of promised goods or services is transferred to the customer, in an amount that reflects the consideration we expect to be entitled to in exchange for those goods or services. See Note 2.r. to Notes to Consolidated Financial Statements included in this Exhibit 99.1 to this Current Report for additional details on our revenue recognition policies. Revenue for all our lines of business, with the exception of storage revenues in our Global Data Center Business (which is subject to leasing guidance), is recognized in accordance with Accounting Standards Codification ("ASC") 606, Revenue from Contracts with Customers (“ASC 606”), the application of which requires that we make estimates and judgements that may affect the amount and timing of revenue we recognize.
We have determined that the majority of our contracts contain series performance obligations which qualify to be recognized under a practical expedient available in ASC 606 known as the “right to invoice.” This determination allows variable consideration in such contracts to be allocated to and recognized in the period to which the consideration relates, which is typically the period in which it is billed, rather than requiring estimation of variable consideration at the inception of the contract.
From time to time, we make payments to entities that are also customers under a revenue contract. These payments are comprised of Customer Inducements (as defined in Note 2.l. to Notes to Consolidated Financial Statements included in this Exhibit 99.1 to this Current Report). Consideration payable to a customer is treated as a reduction of the transaction price over periods ranging from one to 10 years. If the payment to the customer does not represent payment for a distinct service, revenue is recognized only up to the amount of consideration remaining after customer payment obligations are considered.
Contract Fulfillment Costs are amortized over a three year term, which we have determined is consistent with the transfer of the underlying performance obligations to which the assets relate. Different determinations on term length would result in differences in the amount and timing of amortization expense recognized.
ACCOUNTING FOR ACQUISITIONS
Part of our growth strategy has been to acquire businesses. The purchase price of each acquisition has been determined after due diligence of the target business, market research, strategic planning and the forecasting of expected future results and synergies. Estimated future results and expected synergies are subject to revisions as we integrate each acquisition and attempt to leverage resources.
Accounting for acquisitions of a business has resulted in the capitalization of the cost in excess of the estimated fair value of the net assets acquired in each of these acquisitions as goodwill. We estimate the fair values of the assets acquired in each acquisition as of the date of acquisition and these estimates are subject to adjustment based on the final assessments of the fair value of intangible assets (primarily customer relationship and data center lease-based intangible assets), property, plant and equipment (primarily building, building improvements, leasehold improvements, data center infrastructure and racking structures), operating leases, contingencies and income taxes (primarily deferred income taxes). See Note 3 to Notes to Consolidated Financial Statements included in this Exhibit 99.1 to this Current Report for a description of recent acquisitions.
Determining the fair values of the net assets acquired requires management’s judgment and often involves the use of assumptions with respect to future cash inflows and outflows, discount rates and market data, among other items. As it relates to our data center acquisitions, the fair values of the net assets acquired requires management’s judgment and often involves the use of assumptions with respect to (i) certain economic costs (as described more fully in Note 2.l. to Notes to Consolidated Financial Statements included in this Exhibit 99.1 to this Current Report) avoided by acquiring a data center operation with active tenants that would have otherwise been incurred if the data center operation was purchased vacant, (ii) market rental rates and (iii) expectations of lease renewals and extensions. Due to the inherent uncertainty of future events, actual values of net assets acquired could be different from our estimated fair values and could have a material impact on our financial statements.
Of the net assets acquired in our acquisitions, the fair value of owned buildings, including building improvements, customer relationship and data center lease-based intangible assets, racking structures and operating leases are generally the most common and most significant. For significant acquisitions or acquisitions involving new markets or new products, we generally use third parties to assist us in estimating the fair value of owned buildings, including building improvements, customer relationship and lease-based intangible assets and market rental rates for acquired operating leases. For acquisitions that are not significant or do not involve new markets or new products, we generally use third parties to assist us in estimating the fair value of acquired owned buildings, including building improvements, and market rental rates for acquired operating leases. When not using third party appraisals of the fair value of acquired net assets, the fair value of acquired customer relationship intangible assets, above and below market in-place operating leases, and racking structures is determined internally. The fair value of acquired racking structures is determined internally by taking current estimated replacement cost at the date of acquisition for the quantity of racking structures acquired, discounted to take into account the quality (e.g. age, material and type) of the racking structures. We use discounted cash flow models to determine the fair value of customer relationship assets, which requires a significant amount of judgment by management, including estimating expected lives of the relationships, expected future cash flows and discount rates. We determine the fair value of tangible data center assets using an estimated replacement cost at the date of acquisition, then discounting for age, economic and functional obsolescence.
Our estimates of fair value are based upon assumptions believed to be reasonable at that time but which are inherently uncertain and unpredictable. Assumptions may be incomplete or inaccurate, and unanticipated events and circumstances may occur, which may affect the accuracy of such assumptions. Total property, plant and equipment and intangible assets acquired in our 2021 acquisitions were approximately $150.1 million and $44.9 million, respectively.
IMPAIRMENT OF TANGIBLE AND INTANGIBLE ASSETS
ASSETS SUBJECT TO DEPRECIATION OR AMORTIZATION
We review long-lived assets and all finite-lived intangible assets for impairment whenever events or changes in circumstances indicate the carrying amount of such assets may not be recoverable. Examples of events or circumstances that may be indicative of impairment include, but are not limited to:
•A significant decrease in the market price of an asset;
•A significant change in the extent or manner in which a long-lived asset is being used or in its physical condition;
•A significant adverse change in legal factors or in the business climate that could affect the value of the asset;
•An accumulation of costs significantly greater than the amount originally expected for the acquisition or construction of an asset;
•A current-period operating or cash flow loss combined with a history of operating or cash flow losses or a projection or forecast that demonstrates continuing losses associated with the use of a long-lived asset; and
•A current expectation that, more likely than not, an asset will be sold or otherwise disposed of significantly before the end of its previously estimated useful life.
If events indicate the carrying value of such assets may not be recoverable, recoverability of these assets is determined by comparing the sum of the forecasted undiscounted net cash flows of the operation to which the assets relate to their carrying amount. The operations are generally distinguished by the business segment and geographic region in which they operate. If it is determined that we are unable to recover the carrying amount of the assets, the long-lived assets are written down, on a pro rata basis, to fair value. Fair value is determined based on discounted cash flows or appraised values, depending upon the nature of the assets.
We did not record impairment charges for any of our long-lived asset and finite-lived intangibles during the years ended December 31, 2021 and 2020. During 2019, we recorded an impairment charge of approximately $24.0 million on the assets associated with the select offerings within our Iron Mountain Iron Cloud portfolio as we explored strategic options regarding how to maintain and support the infrastructure of select offerings within this portfolio.
GOODWILL AND OTHER INDEFINITE-LIVED INTANGIBLE ASSETS NOT SUBJECT TO AMORTIZATION
Goodwill and intangible assets with indefinite lives are not amortized but are reviewed annually for impairment, or more frequently if impairment indicators arise. Other than goodwill, we currently have no intangible assets that have indefinite lives and which are not amortized. See Note 2.k. to Notes to Consolidated Financial Statements included in this Exhibit 99.1 to this Current Report for additional details on our goodwill and other indefinite-lived intangible assets policies.
We have selected October 1 as our annual goodwill impairment review date. We have performed our annual goodwill impairment review as of October 1, 2021, 2020 and 2019. We concluded that as of October 1, 2021, 2020 and 2019, goodwill was not impaired.
Our reporting units at which level we performed our goodwill impairment analysis as of October 1, 2021 were as follows:
| | | | | |
| |
•North American Records and Information Management reporting unit ("North America RIM") •Europe Records and Information Management reporting unit ("Europe RIM") •Latin America Records and Information Management reporting unit ("Latin America RIM") •Australia and New Zealand Records and Information Management reporting unit ("ANZ RIM") | •Asia Records and Information Management reporting unit ("Asia RIM") •Global Data Center •Fine Arts •Entertainment Services |
| |
See Note 2.k. to Notes to Consolidated Financial Statements included in this Exhibit 99.1 to this Current Report for a description of our reporting units.
Based on our goodwill impairment analysis as of October 1, 2021, all of our reporting units had estimated fair values exceeding their carrying values by greater than 20%. Our Global Data Center reporting unit had an estimated fair value that exceeded its carrying value by approximately 23%. The reporting unit represented approximately $426.1 million, or 9.5%, of our consolidated goodwill balance at December 31, 2021. The following is a summary of the Global Data Center reporting unit including the goodwill balance (in thousands), percentage by which the fair value of the reporting unit exceeded its carrying value, and certain key assumptions used by us in determining the fair value of the reporting unit as of October 1, 2021:
| | | | | | | | | | | | | | | | | | | | | | | | | | | | | | | | | | | |
| REPORTING UNIT | GOODWILL
BALANCE AT
OCTOBER 1,
2021 | | PERCENTAGE BY
WHICH THE FAIR VALUE
OF THE REPORTING
UNIT EXCEEDED THE
REPORTING UNIT
CARRYING VALUE AS OF
OCTOBER 1, 2021 | | KEY ASSUMPTIONS IN THE FAIR VALUE OF REPORTING UNIT
MEASUREMENT AS OF OCTOBER 1, 2021 |
| | DISCOUNT
RATE | | AVERAGE ANNUAL
CONTRIBUTION
MARGIN USED IN
DISCOUNTED
CASH FLOW | | AVERAGE ANNUAL CAPITAL EXPENDITURES AS PERCENTAGE OF REVENUE(1) | | TERMINAL GROWTH RATE(2) |
| Global Data Center | $428,992 | | 23.0% | | 6.5% | | 40.2% | | 28.0% | | 3.0% |
| | | | | | | | | | | |
(1)For purposes of our goodwill impairment analysis, the term “capital expenditures” includes both growth investment and recurring capital expenditures. The capital expenditure assumptions in our goodwill impairment analysis include significant growth investment in the next three years.
(2)Terminal growth rates are applied in year 10 of our discounted cash flow analysis.
Reporting unit valuations have generally been determined using a combined approach based on the present value of future cash flows (the “Discounted Cash Flow Model”) and market multiples (the “Market Approach"). There are inherent uncertainties and judgments involved when determining the fair value of the reporting units for purposes of our annual goodwill impairment testing. The following includes supplemental information to the table above for the Data Center reporting unit where the estimated fair value exceeded its carrying value by approximately 23% as of October 1, 2021. The success of this business and the achievement of certain key assumptions developed by management and used in the Discounted Cash Flow Model are contingent upon various factors including, but not limited to, (i) achieving growth from existing customers, (ii) sales to new customers, (iii) increased market penetration and (iv) accurately timing the capital investments related to expansions.
Our Global Data Center Business footprint spans nine markets in the United States: Denver, Colorado; Kansas City, Missouri; Boston, Massachusetts; Boyers, Pennsylvania; Manassas, Virginia; Edison, New Jersey; Columbus, Ohio; and Phoenix and Scottsdale, Arizona and seven international markets: Amsterdam, London, Singapore, Frankfurt (directly and through an unconsolidated joint venture) and through unconsolidated joint ventures in Mumbai, Pune and Noida. We provide enterprise-class data center facilities and hyperscale-ready capacity to protect mission-critical assets and ensure the continued operation of our customers’ IT infrastructure with secure, reliable and flexible data center options. Data centers are highly specialized and secure assets that serve as centralized repositories of server, storage and network equipment. They are capital intensive and designed to provide the space, power, cooling and network connectivity necessary to efficiently operate mission-critical IT equipment. The demand for data center infrastructure is being driven by many factors, but most importantly by significant growth in data as well as an increased demand for outsourcing. In order to attract and retain customers, as well as sustain growth in our existing and new markets, we must have the capability to tailor our facilities and invest capital to meet our customers’ needs. Our estimate of fair value reflects the expected growth in each of our data center markets along with the corresponding capital investments required to meet demand. The business is primarily comprised of acquisitions completed in 2018 and late 2017; therefore, we would expect that the fair value of this reporting unit would closely approximate its carrying value.
Key factors that could reasonably be expected to have a negative impact on the estimated fair value of these reporting units and potentially result in impairment charges include, but are not limited to: (i) a deterioration in general economic conditions, (ii) significant adverse changes in regulatory factors or in the business climate, and (iii) adverse actions or assessment by regulators, all of which could result in adverse changes to the key assumptions used in valuing the reporting units. The inability to meet the assumptions used in the Discounted Cash Flow Model and Market Approach for each of the reporting units, or future adverse market conditions not currently known, could lead to a fair value that is less than the carrying value in any one of our reporting units.
Reporting unit valuations have generally been determined using a combined approach based on the Discounted Cash Flow Model and Market Approach. The Discounted Cash Flow Model incorporates significant assumptions including future revenue growth rates, operating margins, discount rates and capital expenditures. The Market Approach requires us to make assumptions related to Adjusted EBITDA multiples. Changes in economic and operating conditions impacting these assumptions or changes in multiples could result in goodwill impairments in future periods. In conjunction with our annual goodwill impairment reviews, we reconcile the sum of the valuations of all of our reporting units to our market capitalization as of such dates.
Although we believe we have sufficient historical and projected information available to us to test for goodwill impairment, it is possible that actual results could differ from the estimates used in our impairment tests. Of the key assumptions that impact the goodwill impairment test, the expected future cash flows and discount rate are among the most sensitive and are considered to be critical assumptions, as changes to these estimates could have an effect on the estimated fair value of each of our reporting units. We have assessed the sensitivity of these assumptions on each of our reporting units as of October 1, 2021.
| | | | | |
| |
North America RIM, Europe RIM, Latin America RIM, ANZ RIM, Asia RIM, Fine Arts and Entertainment Services | We noted that, based on the estimated fair value of these reporting units determined as of October 1, 2021: •a hypothetical decrease of 10% in the expected annual future cash flows of these reporting units, with all other assumptions unchanged, would have decreased the estimated fair value of these reporting units as of October 1, 2021 by a range of approximately 9.7% to 10.6% but would not, however, have resulted in the carrying value of any of these reporting units with goodwill exceeding their estimated fair value; •a hypothetical increase of 100 basis points in the discount rate, with all other assumptions unchanged, would have decreased the estimated fair value of these reporting units as of October 1, 2021 by a range of approximately 4.2% to 9.9% but would not, however, have resulted in the carrying value of any of these reporting units with goodwill exceeding their estimated fair value. |
| |
| |
Global Data Center | We noted that, as of October 1, 2021, the estimated fair value of the reporting unit: •exceeds its carrying value by approximately 23%. Accordingly, any significant negative change in either the expected annual future cash flows of the reporting unit or the discount rate may result in the carrying value of the reporting unit exceeding its estimated fair value. |
| |
At December 31, 2021, no factors were identified that would alter the conclusions of our October 1, 2021 goodwill impairment analysis. In making this assessment, we considered a number of factors including operating results, business plans, anticipated future cash flows, transactions and marketplace data. There are inherent uncertainties related to these factors and our judgment in applying them to the analysis of goodwill impairment.
During the second quarter of 2022, as a result of the realignment of our global managerial structure, we reassessed the composition of our reportable operating segments (see Note 11 to Notes to Consolidated Financial Statements included in this Exhibit 99.1 to this Current Report for a description and definition of our reportable operating segments) as well as our reporting units.
| | |
| We noted the following changes to our reporting units as a result of the reassessment described above: |
•Our former Europe RIM reporting unit is now managed as two separate reporting units: (1) our Middle East, North Africa and Turkey ("MENAT") businesses will comprise our "MENAT RIM" reporting unit and (2) our other businesses in Europe and South Africa ("ESA") will comprise our “ESA RIM” reporting unit; •our former ANZ RIM and Asia RIM reporting units are now managed as one "APAC RIM" reporting unit; and •our asset lifecycle management ("ALM") business, which includes our legacy secure IT asset disposition business (which was previously included in our North America RIM reporting unit) and the business acquired through our acquisition of Intercept Parent, Inc. ("ITRenew"), will comprise our newly formed "ALM" reporting unit. |
|
There were no changes to our Latin America RIM, ANZ RIM, Asia RIM, Global Data Center and Fine Arts reporting units. We have reassigned goodwill associated with the reporting units impacted by the realignment of our global managerial structure on a relative fair value basis. The fair value of each of our new reporting units was determined based on the application of a combined weighted average approach of preliminary fair value multiples of revenue and earnings and discounted cash flow techniques. These fair values represent our best estimate and preliminary assessment of goodwill allocations to each of the new reporting units on a relative fair value basis. We have completed an interim goodwill impairment analysis before and after the reporting unit changes, and we have concluded that the goodwill associated with each of our reporting units was not impaired.
INCOME TAXES
As a REIT, we are generally permitted to deduct from our federal taxable income the dividends we pay to our stockholders. The income represented by such dividends is not subject to federal taxation at the entity level but is taxed, if at all, at the stockholder level. The income of our domestic TRSs, which hold our domestic operations that may not be REIT-compliant as currently operated and structured, is subject, as applicable, to federal and state corporate income tax. In addition, we and our subsidiaries continue to be subject to foreign income taxes in other jurisdictions in which we have business operations or a taxable presence, regardless of whether assets are held or operations are conducted through subsidiaries disregarded for federal income tax purposes or TRSs. We will also be subject to a separate corporate income tax on any gains recognized on the sale or disposition of any asset previously owned by a C corporation during a five-year period after the date we first owned the asset as a REIT asset that are attributable to "built-in gains" with respect to that asset on that date. We will also be subject to a built-in gains tax on our
depreciation recapture recognized into income as a result of accounting method changes in connection with our acquisition activities. If we fail to remain qualified for taxation as a REIT, we will be subject to federal income tax at regular corporate income tax rates. Even if we remain qualified for taxation as a REIT, we may be subject to some federal, state, local and foreign taxes on our income and property in addition to taxes owed with respect to our TRS operations. In particular, while state income tax regimes often parallel the federal income tax regime for REITs, many states do not completely follow federal rules and some do not follow them at all. See Note 10 to Notes to Consolidated Financial Statements included in this Exhibit 99.1 to this Current Report for additional details on our tax policies.
Accounting for income taxes requires the recognition of deferred tax assets and liabilities for the expected future tax consequences of temporary differences between the tax and financial reporting bases of assets and liabilities and for loss and credit carryforwards. We measure deferred tax assets and liabilities using enacted tax rates expected to be applied to taxable income in the years in which those temporary differences and carryforwards are expected to be recovered or settled. The effect on deferred tax assets and liabilities as a result of a change in tax rates is recognized in income in the period that the change is enacted. Valuation allowances are provided when recovery of deferred tax assets does not meet the more likely than not standard as defined in GAAP. Valuation allowances would be reversed as a reduction to the provision for income taxes if related deferred tax assets are deemed realizable based on changes in facts and circumstances relevant to the recoverability of the asset.
At December 31, 2021, we have federal and state net operating loss carryforwards of which we are expecting an insignificant tax benefit to be realized. We have assets for foreign net operating losses of $85.5 million, with various expiration dates (and in some cases no expiration date), subject to a valuation allowance of approximately 47%. If actual results differ unfavorably from certain of our estimates used, we may not be able to realize all or part of our net deferred income tax assets and additional valuation allowances may be required. Although we believe our estimates are reasonable, no assurance can be given that our estimates reflected in the tax provisions and accruals will equal our actual results. These differences could have a material impact on our income tax provision and operating results in the period in which such determination is made.
The evaluation of an uncertain tax position is a two-step process. The first step is a recognition process whereby we determine whether it is more likely than not that a tax position will be sustained upon examination, including resolution of any related appeals or litigation processes, based on the technical merits of the position. The second step is a measurement process whereby a tax position that meets the more likely than not recognition threshold is calculated to determine the amount of benefit to recognize in the financial statements. The tax position is measured as the largest amount of benefit that is greater than 50% likely of being realized upon ultimate settlement.
We are subject to income taxes in the United States and numerous foreign jurisdictions. We are subject to examination by various tax authorities in jurisdictions in which we have business operations or a taxable presence. We regularly assess the likelihood of additional assessments by tax authorities and provide for these matters as appropriate. As of December 31, 2021 and 2020, we had approximately $27.8 million and $26.0 million, respectively, of reserves related to uncertain tax positions. The reversal of these reserves will be recorded as a reduction of our income tax provision if sustained. Although we believe our tax estimates are appropriate, the final determination of tax audits and any related litigation could result in changes in our estimates.
Following our conversion to a REIT in 2014, we concluded that it was not our intent to reinvest our current and future undistributed earnings of our foreign subsidiaries indefinitely outside the United States. As of December 31, 2016, we concluded that it is our intent to indefinitely reinvest our current and future undistributed earnings of certain of our unconverted foreign TRSs outside the United States. During 2021, as a result of the enactment of a tax law and the closing of various acquisitions, we reassessed this intention and concluded that it is no longer our intention to reinvest our undistributed earnings of our foreign TRSs indefinitely outside the United States. As a REIT, future repatriation of incremental undistributed earnings of our foreign subsidiaries will not be subject to federal or state income tax, with the exception of foreign withholding taxes. However, such future repatriations may require distributions to our stockholders in accordance with REIT distribution rules, and any such distribution may then be taxable, as appropriate, at the stockholder level. We expect to provide for foreign withholding taxes on the current and future earnings of all of our foreign subsidiaries as the result of such reassessment.
RESULTS OF OPERATIONS
The following information summarizes our results of operations for the year ended December 31, 2021 compared to the year ended December 31, 2020 and our results for the year ended December 31, 2020 compared to the year ended December 31, 2019, as restated for the changes in the composition of our reportable operating segments as described in Note 11 to Notes to Consolidated Financial Statements included in this Exhibit 99.1 to this Current Report. For a discussion of our results for the year ended December 31, 2020 compared to the year ended December 31, 2019 for those items not impacted by the changes in the composition of our reportable operating segments, see "Item 7. Management's Discussion and Analysis of Financial Condition and Results of Operations" in our Annual Report on Form 10-K for the year ended December 31, 2020 filed with the SEC on February 24, 2021.
COMPARISON OF YEAR ENDED DECEMBER 31, 2021 TO YEAR ENDED DECEMBER 31, 2020 AND COMPARISON OF YEAR ENDED DECEMBER 31, 2020 TO YEAR ENDED DECEMBER 31, 2019
(IN THOUSANDS):
| | | | | | | | | | | | | | | | | | | | | | | |
| | YEAR ENDED DECEMBER 31, | | DOLLAR
CHANGE | | PERCENTAGE
CHANGE |
| | 2021 | | 2020 | |
| Revenues | $ | 4,491,531 | | | $ | 4,147,270 | | | $ | 344,261 | | | 8.3 | % |
| Operating Expenses | 3,637,359 | | | 3,212,485 | | | 424,874 | | | 13.2 | % |
| Operating Income | 854,172 | | | 934,785 | | | (80,613) | | | (8.6) | % |
| Other Expenses, Net | 401,447 | | | 591,689 | | | (190,242) | | | (32.2) | % |
| Income from Continuing Operations | 452,725 | | | 343,096 | | | 109,629 | | | 32.0 | % |
| Income (Loss) from Discontinued Operations, Net of Tax | — | | | — | | | — | | | — | % |
| Net Income | 452,725 | | | 343,096 | | | 109,629 | | | 32.0 | % |
| Net Income Attributable to Noncontrolling Interests | 2,506 | | | 403 | | | 2,103 | | | 521.8 | % |
| Net Income Attributable to Iron Mountain Incorporated | $ | 450,219 | | | $ | 342,693 | | | $ | 107,526 | | | 31.4 | % |
Adjusted EBITDA(1) | $ | 1,634,699 | | | $ | 1,475,721 | | | $ | 158,978 | | | 10.8 | % |
Adjusted EBITDA Margin(1) | 36.4 | % | | 35.6 | % | | | | |
| | | | | | | | | | | | | | | | | | | | | | | |
| | YEAR ENDED DECEMBER 31, | | DOLLAR
CHANGE | | PERCENTAGE
CHANGE |
| | 2020 | | 2019 | |
| Revenues | $ | 4,147,270 | | | $ | 4,262,584 | | | $ | (115,314) | | | (2.7) | % |
| Operating Expenses | 3,212,485 | | | 3,481,246 | | | (268,761) | | | (7.7) | % |
| Operating Income | 934,785 | | | 781,338 | | | 153,447 | | | 19.6 | % |
| Other Expenses, Net | 591,689 | | | 513,127 | | | 78,562 | | | 15.3 | % |
| Income from Continuing Operations | 343,096 | | | 268,211 | | | 74,885 | | | 27.9 | % |
| Income (Loss) from Discontinued Operations, Net of Tax | — | | | 104 | | | (104) | | | (100.0) | % |
| Net Income | 343,096 | | | 268,315 | | | 74,781 | | | 27.9 | % |
| Net Income Attributable to Noncontrolling Interests | 403 | | | 938 | | | (535) | | | (57.0) | % |
| Net Income Attributable to Iron Mountain Incorporated | $ | 342,693 | | | $ | 267,377 | | | $ | 75,316 | | | 28.2 | % |
Adjusted EBITDA(1) | $ | 1,475,721 | | | $ | 1,469,009 | | | $ | 6,712 | | | 0.5 | % |
Adjusted EBITDA Margin(1) | 35.6 | % | | 34.5 | % | | | | |
(1)See “Non-GAAP Measures—Adjusted EBITDA” in this Exhibit 99.1 to this Current Report for the definitions of Adjusted EBITDA and Adjusted EBITDA Margin, reconciliation of Adjusted EBITDA to Income (Loss) from Continuing Operations and a discussion of why we believe these non-GAAP measures provide relevant and useful information to our current and potential investors.
REVENUES
Consolidated revenues consist of the following (in thousands):
| | | | | | | | | | | | | | | | | | | | | | | | | | | | | | | | | | | | | | | | | |
| | YEAR ENDED DECEMBER 31, | | | | PERCENTAGE CHANGE | | | | |
| | 2021 | | 2020 | | DOLLAR
CHANGE | | ACTUAL | | CONSTANT CURRENCY(1) | | IMPACT OF ACQUISITIONS | | ORGANIC GROWTH(2) |
| Storage Rental | $ | 2,870,119 | | | $ | 2,754,091 | | | $ | 116,028 | | | 4.2 | % | | 2.8 | % | | 0.2 | % | | 2.6 | % |
| Service | 1,621,412 | | | 1,393,179 | | | 228,233 | | | 16.4 | % | | 14.7 | % | | 1.5 | % | | 13.2 | % |
| Total Revenues | $ | 4,491,531 | | | $ | 4,147,270 | | | $ | 344,261 | | | 8.3 | % | | 6.8 | % | | 0.7 | % | | 6.1 | % |
| | | | | | | | | | | | | | | | | | | | | | | | | | | | | | | | | | | | | | | | | |
| | YEAR ENDED DECEMBER 31, | | | | PERCENTAGE CHANGE | | | | |
| | 2020 | | 2019 | | DOLLAR
CHANGE | | ACTUAL | | CONSTANT CURRENCY(1) | | IMPACT OF ACQUISITIONS | | ORGANIC GROWTH(2) |
| Storage Rental | $ | 2,754,091 | | | $ | 2,681,087 | | | $ | 73,004 | | | 2.7 | % | | 3.8 | % | | 1.4 | % | | 2.4 | % |
| Service | 1,393,179 | | | 1,581,497 | | | (188,318) | | | (11.9) | % | | (11.0) | % | | 1.8 | % | | (12.8) | % |
| Total Revenues | $ | 4,147,270 | | | $ | 4,262,584 | | | $ | (115,314) | | | (2.7) | % | | (1.7) | % | | 1.6 | % | | (3.3) | % |
(1)Constant currency growth rates are calculated by translating the 2020 results at the 2021 average exchange rates and the 2019 results at the 2020 average exchange rates.
(2)Our organic revenue growth rate, which is a non-GAAP measure, represents the year-over-year growth rate of our revenues excluding the impact of business acquisitions, divestitures and foreign currency exchange rate fluctuations, but including the impact of acquisitions of customer relationships.
TOTAL REVENUES
For the year ended December 31, 2021, the increase in reported consolidated revenue was driven by reported storage rental revenue growth and reported service revenue growth. Foreign currency exchange rate fluctuations increased our reported consolidated revenues by 1.5% in the year ended December 31, 2021 compared to the prior year period.
STORAGE RENTAL REVENUES AND SERVICE REVENUES
Primary factors influencing the change in reported storage rental revenue and reported service revenue for the year ended December 31, 2021 compared to the year ended December 31, 2020 include the following:
| | | | | |
| |
STORAGE RENTAL REVENUES | •organic storage rental revenue growth driven by increased volume in faster growing markets and our Global Data Center Business segment and revenue management; •a 2.4% increase in total global volume (excluding acquisitions, total global volume increased 0.2%); and •an increase of $37.7 million due to foreign currency exchange rate fluctuations. |
| |
| |
SERVICE REVENUES | •an increase in service activity levels, particularly in regions where governments have lifted or eased COVID-19 related restrictions on our customers' non-essential business operations; •organic service revenue growth reflecting increased service activity levels; and •an increase of $20.8 million due to foreign currency exchange rate fluctuations. |
| |
OPERATING EXPENSES
COST OF SALES
Consolidated Cost of sales (excluding depreciation and amortization) consists of the following expenses (in thousands):
| | | | | | | | | | | | | | | | | | | | | | | | | | | | | | | | | | | | | | | | | | | | | | | |
| | YEAR ENDED DECEMBER 31, | | | | PERCENTAGE CHANGE | | % OF
CONSOLIDATED
REVENUES | | PERCENTAGE
CHANGE
(FAVORABLE)/
UNFAVORABLE |
| | 2021 | | 2020 | | DOLLAR CHANGE | | ACTUAL | | CONSTANT
CURRENCY | | 2021 | | 2020 | |
| Labor | $ | 769,617 | | | $ | 738,038 | | | $ | 31,579 | | | 4.3 | % | | 3.0 | % | | 17.1 | % | | 17.8 | % | | (0.7) | % |
| Facilities | 795,802 | | | 731,679 | | | 64,123 | | | 8.8 | % | | 7.0 | % | | 17.7 | % | | 17.6 | % | | 0.1 | % |
| Transportation | 136,792 | | | 125,591 | | | 11,201 | | | 8.9 | % | | 7.0 | % | | 3.0 | % | | 3.0 | % | | — | % |
| Product Cost of Sales and Other | 185,018 | | | 154,386 | | | 30,632 | | | 19.8 | % | | 18.1 | % | | 4.1 | % | | 3.7 | % | | 0.4 | % |
| COVID-19 Costs | — | | | 7,648 | | | (7,648) | | | (100.0) | % | | (100.0) | % | | — | % | | 0.2 | % | | (0.2) | % |
| Total Cost of sales | $ | 1,887,229 | | | $ | 1,757,342 | | | $ | 129,887 | | | 7.4 | % | | 5.8 | % | | 42.0 | % | | 42.4 | % | | (0.4) | % |
| | | | | | | | | | | | | | | | | | | | | | | | | | | | | | | | | | | | | | | | | | | | | | | |
| | YEAR ENDED DECEMBER 31, | | | | PERCENTAGE CHANGE | | % OF
CONSOLIDATED
REVENUES | | PERCENTAGE
CHANGE
(FAVORABLE)/
UNFAVORABLE |
| | | | |
| | 2020 | | 2019 | | DOLLAR
CHANGE | | ACTUAL | | CONSTANT
CURRENCY | | 2020 | | 2019 | |
| Labor | $ | 738,038 | | | $ | 814,459 | | | $ | (76,421) | | | (9.4) | % | | (7.9) | % | | 17.8 | % | | 19.1 | % | | (1.3) | % |
| Facilities | 731,679 | | | 697,330 | | | 34,349 | | | 4.9 | % | | 6.0 | % | | 17.6 | % | | 16.4 | % | | 1.2 | % |
| Transportation | 125,591 | | | 162,905 | | | (37,314) | | | (22.9) | % | | (22.6) | % | | 3.0 | % | | 3.8 | % | | (0.8) | % |
| Product Cost of Sales and Other | 154,386 | | | 158,621 | | | (4,235) | | | (2.7) | % | | (1.0) | % | | 3.7 | % | | 3.7 | % | | — | % |
| COVID-19 Costs | 7,648 | | | — | | | 7,648 | | | 100.0 | % | | 100.0 | % | | 0.2 | % | | — | % | | 0.2 | % |
| Total Cost of sales | $ | 1,757,342 | | | $ | 1,833,315 | | | $ | (75,973) | | | (4.1) | % | | (2.9) | % | | 42.4 | % | | 43.0 | % | | (0.6) | % |
Primary factors influencing the change in reported consolidated Cost of sales for the year ended December 31, 2021 compared to the year ended December 31, 2020 include the following:
•an increase in labor costs driven by an increase in service activity, particularly in regions where governments have lifted or eased COVID-19 related restrictions on our customers' non-essential business operations, partially offset by benefits from Project Summit;
•an increase in facilities expenses driven by increases in rent expense, reflecting the impact from our sale-leaseback activity during the years ended December 31, 2020 and 2021 (which we expect to continue in 2022 as we continue to look for future opportunities to monetize a small portion of our owned industrial real estate assets as part of our ongoing capital recycling program), as well as increases in utilities and property taxes;
•an increase in product cost of sales and other driven by an increase in project activity; and
•an increase of $25.8 million due to foreign currency exchange rate fluctuations.
SELLING, GENERAL AND ADMINISTRATIVE EXPENSES
Consolidated Selling, general and administrative expenses consists of the following expenses (in thousands):
| | | | | | | | | | | | | | | | | | | | | | | | | | | | | | | | | | | | | | | | | | | | | | | |
| | YEAR ENDED DECEMBER 31, | | | | PERCENTAGE CHANGE | | % OF
CONSOLIDATED
REVENUES | | PERCENTAGE
CHANGE
(FAVORABLE)/
UNFAVORABLE |
| | DOLLAR
CHANGE | | | |
| | 2021 | | 2020 | | ACTUAL | | CONSTANT
CURRENCY | | 2021 | | 2020 | |
| General, Administrative and Other | $ | 760,346 | | | $ | 716,213 | | | $ | 44,133 | | | 6.2 | % | | 5.1 | % | | 16.9 | % | | 17.3 | % | | (0.4) | % |
| Sales, Marketing and Account Management | 262,213 | | | 231,365 | | | 30,848 | | | 13.3 | % | | 11.8 | % | | 5.8 | % | | 5.6 | % | | 0.2 | % |
| COVID-19 Costs | — | | | 1,637 | | | (1,637) | | | (100.0) | % | | (100.0) | % | | — | % | | — | % | | — | % |
| Total Selling, general and administrative expenses | $ | 1,022,559 | | | $ | 949,215 | | | $ | 73,344 | | | 7.7 | % | | 6.6 | % | | 22.8 | % | | 22.9 | % | | (0.1) | % |
| | | | | | | | | | | | | | | | | | | | | | | | | | | | | | | | | | | | | | | | | | | | | | | |
| | YEAR ENDED DECEMBER 31, | | | | PERCENTAGE CHANGE | | % OF
CONSOLIDATED
REVENUES | | PERCENTAGE
CHANGE
(FAVORABLE)/
UNFAVORABLE |
| | 2020 | | 2019 | | DOLLAR
CHANGE | | ACTUAL | | CONSTANT
CURRENCY | | 2020 | | 2019 | |
| General, Administrative and Other | $ | 716,213 | | | $ | 745,960 | | | $ | (29,747) | | | (4.0) | % | | (3.0) | % | | 17.3 | % | | 17.5 | % | | (0.2) | % |
| Sales, Marketing and Account Management | 231,365 | | | 245,704 | | | (14,339) | | | (5.8) | % | | (5.0) | % | | 5.6 | % | | 5.8 | % | | (0.2) | % |
| COVID-19 Costs | 1,637 | | | — | | | 1,637 | | | 100.0 | % | | 100.0 | % | | — | % | | — | % | | — | % |
| Total Selling, general and administrative expenses | $ | 949,215 | | | $ | 991,664 | | | $ | (42,449) | | | (4.3) | % | | (3.4) | % | | 22.9 | % | | 23.3 | % | | (0.4) | % |
Primary factors influencing the change in reported consolidated Selling, general and administrative expenses for the year ended December 31, 2021 compared to the year ended December 31, 2020 include the following:
•an increase in general, administrative and other expenses, driven by higher wages and benefits, stock-based compensation expense and bonus compensation accruals, partially offset by benefits from Project Summit, as well as lower professional fees and bad debt expense;
•an increase in sales, marketing and account management expenses, driven by higher compensation expense, primarily reflecting increased wages and sales commissions, as well as increased marketing costs; and
•an increase of $10.1 million due to foreign currency exchange rate fluctuations.
DEPRECIATION AND AMORTIZATION
Our depreciation and amortization charges result primarily from depreciation related to storage systems, which include racking structures, buildings, building and leasehold improvements and computer systems hardware and software. Amortization relates primarily to customer relationship intangible assets, contract fulfillment costs and data center lease-based intangible assets. Both depreciation and amortization are impacted by the timing of acquisitions.
Depreciation expense increased $17.5 million, or 3.9%, on a reported dollar basis for the year ended December 31, 2021 compared to the year ended December 31, 2020. See Note 2.h. to Notes to Consolidated Financial Statements included in this Exhibit 99.1 to this Current Report for additional information regarding the useful lives over which our property, plant and equipment is depreciated.
Amortization expense increased $10.8 million, or 5.3%, on a reported dollar basis for the year ended December 31, 2021 compared to the year ended December 31, 2020.
ACQUISITION AND INTEGRATION COSTS
Acquisition and integration costs represent operating expenditures directly associated with the closing and integration activities of our business acquisitions that have closed, or are highly probable of closing, and include (i) advisory, legal and professional fees to complete business acquisitions and (ii) costs to integrate acquired businesses into our existing operations, including move, severance, facility upgrade and system integration costs (collectively, "Acquisition and Integration Costs"). Acquisition and Integration Costs do not include costs associated with the formation of joint ventures or costs associated with the acquisition of customer relationships. Acquisition and Integration Costs for the years ended December 31, 2021, 2020 and 2019 was approximately $12.8 million, $0.0 million and $13.3 million, respectively.
RESTRUCTURING CHARGES
Restructuring Charges for the years ended December 31, 2021, 2020 and 2019 were approximately $206.4 million, $194.4 million and $48.6 million, respectively, and primarily consisted of employee severance costs and professional fees associated with Project Summit.
INTANGIBLE IMPAIRMENTS
The intangible impairment charge for the year ended December 31, 2020 was $23.0 million and related to the write-down of goodwill associated with our Fine Arts reporting unit in the first quarter of 2020.
GAIN ON DISPOSAL/WRITE-DOWN OF PROPERTY, PLANT AND
EQUIPMENT, NET
| | | | | | | | | | | | | | |
| | YEAR ENDED DECEMBER 31, |
| | 2021 | | 2020 |
Consolidated gain on disposal/write-down of property, plant and equipment, net | | Approximately $172.0 million | | Approximately $363.5 million |
| The gains primarily consisted of: | | •Gains associated with sale and sale-leaseback transactions of approximately $164.0 million, of which (i) approximately $127.4 million relates to the sale-leaseback transactions of five facilities in the United Kingdom during the second quarter of 2021 and (ii) approximately $36.6 million relates to the sale and sale-leaseback transactions of nine facilities in the United States during the fourth quarter of 2021. | | •Gains associated with sale-leaseback transactions of approximately $342.1 million, of which (i) approximately $265.6 million relates to the sale-leaseback transactions of 14 facilities in the United States during the fourth quarter of 2020 and (ii) approximately $76.4 million relates to the sale-leaseback transactions of two facilities in the United States during the third quarter of 2020 •Gains of approximately $24.1 million associated with the Frankfurt JV (as defined below) transaction.
|
OTHER EXPENSES, NET
INTEREST EXPENSE, NET
Consolidated Interest Expense, Net decreased $0.5 million, to $418.0 million for the year ended December 31, 2021 from $418.5 million for the year ended December 31, 2020. Our weighted average interest rate, inclusive of the commitment fee on the unused portion of our Revolving Credit Facility (as defined below) and fees associated with the letters of credit, was 4.7% and 4.6% at December 31, 2021 and 2020, respectively. See Note 7 to Notes to Consolidated Financial Statements included in this Exhibit 99.1 to this Current Report for additional information regarding our indebtedness.
OTHER (INCOME) EXPENSE, NET
Consolidated other (income) expense, net consists of the following (in thousands):
| | | | | | | | | | | | | | | | | | | | |
| | | YEAR ENDED DECEMBER 31, | | DOLLAR
CHANGE |
| DESCRIPTION | | 2021 | | 2020 | |
| Foreign currency transaction (gains) losses, net | | $ | (15,753) | | | $ | 29,830 | | | $ | (45,583) | |
| Debt extinguishment expense | | — | | | 68,300 | | | (68,300) | |
| Other, net | | (177,051) | | | 45,415 | | | (222,466) | |
| Other (Income) Expense, Net | | $ | (192,804) | | | $ | 143,545 | | | $ | (336,349) | |
FOREIGN CURRENCY TRANSACTION (GAINS) LOSSES, NET
We recorded net foreign currency transaction gains of $15.8 million in the year ended December 31, 2021, based on period-end exchange rates. These gains resulted primarily from the impact of changes in the exchange rate of the Euro and the British pound sterling against the United States dollar compared to December 31, 2020 on our intercompany balances with and between certain of our subsidiaries.
DEBT EXTINGUISHMENT EXPENSE
Debt extinguishment expense represents the call premiums and write-off of unamortized deferred financing costs associated with the early redemption of the 6% Senior Notes due 2023, the 43/8% Senior Notes due 2021, the 53/4% Senior Subordinated Notes due 2024, the 53/8% CAD Senior Notes due 2023, the 3% Euro Senior Notes due 2025 and the 53/8% Senior Notes due 2026.
OTHER, NET
Other, net for the year ended December 31, 2021 consists primarily of (a) a gain of approximately $179.0 million associated with our IPM Divestment and (b) a gain of approximately $20.3 million associated with the loss of control and related deconsolidation, as of May 18, 2021, of one of our wholly owned Netherlands subsidiaries, for which we had value-added tax liability exposure that was recorded in 2019, partially offset by (c) losses on our equity method investments. Other, net for the year ended December 31, 2020 consists primarily of (a) changes in the estimated value of our mandatorily redeemable noncontrolling interests and (b) losses on our equity method investments.
PROVISION (BENEFIT) FOR INCOME TAXES
Our effective tax rates for the years ended December 31, 2021 and 2020 were 28.0% and 7.9%, respectively. Our effective tax rate is subject to variability in the future due to, among other items: (1) changes in the mix of income between our QRSs and our TRSs, as well as among the jurisdictions in which we operate; (2) tax law changes; (3) volatility in foreign exchange gains and losses; (4) the timing of the establishment and reversal of tax reserves; and (5) our ability to utilize net operating losses that we generate.
The primary reconciling items between the federal statutory tax rate of 21.0% and our overall effective tax rate were:
| | | | | | | | |
| YEAR ENDED DECEMBER 31, |
| 2021 | | 2020 |
The benefit derived from the dividends paid deduction of $8.2 million which was offset by (1) the impact of differences in the tax rates at which our foreign earnings are subject to, resulting in a tax provision of $9.9 million, and (2) foreign withholding taxes of $23.7 million, which were either paid during the year or accrued, for the deferred tax liability for the U.S. tax impact of undistributed earnings of foreign TRSs that are no longer intended to be permanently reinvested outside the United States. | | The benefit derived from the dividends paid deduction of $60.4 million and the impact of differences in the tax rates at which our foreign earnings are subject to, resulting in a tax provision of $9.5 million. |
As a REIT, we are entitled to a deduction for dividends paid, resulting in a substantial reduction of federal income tax expense. As a REIT, substantially all of our income tax expense will be incurred based on the earnings generated by our foreign subsidiaries and our domestic TRSs.
We are subject to income taxes in the United States and numerous foreign jurisdictions. We are subject to examination by various tax authorities in jurisdictions in which we have business operations or a taxable presence. We regularly assess the likelihood of additional assessments by tax authorities and provide for these matters as appropriate. Although we believe our tax estimates are appropriate, the final determination of tax audits and any related litigation could result in changes in our estimates.
INCOME (LOSS) FROM CONTINUING OPERATIONS AND ADJUSTED EBITDA
The following table reflects the effect of the foregoing factors on our consolidated income (loss) from continuing operations and Adjusted EBITDA (in thousands):
| | | | | | | | | | | | | | | | | | | | | | | |
| YEAR ENDED DECEMBER 31, | | DOLLAR
CHANGE | | PERCENTAGE
CHANGE |
| 2021 | | 2020 | |
| Income (Loss) from Continuing Operations | $ | 452,725 | | | $ | 343,096 | | | $ | 109,629 | | | 32.0 | % |
| Income (Loss) from Continuing Operations as a percentage of Consolidated Revenue | 10.1 | % | | 8.3 | % | | | | |
| Adjusted EBITDA | $ | 1,634,699 | | | $ | 1,475,721 | | | $ | 158,978 | | | 10.8 | % |
| Adjusted EBITDA Margin | 36.4 | % | | 35.6 | % | | | | |
| | | | | | | | | | | | | | | | | | | | | | | |
| YEAR ENDED DECEMBER 31, | | DOLLAR
CHANGE | | PERCENTAGE
CHANGE |
| 2020 | | 2019 | |
| Income (Loss) from Continuing Operations | $ | 343,096 | | | $ | 268,211 | | | $ | 74,885 | | | 27.9 | % |
| Income (Loss) from Continuing Operations as a percentage of Consolidated Revenue | 8.3 | % | | 6.3 | % | | | | |
| Adjusted EBITDA | $ | 1,475,721 | | | $ | 1,469,009 | | | $ | 6,712 | | | 0.5 | % |
| Adjusted EBITDA Margin | 35.6 | % | | 34.5 | % | | | | |
| | | | | |
| |
Consolidated Adjusted EBITDA Margin for the year ended December 31, 2021 increased by 80 basis points compared to the prior year, reflecting improved service revenue trends, benefits from Project Summit, revenue management and ongoing cost containment measures, partially offset by higher compensation expense and sales commissions. | ↑ INCREASED BY $159.0 MILLION OR 10.8% Consolidated Adjusted EBITDA |
| |
SEGMENT ANALYSIS
See the discussion of Business Segments under Item I and Note 11 to Notes to Consolidated Financial Statements, both included in this Exhibit 99.1 to this Current Report, for a description of our reportable operating segments.
GLOBAL RIM BUSINESS (IN THOUSANDS)
| | | | | | | | | | | | | | | | | | | | | | | | | | | | | | | | | | | | | | | | | |
| | YEAR ENDED DECEMBER 31, | | | | PERCENTAGE CHANGE | | | | |
| | 2021 | | 2020 | | DOLLAR
CHANGE | | ACTUAL | | CONSTANT
CURRENCY | | IMPACT OF
ACQUISITIONS | | ORGANIC
GROWTH |
| Storage Rental | $ | 2,517,208 | | $ | 2,416,147 | | $ | 101,061 | | | 4.2 | % | | 2.7 | % | | 0.8 | % | | 1.9 | % |
| Service | 1,477,780 | | 1,332,457 | | 145,323 | | | 10.9 | % | | 9.2 | % | | 0.6 | % | | 8.6 | % |
| Segment Revenue | $ | 3,994,988 | | $ | 3,748,604 | | $ | 246,384 | | | 6.6 | % | | 5.0 | % | | 0.7 | % | | 4.3 | % |
| Segment Adjusted EBITDA | $ | 1,709,525 | | $ | 1,565,941 | | $ | 143,584 | | | | | | | | | |
| Segment Adjusted EBITDA Margin | 42.8 | % | | 41.8 | % | | | | | | | | | | |
| | | | | | | | | | | | | | | | | | | | | | | | | | | | | | | | | | | | | | | | | |
| | YEAR ENDED DECEMBER 31, | | | | PERCENTAGE CHANGE | | | | |
| | 2020 | | 2019 | | DOLLAR
CHANGE | | ACTUAL | | CONSTANT
CURRENCY | | IMPACT OF
ACQUISITIONS | | ORGANIC
GROWTH |
| Storage Rental | $ | 2,416,147 | | $ | 2,360,794 | | $ | 55,353 | | | 2.3 | % | | 3.7 | % | | 1.7 | % | | 2.0 | % |
| Service | 1,332,457 | | 1,497,948 | | (165,491) | | | (11.0) | % | | (10.1) | % | | 1.9 | % | | (12.0) | % |
| Segment Revenue | $ | 3,748,604 | | $ | 3,858,742 | | $ | (110,138) | | | (2.9) | % | | (1.7) | % | | 1.7 | % | | (3.4) | % |
| Segment Adjusted EBITDA | $ | 1,565,941 | | $ | 1,557,223 | | $ | 8,718 | | | | | | | | | |
| Segment Adjusted EBITDA Margin | 41.8 | % | | 40.4 | % | | | | | | | | | | |
3-YEAR SEGMENT ANALYSIS: GLOBAL RIM BUSINESS (IN MILLIONS)
| | | | | | | | | | | | | | | | | | | | | | | | | | |
| Storage Rental
Revenue | | Service
Revenue | | Segment
Revenue | | Segment Adjusted
EBITDA | |
Primary factors influencing the change in revenue and Adjusted EBITDA Margin in our Global RIM Business segment for the year ended December 31, 2021 compared to the year ended December 31, 2020 include the following:
•organic storage rental revenue growth driven by revenue management and volume;
•a 2.3% increase in Global RIM volume (excluding acquisitions, Global RIM volume increased 0.2%);
•organic service revenue growth mainly driven by increased traditional service activity levels, particularly in regions where governments have lifted or eased COVID-19 related restrictions on our customers' non-essential business operations, and growth in our Global Digital Solutions business;
•an increase in revenue of $56.2 million due to foreign currency exchange rate fluctuations; and
•a 100 basis point increase in Adjusted EBITDA Margin primarily driven by benefits from Project Summit, revenue management, ongoing cost containment measures and lower bad debt expense, partially offset by increases in compensation, benefits, sales commissions and rent expense.
Primary factors influencing the change in revenue and Adjusted EBITDA Margin in our Global RIM Business segment for the year ended December 31, 2020 compared to the year ended December 31, 2019 include the following:
•a decline in organic service revenue mainly driven by reduced service activity levels, primarily due to the COVID-19 pandemic;
•organic storage rental revenue growth driven by revenue management;
•a decrease in revenue of $45.4 million due to foreign currency exchange rate fluctuations;
•a 0.9% increase in Global RIM volume due to acquisitions (excluding acquisitions, Global RIM volume decreased 0.3%); and
•a 140 basis point increase in Adjusted EBITDA Margin primarily driven by benefits from Project Summit, revenue management, favorable revenue mix and ongoing cost containment measures, partially offset by fixed cost deleverage on lower service revenues and higher bonus compensation accruals.
GLOBAL DATA CENTER BUSINESS (IN THOUSANDS)
| | | | | | | | | | | | | | | | | | | | | | | | | | | | | | | | | | | | | | | | | |
| | YEAR ENDED DECEMBER 31, | | | | PERCENTAGE CHANGE | | IMPACT OF ACQUISITIONS | | ORGANIC
GROWTH |
| | 2021 | | 2020 | | DOLLAR
CHANGE | | ACTUAL | | CONSTANT
CURRENCY | | |
| Storage Rental | $ | 289,592 | | $ | 263,695 | | $ | 25,897 | | | 9.8 | % | | 9.0 | % | | 1.0 | % | | 8.0 | % |
| Service | 37,306 | | 15,617 | | 21,689 | | | 138.9 | % | | 137.7 | % | | — | % | | 137.7 | % |
| Segment Revenue | $ | 326,898 | | $ | 279,312 | | $ | 47,586 | | | 17.0 | % | | 16.2 | % | | 0.7 | % | | 15.5 | % |
| Segment Adjusted EBITDA | $ | 137,349 | | $ | 126,576 | | $ | 10,773 | | | | | | | | | |
| Segment Adjusted EBITDA Margin | 42.0 | % | | 45.3 | % | | | | | | | | | | |
| | | | | | | | | | | | | | | | | | | | | | | | | | | | | | | | | | | | | | | | | |
| | YEAR ENDED DECEMBER 31, | | | | PERCENTAGE CHANGE | | IMPACT OF ACQUISITIONS | | ORGANIC
GROWTH |
| | 2020 | | 2019 | | DOLLAR
CHANGE | | ACTUAL | | CONSTANT
CURRENCY | | |
| Storage Rental | $ | 263,695 | | $ | 246,925 | | $ | 16,770 | | | 6.8 | % | | 6.5 | % | | — | % | | 6.5 | % |
| Service | 15,617 | | 10,226 | | 5,391 | | | 52.7 | % | | 51.5 | % | | — | % | | 51.5 | % |
| Segment Revenue | $ | 279,312 | | $ | 257,151 | | $ | 22,161 | | | 8.6 | % | | 8.3 | % | | — | % | | 8.3 | % |
| Segment Adjusted EBITDA | $ | 126,576 | | $ | 121,517 | | $ | 5,059 | | | | | | | | | |
| Segment Adjusted EBITDA Margin | 45.3 | % | | 47.3 | % | | | | | | | | | | |
3-YEAR SEGMENT ANALYSIS: GLOBAL DATA CENTER BUSINESS (IN MILLIONS)
| | | | | | | | | | | | | | | | | | | | | | | |
| Storage Rental
Revenue | | Service
Revenue | | Segment
Revenue | | Segment Adjusted
EBITDA |
Primary factors influencing the change in revenue and Adjusted EBITDA Margin in our Global Data Center Business segment for the year ended December 31, 2021 compared to the year ended December 31, 2020 include the following:
•organic storage rental revenue growth from leases signed during 2021 and in prior periods, and service revenue growth from project revenue, partially offset by churn of 890 basis points;
•an increase in Adjusted EBITDA primarily driven by organic storage rental revenue growth; and
•a 330 basis point decrease in Adjusted EBITDA Margin reflecting a change in revenue mix due to lower margin project revenue during the period, which is expected to have a temporary impact on segment margins.
CORPORATE AND OTHER BUSINESS (IN THOUSANDS)
| | | | | | | | | | | | | | | | | | | | | | | | | | | | | | | | | | | | | | | | | |
| | YEAR ENDED DECEMBER 31, | | | | PERCENTAGE CHANGE | | IMPACT OF
ACQUISITIONS | | ORGANIC
GROWTH |
| | 2021 | | 2020 | | DOLLAR
CHANGE | | ACTUAL | | CONSTANT
CURRENCY | | |
| Storage Rental | $ | 63,319 | | $ | 74,249 | | $ | (10,930) | | | (14.7) | % | | (14.9) | % | | (19.6) | % | | 4.7 | % |
| Service | 106,326 | | 45,105 | | 61,221 | | | 135.7 | % | | 135.2 | % | | 29.7 | % | | 105.5 | % |
| Segment Revenue | $ | 169,645 | | $ | 119,354 | | $ | 50,291 | | | 42.1 | % | | 41.9 | % | | (7.8) | % | | 49.7 | % |
| Segment Adjusted EBITDA | $ | (212,175) | | $ | (216,796) | | $ | 4,621 | | | | | | | | | |
| Segment Adjusted EBITDA as a Percentage of Consolidated Revenue | (4.7) | % | | (5.2) | % | | | | | | | | | | |
| | | | | | | | | | | | | | | | | | | | | | | | | | | | | | | | | | | | | | | | | |
| | YEAR ENDED DECEMBER 31, | | | | PERCENTAGE CHANGE | | IMPACT OF
ACQUISITIONS | | ORGANIC
GROWTH |
| | 2020 | | 2019 | | DOLLAR
CHANGE | | ACTUAL | | CONSTANT
CURRENCY | | |
| Storage Rental | $ | 74,249 | | $ | 73,368 | | $ | 881 | | | 1.2 | % | | 1.0 | % | | (0.2) | % | | 1.2 | % |
| Service | 45,105 | | 73,323 | | (28,218) | | | (38.5) | % | | (38.4) | % | | 0.3 | % | | (38.7) | % |
| Segment Revenue | $ | 119,354 | | $ | 146,691 | | $ | (27,337) | | | (18.6) | % | | (18.6) | % | | 0.2 | % | | (18.8) | % |
| Segment Adjusted EBITDA | $ | (216,796) | | $ | (209,731) | | $ | (7,065) | | | | | | | | | |
| Segment Adjusted EBITDA as a Percentage of Consolidated Revenue | (5.2) | % | | (4.9) | % | | | | | | | | | | |
Primary factors influencing the change in revenue and Adjusted EBITDA in our Corporate and Other Business segment for the year ended December 31, 2021 compared to the year ended December 31, 2020 include the following:
•organic service revenue growth mainly driven by increased service activity levels in our Fine Arts business, particularly in regions where governments have lifted or eased COVID-19 related restrictions on our customers' non-essential business operations, and growth in our ALM business; and
•an increase in Adjusted EBITDA driven by growth in our ALM business and improved service revenue trends, as well as benefits from Project Summit, decreased professional fees and ongoing cost containment measures, partially offset by higher wages, benefits and bonus compensation accruals.
Primary factors influencing the change in revenue and Adjusted EBITDA in our Corporate and Other Business segment for the year ended December 31, 2020 compared to the year ended December 31, 2019 include the following:
•a decline in organic service revenue due to lower service activity levels in our Fine Arts business, primarily related to the COVID-19 pandemic; and
•a decrease in Adjusted EBITDA reflecting the impact of lower service activity in our Fine Arts business, increased information technology expenses and higher bonus compensation accruals, partially offset by benefits from Project Summit.
LIQUIDITY AND CAPITAL RESOURCES
GENERAL
We expect to meet our short-term and long-term cash flow requirements through cash generated from operations, cash on hand, borrowings under our Credit Agreement (as defined below) and proceeds from monetizing a small portion of our total industrial real estate assets, as well as other potential financings (such as the issuance of debt or equity). Our cash flow requirements, both in the near and long term, include, but are not limited to, capital expenditures, the repayment of outstanding debt, shareholder dividends, potential and pending business acquisitions and normal business operation needs.
PROJECT SUMMIT
As disclosed above, in October 2019, we announced Project Summit. From the inception of Project Summit through December 31, 2021, we have incurred approximately $450.0 million of Restructuring Charges related to Project Summit, primarily related to employee severance costs, internal costs associated with the development and implementation of Project Summit initiatives and professional fees. From the inception of Project Summit through December 31, 2021, we have also incurred approximately $33.8 million of capital expenditures. As of December 31, 2021, we have completed Project Summit.
CASH FLOWS
The following is a summary of our cash balances and cash flows (in thousands) as of and for the years ended December 31,
| | | | | | | | | | | | | | | | | |
| 2021 | | 2020 | | 2019 |
| Cash Flows from Operating Activities - Continuing Operations | $ | 758,902 | | | $ | 987,657 | | | $ | 966,655 | |
| Cash Flows from Investing Activities - Continuing Operations | (473,313) | | | (85,440) | | | (735,946) | |
| Cash Flows from Financing Activities - Continuing Operations | (220,806) | | | (886,699) | | | (198,973) | |
| Cash and Cash Equivalents, including Restricted Cash, End of Year | 255,828 | | | 205,063 | | | 193,555 | |
A. CASH FLOWS FROM OPERATING ACTIVITIES
For the year ended December 31, 2021, net cash flows provided by operating activities decreased by $228.8 million compared to the prior year period primarily due to a decrease in cash from working capital of $266.0 million, primarily related to the collections of accounts receivable and timing of accounts payable and accrued expenses, partially offset by an increase in net income (including non-cash charges) of $37.2 million.
B. CASH FLOWS FROM INVESTING ACTIVITIES
Our significant investing activities during the year ended December 31, 2021 are highlighted below:
•We paid cash for capital expenditures of $611.1 million. Additional details of our capital spending are included in the “Capital Expenditures” section below.
•We paid cash for acquisitions (net of cash acquired) of $204.0 million, primarily funded by borrowings under our Revolving Credit Facility.
•We received $278.3 million in proceeds from sales of property, plant and equipment, primarily related to proceeds from sale and sale-leaseback transactions of 14 facilities in the United Kingdom and the United States during the second and fourth quarters of 2021.
•We received $213.9 million in net proceeds from the IPM Divestment.
C. CASH FLOWS FROM FINANCING ACTIVITIES
Our significant financing activities for the year ended December 31, 2021 included:
•Net proceeds of $737.8 million associated with the issuance of the 5% Notes due 2032 (as defined below).
•Net payments of $192.3 million primarily associated with repayment of borrowings under the Revolving Credit Facility and the Accounts Receivable Securitization Program.
•Purchase of noncontrolling interest of $75.0 million.
•Payment of dividends in the amount of $718.3 million on our common stock.
CAPITAL EXPENDITURES
We present two categories of capital expenditures: (1) Growth Investment Capital Expenditures and (2) Recurring Capital Expenditures with the following sub-categories: (i) Data Center; (ii) Real Estate; (iii) Innovation and Other (for Growth Investment Capital Expenditures only); and (iv) Non-Real Estate (for Recurring Capital Expenditures only).
GROWTH INVESTMENT CAPITAL EXPENDITURES:
•Data Center: Expenditures primarily related to investments in new construction of data center facilities (including the acquisition of land and development of facilities) or capacity expansion in existing buildings.
•Real Estate: Expenditures primarily related to investments in land, buildings, building improvements, leasehold improvements and racking structures to grow our revenues or achieve operational efficiencies.
•Innovation and Other: Discretionary capital expenditures for significant new products and services, restructuring (including Project Summit), and integration of acquisitions.
RECURRING CAPITAL EXPENDITURES:
•Real Estate: Expenditures primarily related to the replacement of components of real estate assets such as buildings, building improvements, leasehold improvements and racking structures.
•Non-Real Estate: Expenditures primarily related to the replacement of containers and shred bins, warehouse equipment, fixtures, computer hardware, or third-party or internally-developed software assets that support the maintenance of existing revenues or avoidance of an increase in costs.
•Data Center: Expenditures related to the upgrade or re-configuration of existing data center assets.
The following table presents our capital spend for 2021, 2020 and 2019 organized by the type of the spending as described above.
| | | | | | | | | | | | | | | | | | | | |
NATURE OF CAPITAL SPEND (IN THOUSANDS) | | 2021 | | 2020 | | 2019 |
| Growth Investment Capital Expenditures: | | | | | | |
| Data Center | | $ | 308,701 | | | $ | 216,491 | | | $ | 401,902 | |
| Real Estate | | 112,441 | | | 67,217 | | | 133,093 | |
| Innovation and Other | | 37,078 | | | 18,810 | | | 17,555 | |
| Total Growth Investment Capital Expenditures | | 458,220 | | | 302,518 | | | 552,550 | |
| Recurring Capital Expenditures: | | | | | | |
| Real Estate | | 67,032 | | | 51,009 | | | 55,444 | |
| Non-Real Estate | | 67,822 | | | 76,124 | | | 74,092 | |
| Data Center | | 13,347 | | | 15,959 | | | 8,589 | |
| Total Recurring Capital Expenditures | | 148,201 | | | 143,092 | | | 138,125 | |
| Total Capital Spend (on accrual basis) | | 606,421 | | | 445,610 | | | 690,675 | |
| Net increase (decrease) in prepaid capital expenditures | | 1,343 | | | 1,836 | | | 510 | |
| Net decrease (increase) in accrued capital expenditures | | 3,318 | | | (9,183) | | | 1,798 | |
| Total Capital Spend (on cash basis) | | $ | 611,082 | | | $ | 438,263 | | | $ | 692,983 | |
Excluding capital expenditures associated with potential future acquisitions, we expect total capital expenditures of approximately $850.0 million for the year ending December 31, 2022. Of this, we expect our capital expenditures for growth investment to be approximately $700.0 million, and our recurring capital expenditures to approach $155.0 million. Approximately three-quarters of our expected capital expenditures for growth investment relates to Global Data Center Business development spend.
DIVIDENDS
See Note 9 to Notes to Consolidated Financial Statements included in this Exhibit 99.1 to this Current Report for information on dividends.
FINANCIAL INSTRUMENTS AND DEBT
Financial instruments that potentially subject us to credit risk consist principally of cash and cash equivalents (including money market funds) and accounts receivable. The only significant concentration of liquid investments as of December 31, 2021 is related to cash and cash equivalents. See Note 2.f. to Notes to the Consolidated Financial Statements included in this Exhibit 99.1 to this Current Report for information on our money market funds.
Long-term debt as of December 31, 2021 is as follows (in thousands):
| | | | | | | | | | | | | | | | | |
| | DECEMBER 31, 2021 |
| | DEBT (INCLUSIVE OF DISCOUNT) | | UNAMORTIZED DEFERRED FINANCING COSTS | | CARRYING AMOUNT |
| Revolving Credit Facility | $ | — | | | $ | (5,174) | | | $ | (5,174) | |
| Term Loan A | 203,125 | | | — | | | 203,125 | |
| Term Loan B | 672,847 | | | (4,995) | | | 667,852 | |
| Australian Dollar Term Loan (the "AUD Term Loan") | 223,182 | | | (656) | | | 222,526 | |
| UK Bilateral Revolving Credit Facility | 189,168 | | | (709) | | | 188,459 | |
37/8% GBP Senior Notes due 2025 (the "GBP Notes") | 540,481 | | | (3,912) | | | 536,569 | |
47/8% Senior Notes due 2027 (the "47/8% Notes due 2027") | 1,000,000 | | | (8,176) | | | 991,824 | |
51/4% Senior Notes due 2028 (the "51/4% Notes due 2028") | 825,000 | | | (7,380) | | | 817,620 | |
| 5% Senior Notes due 2028 (the "5% Notes due 2028") | 500,000 | | | (4,763) | | | 495,237 | |
47/8% Senior Notes due 2029 (the "47/8% Notes due 2029") | 1,000,000 | | | (11,211) | | | 988,789 | |
51/4% Senior Notes due 2030 (the "51/4% Notes due 2030") | 1,300,000 | | | (12,911) | | | 1,287,089 | |
41/2% Senior Notes due 2031 (the "41/2% Notes") | 1,100,000 | | | (11,404) | | | 1,088,596 | |
| 5% Senior Notes due 2032 (the "5% Notes due 2032") | 750,000 | | | (13,782) | | | 736,218 | |
55/8% Senior Notes due 2032 (the "55/8% Notes") | 600,000 | | | (6,147) | | | 593,853 | |
| Real Estate Mortgages, Financing Lease Liabilities and Other | 460,648 | | | (840) | | | 459,808 | |
| Accounts Receivable Securitization Program | — | | | (450) | | | (450) | |
| | | | | |
| Total Long-term Debt | 9,364,451 | | | (92,510) | | | 9,271,941 | |
| Less Current Portion | (310,084) | | | 656 | | | (309,428) | |
| Long-term Debt, Net of Current Portion | $ | 9,054,367 | | | $ | (91,854) | | | $ | 8,962,513 | |
See Note 7 to Notes to Consolidated Financial Statements included in this Exhibit 99.1 to this Current Report for additional information regarding our long-term debt.
CREDIT AGREEMENT
Our credit agreement (the "Credit Agreement") consists of a revolving credit facility (the “Revolving Credit Facility”) and a term loan (the “Term Loan A”). The Revolving Credit Facility enables IMI and certain of its United States and foreign subsidiaries to borrow in United States dollars and (subject to sublimits) a variety of other currencies (including Canadian dollars, British pounds sterling and Euros, among other currencies) in an aggregate outstanding amount not to exceed $1,750.0 million. Under the Credit Agreement, we have the option to request additional commitments of up to $1,260.0 million, in the form of term loans or through increased commitments under the Revolving Credit Facility, subject to the conditions specified in the Credit Agreement. The Credit Agreement is scheduled to mature on June 3, 2023, at which point all obligations become due. The original principal amount of the Term Loan A was $250.0 million and is to be paid in quarterly installments in an amount equal to $3.1 million per quarter, with the remaining balance due on June 3, 2023.
IMI and the Guarantors guarantee all obligations under the Credit Agreement. The interest rate on borrowings under the Credit Agreement varies depending on our choice of interest rate and currency options, plus an applicable margin, which varies based on our consolidated leverage ratio. Additionally, the Credit Agreement requires the payment of a commitment fee on the unused portion of the Revolving Credit Facility, which fee ranges from between 0.25% to 0.4% based on our consolidated leverage ratio and fees associated with outstanding letters of credit. As of December 31, 2021, we had no outstanding borrowings under the Revolving Credit Facility and $203.1 million aggregate outstanding principal amount under the Term Loan A. At December 31, 2021, we had various outstanding letters of credit totaling $3,039 under the Revolving Credit Facility. The amount available for borrowing under the Revolving Credit Facility as of December 31, 2021, which is based on IMI’s leverage ratio, the last 12 months' earnings before interest, taxes, depreciation and amortization and rent expense (“EBITDAR”), other adjustments as defined in the Credit Agreement and current external debt, was $1,747.0 million (which amount represents the maximum availability as of such date). Available borrowings under the Revolving Credit Facility are subject to compliance with our indenture covenants as discussed below. The average interest rate in effect under the Revolving Credit Facility and Term Loan A was 1.9% as of December 31, 2021.
IMI’s wholly owned subsidiary, Iron Mountain Information Management, LLC (“IMIM”), has an incremental term loan B with a principal amount of $700.0 million (the “Term Loan B”). The Term Loan B, which matures on January 2, 2026, was issued at 99.75% of par. The Term Loan B holders benefit from the same security and guarantees as other borrowings under the Credit Agreement. The Term Loan B holders also benefit from the same affirmative and negative covenants as other borrowings under the Credit Agreement; however, the Term Loan B holders are not generally entitled to the benefits of the financial covenants under the Credit Agreement.
Principal payments on the Term Loan B are to be paid in quarterly installments of $1.8 million per quarter during the period June 30, 2018 through December 31, 2025, with the balance due on January 2, 2026. The Term Loan B may be prepaid without penalty at any time. The Term Loan B bears interest at a rate of LIBOR plus 1.75%. As of December 31, 2021, we had $673.8 million aggregate outstanding principal amount under the Term Loan B. The interest rate in effect under Term Loan B as of December 31, 2021 was 3.1%.
DECEMBER 2021 OFFERING
On December 28, 2021, Iron Mountain Information Management Services, Inc., one of our wholly owned subsidiaries, completed a private offering of $750.0 million in aggregate principal amount of the 5% Notes due 2032. The 5% Notes due 2032 were issued at 100.000% of par. The total net proceeds of approximately $738.0 million from the issuance of the 5% Notes due 2032, after deducting the initial purchasers’ commissions, were used to finance the purchase price of the ITRenew Transaction, which closed on January 25, 2022, and to pay related fees and expenses. At December 31, 2021, the net proceeds from the 5% Notes due 2032, were used to temporarily repay borrowings under our Revolving Credit Facility and Accounts Receivable Securitization Program and invest in money market funds. The 5% Notes due 2032 are fully and unconditionally guaranteed, on a senior basis, by IMI and the other Guarantors.
UK BILATERAL REVOLVING CREDIT FACILITY
Iron Mountain (UK) PLC and Iron Mountain (UK) Data Centre Limited (collectively, the "UK Borrowers") have a 140.0 million British pounds sterling Revolving Credit Facility (the “UK Bilateral Facility”) with Barclays Bank PLC. The maximum amount permitted to be borrowed under the UK Bilateral Facility is 140.0 million British pounds sterling, and we have the option to request additional commitments of up to 125.0 million British pounds sterling, subject to the conditions specified in the UK Bilateral Facility. The UK Bilateral Facility is fully drawn. The UK Bilateral Facility is secured by certain properties in the United Kingdom. IMI and the Guarantors guarantee all obligations under the UK Bilateral Facility. The UK Bilateral Facility was originally scheduled to mature on September 23, 2022, at which point all obligations were to become due.
On May 25, 2021, the UK Borrowers entered into an amendment to the UK Bilateral Facility with Barclays Bank PLC to (i) modify the interest rate from LIBOR plus 2.25% to LIBOR plus 2.0% (with flexibility built in for the expected transition away from LIBOR) and (ii) add an additional option to extend the maturity date by one year. After this amendment, the UK Bilateral Facility contains two one-year options that allow us to extend the maturity date beyond the September 23, 2022 expiration date, subject to certain conditions specified in the UK Bilateral Facility, including the lender's consent. On September 23, 2021, the UK Borrowers executed the one-year option to extend the maturity date to September 24, 2023.The interest rate in effect under the UK Bilateral Facility was 2.1% as of December 31, 2021.
ACCOUNTS RECEIVABLE SECURITIZATION PROGRAM
We participate in an accounts receivable securitization program (the “Accounts Receivable Securitization Program”) involving several of our wholly owned subsidiaries and certain financial institutions. Under the Accounts Receivable Securitization Program, certain of our subsidiaries sell substantially all of their United States accounts receivable balances to our wholly owned special purpose entities, Iron Mountain Receivables QRS, LLC and Iron Mountain Receivables TRS, LLC (the “Accounts Receivable Securitization Special Purpose Subsidiaries”). The Accounts Receivable Securitization Special Purpose Subsidiaries use the accounts receivable balances to collateralize loans obtained from certain financial institutions. The Accounts Receivable Securitization Special Purpose Subsidiaries are consolidated subsidiaries of IMI. IMIM retains the responsibility of servicing the accounts receivable balances pledged as collateral for the Accounts Receivable Securitization Program and IMI provides a performance guaranty. The maximum availability allowed is limited by eligible accounts receivable, as defined under the terms of the Accounts Receivable Securitization Program.
On June 28, 2021, we entered into an amendment to the Accounts Receivable Securitization Program to extend the maturity date from July 30, 2021 to July 1, 2023, at which point all obligations become due. The interest rate under the amended Accounts Receivable Securitization Program is LIBOR plus 1.0%. As of December 31, 2021, the maximum amount available under the Accounts Receivable Securitization Program was $300.0 million. There were no amounts outstanding under the Accounts Receivable Securitization Program as of December 31, 2021. Commitment fees at a rate of 40 basis points are charged on amounts made available but not borrowed under the Accounts Receivable Securitization Program.
LETTERS OF CREDIT
As of December 31, 2021, we had outstanding letters of credit totaling $36,480, of which $3,039 reduce our borrowing capacity under the Revolving Credit Facility (as described above). The letters of credit expire at various dates between January 2022 and March 2025.
DEBT COVENANTS
The Credit Agreement (as defined in Note 7 to Notes of Consolidated Financial Statements included in this Exhibit 99.1 to this Current Report), our bond indentures and other agreements governing our indebtedness contain certain restrictive financial and operating covenants, including covenants that restrict our ability to complete acquisitions, pay cash dividends, incur indebtedness, make investments, sell assets and take other specified corporate actions. The covenants do not contain a rating trigger. Therefore, a change in our debt rating would not trigger a default under the Credit Agreement, our bond indentures or other agreements governing our indebtedness. The Credit Agreement requires that we satisfy a fixed charge coverage ratio, a net total lease adjusted leverage ratio and a net secured debt lease adjusted leverage ratio on a quarterly basis and our bond indentures require that, among other things, we satisfy a leverage ratio (not lease adjusted) or a fixed charge coverage ratio (not lease adjusted), as a condition to taking actions such as paying dividends and incurring indebtedness.
The Credit Agreement uses EBITDAR-based calculations and the bond indentures use EBITDA-based calculations as the primary measures of financial performance for purposes of calculating leverage and fixed charge coverage ratios. The bond indenture EBITDA-based calculations include our consolidated subsidiaries, other than those we have designated as “Unrestricted Subsidiaries” as defined in the bond indentures. Generally, the Credit Agreement and the bond indentures use a trailing four fiscal quarter basis for purposes of the relevant calculations and require certain adjustments and exclusions for purposes of those calculations, which make the calculation of financial performance for purposes of those calculations under the Credit Agreement and bond indentures not directly comparable to Adjusted EBITDA as presented herein. These adjustments can be significant. For example, the calculation of financial performance under the Credit Agreement and certain of our bond indentures includes (subject to specified exceptions and caps) adjustments for non-cash charges and for expected benefits associated with (i) completed acquisitions, (ii) certain executed lease agreements associated with our data center business that have yet to commence, and (iii) restructuring and other strategic initiatives, such as Project Summit. The calculation of financial performance under our other bond indentures includes, for example, adjustments for non-cash charges and for expected benefits associated with (i) completed acquisitions, and (ii) events that are extraordinary, unusual or non-recurring, such as the COVID-19 pandemic.
Our leverage and fixed charge coverage ratios under the Credit Agreement as of December 31, 2021 are as follows:
| | | | | | | | |
| | DECEMBER 31, 2021 | MAXIMUM/MINIMUM ALLOWABLE |
| Net total lease adjusted leverage ratio | 5.3 | | Maximum allowable of 6.5 |
| Net secured debt lease adjusted leverage ratio | 1.8 | | Maximum allowable of 4.0 |
| Fixed charge coverage ratio | 2.4 | | Minimum allowable of 1.5 |
We are in compliance with our leverage and fixed charge coverage ratios under the Credit Agreement, our bond indentures and other agreements governing our indebtedness as of December 31, 2021. Noncompliance with these leverage and fixed charge coverage ratios would have a material adverse effect on our financial condition and liquidity.
___________________________________________________________________________________________________
Our ability to pay interest on or to refinance our indebtedness depends on our future performance, working capital levels and capital structure, which are subject to general economic, financial, competitive, legislative, regulatory and other factors which may be beyond our control. There can be no assurance that we will generate sufficient cash flow from our operations or that future financings will be available on acceptable terms or in amounts sufficient to enable us to service or refinance our indebtedness or to make necessary capital expenditures.
DERIVATIVE INSTRUMENTS
INTEREST RATE SWAP AGREEMENTS
In March 2018, we entered into interest rate swap agreements to limit our exposure to changes in interest rates on a portion of our floating rate indebtedness. As of December 31, 2021, we had $350.0 million in notional value of interest rate swap agreements outstanding, which expire in March 2022. Under the interest rate swap agreements, we receive variable rate interest payments associated with the notional amount of each interest rate swap, based upon one-month LIBOR, in exchange for the payment of fixed interest rates as specified in the interest rate swap agreements.
In July 2019, we entered into forward-starting interest rate swap agreements to limit our exposure to changes in interest rates on a portion of our floating rate indebtedness once our current interest rate swap agreements expire in March 2022. The forward-starting interest rate swap agreements have $350.0 million in notional value, commence in March 2022 and expire in March 2024. Under the swap agreements, we will receive variable rate interest payments based upon one-month LIBOR, in exchange for the payment of fixed interest rates as specified in the interest rate swap agreements.
We have designated these interest rate swap agreements, including the forward-starting interest rate swap agreements, as cash flow hedges.
CROSS-CURRENCY SWAP AGREEMENTS
We enter into cross-currency swap agreements to hedge the variability of exchange rate impacts between the United States dollar and the Euro. The cross-currency swap agreements are designated as a hedge of net investment against certain of our Euro denominated subsidiaries and require an exchange of the notional amounts at maturity.
In August 2019, we entered into cross-currency swap agreements whereby we notionally exchanged approximately $110.0 million at an interest rate of 6.0% for approximately 99.1 million Euros at a weighted average interest rate of approximately 3.65%. These cross-currency swap agreements expire in August 2023.
In September 2020, we entered into cross-currency swap agreements whereby we notionally exchanged approximately $359.2 million at an interest rate of 4.5% for approximately 300.0 million Euros at a weighted average interest rate of approximately 3.4%. These cross-currency swap agreements expire in February 2026.
See Note 6 to Notes to Consolidated Financial Statements included in this Exhibit 99.1 to this Current Report for additional information on our derivative instruments.
EQUITY FINANCING
In 2017, we entered into a Distribution Agreement with the Agents pursuant to which we could sell, from time to time, up to an aggregate sales price of $500.0 million of our common stock through the At The Market (ATM) Equity Program. On February 15, 2022, the Distribution Agreement was terminated.
During the quarter and year ended December 31, 2021, there were no shares of common stock sold under the At The Market (ATM) Equity Program.
ACQUISITIONS
See Note 3 to Notes to Consolidated Financial Statements included in this Exhibit 99.1 to this Current Report for information regarding our 2021 acquisitions.
INFOFORT ACQUISITION
On September 15, 2021, in order to further expand our records management operations in the Middle East and North Africa, we acquired Information Fort, LLC, a records and information management provider, for approximately $90.3 million.
FRANKFURT DATA CENTER ACQUISITION
On September 23, 2021, in order to further enhance our data center operations in Germany, we completed the acquisition of assets of a Frankfurt data center for approximately 77.9 million Euros (or approximately $91.3 million, based upon the exchange rate between the Euro and the United States dollar on the closing date of this acquisition).
OTHER 2021 ACQUISITIONS
In addition to the transactions noted above, during the year ended December 31, 2021, in order to enhance our existing operations in the United Kingdom and Indonesia and to expand our operations into Morocco, we completed the acquisition of two records management companies and one art storage company for total cash consideration of approximately $45.1 million.
2022 ACQUISITION OF ITRENEW
On January 25, 2022, we acquired an approximately 80% interest in Intercept Parent, Inc. ("ITRenew"), a company with asset lifecycle management operations primarily in the United States, for approximately $725.0 million (the “ITRenew Transaction”). The acquisition agreement also provides us the option to purchase, and the shareholders the option to sell, the remaining approximately 20% interest in ITRenew as follows: (i) approximately 16% on or after the second anniversary of the ITRenew Transaction and (ii) approximately 4% on or after the third anniversary of the ITRenew Transaction (collectively, the “Remaining Interest”), each at a purchase price to be determined based upon the achievement of certain performance metrics, but for no less than $200.0 million in total.
INVESTMENTS
See Note 5 to Notes to Consolidated Financial Statements included in this Exhibit 99.1 to this Current Report for information regarding our joint ventures.
2021 NEWLY FORMED JOINT VENTURE
In April 2021, we closed on an agreement to form a joint venture (the "Web Werks JV") with the shareholders of Web Werks India Private Limited ("Web Werks"), a colocation data center provider in India. In connection with the formation of the Web Werks JV, we made an initial investment of approximately 3,750.0 million Indian rupees (or approximately $50.1 million, based upon the exchange rate between the United States dollar and Indian rupee as of the closing date of the initial investment) in exchange for a noncontrolling interest in the form of convertible preference shares in the Web Werks JV (the “Initial Web Werks JV Investment”). These shares are convertible into a to-be-determined amount of common shares based upon the achievement of EBITDA targets for the Web Werks JV's fiscal year ending March 31, 2022.
Under the terms of the Web Werks JV shareholder agreement, we are required to make additional investments over a period ending May 2023 totaling approximately 7,500.0 million Indian rupees (or approximately $100.0 million, based upon the exchange rate as of December 31, 2021 between the United States dollar and Indian rupee).
JOINT VENTURE SUMMARY
The following joint ventures are accounted for as equity method investments and are presented as a component of Other within Other assets, net in our Consolidated Balance Sheet. The carrying values and equity interests in our joint ventures at December 31, 2021 are as follows (in thousands):
| | | | | | | | | | | |
| DECEMBER 31, 2021 |
| CARRYING VALUE | | EQUITY INTEREST |
Web Werks JV | $ | 51,140 | | | 38.50 | % |
Joint venture with AGC Equity Partners ("Frankfurt JV") | 26,167 | | | 20.00 | % |
Joint venture with MakeSpace JV(1)(2) | 30,154 | | | 49.99 | % |
(1) In 2021, we made quarterly capital contributions to this joint venture which totaled approximately $26.0 million.
(2) In February 2022, the MakeSpace JV entered into an agreement with Clutter, Inc. (“Clutter”) pursuant to which we and MakeSpace contributed our ownership interest in the MakeSpace JV and Clutter’s shareholders contributed their ownership interests in Clutter to create a newly formed venture (the “Clutter JV”). In exchange for our 49.99% interest in the MakeSpace JV, we received an approximate 27% interest in the Clutter JV.
NET OPERATING LOSSES
At December 31, 2021, we have federal and state net operating loss carryforwards of which we are expecting an insignificant tax benefit to be realized. We have assets for foreign net operating losses of $85.5 million, with various expiration dates (and in some cases no expiration date), subject to a valuation allowance of approximately 47%.
PART IV
ITEM 15. EXHIBITS AND FINANCIAL STATEMENT SCHEDULES.
(a)Financial Statements filed as part of this report:
| | | | | |
| | PAGE |
| IRON MOUNTAIN INCORPORATED | |
Report of Independent Registered Public Accounting Firm (PCAOB ID No. 34) | |
| |
| |
| |
| |
| |
| |
| |
(b) The exhibits listed in the exhibit index beginning on page 138 of our Original Annual Report, which include management contracts, compensatory plans and arrangements required to be filed as exhibits to the Annual Report on Form 10-K by Item 601(10)(iii) of Regulation S-K, are filed as part of this report, as updated by the following revised exhibit:
23.1 Consent of Deloitte & Touche LLP (Iron Mountain Incorporated, Delaware). (Filed herewith.)
| | | | | | | | |
43 | IRON MOUNTAIN 2021 FORM 10-K | |
REPORT OF INDEPENDENT REGISTERED PUBLIC ACCOUNTING FIRM
To the shareholders and the Board of Directors of Iron Mountain Incorporated
OPINION ON THE FINANCIAL STATEMENTS
We have audited the accompanying consolidated balance sheets of Iron Mountain Incorporated and subsidiaries (the “Company”) as of December 31, 2021 and 2020, the related consolidated statements of operations, comprehensive income (loss), equity, and cash flows, for each of the three years in the period ended December 31, 2021, and the related notes and the schedule listed in the Index at Item 15 (collectively referred to as the “financial statements”). In our opinion, the financial statements present fairly, in all material respects, the financial position of the Company as of December 31, 2021 and 2020, and the results of its operations and its cash flows for each of the three years in the period ended December 31, 2021, in conformity with accounting principles generally accepted in the United States of America.
We have also audited, in accordance with the standards of the Public Company Accounting Oversight Board (United States) (PCAOB), the Company’s internal control over financial reporting as of December 31, 2021, based on criteria established in Internal Control - Integrated Framework (2013) issued by the Committee of Sponsoring Organizations of the Treadway Commission and our report dated February 24, 2022 (not presented herein), expressed an unqualified opinion on the Company’s internal control over financial reporting.
BASIS FOR OPINION
These financial statements are the responsibility of the Company’s management. Our responsibility is to express an opinion on the Company’s financial statements based on our audits. We are a public accounting firm registered with the PCAOB and are required to be independent with respect to the Company in accordance with the U.S. federal securities laws and the applicable rules and regulations of the Securities and Exchange Commission and the PCAOB.
We conducted our audits in accordance with the standards of the PCAOB. Those standards require that we plan and perform the audit to obtain reasonable assurance about whether the financial statements are free of material misstatement, whether due to error or fraud. Our audits included performing procedures to assess the risks of material misstatement of the financial statements, whether due to error or fraud, and performing procedures that respond to those risks. Such procedures included examining, on a test basis, evidence regarding the amounts and disclosures in the financial statements. Our audits also included evaluating the accounting principles used and significant estimates made by management, as well as evaluating the overall presentation of the financial statements. We believe that our audits provide a reasonable basis for our opinion.
CRITICAL AUDIT MATTER
The critical audit matter communicated below is a matter arising from the current-period audit of the financial statements that was communicated or required to be communicated to the audit committee and that (1) relates to accounts or disclosures that are material to the financial statements and (2) involved our especially challenging, subjective, or complex judgments. The communication of critical audit matters does not alter in any way our opinion on the financial statements, taken as a whole, and we are not, by communicating the critical audit matter below, providing a separate opinion on the critical audit matter or on the accounts or disclosures to which it relates.
| | | | | | | | |
| IRON MOUNTAIN 2021 FORM 10-K | 44 |
GOODWILL - GLOBAL DATA CENTER REPORTING UNIT - REFER TO NOTE 2.K. TO THE FINANCIAL STATEMENTS
CRITICAL AUDIT MATTER DESCRIPTION
The Company’s evaluation of goodwill for impairment involves the comparison of the fair value of each reporting unit to its carrying value. The Company determined the fair value of the Global Data Center reporting unit using a combined approach based on the present value of future cash flows (the “Discounted Cash Flow Model”) and market multiples (the “Market Approach”). The determination of the fair value using the Discounted Cash Flow Model requires management to make significant assumptions related to future revenue growth rates, operating margins, discount rates and capital expenditures. The determination of the fair value using the Market Approach requires management to make significant assumptions related to adjusted earnings before interest, taxes, depreciation and amortization (“Adjusted EBITDA”) multiples. Changes in economic and operating conditions impacting these assumptions or changes in multiples could result in goodwill impairments in future periods. The goodwill balance allocated to the Global Data Center reporting unit was $429 million as of October 1, 2021 (goodwill impairment testing date). The fair value of the Global Data Center reporting unit exceeded its carrying value as of the measurement date and, therefore, no impairment was recognized.
The Global Data Center reporting unit’s fair value exceeded its carrying value by less than 25%, accordingly, auditing the assumptions used in the goodwill impairment analysis for this reporting unit involved especially subjective judgment.
HOW THE CRITICAL AUDIT MATTER WAS ADDRESSED IN THE AUDIT
Our audit procedures related to future revenue growth rates, operating margins and capital expenditures (collectively, the “Forecast”), the selection of discount rates, and Adjusted EBITDA multiples for the Global Data Center reporting unit included the following, among others:
•We evaluated management’s ability to accurately forecast by comparing actual results to management’s historical forecasts.
•We evaluated the reasonableness of management’s Forecast by comparing it to (1) historical results, (2) internal communications to management and the Board of Directors, and (3) forecasted information included in Company press releases and industry reports of the Company and companies in its peer group.
•With the assistance of our fair value specialists, we evaluated the discount rates, including testing the underlying source information and the mathematical accuracy of the calculations, and developing a range of independent estimates and comparing those to the discount rates selected by management.
•With the assistance of our fair value specialists, we evaluated the Adjusted EBITDA multiples, including testing the underlying source information and mathematical accuracy of the calculations and comparing the multiples selected by management to its guideline companies.
•We tested the effectiveness of controls over the evaluation of goodwill for impairment, including those over the Forecast and the selection of the Adjusted EBITDA multiples and discount rates.
/s/ DELOITTE & TOUCHE LLP
Boston, Massachusetts
February 24, 2022 (August 4, 2022, as to the change of segment reporting disclosed in Notes 2 and 11)
We have served as the Company’s auditor since 2002.
| | | | | | | | |
45 | IRON MOUNTAIN 2021 FORM 10-K | |
Part IV
IRON MOUNTAIN INCORPORATED
CONSOLIDATED BALANCE SHEETS
(IN THOUSANDS, EXCEPT SHARE AND PER SHARE DATA)
| | | | | | | | | | | |
| | DECEMBER 31, |
| | 2021 | | 2020 |
| ASSETS | | | |
| Current Assets: | | | |
| Cash and cash equivalents | $ | 255,828 | | | $ | 205,063 | |
| | | |
Accounts receivable (less allowances of $62,009 and $56,981 as of December 31, 2021 and 2020, respectively) | 961,419 | | | 859,344 | |
| | | |
| Prepaid expenses and other | 224,020 | | | 205,380 | |
| Total Current Assets | 1,441,267 | | | 1,269,787 | |
| | | |
| Property, plant and equipment | 8,647,303 | | | 8,246,337 | |
| Less—Accumulated depreciation | (3,979,159) | | | (3,743,894) | |
| Property, Plant and Equipment, net | 4,668,144 | | | 4,502,443 | |
| Other Assets, Net: | | | |
| Goodwill | 4,463,531 | | | 4,557,609 | |
| Customer relationships, customer inducements and data center lease-based intangibles | 1,181,043 | | | 1,326,977 | |
| | | |
| Operating lease right-of-use assets | 2,314,422 | | | 2,196,502 | |
| Other | 381,624 | | | 295,949 | |
| Total Other Assets, Net | 8,340,620 | | | 8,377,037 | |
| Total Assets | $ | 14,450,031 | | | $ | 14,149,267 | |
| LIABILITIES AND EQUITY | | | |
| Current Liabilities: | | | |
| Current portion of long-term debt | $ | 309,428 | | | $ | 193,759 | |
| Accounts payable | 369,145 | | | 359,863 | |
| Accrued expenses and other current liabilities (includes current portion of operating lease liabilities) | 1,032,537 | | | 1,146,288 | |
| Deferred revenue | 307,470 | | | 295,785 | |
| Total Current Liabilities | 2,018,580 | | | 1,995,695 | |
| Long-term Debt, net of current portion | 8,962,513 | | | 8,509,555 | |
| Long-term Operating Lease Liabilities, net of current portion | 2,171,472 | | | 2,044,598 | |
| Other Long-term Liabilities | 144,053 | | | 204,508 | |
| | | |
| Deferred Income Taxes | 223,934 | | | 198,377 | |
| Commitments and Contingencies | | | |
| Redeemable Noncontrolling Interests | 72,411 | | | 59,805 | |
| Equity: | | | |
| Iron Mountain Incorporated Stockholders’ Equity: | | | |
Preferred stock (par value $0.01; authorized 10,000,000 shares; none issued and outstanding) | — | | | — | |
Common stock (par value $0.01; authorized 400,000,000 shares; issued and outstanding 289,757,061 shares and 288,273,049 shares as of December 31, 2021 and 2020, respectively) | 2,898 | | | 2,883 | |
| Additional paid-in capital | 4,412,553 | | | 4,340,078 | |
| (Distributions in excess of earnings) Earnings in excess of distributions | (3,221,152) | | | (2,950,339) | |
| Accumulated other comprehensive items, net | (338,347) | | | (255,893) | |
| Total Iron Mountain Incorporated Stockholders’ Equity | 855,952 | | | 1,136,729 | |
| Noncontrolling Interests | 1,116 | | | — | |
| Total Equity | 857,068 | | | 1,136,729 | |
| Total Liabilities and Equity | $ | 14,450,031 | | | $ | 14,149,267 | |
The accompanying notes are an integral part of these consolidated financial statements.
| | | | | | | | |
| IRON MOUNTAIN 2021 FORM 10-K | 46 |
Part IV
IRON MOUNTAIN INCORPORATED
CONSOLIDATED STATEMENTS OF OPERATIONS
(IN THOUSANDS, EXCEPT PER SHARE DATA)
| | | | | | | | | | | | | | | | | |
| | YEAR ENDED DECEMBER 31, |
| | 2021 | | 2020 | | 2019 |
| Revenues: | | | | | |
| Storage rental | $ | 2,870,119 | | | $ | 2,754,091 | | | $ | 2,681,087 | |
| Service | 1,621,412 | | | 1,393,179 | | | 1,581,497 | |
| Total Revenues | 4,491,531 | | | 4,147,270 | | | 4,262,584 | |
| Operating Expenses: | | | | | |
| Cost of sales (excluding depreciation and amortization) | 1,887,229 | | | 1,757,342 | | | 1,833,315 | |
| Selling, general and administrative | 1,022,559 | | | 949,215 | | | 991,664 | |
| Depreciation and amortization | 680,422 | | | 652,069 | | | 658,201 | |
| Acquisition and Integration Costs | 12,764 | | | — | | | 13,293 | |
| Restructuring Charges | 206,426 | | | 194,396 | | | 48,597 | |
| Intangible impairments | — | | | 23,000 | | | — | |
| (Gain) Loss on disposal/write-down of property, plant and equipment, net | (172,041) | | | (363,537) | | | (63,824) | |
| Total Operating Expenses | 3,637,359 | | | 3,212,485 | | | 3,481,246 | |
| Operating Income (Loss) | 854,172 | | | 934,785 | | | 781,338 | |
Interest Expense, Net (includes Interest Income of $7,341, $8,312 and $6,559 in 2021, 2020 and 2019, respectively) | 417,961 | | | 418,535 | | | 419,298 | |
| Other (Income) Expense, Net | (192,804) | | | 143,545 | | | 33,898 | |
| Income (Loss) from Continuing Operations Before Provision (Benefit) for Income Taxes | 629,015 | | | 372,705 | | | 328,142 | |
| Provision (Benefit) for Income Taxes | 176,290 | | | 29,609 | | | 59,931 | |
| Income (Loss) from Continuing Operations | 452,725 | | | 343,096 | | | 268,211 | |
| Income (Loss) from Discontinued Operations, Net of Tax | — | | | — | | | 104 | |
| | | | | |
| Net Income (Loss) | 452,725 | | | 343,096 | | | 268,315 | |
| Less: Net Income (Loss) Attributable to Noncontrolling Interests | 2,506 | | | 403 | | | 938 | |
| Net Income (Loss) Attributable to Iron Mountain Incorporated | $ | 450,219 | | | $ | 342,693 | | | $ | 267,377 | |
| Earnings (Losses) per Share: | | | | | |
| Net Income (Loss) Attributable to Iron Mountain Incorporated - Basic | $ | 1.56 | | | $ | 1.19 | | | $ | 0.93 | |
| Net Income (Loss) Attributable to Iron Mountain Incorporated - Diluted | $ | 1.55 | | | $ | 1.19 | | | $ | 0.93 | |
| Weighted Average Common Shares Outstanding: | | | | | |
| Basic | 289,457 | | | 288,183 | | | 286,971 | |
| Diluted | 290,975 | | | 288,643 | | | 287,687 | |
| | | | | |
The accompanying notes are an integral part of these consolidated financial statements.
| | | | | | | | |
47 | IRON MOUNTAIN 2021 FORM 10-K | |
Part IV
IRON MOUNTAIN INCORPORATED
CONSOLIDATED STATEMENTS OF COMPREHENSIVE INCOME (LOSS)
(IN THOUSANDS)
| | | | | | | | | | | | | | | | | |
| | YEAR ENDED DECEMBER 31, |
| | 2021 | | 2020 | | 2019 |
| Net Income (Loss) | $ | 452,725 | | | $ | 343,096 | | | $ | 268,315 | |
| Other Comprehensive (Loss) Income: | | | | | |
| Foreign Currency Translation Adjustment | (136,410) | | | 45,779 | | | 11,994 | |
| | | | | |
| Change in Fair Value of Derivative Instruments | 52,380 | | | (39,947) | | | (8,783) | |
| Total Other Comprehensive (Loss) Income | (84,030) | | | 5,832 | | | 3,211 | |
| Comprehensive Income (Loss) | 368,695 | | | 348,928 | | | 271,526 | |
| Comprehensive Income (Loss) Attributable to Noncontrolling Interests | 930 | | | (453) | | | 1,066 | |
| Comprehensive Income (Loss) Attributable to Iron Mountain Incorporated | $ | 367,765 | | | $ | 349,381 | | | $ | 270,460 | |
The accompanying notes are an integral part of these consolidated financial statements.
| | | | | | | | |
| IRON MOUNTAIN 2021 FORM 10-K | 48 |
Part IV
IRON MOUNTAIN INCORPORATED
CONSOLIDATED STATEMENTS OF EQUITY
(IN THOUSANDS, EXCEPT SHARE DATA) | | | | | | | | | | | | | | | | | | | | | | | | | | | | | | | | | | | | | | | | | | | | | | | | | | |
| | | | IRON MOUNTAIN INCORPORATED STOCKHOLDERS’ EQUITY | | | | | |
| | | | COMMON STOCK | | ADDITIONAL PAID-IN CAPITAL | | EARNINGS IN EXCESS OF DISTRIBUTIONS (DISTRIBUTIONS IN EXCESS OF EARNINGS) | | ACCUMULATED OTHER COMPREHENSIVE ITEMS, NET | | NONCONTROLLING INTERESTS | | | REDEEMABLE NONCONTROLLING INTERESTS |
| | TOTAL | | SHARES | | AMOUNTS | | | | | | |
| Balance, December 31, 2018 | $ | 1,862,463 | | | 286,321,009 | | | $ | 2,863 | | | $ | 4,263,348 | | | $ | (2,139,493) | | | $ | (265,664) | | | $ | 1,409 | | | | $ | 70,532 | |
| Cumulative-effect adjustment for adoption of ASC 842 | 5,781 | | | — | | | — | | | — | | | 5,781 | | | — | | | — | | | | — | |
| Issuance of shares under employee stock purchase plan and option plans and stock-based compensation | 36,682 | | | 978,636 | | | 10 | | | 36,672 | | | — | | | — | | | — | | | | — | |
| | | | | | | | | | | | | | | | |
| | | | | | | | | | | | | | | | |
| Changes in equity related redeemable noncontrolling interests | (1,454) | | | — | | | — | | | (1,454) | | | — | | | — | | | — | | | | (3,136) | |
| Parent cash dividends declared | (708,561) | | | — | | | — | | | — | | | (708,561) | | | — | | | — | | | | — | |
| Foreign currency translation adjustment | 11,866 | | | — | | | — | | | — | | | — | | | 11,866 | | | — | | | | 128 | |
| Change in fair value of derivative instruments | (8,783) | | | — | | | — | | | — | | | — | | | (8,783) | | | — | | | | — | |
| Net income (loss) | 266,233 | | | — | | | — | | | — | | | 267,377 | | | — | | | (1,144) | | | | 2,082 | |
| Noncontrolling interests dividends | — | | | — | | | — | | | — | | | — | | | — | | | — | | | | (1,924) | |
| Balance, December 31, 2019 | 1,464,227 | | | 287,299,645 | | | 2,873 | | | 4,298,566 | | | (2,574,896) | | | (262,581) | | | 265 | | | | 67,682 | |
| | | | | | | | | | | | | | | | |
| Issuance of shares under employee stock purchase plan and option plans and stock-based compensation | 37,995 | | | 973,404 | | | 10 | | | 37,985 | | | — | | | — | | | — | | | | — | |
| Changes in equity related redeemable noncontrolling interests | 3,527 | | | — | | | — | | | 3,527 | | | — | | | — | | | — | | | | (4,924) | |
| Parent cash dividends declared | (718,136) | | | — | | | — | | | — | | | (718,136) | | | — | | | — | | | | — | |
| Foreign currency translation adjustment | 46,748 | | | — | | | — | | | — | | | — | | | 46,635 | | | 113 | | | | (969) | |
| Change in fair value of derivative instruments | (39,947) | | | — | | | — | | | — | | | — | | | (39,947) | | | — | | | | — | |
| Net income (loss) | 342,315 | | | — | | | — | | | — | | | 342,693 | | | — | | | (378) | | | | 781 | |
| Noncontrolling interests dividends | — | | | — | | | — | | | — | | | — | | | — | | | — | | | | (2,765) | |
| Balance, December 31, 2020 | 1,136,729 | | | 288,273,049 | | | 2,883 | | | 4,340,078 | | | (2,950,339) | | | (255,893) | | | — | | | | 59,805 | |
| | | | | | | | | | | | | | | | |
| Issuance of shares under employee stock purchase plan and option plans and stock-based compensation | 84,004 | | | 1,484,012 | | | 15 | | | 83,989 | | | — | | | — | | | — | | | | — | |
| Changes in equity related redeemable noncontrolling interests | (11,514) | | | — | | | — | | | (11,514) | | | — | | | — | | | — | | | | 11,682 | |
| Parent cash dividends declared | (721,032) | | | — | | | — | | | — | | | (721,032) | | | — | | | — | | | | — | |
| Foreign currency translation adjustment | (135,165) | | | — | | | — | | | — | | | — | | | (134,834) | | | (331) | | | | (1,245) | |
| Change in fair value of derivative instruments | 52,380 | | | — | | | — | | | — | | | — | | | 52,380 | | | — | | | | — | |
| Net income (loss) | 450,355 | | | — | | | — | | | — | | | 450,219 | | | — | | | 136 | | | | 2,370 | |
| Noncontrolling interests equity contributions | — | | | — | | | — | | | — | | | — | | | — | | | — | | | | 2,200 | |
| Noncontrolling interests dividends | — | | | — | | | — | | | — | | | — | | | — | | | — | | | | (2,450) | |
| Purchase of noncontrolling interests | 1,311 | | | — | | | — | | | — | | | — | | | — | | | 1,311 | | | | 2,567 | |
| Redemption of noncontrolling interests | — | | | — | | | — | | | — | | | — | | | — | | | — | | | | (2,518) | |
| Balance, December 31, 2021 | $ | 857,068 | | | 289,757,061 | | | $ | 2,898 | | | $ | 4,412,553 | | | $ | (3,221,152) | | | $ | (338,347) | | | $ | 1,116 | | | | $ | 72,411 | |
The accompanying notes are an integral part of these consolidated financial statements.
| | | | | | | | |
49 | IRON MOUNTAIN 2021 FORM 10-K | |
Part IV
IRON MOUNTAIN INCORPORATED
CONSOLIDATED STATEMENTS OF CASH FLOWS
(IN THOUSANDS)
| | | | | | | | | | | | | | | | | |
| | YEAR ENDED DECEMBER 31, |
| | 2021 | | 2020 | | 2019 |
| Cash Flows from Operating Activities: | | | | | |
| Net income (loss) | $ | 452,725 | | | $ | 343,096 | | | $ | 268,315 | |
| (Income) loss from discontinued operations | — | | | — | | | (104) | |
| Adjustments to reconcile net income (loss) to cash flows from operating activities: | | | | | |
| Depreciation | 465,072 | | | 447,562 | | | 456,323 | |
Amortization (includes amortization of deferred financing costs and discounts of $16,548, $17,376 and $16,740 in 2021, 2020 and 2019, respectively) | 231,898 | | | 221,883 | | | 218,618 | |
| Intangible impairments | — | | | 23,000 | | | — | |
| Revenue reduction associated with amortization of permanent withdrawal fees and data center above- and below-market leases | 8,852 | | | 9,878 | | | 13,703 | |
| Stock-based compensation expense | 61,001 | | | 37,674 | | | 35,654 | |
| Provision (benefit) for deferred income taxes | 28,703 | | | (12,986) | | | (624) | |
| Loss on early extinguishment of debt | — | | | 68,300 | | | — | |
| Gain on IPM Divestment (as defined in Note 4) | (178,983) | | | — | | | — | |
| (Gain) loss on disposal/write-down of property, plant and equipment, net | (172,041) | | | (363,537) | | | (63,824) | |
| | | | | |
| | | | | |
| Foreign currency transactions and other, net | (6,656) | | | 78,437 | | | 29,838 | |
| (Increase) decrease in assets | (174,206) | | | (15,443) | | | 5,404 | |
| Increase (decrease) in liabilities | 42,537 | | | 149,793 | | | 3,352 | |
| Cash Flows from Operating Activities-Continuing Operations | 758,902 | | | 987,657 | | | 966,655 | |
| Cash Flows from Operating Activities-Discontinued Operations | — | | | — | | | — | |
| Cash Flows from Operating Activities | 758,902 | | | 987,657 | | | 966,655 | |
| Cash Flows from Investing Activities: | | | | | |
| Capital expenditures | (611,082) | | | (438,263) | | | (692,983) | |
| Cash paid for acquisitions, net of cash acquired | (203,998) | | | (118,581) | | | (58,237) | |
| Acquisition of customer relationships | (5,892) | | | (4,346) | | | (46,105) | |
| Customer inducements | (7,402) | | | (10,644) | | | (9,371) | |
| Contract fulfillment costs and third party commissions | (58,524) | | | (60,020) | | | (76,171) | |
| Net proceeds from IPM Divestment | 213,878 | | | — | | | — | |
| Investments in Joint Ventures and other investments | (78,623) | | | (18,250) | | | (19,222) | |
| Proceeds from sales of property and equipment and other, net (including real estate) | 278,330 | | | 564,664 | | | 166,143 | |
| Cash Flows from Investing Activities-Continuing Operations | (473,313) | | | (85,440) | | | (735,946) | |
| Cash Flows from Investing Activities-Discontinued Operations | — | | | — | | | 5,061 | |
| Cash Flows from Investing Activities | (473,313) | | | (85,440) | | | (730,885) | |
| Cash Flows from Financing Activities: | | | | | |
| Repayment of revolving credit facilities, term loan facilities and other debt | (5,164,483) | | | (8,604,394) | | | (14,535,115) | |
| Proceeds from revolving credit facilities, term loan facilities and other debt | 4,972,214 | | | 7,939,458 | | | 14,059,818 | |
| Early redemption of senior subordinated and senior notes, including call premiums | — | | | (2,942,554) | | | — | |
| Net proceeds from sales of senior notes | 737,812 | | | 3,465,000 | | | 987,500 | |
| | | | | |
| Debt repayment and equity distribution to noncontrolling interests | (2,450) | | | (2,765) | | | (1,924) | |
| Purchase of noncontrolling interest | (75,000) | | | — | | | — | |
| Parent cash dividends | (718,340) | | | (716,290) | | | (704,526) | |
| | | | | |
| | | | | |
| Net proceeds (payments) associated with employee stock-based awards | 25,860 | | | 321 | | | 1,027 | |
| Debt financing costs and other, net | 3,581 | | | (25,475) | | | (5,753) | |
| Cash Flows from Financing Activities-Continuing Operations | (220,806) | | | (886,699) | | | (198,973) | |
| Cash Flows from Financing Activities-Discontinued Operations | — | | | — | | | — | |
| Cash Flows from Financing Activities | (220,806) | | | (886,699) | | | (198,973) | |
| Effect of Exchange Rates on Cash and Cash Equivalents | (14,018) | | | (4,010) | | | (8,727) | |
| Increase (decrease) in Cash and Cash Equivalents | 50,765 | | | 11,508 | | | 28,070 | |
| Cash and Cash Equivalents, including Restricted Cash, Beginning of Year | 205,063 | | | 193,555 | | | 165,485 | |
| Cash and Cash Equivalents, including Restricted Cash, End of Year | $ | 255,828 | | | $ | 205,063 | | | $ | 193,555 | |
| Supplemental Information: | | | | | |
| Cash Paid for Interest | $ | 428,111 | | | $ | 390,332 | | | $ | 394,984 | |
| Cash Paid for Income Taxes, Net | $ | 130,292 | | | $ | 43,468 | | | $ | 61,691 | |
| Non-Cash Investing and Financing Activities: | | | | | |
| Financing Leases | $ | 50,552 | | | $ | 55,782 | | | $ | 32,742 | |
| Accrued Capital Expenditures | $ | 88,210 | | | $ | 91,528 | | | $ | 82,345 | |
| Accrued Purchase Price and Other Holdbacks | $ | — | | | $ | — | | | $ | 4,135 | |
| Dividends Payable | $ | 190,559 | | | $ | 187,867 | | | $ | 186,021 | |
| | | | | |
The accompanying notes are an integral part of these consolidated financial statements.
| | | | | | | | |
| IRON MOUNTAIN 2021 FORM 10-K | 50 |
Part IV
IRON MOUNTAIN INCORPORATED
NOTES TO CONSOLIDATED FINANCIAL STATEMENTS
DECEMBER 31, 2021
(In thousands, except share and per share data)
1. NATURE OF BUSINESS
The accompanying financial statements represent the consolidated accounts of Iron Mountain Incorporated, a Delaware corporation (“IMI”), and its subsidiaries (“we” or “us”). We help organizations around the world protect their information, reduce storage costs, comply with regulations, facilitate corporate disaster recovery, and better use their information and information technology (“IT”) infrastructure for business advantages, regardless of its format, location or life cycle stage. We do this by storing physical records and data backup media, offering information management solutions, and providing data center space for enterprise-class colocation and opportunistic hyperscale deployments. We offer comprehensive records and information management services and data management services, along with the expertise and experience to address complex storage and information management challenges such as rising storage rental costs, legal and regulatory compliance, and disaster recovery requirements. We provide secure and reliable data center facilities to protect digital information and ensure the continued operation of our customers’ IT infrastructure, with reliable and flexible deployment options.
In March 2020, the World Health Organization declared a novel strain of coronavirus (“COVID-19”) a pandemic. The broader impacts of the COVID-19 pandemic on our financial position, results of operations and cash flows, including impacts to the estimates we use in the preparation of our financial statements, remain uncertain and difficult to predict as information continues to evolve, and the severity and duration of the pandemic, including new variants of COVID-19 that may emerge, remains unknown, as is our visibility of its effect on the markets we serve and our customers within those markets.
In October 2019, we announced a global program designed to better position us for future growth and achievement of our strategic objectives (“Project Summit”). As of December 31, 2021, we have completed Project Summit. See Note 13.
We have been organized and have operated as a real estate investment trust for United States federal income tax purposes (“REIT”) beginning with our taxable year ended December 31, 2014.
2. SUMMARY OF SIGNIFICANT ACCOUNTING POLICIES
A. PRINCIPLES OF CONSOLIDATION
The accompanying financial statements reflect our financial position, results of operations, comprehensive income (loss), equity and cash flows on a consolidated basis. All intercompany transactions and account balances have been eliminated.
B. USE OF ESTIMATES
The preparation of financial statements in conformity with accounting principles generally accepted in the United States of America (“GAAP”) requires us to make estimates, judgments and assumptions that affect the reported amounts of assets, liabilities, revenues and expenses, and related disclosure of contingent assets and liabilities at the date of the financial statements and for the period then ended. On an ongoing basis, we evaluate the estimates used. We base our estimates on historical experience, actuarial estimates, current conditions and various other assumptions that we believe to be reasonable under the circumstances. These estimates form the basis for making judgments about the carrying values of assets and liabilities and are not readily apparent from other sources. Actual results may differ from these estimates.
C. FOREIGN CURRENCY
Local currencies are the functional currencies for our operations outside the United States, with the exception of certain foreign holding companies, whose functional currency is the United States dollar. In those instances where the local currency is the functional currency, assets and liabilities are translated at period-end exchange rates, and revenues and expenses are translated at average exchange rates for the applicable period. See Note 2.q.
| | | | | | | | |
51 | IRON MOUNTAIN 2021 FORM 10-K | |
Part IV
IRON MOUNTAIN INCORPORATED
NOTES TO CONSOLIDATED FINANCIAL STATEMENTS (CONTINUED)
DECEMBER 31, 2021
(In thousands, except share and per share data)
2. SUMMARY OF SIGNIFICANT ACCOUNTING POLICIES (CONTINUED)
D. CASH, CASH EQUIVALENTS AND RESTRICTED CASH
Cash and cash equivalents include cash on hand and cash invested in highly liquid short-term securities, which have remaining maturities at the date of purchase of less than 90 days. Cash and cash equivalents are carried at cost, which approximates fair value.
E. ALLOWANCE FOR DOUBTFUL ACCOUNTS AND CREDIT MEMO RESERVES
We maintain an allowance for doubtful accounts and a credit memo reserve for estimated losses resulting from the potential inability of our customers to make required payments and potential disputes regarding billing and service issues.
In June 2016, the Financial Accounting Standards Board (“FASB”) issued Accounting Standards Update ("ASU") No. 2016-13, Financial Instruments-Credit Losses-Measurement of Credit Losses on Financial Instruments (“ASU 2016-13”). ASU 2016-13 changes how entities will measure credit losses on most financial assets. The standard eliminates the probable initial recognition of estimated losses and provides a forward-looking expected credit loss model for accounts receivable, loans and other financial instruments.
On January 1, 2020 we adopted ASU 2016-13 on a modified retrospective basis for all financial assets measured at amortized cost. The adoption of ASU 2016-13 did not result in a material impact on our consolidated financial statements. Under ASU 2016-13, we calculate and monitor our allowance considering future potential economic and macroeconomic conditions and reasonable and supportable forecasts for expected future collectability of our outstanding receivables, in addition to considering our past loss experience, current and prior trends in our aged receivables and credit memo activity. Our considerations when calculating our allowance include, but are not limited to, the following: the location of our businesses, the composition of our customer base, our product and service lines, potential future economic unrest, and potential future macroeconomic factors, including natural disasters and any impacts associated with the COVID-19 pandemic. Continued adjustments will be made should there be any material change to reasonable and supportable forecasts that may impact our likelihood of collection, as it becomes evident. Our highly diverse global customer base, with no single customer accounting for more than approximately 1% of revenue during the years ended December 31, 2021, 2020 and 2019, limits our exposure to concentration of credit risk. Additionally, we write off uncollectible balances as circumstances warrant, generally, no later than one year past due.
Prior to our adoption of ASU 2016-13, we maintained an allowance for doubtful accounts for estimated losses resulting from the potential inability of our customers to make required payments and potential disputes regarding billing and service issues. When calculating the allowance, we considered our past loss experience, current and prior trends in our aged receivables and credit memo activity, current economic conditions, and specific circumstances of individual receivable balances. If the financial condition of our customers were to significantly change, resulting in a significant improvement or impairment of their ability to make payments, an adjustment of the allowance might have been required.
A rollforward of allowance for doubtful accounts and credit memo reserves is as follows:
| | | | | | | | | | | | | | | | | | | | | | | | | | | | | | | | |
YEAR ENDED DECEMBER 31, | | BALANCE AT BEGINNING OF THE YEAR | | CREDIT MEMOS CHARGED TO REVENUE | | ALLOWANCE FOR BAD DEBTS CHARGED TO EXPENSE | | DEDUCTIONS AND OTHER(1) | | BALANCE AT
END OF
THE YEAR |
| 2021 | | $ | 56,981 | | | $ | 47,931 | | | $ | 26,896 | | | $ | (69,799) | | | $ | 62,009 | |
| 2020 | | 42,856 | | | 55,118 | | | 34,411 | | | (75,404) | | | 56,981 | |
| 2019 | | 43,584 | | | 51,846 | | | 19,389 | | | (71,963) | | | 42,856 | |
(1)Primarily consists of the issuance of credit memos, the write-off of accounts receivable, allowances associated with businesses acquired and the impact associated with currency translation adjustments.
| | | | | | | | |
| IRON MOUNTAIN 2021 FORM 10-K | 52 |
Part IV
IRON MOUNTAIN INCORPORATED
NOTES TO CONSOLIDATED FINANCIAL STATEMENTS (CONTINUED)
DECEMBER 31, 2021
(In thousands, except share and per share data)
2. SUMMARY OF SIGNIFICANT ACCOUNTING POLICIES (CONTINUED)
F. CONCENTRATIONS OF CREDIT RISK
Financial instruments that potentially subject us to credit risk consist principally of cash and cash equivalents (including money market funds and time deposits) and accounts receivable. The only significant concentrations of liquid investments as of December 31, 2021 and 2020 related to cash and cash equivalents. At December 31, 2021 and 2020, we had money market funds with four “Triple A” rated money market funds and time deposits with one global bank. As per our risk management investment policy, we limit exposure to concentration of credit risk by limiting the amount invested in any one mutual fund to a maximum of 1% of the fund's total assets or in any one financial institution to a maximum of $75,000. See Note 2.o.
G. PREPAID EXPENSES AND ACCRUED EXPENSES
There are no prepaid expenses with items greater than 5% of total current assets as of December 31, 2021 and 2020.
Accrued expenses and other current liabilities, with items greater than 5% of total current liabilities are shown separately, and consist of the following:
| | | | | | | | | | | | | | |
| | | DECEMBER 31, |
| DESCRIPTION | | 2021 | | 2020 |
| | | | |
| Interest | | $ | 124,764 | | | $ | 131,448 | |
| | | | |
| | | | |
| Dividends | | 190,559 | | | 187,867 | |
| Operating lease liabilities | | 259,597 | | | 250,239 | |
| Other | | 457,617 | | | 576,734 | |
| Accrued expenses and other current liabilities | | $ | 1,032,537 | | | $ | 1,146,288 | |
| | | | |
H. PROPERTY, PLANT AND EQUIPMENT
Property, plant and equipment are stated at cost and depreciated using the straight-line method with the following useful lives (in years):
| | | | | |
| DESCRIPTION | RANGE |
| Buildings and building improvements | 5 to 40 |
| Leasehold improvements | 5 to 10 or life of the lease (whichever is shorter) |
| Racking | 1 to 20 or life of the lease (whichever is shorter) |
| Warehouse equipment/vehicles | 1 to 10 |
| Furniture and fixtures | 1 to 10 |
| Computer hardware and software | 2 to 5 |
| | | | | | | | |
53 | IRON MOUNTAIN 2021 FORM 10-K | |
Part IV
IRON MOUNTAIN INCORPORATED
NOTES TO CONSOLIDATED FINANCIAL STATEMENTS (CONTINUED)
DECEMBER 31, 2021
(In thousands, except share and per share data)
2. SUMMARY OF SIGNIFICANT ACCOUNTING POLICIES (CONTINUED)
Property, plant and equipment (including financing leases in the respective category), at cost, consist of the following:
| | | | | | | | | | | | | | |
| | | DECEMBER 31, |
| DESCRIPTION | | 2021 | | 2020 |
| Land | | $ | 372,411 | | | $ | 354,395 | |
| Buildings and building improvements | | 3,391,143 | | | 3,040,253 | |
| Leasehold improvements | | 1,054,757 | | | 969,273 | |
| Racking | | 2,075,473 | | | 2,083,199 | |
| Warehouse equipment/vehicles | | 494,464 | | | 499,787 | |
| Furniture and fixtures | | 50,692 | | | 52,978 | |
| Computer hardware and software | | 823,649 | | | 746,993 | |
| Construction in progress | | 384,714 | | | 499,459 | |
| Property, plant and equipment | | $ | 8,647,303 | | | $ | 8,246,337 | |
| | | | |
Minor maintenance costs are expensed as incurred. Major improvements which extend the life, increase the capacity or improve the safety or the efficiency of property owned are capitalized and depreciated. Major improvements to leased buildings are capitalized as leasehold improvements and depreciated.
We capitalize interest expense during the active construction period of major capital projects. Capitalized interest is added to the cost of the underlying assets and is amortized over the useful lives of the assets. During the years ended December 31, 2021, 2020 and 2019, capitalized interest is as follows:
| | | | | | | | | | | | | | | | | | | | |
| | YEAR ENDED DECEMBER 31, |
| | 2021 | | 2020 | | 2019 |
| Capitalized interest | | $ | 12,673 | | | $ | 14,321 | | | $ | 15,980 | |
We develop various software applications for internal use. Computer software costs associated with internal use software are expensed as incurred until certain capitalization criteria are met. Third party consulting costs, as well as payroll and related costs for employees directly associated with, and devoting time to, the development of internal use computer software projects (to the extent time is spent directly on the project) are capitalized. Capitalization begins when the design stage of the application has been completed and it is probable that the project will be completed and used to perform the function intended. Capitalization ends when the asset is ready for its intended use. Depreciation begins when the software is placed in service. Computer software costs that are capitalized are periodically evaluated for impairment.
During the years ended December 31, 2021, 2020 and 2019, capitalized costs associated with the development of internal use computer software projects are as follows:
| | | | | | | | | | | | | | | | | |
| YEAR ENDED DECEMBER 31, |
| 2021 | | 2020 | | 2019 |
| Capitalized costs associated with the development of internal use computer software projects | $ | 48,557 | | | $ | 38,329 | | | $ | 34,650 | |
Entities are required to record the fair value of a liability for an asset retirement obligation in the period in which it is incurred. Asset retirement obligations represent the costs to replace or remove tangible long-lived assets required by law, regulatory rule or contractual agreement. Our asset retirement obligations are primarily the result of requirements under our facility lease agreements which generally have “return to original condition” clauses which would require us to remove or restore items such as shred pits, vaults, demising walls and office build-outs, among others. The significant assumptions used in estimating our aggregate asset retirement obligations are the timing of removals, the probability of a requirement to perform, estimated cost and associated expected inflation rates that are consistent with historical rates and credit-adjusted risk-free rates that approximate our incremental borrowing rate. Our asset retirement obligations at December 31, 2021 and 2020 were $36,493 and $34,537, respectively.
| | | | | | | | |
| IRON MOUNTAIN 2021 FORM 10-K | 54 |
Part IV
IRON MOUNTAIN INCORPORATED
NOTES TO CONSOLIDATED FINANCIAL STATEMENTS (CONTINUED)
DECEMBER 31, 2021
(In thousands, except share and per share data)
2. SUMMARY OF SIGNIFICANT ACCOUNTING POLICIES (CONTINUED)
I. LEASES
We lease facilities for certain warehouses, data centers and office space. We also have land leases, including those on which certain facilities are located. The majority of our leased facilities are classified as operating leases that, on average, have initial lease terms of five to 10 years, with one or more lease renewal options to extend the lease term. Our lease renewal option terms generally range from one to five years. The exercise of the lease renewal option is at our sole discretion and may contain fixed rent, fair market value based rent or Consumer Price Index rent escalation clauses. We include option periods in the lease term when our failure to renew the lease would result in an economic disincentive, thereby making it reasonably certain that we will renew the lease. We recognize straight line rental expense over the life of the lease and any fair market value or Consumer Price Index rent escalations are recognized as variable lease expense in the period in which the obligation is incurred. In addition, we lease certain vehicles and equipment. Vehicle and equipment leases typically have lease terms ranging from one to seven years.
We account for all leases, both operating and financing, in accordance with Accounting Standards Codification ("ASC") Topic 842 Leases, ("ASC 842"). Our accounting policy provides that leases with an initial term of 12 months or less will not be included within the lease right-of-use assets and lease liabilities recognized on our Consolidated Balance Sheets. We will continue to recognize the lease payments for those leases with an initial term of 12 months or less in our Consolidated Statements of Operations on a straight-line basis over the lease term.
The lease right-of-use assets and related lease liabilities are classified as either operating or financing. Lease right-of-use assets are calculated as the net present value of future payments plus any capitalized initial direct costs less any tenant improvements or lease incentives. Lease liabilities are calculated as the net present value of future payments. In calculating the present value of the lease payments, we utilize the rate stated in the lease (in the limited circumstances when such rate is explicitly stated) or, if no rate is explicitly stated, we utilize a rate that reflects our securitized incremental borrowing rate by geography for the lease term. We account for nonlease components (which include common area maintenance, taxes, and insurance) with the related lease component. Any variable nonlease components are not included within the lease right-of-use asset and lease liability on our Consolidated Balance Sheets, and instead, are reflected as an expense in the period incurred.
At January 1, 2019, we recognized the cumulative effect of initially applying ASC 842 as an adjustment to the opening balance of (Distributions in excess of earnings) Earnings in excess of distributions, resulting in an increase of approximately $5,800 to stockholders’ equity due to certain build to suit leases that were accounted for as financing leases under ASC 840, Leases, but are accounted for as operating leases under ASC 842.
Operating and financing lease right-of-use assets and lease liabilities as of December 31, 2021 and 2020 are as follows:
| | | | | | | | | | | | | | |
| | | DECEMBER 31, |
| DESCRIPTION | | 2021 | | 2020 |
| Assets: | | | | |
Operating lease right-of-use assets(1) | | $ | 2,314,422 | | | $ | 2,196,502 | |
Financing lease right-of-use assets, net of accumulated depreciation(2)(3) | | 298,049 | | | 310,534 | |
| Liabilities: | | | | |
| Current | | | | |
| Operating lease liabilities | | $ | 259,597 | | | $ | 250,239 | |
Financing lease liabilities(3) | | 41,168 | | | 43,149 | |
| Long-term | | | | |
| Operating lease liabilities | | $ | 2,171,472 | | | $ | 2,044,598 | |
Financing lease liabilities(3) | | 315,561 | | | 323,162 | |
(1)At December 31, 2021 and 2020, these assets are comprised of approximately 99% real estate related assets (which include land, buildings and racking) and 1% non-real estate related assets (which include warehouse equipment, vehicles, furniture and fixtures and computer hardware and software).
(2)At December 31, 2021, these assets are comprised of approximately 69% real estate related assets and 31% non-real estate related assets. At December 31, 2020, these assets are comprised of approximately 72% real estate related assets and 28% non-real estate related assets.
(3)Financing lease right-of-use assets, current financing lease liabilities and long-term financing lease liabilities are included within Property, Plant and Equipment, Net, Current portion of long-term debt and Long-term Debt, net of current portion, respectively, within our Consolidated Balance Sheets.
| | | | | | | | |
55 | IRON MOUNTAIN 2021 FORM 10-K | |
Part IV
IRON MOUNTAIN INCORPORATED
NOTES TO CONSOLIDATED FINANCIAL STATEMENTS (CONTINUED)
DECEMBER 31, 2021
(In thousands, except share and per share data)
2. SUMMARY OF SIGNIFICANT ACCOUNTING POLICIES (CONTINUED)
The components of the lease expense for the years ended December 31, 2021, 2020 and 2019 are as follows:
| | | | | | | | | | | | | | | | | | | | |
| | YEAR ENDED DECEMBER 31, |
| DESCRIPTION | | 2021 | | 2020 | | 2019 |
Operating lease cost(1) | | $ | 545,097 | | | $ | 499,464 | | | $ | 459,619 | |
| Financing lease cost: | | | | | | |
| Depreciation of financing lease right-of-use assets | | $ | 50,970 | | | $ | 51,629 | | | $ | 59,258 | |
| Interest expense for financing lease liabilities | | 19,808 | | | 19,942 | | | 21,031 | |
(1)Operating lease cost, the majority of which is included in Cost of sales, includes variable lease costs of $111,949, $111,501 and $105,922 for the years ended December 31, 2021, 2020 and 2019, respectively.
Weighted average remaining lease terms and discount rates as of December 31, 2021 and 2020 are as follows:
| | | | | | | | | | | | | | | | | | | | | | | |
| DECEMBER 31, 2021 | | DECEMBER 31, 2020 |
| OPERATING LEASES | | FINANCING LEASES | | OPERATING LEASES | | FINANCING LEASES |
| Remaining Lease Term | 10.9 years | | 10.9 years | | 11.1 years | | 11.5 years |
| Discount Rate | 6.6 | % | | 5.9 | % | | 6.9 | % | | 5.9 | % |
The estimated minimum future lease payments as of December 31, 2021, are as follows:
| | | | | | | | | | | | | | | | | | | | |
| YEAR | | OPERATING LEASES(1) | | SUBLEASE INCOME | | FINANCING LEASES(1) |
| 2022 | | $ | 399,242 | | | $ | 5,838 | | | $ | 55,115 | |
| 2023 | | 380,690 | | | 5,208 | | | 50,122 | |
| 2024 | | 353,617 | | | 3,631 | | | 41,150 | |
| 2025 | | 328,320 | | | 1,504 | | | 38,600 | |
| 2026 | | 296,895 | | | 1,075 | | | 34,731 | |
| Thereafter | | 1,706,142 | | | 2,271 | | | 235,872 | |
| Total minimum lease payments | | 3,464,906 | | | $ | 19,527 | | | 455,590 | |
| Less amounts representing interest or imputed interest | | (1,033,837) | | | | | (98,861) | |
| Present value of lease obligations | | $ | 2,431,069 | | | | | $ | 356,729 | |
(1)Estimated minimum future lease payments exclude variable common area maintenance charges, insurance and taxes.
At December 31, 2021, we had 14 leases which we have signed but which have not yet commenced and are not included in our lease obligation table above. The total undiscounted minimum lease payments for these leases are approximately $456,700 and have lease terms that range from 10 to 25 years. Each of these leases is expected to commence during 2022. The largest of these leases is for a facility in the United Kingdom that is currently under construction. The exact terms of the lease will be determined upon the completion of building construction, which is expected to occur during late 2022. We expect the rent due in the first year of the lease to be approximately $5,000, and we expect the term of the lease to be approximately 25 years.
| | | | | | | | |
| IRON MOUNTAIN 2021 FORM 10-K | 56 |
Part IV
IRON MOUNTAIN INCORPORATED
NOTES TO CONSOLIDATED FINANCIAL STATEMENTS (CONTINUED)
DECEMBER 31, 2021
(In thousands, except share and per share data)
2. SUMMARY OF SIGNIFICANT ACCOUNTING POLICIES (CONTINUED)
Other information: Supplemental cash flow information relating to our leases for the years ended December 31, 2021, 2020 and 2019 is as follows:
| | | | | | | | | | | | | | | | | | | | |
| | YEAR ENDED DECEMBER 31, |
| CASH PAID FOR AMOUNTS INCLUDED IN MEASUREMENT OF LEASE LIABILITIES: | | 2021 | | 2020 | | 2019 |
| Operating cash flows used in operating leases | | $ | 392,987 | | | $ | 360,088 | | | $ | 338,059 | |
| Operating cash flows used in financing leases (interest) | | 19,808 | | | 19,942 | | | 21,031 | |
| Financing cash flows used in financing leases | | 46,118 | | | 47,829 | | | 58,033 | |
| NON-CASH ITEMS: | | | | | | |
| Operating lease modifications and reassessments | | $ | 144,310 | | | $ | 143,382 | | | $ | 108,023 | |
| New operating leases (including acquisitions and sale-leaseback transactions) | | 282,490 | | | 370,011 | | | 170,464 | |
| | | | | | |
J. LONG-LIVED ASSETS
We review long-lived assets, including all finite-lived intangible assets, for impairment whenever events or changes in circumstances indicate the carrying amount of such assets may not be recoverable. Recoverability of these assets is determined by comparing the sum of the forecasted undiscounted net cash flows of the operation to which the assets relate to their carrying amount. The operations are generally distinguished by the business segment and geographic region in which they operate. If it is determined that we are unable to recover the carrying amount of the assets, the long-lived assets are written down, on a pro rata basis, to fair value. Fair value is determined based on discounted cash flows or appraised values, depending upon the nature of the assets. Long-lived assets, including finite-lived intangible assets, are amortized over their useful lives. Annually, or more frequently if events or circumstances warrant, we assess whether a change in the lives over which long-lived assets, including finite-lived intangible assets, are amortized is necessary.
| | | | | | | | |
57 | IRON MOUNTAIN 2021 FORM 10-K | |
Part IV
IRON MOUNTAIN INCORPORATED
NOTES TO CONSOLIDATED FINANCIAL STATEMENTS (CONTINUED)
DECEMBER 31, 2021
(In thousands, except share and per share data)
2. SUMMARY OF SIGNIFICANT ACCOUNTING POLICIES (CONTINUED)
Consolidated gain on disposal/write-down of property, plant and equipment, net for the years ended December 31, 2021, 2020 and 2019 is as follows:
| | | | | | | | | | | |
| YEAR ENDED DECEMBER 31, |
| 2021(1) | 2020(1) | 2019 |
| Consolidated gain on disposal/write-down of property, plant and equipment, net | $ | 172,041 | | $ | 363,537 | | $ | 63,824 | |
| The gains primarily consisted of: | •Gains associated with sale and sale-leaseback transactions of approximately $164,000, of which (i) approximately $127,400 relates to the sale-leaseback transactions of five facilities in the United Kingdom during the second quarter of 2021 and (ii) approximately $36,600 relates to the sale and sale-leaseback transactions of nine facilities in the United States during the fourth quarter of 2021.
| •Gains associated with sale-leaseback transactions of approximately $342,100, of which (i) approximately $265,600 relates to the sale-leaseback transactions of 14 facilities in the United States during the fourth quarter of 2020 and (ii) approximately $76,400 relates to the sale-leaseback transactions of two facilities in the United States during the third quarter of 2020. •Gains of approximately $24,100 associated with the Frankfurt JV Transaction (as defined in Note 3). | •Gains associated with sale and sale-leaseback transactions of approximately $67,800 in the United States. •The sale of certain land and buildings of approximately $36,000 in the United Kingdom. Partially offset by losses from: •The impairment charge on the assets associated with the select offerings within our Iron Mountain Iron Cloud portfolio and loss on the subsequent sale of certain IT infrastructure assets and rights to certain hardware and maintenance contracts used to deliver these offerings of approximately $25,000. •The write-down of certain property, plant and equipment of approximately $15,700 in the United States. |
(1) The gains recognized associated with the sale and sale-leaseback transactions during the years ended December 31, 2021 and 2020 are part of our program to monetize a small portion of our industrial real estate assets. The terms for these leases are consistent with the terms of our lease portfolio, which are disclosed in Note 2.i.
| | | | | | | | |
| IRON MOUNTAIN 2021 FORM 10-K | 58 |
Part IV
IRON MOUNTAIN INCORPORATED
NOTES TO CONSOLIDATED FINANCIAL STATEMENTS (CONTINUED)
DECEMBER 31, 2021
(In thousands, except share and per share data)
2. SUMMARY OF SIGNIFICANT ACCOUNTING POLICIES (CONTINUED)
K. GOODWILL AND OTHER INDEFINITE-LIVED INTANGIBLE ASSETS
Goodwill and intangible assets with indefinite lives are not amortized but are reviewed annually for impairment or more frequently if impairment indicators arise. Other than goodwill, we currently have no intangible assets that have indefinite lives and which are not amortized.
We have selected October 1 as our annual goodwill impairment review date. We have performed our annual goodwill impairment review as of October 1, 2021, 2020 and 2019. We concluded that as of October 1, 2021, 2020 and 2019, goodwill was not impaired. During the first quarter of 2020, as discussed in greater detail below, we concluded that we had a triggering event related to our Fine Arts reporting unit, requiring us to perform an interim goodwill impairment test. We concluded that the fair value of our Fine Arts reporting unit was less than its carrying value, and, therefore, we recorded a $23,000 impairment charge on the goodwill associated with this reporting unit during the first quarter of 2020.
The following is a discussion regarding (i) interim goodwill impairment review for our Fine Arts reporting unit during the first quarter of 2020 and (ii) the reporting units at which level we tested goodwill for impairment as of October 1, 2021 and 2020 and the composition of these reporting units at December 31, 2021 and 2020 (including the amount of goodwill associated with each reporting unit), as restated for the changes to these reporting units during the second quarter of 2022. When changes occur in the composition of one or more reporting units, the goodwill is reassigned to the reporting units affected based upon their relative fair values.
I. INTERIM GOODWILL IMPAIRMENT REVIEW - FINE ARTS, FIRST QUARTER OF 2020
During the first quarter of 2020, we concluded that we had a triggering event related to our Fine Arts reporting unit, requiring us to perform an interim goodwill impairment test. The primary factor contributing to our conclusion was the expected impact of the COVID-19 pandemic to this particular business and its customers and revenue sources, which caused us to believe it was more likely than not that the carrying value of our Fine Arts reporting unit exceeded its fair value. During the first quarter of 2020, we performed an interim goodwill impairment test for our Fine Arts reporting unit utilizing a discounted cash flow model, with updated assumptions on future revenues, operating expenditures and capital expenditures. We concluded that the fair value of our Fine Arts reporting unit was less than its carrying value, and, therefore, we recorded a $23,000 impairment charge on the goodwill associated with this reporting unit during the first quarter of 2020. Factors that may impact these assumptions include, but are not limited to: (i) our ability to maintain, or grow, storage and retail service revenues in this reporting unit in line with current expectations and (ii) our ability to manage our fixed and variable costs in this reporting unit in line with potential future revenue declines.
II. REPORTING UNITS AS OF OCTOBER 1, 2021 and 2020
Our reporting units at which level we performed our goodwill impairment analysis as of October 1, 2021 and 2020 were as follows:
| | | | | |
| |
•North America Records and Information Management ("North America RIM") •Europe Records and Information Management ("Europe RIM") •Latin America Records and Information Management ("Latin America RIM") •Australia and New Zealand Records and Information Management ("ANZ RIM")
| •Asia Records and Information Management ("Asia RIM") •Global Data Center •Fine Arts •Entertainment Services
|
We concluded that the goodwill associated with each of our reporting units was not impaired as of such date. There were no changes to the composition of our reporting units between October 1, 2021 and December 31, 2021 and between October 1, 2020 and December 31, 2020.
| | | | | | | | |
59 | IRON MOUNTAIN 2021 FORM 10-K | |
Part IV
IRON MOUNTAIN INCORPORATED
NOTES TO CONSOLIDATED FINANCIAL STATEMENTS (CONTINUED)
DECEMBER 31, 2021
(In thousands, except share and per share data)
2. SUMMARY OF SIGNIFICANT ACCOUNTING POLICIES (CONTINUED)
GOODWILL BY REPORTING UNIT AS OF DECEMBER 31, 2021 and 2020
The carrying value of goodwill, net for each of our reporting units as of December 31, 2021 and 2020 is as follows:
| | | | | | | | | | | | | | | | | |
| | | | CARRYING VALUE AS OF
DECEMBER 31, |
| SEGMENT | REPORTING UNIT | | 2021 | | 2020 |
| Global RIM (as defined in Note 11) Business | North America RIM | | $ | 2,720,049 | | | $ | 2,719,182 | |
| Europe RIM | | 624,502 | | | 641,621 | |
| Latin America RIM | | 107,174 | | | 117,834 | |
| ANZ RIM | | 284,042 | | | 301,251 | |
| Asia RIM | | 240,494 | | | 244,294 | |
| Global Data Center Business | Global Data Center | | 426,074 | | | 436,987 | |
| Corporate and Other Business | Fine Arts | | $ | 27,905 | | | $ | 15,176 | |
| Entertainment Services | | 33,291 | | | 35,159 | |
| Technology Escrow Services(1) | | — | | | 46,105 | |
| Total | | | $ | 4,463,531 | | | $ | 4,557,609 | |
(1)The Technology Escrow Services reporting unit was divested in June 2021 (see Note 4).
Reporting unit valuations have generally been determined using a combined approach based on the present value of future cash flows (the “Discounted Cash Flow Model”) and market multiples (the “Market Approach”).
| | | | | |
The Discounted Cash Flow Model incorporates significant assumptions including future revenue growth rates, operating margins, discount rates and capital expenditures. | The Market Approach requires us to make assumptions related to Adjusted EBITDA (as defined in Note 11) multiples. |
| |
Changes in economic and operating conditions impacting these assumptions or changes in multiples could result in goodwill impairments in future periods. In conjunction with our annual goodwill impairment reviews, we reconcile the sum of the valuations of all of our reporting units to our market capitalization as of such dates.
| | | | | | | | |
| IRON MOUNTAIN 2021 FORM 10-K | 60 |
Part IV
IRON MOUNTAIN INCORPORATED
NOTES TO CONSOLIDATED FINANCIAL STATEMENTS (CONTINUED)
DECEMBER 31, 2021
(In thousands, except share and per share data)
2. SUMMARY OF SIGNIFICANT ACCOUNTING POLICIES (CONTINUED)
2022 REPORTING UNIT CHANGES
During the second quarter of 2022, as a result of the realignment of our global managerial structure, we reassessed the composition of our reportable operating segments (see Note 11 for a description and definition of our reportable operating segments) as well as our reporting units.
| | |
| We note the following changes to our reporting units as a result of the reassessment described above: |
•our former Europe RIM reporting unit is now managed as two separate reporting units: (1) our Middle East, North Africa and Turkey ("MENAT") businesses will comprise our "MENAT RIM" reporting unit and (2) our other businesses in Europe and South Africa ("ESA") will comprise our “ESA RIM” reporting unit; •our former ANZ RIM and Asia RIM reporting units are now managed as one "APAC RIM" reporting unit; and •our asset lifecycle management ("ALM") business, which includes our legacy secure IT asset disposition business (which was primarily previously included in our North America RIM reporting unit) and the business acquired through our acquisition of Intercept Parent, Inc. ("ITRenew"), will comprise our newly formed "ALM" reporting unit.
|
There were no changes to our Latin America RIM, Global Data Center and Fine Arts reporting units. We have reassigned goodwill associated with the reporting units impacted by the reorganization on a relative fair value basis, where appropriate. The fair value of each of our new reporting units was determined based on the application of a combined weighted average approach of preliminary fair value multiples of revenue and earnings and discounted cash flow techniques. These fair values represent our best estimate and preliminary assessment of goodwill allocations to each of the new reporting units on a relative fair value basis. We have completed an interim goodwill impairment analysis before and after the reporting unit changes, and we have concluded that the goodwill associated with each of our reporting units was not impaired. The changes in the carrying value of goodwill attributable to each reportable operating segment for the years ended December 31, 2021 and 2020, as restated for the changes described above, are as follows:
| | | | | | | | | | | | | | | | | | | | | | | | | |
| | GLOBAL RIM
BUSINESS | | GLOBAL
DATA CENTER
BUSINESS | | | | CORPORATE
AND OTHER
BUSINESS | | TOTAL
CONSOLIDATED |
| Goodwill balance, net of accumulated amortization, as of December 31, 2019 | $ | 3,940,303 | | | $ | 424,568 | | | | | $ | 120,338 | | | $ | 4,485,209 | |
| | | | | | | | | |
| Non-tax deductible goodwill acquired during the year | 54,258 | | | — | | | | | — | | | 54,258 | |
| Goodwill impairment | — | | | — | | | | | (23,000) | | | (23,000) | |
| Fair value and other adjustments | (3,815) | | | — | | | | | 403 | | | (3,412) | |
| Currency effects | 31,895 | | | 12,419 | | | | | 240 | | | 44,554 | |
| Goodwill balance, net of accumulated amortization, as of December 31, 2020 | 4,022,641 | | | 436,987 | | | | | 97,981 | | | 4,557,609 | |
| Non-tax deductible goodwill acquired during the year | 14,406 | | | — | | | | | 13,141 | | | 27,547 | |
| Goodwill allocated to IPM Divestment | — | | | — | | | | | (46,105) | | | (46,105) | |
| Fair value and other adjustments | (6,091) | | | — | | | | | (1,268) | | | (7,359) | |
| Currency effects | (58,104) | | | (10,913) | | | | | 856 | | | (68,161) | |
| Goodwill balance, net of accumulated amortization, as of December 31, 2021 | $ | 3,972,852 | | | $ | 426,074 | | | | | $ | 64,605 | | | $ | 4,463,531 | |
| Accumulated Goodwill Impairment Balance as of December 31, 2020 | $ | 132,409 | | | $ | — | | | | | $ | 26,011 | | | $ | 158,420 | |
| Accumulated Goodwill Impairment Balance as of December 31, 2021 | $ | 132,409 | | | $ | — | | | | | $ | 26,011 | | | $ | 158,420 | |
| | | | | | | | |
61 | IRON MOUNTAIN 2021 FORM 10-K | |
Part IV
IRON MOUNTAIN INCORPORATED
NOTES TO CONSOLIDATED FINANCIAL STATEMENTS (CONTINUED)
DECEMBER 31, 2021
(In thousands, except share and per share data)
2. SUMMARY OF SIGNIFICANT ACCOUNTING POLICIES (CONTINUED)
L. FINITE-LIVED INTANGIBLE ASSETS AND LIABILITIES
I. CUSTOMER RELATIONSHIP INTANGIBLE ASSETS
Customer relationship intangible assets, which are acquired through either business combinations or acquisitions of customer relationships, are amortized over periods ranging from 10 to 30 years. Customer relationship intangible assets are recorded based upon estimates of their fair value.
II. CUSTOMER INDUCEMENTS
Payments that are made to a customer’s current records management vendor in order to terminate the customer’s existing contract with that vendor (“Permanent Withdrawal Fees”), or direct payments to a customer for which no distinct benefit is received in return, are collectively referred to as "Customer Inducements". Customer Inducements are treated as a reduction of the transaction price over periods ranging from one to 10 years and are included in storage and service revenue in the accompanying Consolidated Statements of Operations. If the customer terminates its relationship with us, the unamortized carrying value of the Customer Inducement intangible asset is charged to revenue. However, in the event of such termination, we generally collect, and record as income, permanent removal fees that generally equal or exceed the amount of the unamortized Customer Inducement intangible asset.
III. DATA CENTER INTANGIBLE ASSETS AND LIABILITIES
Finite-lived intangible assets associated with our Global Data Center Business consist of the following:
DATA CENTER IN-PLACE LEASE INTANGIBLE ASSETS AND DATA CENTER TENANT RELATIONSHIP INTANGIBLE ASSETS
Data Center In-Place Lease Intangible Assets (“Data Center In-Place Leases”) and Data Center Tenant Relationship Intangible Assets (“Data Center Tenant Relationships”) reflect the value associated with acquiring a data center operation with active tenants as of the date of acquisition. The value of Data Center In-Place Leases is determined based upon an estimate of the economic costs (such as lost revenues, tenant improvement costs, commissions, legal expenses and other costs to acquire new data center leases) avoided by acquiring a data center operation with active tenants that would have otherwise been incurred if the data center operation was purchased vacant. Data Center In-Place Leases are amortized over the weighted average remaining term of the acquired data center leases. The value of Data Center Tenant Relationships is determined based upon an estimate of the economic costs avoided upon lease renewal of the acquired tenants, based upon expectations of lease renewal. Data Center Tenant Relationships are amortized over the weighted average remaining anticipated life of the relationship with the acquired tenant.
DATA CENTER ABOVE-MARKET AND BELOW-MARKET IN-PLACE LEASE INTANGIBLE ASSETS
We record Data Center Above-Market In-Place Lease Intangible Assets (“Data Center Above-Market Leases”) and Data Center Below-Market In-Place Lease Intangible Assets (“Data Center Below-Market Leases”) at the net present value of the difference between (i) the contractual amounts to be paid pursuant to each in-place lease and (ii) management’s estimate of the fair market lease rates for each corresponding in-place lease. Data Center Above-Market Leases and Data Center Below-Market Leases are amortized over the remaining non-cancellable term of the acquired in-place lease to storage revenue.
The gross carrying amount and accumulated amortization of our finite-lived intangible assets as of December 31, 2021 and 2020, respectively, are as follows:
| | | | | | | | |
| IRON MOUNTAIN 2021 FORM 10-K | 62 |
Part IV
IRON MOUNTAIN INCORPORATED
NOTES TO CONSOLIDATED FINANCIAL STATEMENTS (CONTINUED)
DECEMBER 31, 2021
(In thousands, except share and per share data)
2. SUMMARY OF SIGNIFICANT ACCOUNTING POLICIES (CONTINUED)
| | | | | | | | | | | | | | | | | | | | | | | |
| DECEMBER 31, 2021 | | DECEMBER 31, 2020 |
| DESCRIPTION | GROSS CARRYING AMOUNT | ACCUMULATED AMORTIZATION | NET CARRYING AMOUNT | | GROSS CARRYING AMOUNT | ACCUMULATED AMORTIZATION | NET CARRYING AMOUNT |
| Assets: | | | | | | | |
Customer relationship intangible assets(1) | $ | 1,835,949 | | $ | (763,943) | | $ | 1,072,006 | | | $ | 1,852,700 | | $ | (668,547) | | $ | 1,184,153 | |
Customer inducements(1) | 51,403 | | (28,400) | | 23,003 | | | 49,098 | | (26,923) | | 22,175 | |
Data center lease-based intangible assets(1)(2) | 278,904 | | (192,870) | | 86,034 | | | 269,988 | | (149,339) | | 120,649 | |
Third-party commissions asset(3) | 33,947 | | (13,716) | | 20,231 | | | 34,317 | | (8,761) | | 25,556 | |
| | | | | | | |
| Liabilities: | | | | | | | |
Data center below-market leases(4) | $ | 12,782 | | $ | (6,923) | | $ | 5,859 | | | $ | 12,854 | | $ | (5,943) | | $ | 6,911 | |
(1)Included in Customer relationships, customer inducements and data center lease-based intangibles in the accompanying Consolidated Balance Sheets as of December 31, 2021 and 2020.
(2)Data center lease-based intangible assets includes Data Center In-Place Leases, Data Center Tenant Relationships and Data Center Above-Market Leases.
(3)Included in Other (within Other Assets, Net) in the accompanying Consolidated Balance Sheets as of December 31, 2021 and 2020.
(4)Included in Other long-term liabilities in the accompanying Consolidated Balance Sheets as of December 31, 2021 and 2020.
Amortization expense associated with finite-lived intangible assets, revenue reduction associated with the amortization of Customer Inducements and net revenue reduction associated with the amortization of Data Center Above-Market Leases and Data Center Below-Market Leases for the years ended December 31, 2021, 2020 and 2019 is as follows:
| | | | | | | | | | | | | | | | | | | | |
| | | YEAR ENDED DECEMBER 31, |
| | | 2021 | | 2020 | | 2019 |
| Amortization expense included in depreciation and amortization associated with: | | | | | | |
| Customer relationship intangible assets | | $ | 117,761 | | | $ | 117,514 | | | $ | 117,972 | |
| Data center in-place leases and tenant relationships | | 42,333 | | | 42,637 | | | 46,696 | |
| | | | | | |
| Third-party commissions asset and other finite-lived intangible assets | | 6,987 | | | 7,004 | | | 7,957 | |
| Revenue reduction associated with amortization of: | | | | | | |
| Customer inducements and data center above-market and below-market leases | | $ | 8,852 | | | $ | 9,878 | | | $ | 13,703 | |
Estimated amortization expense for existing finite-lived intangible assets (excluding Contract Fulfillment Costs, as defined and disclosed in Note 2.r.) is as follows:
| | | | | | | | | | | | | | |
| | | ESTIMATED AMORTIZATION |
| YEAR | | INCLUDED IN DEPRECIATION
AND AMORTIZATION | | REVENUE REDUCTION ASSOCIATED WITH CUSTOMER INDUCEMENTS
AND DATA CENTER ABOVE-MARKET AND
BELOW-MARKET LEASES |
| 2022 | | $ | 134,107 | | | $ | 6,367 | |
| 2023 | | 128,681 | | | 4,628 | |
| 2024 | | 123,412 | | | 2,599 | |
| 2025 | | 117,306 | | | 1,506 | |
| 2026 | | 115,966 | | | 1,187 | |
| Thereafter | | 557,040 | | | 2,616 | |
M. DEFERRED FINANCING COSTS
Deferred financing costs are amortized over the life of the related debt. If debt is retired early, the related unamortized deferred financing costs are written-off in the period the debt is retired to Other (income) expense, net. See Note 7.
| | | | | | | | |
63 | IRON MOUNTAIN 2021 FORM 10-K | |
Part IV
IRON MOUNTAIN INCORPORATED
NOTES TO CONSOLIDATED FINANCIAL STATEMENTS (CONTINUED)
DECEMBER 31, 2021
(In thousands, except share and per share data)
2. SUMMARY OF SIGNIFICANT ACCOUNTING POLICIES (CONTINUED)
N. DERIVATIVE INSTRUMENTS AND HEDGING ACTIVITIES
Every derivative instrument is required to be recorded in the balance sheet as either an asset or a liability measured at its fair value. Periodically, we acquire derivative instruments that are intended to hedge either cash flows or values that are subject to foreign exchange or other market price risk and not for trading purposes. We have formally documented our hedging relationships, including identification of the hedging instruments and the hedged items, as well as our risk management objectives and strategies for undertaking each hedge transaction. Given the recurring nature of our revenues and the long-term nature of our asset base, we have the ability and the preference to use long-term, fixed interest rate debt to finance our business, thereby preserving our long-term returns on invested capital. We may use interest rate swaps as a tool to maintain our targeted level of fixed rate debt. In addition, we may enter into cross-currency swaps to hedge the variability of exchange rates between the United States and our foreign subsidiaries, as well as interest rates. We may also use borrowings in foreign currencies, either obtained in the United States or by our foreign subsidiaries, to hedge foreign currency risk associated with our international investments. As of December 31, 2021 and 2020, none of our derivative instruments contained credit-risk related contingent features. See Note 6.
O. FAIR VALUE MEASUREMENTS
Entities are permitted under GAAP to elect to measure certain financial instruments and certain other items at either fair value or cost. We have elected the cost measurement option in all circumstances where we had an option.
Our financial assets or liabilities that are carried at fair value are required to be measured using inputs from the three levels of the fair value hierarchy. A financial asset or liability’s classification within the hierarchy is determined based on the lowest level input that is significant to the fair value measurement. The three levels of the fair value hierarchy are as follows:
Level 1—Inputs are unadjusted quoted prices in active markets for identical assets or liabilities that we have the ability to access at the measurement date.
Level 2—Inputs include quoted prices for similar assets and liabilities in active markets, quoted prices for identical or similar assets or liabilities in markets that are not active, inputs other than quoted prices that are observable for the asset or liability (i.e., interest rates, yield curves, etc.), and inputs that are derived principally from or corroborated by observable market data by correlation or other means (market corroborated inputs).
Level 3—Unobservable inputs that reflect our assumptions about the assumptions that market participants would use in pricing the asset or liability.
The assets and liabilities carried at fair value and measured on a recurring basis as of December 31, 2021 and 2020, respectively, are as follows:
| | | | | | | | |
| IRON MOUNTAIN 2021 FORM 10-K | 64 |
Part IV
IRON MOUNTAIN INCORPORATED
NOTES TO CONSOLIDATED FINANCIAL STATEMENTS (CONTINUED)
DECEMBER 31, 2021
(In thousands, except share and per share data)
2. SUMMARY OF SIGNIFICANT ACCOUNTING POLICIES (CONTINUED)
| | | | | | | | | | | | | | | | | | | | | | | | | | |
| | | | | FAIR VALUE MEASUREMENTS AT DECEMBER 31, 2021 USING |
DESCRIPTION | | TOTAL CARRYING
VALUE AT
DECEMBER 31, 2021 | | QUOTED PRICES IN
ACTIVE MARKETS
(LEVEL 1) | | SIGNIFICANT OTHER
OBSERVABLE INPUTS
(LEVEL 2) | | SIGNIFICANT
UNOBSERVABLE INPUTS
(LEVEL 3) |
Money Market Funds(1) | | $ | 101,022 | | | $ | — | | | $ | 101,022 | | | $ | — | |
Time Deposits(1) | | 2,238 | | | — | | | 2,238 | | | — | |
| Trading Securities | | 11,147 | | | 11,062 | | (2) | 85 | | (3) | — | |
Derivative Assets(4) | | 11,021 | | | — | | | 11,021 | | | — | |
Derivative Liabilities(4) | | 8,344 | | | — | | | 8,344 | | | — | |
| | | | | | | | | | | | | | | | | | | | | | | | | | |
| | | | | FAIR VALUE MEASUREMENTS AT DECEMBER 31, 2020 USING |
| DESCRIPTION | | TOTAL CARRYING
VALUE AT
DECEMBER 31, 2020 | | QUOTED PRICES IN
ACTIVE MARKETS
(LEVEL 1) | | SIGNIFICANT OTHER
OBSERVABLE INPUTS
(LEVEL 2) | | SIGNIFICANT
UNOBSERVABLE INPUTS
(LEVEL 3) |
Money Market Funds(1) | | $ | 62,657 | | | $ | — | | | $ | 62,657 | | | $ | — | |
Time Deposits(1) | | 2,121 | | | | | 2,121 | | | — | |
| Trading Securities | | 10,892 | | | 10,636 | | (2) | 256 | | (3) | — | |
Derivative Liabilities(4) | | 49,703 | | | — | | | 49,703 | | | — | |
(1)Money market funds and time deposits are measured based on quoted prices for similar assets and/or subsequent transactions.
(2)Certain trading securities are measured at fair value using quoted market prices.
(3)Certain trading securities are measured based on inputs other than quoted market prices that are observable.
(4)Derivative assets and liabilities include (i) interest rate swap agreements, including forward-starting interest rate swap agreements, to limit our exposure to changes in interest rates on a portion of our floating rate indebtedness and (ii) cross-currency swap agreements to hedge the variability of exchange rates impacts between the United States dollar and the Euro and certain of our Euro denominated subsidiaries. Our derivative financial instruments are measured using industry standard valuation models using market-based observable inputs, including interest rate curves, forward and spot prices for currencies and implied volatilities. Credit risk is also factored into the determination of the fair value of our derivative financial instruments. See Note 6 for additional information on our derivative financial instruments.
We did not have any material items that are measured at fair value on a non-recurring basis for the years ended December 31, 2021, 2020, and 2019, with the exception of: (i) the reporting units as presented in our goodwill impairment analysis (as disclosed in Note 2.k.); (ii) those acquired in acquisitions (as disclosed in Note 3); (iii) the redemption value of certain redeemable noncontrolling interests (as disclosed in Note 2.p.); and (iv) our initial investments in the Web Werks JV, the Frankfurt JV and the MakeSpace JV (each as defined in Note 5), all of which are based on Level 3 inputs.
The fair value of our long-term debt, which was determined based on either Level 1 inputs or Level 3 inputs, is disclosed in Note 7. Long-term debt is measured at cost in our Consolidated Balance Sheets as of December 31, 2021 and 2020.
P. REDEEMABLE NONCONTROLLING INTERESTS
Certain unaffiliated third parties own noncontrolling interests in certain of our foreign consolidated subsidiaries. The underlying agreements between us and our noncontrolling interest shareholders for these subsidiaries contain provisions under which the noncontrolling interest shareholders can require us to purchase their respective interests in such subsidiaries at certain times and at a purchase price as stipulated in the underlying agreements (generally at fair value). These put options make these noncontrolling interests redeemable and, therefore, these noncontrolling interests are classified as temporary equity outside of stockholders’ equity. Redeemable noncontrolling interests are reported at the higher of their redemption value or the noncontrolling interest holders’ proportionate share of the underlying subsidiaries net carrying value. Increases or decreases in the redemption value of the noncontrolling interest are offset against Additional Paid-in Capital.
| | | | | | | | |
65 | IRON MOUNTAIN 2021 FORM 10-K | |
Part IV
IRON MOUNTAIN INCORPORATED
NOTES TO CONSOLIDATED FINANCIAL STATEMENTS (CONTINUED)
DECEMBER 31, 2021
(In thousands, except share and per share data)
2. SUMMARY OF SIGNIFICANT ACCOUNTING POLICIES (CONTINUED)
In 2018, one of our noncontrolling interest shareholders exercised its option to put its ownership interest back to us. Upon the exercise of the put option, this noncontrolling interest became mandatorily redeemable by us, and, therefore, was accounted for as a liability rather than a component of redeemable noncontrolling interests. In May 2021, we agreed to final settlement terms and paid the put option price for the noncontrolling interest shares.
Q. ACCUMULATED OTHER COMPREHENSIVE ITEMS, NET
The changes in accumulated other comprehensive items, net for the years ended December 31, 2021, 2020 and 2019 are as follows:
| | | | | | | | | | | | | | | | | |
| | FOREIGN CURRENCY TRANSLATION AND OTHER ADJUSTMENTS | | CHANGE IN FAIR VALUE OF DERIVATIVE INSTRUMENTS | | TOTAL |
| Balance as of December 31, 2018 | $ | (264,691) | | | $ | (973) | | | $ | (265,664) | |
| Other comprehensive income (loss): | | | | | |
| Foreign currency translation and other adjustments | 11,866 | | | — | | | 11,866 | |
| Change in fair value of derivative instruments | — | | | (8,783) | | | (8,783) | |
| Total other comprehensive income (loss) | 11,866 | | | (8,783) | | | 3,083 | |
| Balance as of December 31, 2019 | (252,825) | | | (9,756) | | | (262,581) | |
| Other comprehensive income (loss): | | | | | |
| Foreign currency translation and other adjustments | 46,635 | | | — | | | 46,635 | |
| Change in fair value of derivative instruments | — | | | (39,947) | | | (39,947) | |
| Total other comprehensive income (loss) | 46,635 | | | (39,947) | | | 6,688 | |
| Balance as of December 31, 2020 | (206,190) | | | (49,703) | | | (255,893) | |
| Other comprehensive (loss) income: | | | | | |
| Foreign currency translation and other adjustments | (134,834) | | | — | | | (134,834) | |
| Change in fair value of derivative instruments | — | | | 52,380 | | | 52,380 | |
| Total other comprehensive (loss) income | (134,834) | | | 52,380 | | | (82,454) | |
| Balance as of December 31, 2021 | $ | (341,024) | | | $ | 2,677 | | | $ | (338,347) | |
| | | | | | | | |
| IRON MOUNTAIN 2021 FORM 10-K | 66 |
Part IV
IRON MOUNTAIN INCORPORATED
NOTES TO CONSOLIDATED FINANCIAL STATEMENTS (CONTINUED)
DECEMBER 31, 2021
(In thousands, except share and per share data)
2. SUMMARY OF SIGNIFICANT ACCOUNTING POLICIES (CONTINUED)
R. REVENUES
Our revenues consist of storage rental revenues as well as service revenues and are reflected net of sales and value-added taxes. Storage rental revenues, which are considered a key driver of financial performance for the storage and information management services industry, consist primarily of recurring periodic rental charges related to the storage of materials or data (generally on a per unit basis) that are typically retained by customers for many years and revenues associated with our data center operations. Service revenues include charges for related service activities, the most significant of which include: (1) the handling of records, including the addition of new records, temporary removal of records from storage, refiling of removed records, customer termination and permanent removal fees, project revenues and courier operations, consisting primarily of the pickup and delivery of records upon customer request; (2) destruction services, consisting primarily of secure shredding of sensitive documents and the subsequent sale of shredded paper for recycling, the price of which can fluctuate from period to period; (3) digital solutions, including the scanning, imaging and document conversion services of active and inactive records, and consulting services; and (4) data center services, including set up, monitoring and support of our customers' assets which are protected in our data center facilities, and special project services, including data center fitout.
We account for revenue in accordance with ASC 606, Revenue from Contracts with Customers (“ASC 606”). Customers are generally billed monthly based on contractually agreed-upon terms, and storage rental and service revenues are recognized in the month the respective storage rental or service is provided, in line with the transfer of control to the customer. When storage rental fees or services are billed in advance, amounts related to future storage rental or prepaid service contracts are accounted for as deferred revenue and recognized upon the transfer of control to the customer, generally ratably over the contract term. Customer contracts generally include promises to provide monthly recurring storage and related services that are essentially the same over time and have the same pattern of transfer of control to the customer; therefore, most performance obligations represent a promise to deliver a series of distinct services over time (as determined for purposes of ASC 606, a “series”). For those contracts that qualify as a series, we have a right to consideration from the customer in an amount that corresponds directly with the value of the underlying performance obligation transferred to the customer to date. This concept is known as "right to invoice” and we apply the “right to invoice” practical expedient to the majority of all revenues, with the exception of storage revenues in our Global Data Center Business (which are subject to leasing guidance). Additionally, each purchasing decision is fully in the control of the customer and; therefore, consideration beyond the current reporting period is variable and allocated to the specific period to which the consideration relates, which is consistent with the practical expedient.
Our Global Data Center Business features storage rental provided to the customer at contractually specified rates over a fixed contractual period. Storage rental revenue related to the storage component of our Global Data Center Business is recognized on a straight-line basis over the contract term in accordance with ASC 842. The revenue related to the service component of our Global Data Center Business is recognized in the period the related services are provided.
The costs associated with the initial movement of customer records into physical storage and certain commissions are considered costs to obtain or fulfill customer contracts (“Contract Fulfillment Costs”). The following describes our significant Contract Fulfillment Costs recognized under ASC 606:
INTAKE COSTS (AND ASSOCIATED DEFERRED REVENUE)
The costs of the initial intake of customer records into physical storage (“Intake Costs”) are deferred and amortized as a component of depreciation and amortization in our Consolidated Statements of Operations over three years, consistent with the transfer of the performance obligation to the customer to which the asset relates. In instances where such Intake Costs are billed to the customer, the associated revenue is deferred and recognized over the same three-year period.
COMMISSIONS
Certain commission payments that are directly associated with the fulfillment of long-term contracts are capitalized and amortized as a component of depreciation and amortization in our Consolidated Statements of Operations over three years, consistent with the transfer of the performance obligation to the customer to which the asset relates. Certain direct commission payments associated with contracts with a duration of one year or less are expensed as incurred under the practical expedient which allows an entity to expense as incurred an incremental cost of obtaining a contract if the amortization period of the asset that the entity otherwise would have recognized is one year or less.
| | | | | | | | |
67 | IRON MOUNTAIN 2021 FORM 10-K | |
Part IV
IRON MOUNTAIN INCORPORATED
NOTES TO CONSOLIDATED FINANCIAL STATEMENTS (CONTINUED)
DECEMBER 31, 2021
(In thousands, except share and per share data)
2. SUMMARY OF SIGNIFICANT ACCOUNTING POLICIES (CONTINUED)
Contract Fulfillment Costs, which are included as a component of Other within Other Assets, Net, as of December 31, 2021 and 2020 are as follows:
| | | | | | | | | | | | | | | | | | | | | | | | | | | | | | | | | | | | | | |
| | DECEMBER 31, 2021 | | DECEMBER 31, 2020 |
| DESCRIPTION | | GROSS
CARRYING
AMOUNT | | ACCUMULATED
AMORTIZATION | | NET
CARRYING
AMOUNT | | GROSS
CARRYING
AMOUNT | | ACCUMULATED
AMORTIZATION | | NET
CARRYING AMOUNT |
| Intake Costs asset | | $ | 71,336 | | | $ | (42,678) | | | $ | 28,658 | | | $ | 63,721 | | | $ | (33,352) | | | $ | 30,369 | |
| Commissions asset | | 114,791 | | | (50,553) | | | 64,238 | | | 91,069 | | | (38,787) | | | 52,282 | |
Amortization expense associated with the Intake Costs and Commissions assets for the years ended December 31, 2021, 2020 and 2019 are as follows:
| | | | | | | | | | | | | | | | | | | | |
| | YEAR ENDED DECEMBER 31, |
| DESCRIPTION | | 2021 | | 2020 | | 2019 |
| Intake Costs asset | | $ | 17,530 | | | $ | 13,300 | | | $ | 10,144 | |
| Commissions asset | | 30,739 | | | 24,052 | | | 19,109 | |
Estimated amortization expense for Contract Fulfillment Costs is as follows:
| | | | | | | | |
| YEAR | | ESTIMATED AMORTIZATION |
| 2022 | | $ | 47,393 | |
| 2023 | | 30,083 | |
| 2024 | | 15,420 | |
Deferred revenue liabilities are reflected as follows in our Consolidated Balance Sheets:
| | | | | | | | | | | | | | | | | | |
| | | DECEMBER 31, | |
| DESCRIPTION | LOCATION IN BALANCE SHEET | | 2021 | | 2020 | |
| Deferred revenue - Current | Deferred revenue | | $ | 307,470 | | | $ | 295,785 | | |
| Deferred revenue - Long-term | Other Long-term Liabilities | | 33,691 | | | 35,612 | | |
DATA CENTER LESSOR CONSIDERATIONS
Our Global Data Center Business features storage rental provided to customers at contractually specified rates over a fixed contractual period. Our data center revenue contracts are accounted for in accordance with ASC 842. ASC 842 provides a practical expedient which allows lessors to account for nonlease components (such as power and connectivity, in the case of our Global Data Center Business) with the related lease component if both the timing and pattern of transfer are the same for nonlease components and the lease component, and the lease component, if accounted for separately, would be classified as an operating lease. The single combined component is accounted for under ASC 842 if the lease component is the predominant component and is accounted for under ASC 606 if the nonlease components are the predominant components. We have elected to take this practical expedient.
| | | | | | | | |
| IRON MOUNTAIN 2021 FORM 10-K | 68 |
Part IV
IRON MOUNTAIN INCORPORATED
NOTES TO CONSOLIDATED FINANCIAL STATEMENTS (CONTINUED)
DECEMBER 31, 2021
(In thousands, except share and per share data)
2. SUMMARY OF SIGNIFICANT ACCOUNTING POLICIES (CONTINUED)
Storage rental revenue, including revenue associated with power and connectivity, associated with our Global Data Center Business for the years ended December 31, 2021, 2020 and 2019 are as follows:
| | | | | | | | | | | | | | | | | | | | |
| | YEAR ENDED DECEMBER 31, |
| | 2021 | | 2020 | | 2019 |
Storage rental revenue(1) | | $ | 289,592 | | | $ | 263,695 | | | $ | 246,925 | |
(1)Revenue associated with power and connectivity included within storage rental revenue was $62,185, $47,451 and $43,269 for the years ended December 31, 2021, 2020 and 2019, respectively.
The revenue related to the service component of our Global Data Center Business is recognized in the period the related services are provided.
The future minimum lease payments we expect to receive under non-cancellable data center operating leases for which we are the lessor, excluding month to month leases, for the next five years are as follows:
| | | | | | | | |
| YEAR | | FUTURE MINIMUM LEASE PAYMENTS |
| 2022 | | $ | 266,109 | |
| 2023 | | 218,324 | |
| 2024 | | 179,169 | |
| 2025 | | 126,269 | |
| 2026 | | 98,440 | |
S. STOCK-BASED COMPENSATION
We record stock-based compensation expense, utilizing the straight-line method, for the cost of stock options, restricted stock units (“RSUs”), performance units (“PUs”) and shares of stock issued under our employee stock purchase plan (“ESPP”) (together, "Employee Stock-Based Awards”).
For our Employee Stock-Based Awards made on or after February 20, 2019, we have included the following retirement provision:
•Upon an employee’s retirement on or after attaining age 58, if the sum of (i) the award recipient’s age at retirement and (ii) the award recipient’s years of service with the company totals at least 70, the award recipient is entitled to continued vesting of any outstanding Employee Stock-Based Awards, provided that, for awards granted in the year of retirement, their retirement occurs on or after July 1 (the “Retirement Criteria”).
•Accordingly, (i) grants of Employee Stock-Based Awards to an employee who has met the Retirement Criteria on or before the date of grant, or will meet the Retirement Criteria before July 1 of the year of the grant, will be expensed between the date of grant and July 1 of the grant year and (ii) grants of Employee Stock-Based Awards to employees who will meet the Retirement Criteria during the award’s normal vesting period will be expensed between the date of grant and the date upon which the award recipient meets the Retirement Criteria.
•Stock options and RSUs granted to recipients who meet the Retirement Criteria will continue vesting on the original vesting schedule. If an employee retires and has met the Retirement Criteria, stock options generally will remain exercisable for up to three years or the original expiration date of the stock options, if earlier. PUs granted to recipients who meet the Retirement Criteria will continue to vest and be delivered in accordance with the original vesting schedule of the applicable PU award and remain subject to the same performance conditions.
| | | | | | | | |
69 | IRON MOUNTAIN 2021 FORM 10-K | |
Part IV
IRON MOUNTAIN INCORPORATED
NOTES TO CONSOLIDATED FINANCIAL STATEMENTS (CONTINUED)
DECEMBER 31, 2021
(In thousands, except share and per share data)
2. SUMMARY OF SIGNIFICANT ACCOUNTING POLICIES (CONTINUED)
Stock-based compensation expense for Employee Stock-Based Awards included in the accompanying Consolidated Statements of Operations for the years ended December 31, 2021, 2020 and 2019 is as follows:
| | | | | | | | | | | | | | | | | |
| YEAR ENDED DECEMBER 31, |
| 2021 | | 2020 | | 2019 |
| Stock-based compensation expense | $ | 61,001 | | | $ | 37,674 | | | $ | 35,654 | |
| Stock-based compensation expense, after tax | 59,243 | | | 36,584 | | | 33,103 | |
| | | | | |
| | | | | |
The substantial majority of stock-based compensation expense for Employee Stock-Based Awards is included in Selling, general and administrative expenses in the accompanying Consolidated Statements of Operations.
STOCK OPTIONS
Options are generally granted with exercise prices equal to the market price of the stock on the date of grant; however, in certain instances, options are granted at prices greater than the market price of the stock on the date of grant. The substantial majority of options we issue become exercisable ratably over a period three years from the date of grant and have a contractual life of 10 years from the date of grant, unless the holder’s employment is terminated sooner. Our non-employee directors are considered employees for purposes of our stock option plans and stock option reporting.
Our stock options outstanding at December 31, 2021 are based on the three-year vesting period (10 year contractual life) described above.
Our equity compensation plans generally provide that, upon a vesting change in control (as defined in each plan), any unvested options and other awards granted thereunder shall vest immediately if an employee is terminated as a result of the change in control or terminates their own employment for good reason (as defined in each plan). On January 20, 2015, our stockholders approved the adoption of the Iron Mountain Incorporated 2014 Stock and Cash Incentive Plan, as amended (the "2014 Plan”).
In May 2021, our stockholders approved an amendment to the 2014 Plan to (i) increase the number of shares of our common stock authorized for issuance thereunder by 8,000,000 from 12,750,000 to 20,750,000, (ii) extend the termination date of the 2014 Plan from May 24, 2027 to May 12, 2031, (iii) provide that, other than in specified circumstances, no equity-based award will vest before the first anniversary of the date of grant and (iv) provide that dividends and dividend equivalents are not paid with respect to stock options or stock appreciation rights.
A total of 20,750,000 shares of common stock have been reserved for grants of options and other rights under our various stock incentive plans, including the 2014 Plan. The number of shares available for grant under our various stock incentive plans, not including the ESPP, at December 31, 2021 was 9,055,756.
The weighted average fair value of stock options granted in 2021, 2020 and 2019 was $3.23, $2.35 and $3.58 per share, respectively. These values were estimated on the date of grant using the Black-Scholes option pricing model. The weighted average assumptions used for grants in the years ended December 31, 2021, 2020 and 2019 are as follows:
| | | | | | | | | | | | | | | | | | | | |
| | YEAR ENDED DECEMBER 31, |
| WEIGHTED AVERAGE ASSUMPTIONS | | 2021 | | 2020 | | 2019 |
Expected volatility(1) | | 28.3 | % | | 25.4 | % | | 24.3 | % |
Risk-free interest rate(2) | | 1.45 | % | | 1.45 | % | | 2.47 | % |
Expected dividend yield(3) | | 7 | % | | 7 | % | | 7 | % |
Expected life(4) | | 10.0 years | | 10.0 years | | 5.0 years |
(1)Expected volatility is calculated utilizing daily historical volatility over a period that equates to the expected life of the option.
(2)Risk-free interest rate is based on the United States Treasury interest rates whose term is consistent with the expected life (estimated period of time outstanding) of the stock options.
(3)Expected dividend yield is considered in the option pricing model and represents our current annualized expected per share dividends over the current trade price of our common stock.
(4)Expected life of the stock options granted is estimated using the historical exercise behavior of employees.
| | | | | | | | |
| IRON MOUNTAIN 2021 FORM 10-K | 70 |
Part IV
IRON MOUNTAIN INCORPORATED
NOTES TO CONSOLIDATED FINANCIAL STATEMENTS (CONTINUED)
DECEMBER 31, 2021
(In thousands, except share and per share data)
2. SUMMARY OF SIGNIFICANT ACCOUNTING POLICIES (CONTINUED)
A summary of stock option activity for the year ended December 31, 2021 is as follows:
| | | | | | | | | | | | | | | | | | | | | | | |
| | OPTIONS | | WEIGHTED
AVERAGE
EXERCISE PRICE | | WEIGHTED AVERAGE
REMAINING
CONTRACTUAL
TERM (YEARS) | | AGGREGATE
INTRINSIC
VALUE |
| Outstanding at December 31, 2020 | 4,732,519 | | | $ | 35.83 | | | | | |
| Granted | 429,618 | | | 34.73 | | | | | |
| Exercised | (869,855) | | | 34.26 | | | | | |
| Forfeited | (16,304) | | | 35.37 | | | | | |
| Expired | (51,905) | | | 34.27 | | | | | |
| Outstanding at December 31, 2021 | 4,224,073 | | | $ | 36.06 | | | 5.75 | | $ | 68,747 | |
| Options exercisable at December 31, 2021 | 3,168,908 | | | $ | 36.60 | | | 4.90 | | $ | 49,850 | |
| Options expected to vest | 1,054,641 | | | $ | 34.42 | | | 8.34 | | $ | 18,888 | |
RESTRICTED STOCK UNITS
Our RSUs generally have a vesting period of three years from the date of grant. However, RSUs granted to our non-employee directors vest immediately upon grant. All RSUs accrue dividend equivalents associated with the underlying stock as we declare dividends. Dividends will generally be paid to holders of RSUs in cash upon the vesting date of the associated RSU and will be forfeited if the RSU does not vest. The fair value of RSUs is the excess of the market price of our common stock at the date of grant over the holder's purchase price (which is typically zero).
The fair value of RSUs vested during the years ended December 31, 2021, 2020 and 2019, are as follows:
| | | | | | | | | | | | | | | | | |
| | YEAR ENDED DECEMBER 31, |
| 2021 | | 2020 | | 2019 |
| Fair value of RSUs vested | $ | 29,332 | | | $ | 26,492 | | | $ | 21,191 | |
A summary of RSU activity for the year ended December 31, 2021 is as follows:
| | | | | | | | | | | |
| | RSUs | | WEIGHTED-AVERAGE
GRANT-DATE FAIR VALUE |
| Non-vested at December 31, 2020 | 1,294,006 | | | $ | 33.02 | |
| Granted | 1,178,170 | | | 34.98 | |
| Vested | (862,377) | | | 34.01 | |
| Forfeited | (206,166) | | | 32.65 | |
| Non-vested at December 31, 2021 | 1,403,633 | | | $ | 34.11 | |
PERFORMANCE UNITS
The PUs we issue vest based on our performance against predefined operational and share based targets. For awards granted in 2019 and thereafter, the vesting is subject to a minimum level of return on invested capital (“ROIC”) in the third year of the performance period, and thereafter the number of PUs earned is based on (i) the revenue performance for each year averaged at the end of the three-year performance period, (ii) the revenue exit rate of new products in the last quarter of the three-year performance period and (iii) a relative TSR target. With respect to the PUs granted in 2019 and thereafter, the number of PUs earned may range from 0% to approximately 238% of the initial award.
| | | | | | | | |
71 | IRON MOUNTAIN 2021 FORM 10-K | |
Part IV
IRON MOUNTAIN INCORPORATED
NOTES TO CONSOLIDATED FINANCIAL STATEMENTS (CONTINUED)
DECEMBER 31, 2021
(In thousands, except share and per share data)
2. SUMMARY OF SIGNIFICANT ACCOUNTING POLICIES (CONTINUED)
All of our PUs will be settled in shares of our common stock and are subject to cliff vesting three years from the date of the original PU grant. As detailed above, PUs granted are subject to the Retirement Criteria. PUs granted to recipients who meet the Retirement Criteria will continue to vest and be delivered in accordance with the original vesting schedule of the applicable PU award and remain subject to the same performance conditions. As a result, PUs are generally expensed over the three-year performance period.
All PUs accrue dividend equivalents associated with the underlying stock as we declare dividends. Dividends will generally be paid to holders of PUs in cash upon the settlement date of the associated PU and will be forfeited if the PU does not vest.
During the years ended December 31, 2021, 2020 and 2019, we issued 488,953, 425,777 and 380,856 PUs, respectively. We forecast the likelihood of achieving the predefined targets for our PUs in order to calculate the expected PUs to be earned. We record a compensation charge based on either the forecasted PUs to be earned (during the performance period) or the actual PUs earned (at the three-year anniversary of the grant date) over the vesting period for each of the awards. The fair value of PUs based on our performance against predefined targets is the excess of the market price of our common stock at the date of grant over the purchase price (which is typically zero). For PUs earned based on a market condition, we utilize a Monte Carlo simulation to fair value these awards at the date of grant, and such fair value is expensed over the three-year performance period.
The fair value of earned PUs that vested during the years ended December 31, 2021, 2020 and 2019, is as follows:
| | | | | | | | | | | | | | | | | |
| | YEAR ENDED DECEMBER 31, |
| 2021 | | 2020 | | 2019 |
| Fair value of earned PUs that vested | $ | 29,701 | | | $ | 11,812 | | | $ | 6,503 | |
A summary of PU activity for the year ended December 31, 2021 is as follows:
| | | | | | | | | | | | | | | | | | | | | | | |
| | ORIGINAL
PU AWARDS | | PU ADJUSTMENT(1) | | TOTAL PU
AWARDS | | WEIGHTED-AVERAGE
GRANT-DATE
FAIR VALUE |
| Non-vested at December 31, 2020 | 1,073,209 | | | (319,508) | | | 753,701 | | | $ | 36.98 | |
| Granted | 488,953 | | | — | | | 488,953 | | | 54.61 | |
| Vested | (630,151) | | | — | | | (630,151) | | | 47.13 | |
| Forfeited/Performance or Market Conditions Not Achieved | (58,776) | | | (221,936) | | | (280,712) | | | 35.84 | |
| Non-vested at December 31, 2021 | 873,235 | | | (541,444) | | | 331,791 | | | $ | 44.65 | |
(1)Represents an increase or decrease in the number of original PUs awarded based on either the final performance criteria or market condition achievement at the end of the performance period of such PUs or a change in estimated awards based on the forecasted performance against the predefined targets.
| | | | | | | | |
| IRON MOUNTAIN 2021 FORM 10-K | 72 |
Part IV
IRON MOUNTAIN INCORPORATED
NOTES TO CONSOLIDATED FINANCIAL STATEMENTS (CONTINUED)
DECEMBER 31, 2021
(In thousands, except share and per share data)
2. SUMMARY OF SIGNIFICANT ACCOUNTING POLICIES (CONTINUED)
EMPLOYEE STOCK PURCHASE PLAN
We offer an ESPP in which participation is available to substantially all United States and Canadian employees who meet certain service eligibility requirements. The ESPP provides for the purchase of our common stock by eligible employees through successive offering periods. We have historically had two six-month offering periods per year, the first of which generally runs from June 1 through November 30 and the second of which generally runs from December 1 through May 31. During each offering period, participating employees accumulate after-tax payroll contributions, up to a maximum of 15% of their compensation, to pay the purchase price at the end of the offering. Participating employees may withdraw from an offering before the purchase date and obtain a refund of the amounts withheld as payroll deductions. At the end of the offering period, outstanding options under the ESPP are exercised, and each employee’s accumulated contributions are used to purchase our common stock. The price for shares purchased under the ESPP is 95% of the fair market price at the end of the offering period, without a look-back feature. As a result, we do not recognize compensation expense for the ESPP shares purchased. In May 2021, our stockholders approved an amendment to the ESPP to increase the number of shares of Common Stock authorized for issuance thereunder by 1,000,000 from 1,000,000 to 2,000,000. For the years ended December 31, 2021, 2020 and 2019, there were 112,297, 159,853 and 129,505 shares, respectively, purchased under the ESPP. As of December 31, 2021, we have 1,103,990 shares available under the ESPP.
________________________________________________________
As of December 31, 2021, unrecognized compensation cost related to the unvested portion of our Employee Stock-Based Awards was $42,559 and is expected to be recognized over a weighted-average period of 1.9 years.
We issue shares of our common stock for the exercises of stock options, and the vesting of RSUs, PUs and shares of our common stock under our ESPP from unissued reserved shares.
T. ACQUISITION AND INTEGRATION COSTS
Acquisition and integration costs represent operating expenditures directly associated with the closing and integration activities of our business acquisitions that have closed, or are highly probable of closing, and include (i) advisory, legal and professional fees to complete business acquisitions and (ii) costs to integrate acquired businesses into our existing operations, including move, severance, facility upgrade and system integration costs (collectively, "Acquisition and Integration Costs"). Acquisition and Integration Costs do not include costs associated with the formation of joint ventures or costs associated with the acquisition of customer relationships. Acquisition and integration costs for the year ended December 31, 2021, 2020 and 2019 were $12,764, $0 and $13,293, respectively.
U. OTHER (INCOME) EXPENSE, NET
Consolidated other (income) expense, net for the years ended December 31, 2021, 2020 and 2019 consists of the following:
| | | | | | | | | | | | | | | | | |
| | YEAR ENDED DECEMBER 31, |
| | 2021 | | 2020 | | 2019 |
Foreign currency transaction (gains) losses, net(1) | $ | (15,753) | | | $ | 29,830 | | | $ | 24,852 | |
| Debt extinguishment expense | — | | | 68,300 | | | — | |
Other, net(2) | (177,051) | | | 45,415 | | | 9,046 | |
| Other (Income) Expense, Net | $ | (192,804) | | | $ | 143,545 | | | $ | 33,898 | |
(1)The gain or loss on foreign currency transactions, calculated as the difference between the historical exchange rate and the exchange rate at the applicable measurement date, includes gains or losses primarily related to (i) borrowings in certain foreign currencies under our Revolving Credit Facility (as defined in Note 7), (ii) our previously outstanding 3% Euro Senior Notes due 2025 ("Euro Notes"), (iii) certain foreign currency denominated intercompany obligations of our foreign subsidiaries to us and between our foreign subsidiaries, which are not considered permanently invested and (iv) amounts that are paid or received on the net settlement amount from forward contracts (as more fully discussed in Note 6).
(2)Other, net for the year ended December 31, 2021 consists primarily of (a) a gain of approximately $179,000 associated with our IPM Divestment and (b) a gain of approximately $20,300 associated with the loss of control and related deconsolidation, as of May 18, 2021, of one of our wholly owned Netherlands subsidiaries, for which we had value-added tax liability exposure that was recorded in 2019, partially offset by (c) losses on our equity method investments. Other, net for the year ended December 31, 2020 consists primarily of (a) changes in the estimated value of our mandatorily redeemable noncontrolling interests and (b) losses on our equity method investments.
| | | | | | | | |
73 | IRON MOUNTAIN 2021 FORM 10-K | |
Part IV
IRON MOUNTAIN INCORPORATED
NOTES TO CONSOLIDATED FINANCIAL STATEMENTS (CONTINUED)
DECEMBER 31, 2021
(In thousands, except share and per share data)
2. SUMMARY OF SIGNIFICANT ACCOUNTING POLICIES (CONTINUED)
V. INCOME TAXES
Accounting for income taxes requires the recognition of deferred tax assets and liabilities for the expected future tax consequences of temporary differences between the tax and financial reporting bases of assets and liabilities and for loss and credit carryforwards. Valuation allowances are provided when recovery of deferred tax assets does not meet the more likely than not standard as defined in GAAP. We have elected to recognize interest and penalties associated with uncertain tax positions as a component of the Provision (benefit) for income taxes in the accompanying Consolidated Statements of Operations.
W. INCOME (LOSS) PER SHARE—BASIC AND DILUTED
Basic income (loss) per common share is calculated by dividing income (loss) by the weighted average number of common shares outstanding. The calculation of diluted income (loss) per share is consistent with that of basic income (loss) per share but gives effect to all potential common shares (that is, securities such as stock options, RSUs, PUs, warrants or convertible securities) that were outstanding during the period, unless the effect is antidilutive.
The calculation of basic and diluted income (loss) per share for the years ended December 31, 2021, 2020 and 2019 is as follows:
| | | | | | | | | | | | | | | | | |
| | YEAR ENDED DECEMBER 31, |
| | 2021 | | 2020 | | 2019 |
| Income (loss) from continuing operations | $ | 452,725 | | | $ | 343,096 | | | $ | 268,211 | |
| Less: Net income (loss) attributable to noncontrolling interests | 2,506 | | | 403 | | | 938 | |
| | | | | |
| Income (loss) from continuing operations (utilized in numerator of Earnings Per Share calculation) | 450,219 | | | 342,693 | | | 267,273 | |
| Income (loss) from discontinued operations, net of tax | — | | | — | | | 104 | |
| Net income (loss) attributable to Iron Mountain Incorporated | $ | 450,219 | | | $ | 342,693 | | | $ | 267,377 | |
| Weighted-average shares—basic | 289,457,000 | | | 288,183,000 | | | 286,971,000 | |
| Effect of dilutive potential stock options | 645,886 | | | 24,903 | | | 145,509 | |
| Effect of dilutive potential RSUs and PUs | 872,204 | | | 435,287 | | | 570,435 | |
| | | | | |
| Weighted-average shares—diluted | 290,975,090 | | | 288,643,190 | | | 287,686,944 | |
| Earnings (losses) per share—basic: | | | | | |
| Income (loss) from continuing operations | $ | 1.56 | | | $ | 1.19 | | | $ | 0.93 | |
| (Loss) income from discontinued operations, net of tax | — | | | — | | | — | |
Net income (loss) attributable to Iron Mountain Incorporated(1) | $ | 1.56 | | | $ | 1.19 | | | $ | 0.93 | |
| Earnings (losses) per share—diluted: | | | | | |
| Income (loss) from continuing operations | $ | 1.55 | | | $ | 1.19 | | | $ | 0.93 | |
| (Loss) income from discontinued operations, net of tax | — | | | — | | | — | |
Net income (loss) attributable to Iron Mountain Incorporated(1) | $ | 1.55 | | | $ | 1.19 | | | $ | 0.93 | |
| Antidilutive stock options, RSUs and PUs, excluded from the calculation | 1,447,722 | | | 5,663,981 | | | 4,475,745 | |
(1)Columns may not foot due to rounding.
| | | | | | | | |
| IRON MOUNTAIN 2021 FORM 10-K | 74 |
Part IV
IRON MOUNTAIN INCORPORATED
NOTES TO CONSOLIDATED FINANCIAL STATEMENTS (CONTINUED)
DECEMBER 31, 2021
(In thousands, except share and per share data)
2. SUMMARY OF SIGNIFICANT ACCOUNTING POLICIES (CONTINUED)
X. NEW ACCOUNTING PRONOUNCEMENTS
RECENTLY ADOPTED ACCOUNTING PRONOUNCEMENTS
In December 2019, the Financial Accounting Standards Board (the "FASB") issued ASU No. 2019-12, Income Taxes (Topic 740) (“ASU 2019-12”). ASU 2019-12 simplifies the accounting for income taxes by removing certain exceptions for recognizing deferred taxes for investments, performing intra-period allocation and calculating income taxes in interim periods. ASU 2019-12 also adds guidance to reduce complexity in certain areas, including recognizing deferred taxes for tax goodwill and allocating taxes to members of a consolidated group. We adopted ASU 2019-12 on January 1, 2021. ASU 2019-12 did not have a material impact on our consolidated financial statements.
OTHER AS YET ADOPTED ACCOUNTING PRONOUNCEMENTS
In December 2021, the FASB issued ASU No. 2021-08, Business Combinations (Topic 805), Accounting for Contract Assets and Contract Liabilities from Contracts with Customers (“ASU 2021-08”). ASU 2021-08 requires that an entity recognize and measure contract assets and contract liabilities acquired in a business combination in accordance with ASU 2014-09 and for the related revenue contracts in accordance with ASU 2014-09 as if it had originated the contracts. ASU 2021-08 will be effective for us on January 1, 2023, with early adoption permitted. We are currently evaluating the impact ASU 2021-08 will have on our consolidated financial statements.
In March 2020, the FASB issued ASU No. 2020-04, Reference Rate Reform (Topic 848) (“ASU 2020-04”). ASU 2020-04 provides optional expedients and exceptions for applying U.S.GAAP to contracts, hedging relationships, and other transactions, for a limited period of time, to ease the potential burden of recognizing the effects of reference rate reform on financial reporting. The amendments in ASU 2020-04 apply to contracts, hedging relationships and other transactions that reference the London Inter-Bank Offered Rate (“LIBOR”) or another reference rate expected to be discontinued due to the global transition away from LIBOR and certain other interbank offered rates. An entity may elect to apply the amendments provided by ASU 2020-04 beginning March 12, 2020 through December 31, 2022. We are currently evaluating these amendments as they relate to our contracts, hedging relationships and other transactions that reference LIBOR, as well as the impact of ASU 2020-04 on our consolidated financial statements but do not expect the impact to be material.
3. ACQUISITIONS
We account for acquisitions using the acquisition method of accounting, and, accordingly, the assets and liabilities acquired are recorded at their estimated fair values and the results of operations for each acquisition have been included in our consolidated results from their respective acquisition dates.
A. ACQUISITIONS COMPLETED DURING THE YEAR ENDED DECEMBER 31, 2021
On September 15, 2021, in order to further expand our records management operations in the Middle East and North Africa, we acquired Information Fort, LLC, a records and information management provider, for approximately $90,300.
On September 23, 2021, in order to further enhance our data center operations in Germany, we completed the acquisition of assets of a Frankfurt data center for approximately 77,900 Euros (or approximately $91,300, based upon the exchange rate between the Euro and the United States dollar on the closing date of this acquisition).
In addition to the transactions noted above, during the year ended December 31, 2021, in order to enhance our existing operations in the United Kingdom and Indonesia and to expand our operations into Morocco, we completed the acquisition of two records management companies and one art storage company for total cash consideration of approximately $45,100.
| | | | | | | | |
75 | IRON MOUNTAIN 2021 FORM 10-K | |
Part IV
IRON MOUNTAIN INCORPORATED
NOTES TO CONSOLIDATED FINANCIAL STATEMENTS (CONTINUED)
DECEMBER 31, 2021
(In thousands, except share and per share data)
3. ACQUISITIONS (CONTINUED)
B. ACQUISITIONS COMPLETED DURING THE YEAR ENDED DECEMBER 31, 2020
Prior to January 9, 2020, we owned a 25% equity interest in OSG Records Management (Europe) Limited ("OSG"). On January 9, 2020, we acquired the remaining 75% equity interest in OSG for cash consideration of approximately $95,500 (the "OSG Acquisition"). The OSG Acquisition enabled us to extend our Global RIM Business in Russia, Ukraine, Kazakhstan, Belarus, and Armenia. The results of OSG are fully consolidated within our consolidated financial statements from the closing date of the OSG Acquisition. In connection with the OSG Acquisition, our previously held 25% equity investment in OSG was remeasured to fair value at the closing date of the OSG Acquisition; as a result, we recorded a gain of approximately $10,000 during the first quarter of 2020, which is included as a component of Other (income) expense, net on our Consolidated Statements of Operations. The fair value of the 25% equity investment in OSG was determined based on the purchase price of the OSG Acquisition.
On February 17, 2020, in order to enhance our existing operations in the United Arab Emirates, we acquired Glenbeigh Records Management DWC-LLC, a storage and records management company, for total cash consideration of approximately $29,100.
C. ACQUISITIONS COMPLETED DURING THE YEAR ENDED DECEMBER 31, 2019
During the year ended December 31, 2019, in order to enhance our existing operations in the United States, Colombia, Germany, Hong Kong, Latvia, Slovakia, Switzerland, Thailand and the United Kingdom and to expand our operations into Bulgaria, we completed the acquisition of 10 storage and records management companies and one art storage company for total cash consideration of approximately $51,000. The individual purchase prices of these acquisitions ranged from approximately $700 to $12,500.
| | | | | | | | |
| IRON MOUNTAIN 2021 FORM 10-K | 76 |
Part IV
IRON MOUNTAIN INCORPORATED
NOTES TO CONSOLIDATED FINANCIAL STATEMENTS (CONTINUED)
DECEMBER 31, 2021
(In thousands, except share and per share data)
3. ACQUISITIONS (CONTINUED)
D. PURCHASE PRICE ALLOCATION
A summary of the cumulative consideration paid and the allocation of the purchase price paid for all of our acquisitions (including asset acquisitions) in each respective year is as follows:
| | | | | | | | | | | | | | | | | | |
| 2021 | | 2020 | | 2019 | |
Cash Paid (gross of cash acquired)(1) | $ | 224,192 | | | $ | 124,614 | | | $ | 53,230 | | |
Fair Value of Noncontrolling Interests | 3,878 | | | — | | | — | | |
Purchase Price Holdbacks and Other | 2,534 | | | — | | | 4,135 | | |
| Fair Value of Investments Applied to Acquisitions | — | | | 27,276 | | | — | | |
| Total Consideration | 230,604 | | | 151,890 | | | 57,365 | | |
| Fair Value of Identifiable Assets Acquired: | | | | | | |
| Cash | 20,194 | | | 6,545 | | | 2,260 | | |
Accounts Receivable, Prepaid Expenses and Other Assets | 26,911 | | | 16,559 | | | 3,102 | | |
| Property, Plant and Equipment | 150,095 | | | 52,021 | | | 5,396 | | |
Customer Relationship Intangible Assets(2) | 35,181 | | | 79,065 | | | 22,071 | | |
| Operating Lease Right-of-Use Assets | 40,848 | | | 100,040 | | | 16,956 | | |
Data Center In-Place Leases(3) | 4,994 | | | — | | | — | | |
Data Center Tenant Relationships(4) | 4,682 | | | — | | | — | | |
| | | | | | |
| Debt Assumed | (9,026) | | | (27,363) | | | — | | |
| Accounts Payable, Accrued Expenses and Other Liabilities | (22,733) | | | (19,564) | | | (3,233) | | |
| Operating Lease Liabilities | (40,848) | | | (100,040) | | | (16,956) | | |
| Deferred Income Taxes | (7,221) | | | (9,631) | | | (1,813) | | |
Data Center Below-Market Leases(5) | (20) | | | — | | | — | | |
| Total Fair Value of Identifiable Net Assets Acquired | 203,057 | | | 97,632 | | | 27,783 | | |
Goodwill Initially Recorded | $ | 27,547 | | | $ | 54,258 | | | $ | 29,582 | | |
(1)Cash paid for acquisitions, net of cash acquired in our Consolidated Statement of Cash Flows includes contingent and other payments of $0, $512 and $7,267 for the years ended December 31, 2021, 2020 and 2019, respectively, related to acquisitions made in the years prior to 2021, 2020 and 2019, respectively.
(2)The weighted average lives of Customer Relationship Intangible Assets associated with acquisitions in 2021, 2020 and 2019 was 11 years, 14 years and 16 years, respectively.
(3)The weighted average lives of Data Center In-Place Leases associated with acquisitions in 2021 was five years.
(4)The weighted average lives of Data Center Tenant Relationships associated with acquisitions in 2021 was five years.
(5)The weighted average lives of Data Center Below-Market Leases associated with acquisitions in 2021 was four years.
Allocations of the purchase price for acquisitions are based on estimates of the fair value of the net assets acquired and are subject to adjustment upon the finalization of the purchase price allocations. The accounting for business combinations requires estimates and judgments regarding expectations for future cash flows of the acquired business, and the allocations of those cash flows to identifiable tangible and intangible assets, in determining the assets acquired and liabilities assumed. The fair values assigned to tangible and intangible assets acquired and liabilities assumed, including contingent consideration, are based on management’s best estimates and assumptions, as well as other information compiled by management, including valuations that utilize customary valuation procedures and techniques. The estimates and assumptions underlying the initial valuations are subject to the collection of information necessary to complete the valuations within the measurement periods, which are up to one year from the respective acquisition dates. The preliminary purchase price allocations that are not finalized as of December 31, 2021 relate to the final assessment of the fair values of intangible assets (primarily customer relationship intangible assets) and property, plant and equipment associated with the acquisitions we closed in 2021.
| | | | | | | | |
77 | IRON MOUNTAIN 2021 FORM 10-K | |
Part IV
IRON MOUNTAIN INCORPORATED
NOTES TO CONSOLIDATED FINANCIAL STATEMENTS (CONTINUED)
DECEMBER 31, 2021
(In thousands, except share and per share data)
3. ACQUISITIONS (CONTINUED)
As the valuation of certain assets and liabilities for purposes of purchase price allocations are preliminary in nature, they are subject to adjustment as additional information is obtained about the facts and circumstances regarding these assets and liabilities that existed at the acquisition date. Any adjustments to our estimates of purchase price allocation will be made in the periods in which the adjustments are determined and the cumulative effect of such adjustments will be calculated as if the adjustments had been completed as of the acquisition dates. Adjustments recorded during the fourth quarter of 2021 and year ended December 31, 2021 were not material to our balance sheet or results from operations.
4. DIVESTMENTS
INTELLECTUAL PROPERTY MANAGEMENT BUSINESS
On June 7, 2021, we sold our Intellectual Property Management ("IPM") business, also known as our technology escrow services business, which we predominantly operated in the United States, for total gross consideration of approximately $215,400 (the “IPM Divestment”). As a result of the IPM Divestment, we recorded a gain on sale of approximately $179,000 to Other (income) expense, net, during the year ended December 31, 2021, the substantial majority of which was recorded during the second quarter of 2021, representing the excess of the fair value of the consideration received over the sum of the carrying value of the IPM business.
We have concluded that the IPM Divestment does not meet the criteria to be reported as discontinued operations in our consolidated financial statements, as our decision to divest this business does not represent a strategic shift that will have a major effect on our operations and financial results. Accordingly, the revenues and expenses associated with this business are presented as a component of operating income (loss) in our Consolidated Statements of Operations for the year ended December 31, 2021 through the closing date of the IPM Divestment and for the years ended December 31, 2020 and 2019 and the cash flows associated with this business is presented as a component of cash flows from operations in our Consolidated Statements of Cash Flows for the year ended December 31, 2021 through the closing date of the IPM Divestment and for the years ended December 31, 2020 and 2019.
IRON MOUNTAIN CONSUMER STORAGE
In March 2019, we contributed our customer contracts and certain intellectual property and other assets used by us to operate our consumer storage business in the United States and Canada (the “IM Consumer Storage Assets”) and approximately $20,000 in cash (gross of certain transaction expenses) (the “Cash Contribution”) to a strategic partnership (the “MakeSpace JV”) established by us and MakeSpace Labs, Inc. (“MakeSpace”) pursuant to a transaction which closed on March 19, 2019 (the "Consumer Storage Transaction"). Upon the closing of the Consumer Storage Transaction, the MakeSpace JV owned (i) the IM Consumer Storage Assets, (ii) the Cash Contribution and (iii) the customer contracts, intellectual property and certain other assets used by MakeSpace to operate its consumer storage business in the United States. As part of the Consumer Storage Transaction, we received an initial equity interest of approximately 34% in the MakeSpace JV (the "MakeSpace Investment"). In connection with the Consumer Storage Transaction and the investment in the MakeSpace JV, we also entered into a storage and service agreement with the MakeSpace JV to provide certain storage and related services to the MakeSpace JV (see Note 12).
We have concluded that the divestment of the IM Consumer Storage Assets in the Consumer Storage Transaction does not meet the criteria to be reported as discontinued operations in our consolidated financial statements, as our decision to divest this business does not represent a strategic shift that will have a major effect on our operations and financial results. Accordingly, the revenues and expenses associated with this business are presented as a component of Income (loss) from continuing operations in our Consolidated Statements of Operations for the year ended December 31, 2019 through the closing date of the Consumer Storage Transaction and the cash flows associated with this business are presented as a component of cash flows from continuing operations in our Consolidated Statements of Cash Flows for the year ended December 31, 2019 through the closing date of the Consumer Storage Transaction.
As a result of the Consumer Storage Transaction, we recorded a gain on sale of approximately $4,200 to Other (income) expense, net, in the first quarter of 2019, representing the excess of the fair value of the consideration received over the sum of (i) the carrying value of our consumer storage operations and (ii) the Cash Contribution.
| | | | | | | | |
| IRON MOUNTAIN 2021 FORM 10-K | 78 |
Part IV
IRON MOUNTAIN INCORPORATED
NOTES TO CONSOLIDATED FINANCIAL STATEMENTS (CONTINUED)
DECEMBER 31, 2021
(In thousands, except share and per share data)
5. INVESTMENTS
WEB WERKS JOINT VENTURE
In April 2021, we closed on an agreement to form a joint venture (the "Web Werks JV") with the shareholders of Web Werks India Private Limited ("Web Werks"), a colocation data center provider in India. In connection with the formation of the Web Werks JV, we made an initial investment of approximately 3,750,000 Indian rupees (or approximately $50,100, based upon the exchange rate between the United States dollar and Indian rupee as of the closing date of the initial investment) in exchange for a noncontrolling interest in the form of convertible preference shares in the Web Werks JV (the “Initial Web Werks JV Investment”). These shares are convertible into a to-be-determined amount of common shares based upon the achievement of EBITDA targets for the Web Werks JV's fiscal year ending March 31, 2022.
Under the terms of the Web Werks JV shareholder agreement, we are required to make additional investments over a period ending May 2023 totaling approximately 7,500,000 Indian rupees (or approximately $100,000, based upon the exchange rate as of December 31, 2021 between the United States dollar and Indian rupee).
FRANKFURT JOINT VENTURE
In October 2020, we formed a joint venture (the “Frankfurt JV”) with AGC Equity Partners (“AGC”) to design and develop a 280,000 square foot, 27 megawatt, hyperscale data center currently under development in Frankfurt, Germany (the “Frankfurt JV Transaction”). AGC acquired an 80% equity interest in the Frankfurt JV, while we retained a 20% equity interest (the "Frankfurt JV Investment"). The total cash consideration for the 80% equity interest sold to AGC was approximately $105,000. We received approximately $93,300 (gross of certain transaction expenses) upon the closing of the Frankfurt JV, and we are entitled to receive an additional approximately $11,700 upon the completion of development of the data center, which we expect to occur in the third quarter of 2022. In connection with the Frankfurt JV Transaction, we also entered into agreements whereby we will earn various fees, including property management and construction and development fees, for services we are providing to the Frankfurt JV.
As a result of the Frankfurt JV Transaction, we recognized a gain during the year ended December 31, 2020 of approximately $24,100, representing the excess of the fair value of the consideration received over the carrying value of the assets, which consisted primarily of land and land development assets which were previously included within our Global Data Center Business segment.
MAKESPACE JOINT VENTURE
In March 2019, we formed the MakeSpace JV. In the second quarter of 2020, we committed to participate in a round of equity funding for the MakeSpace JV whereby we contributed approximately $36,000 of the $45,000 being raised in installments between May 2020 through October 2021.
JOINT VENTURE SUMMARY
The joint ventures, referred to above, are accounted for as equity method investments and are presented as a component of Other within Other assets, net in our Consolidated Balance Sheets. The carrying values and equity interests in our joint ventures at December 31, 2021 and 2020 are as follows:
| | | | | | | | | | | | | | | | | | | | | | | | | | |
| | DECEMBER 31, 2021 | | DECEMBER 31, 2020 |
| | CARRYING VALUE | | EQUITY INTEREST | | CARRYING VALUE | | EQUITY INTEREST |
Web Werks JV | | $ | 51,140 | | | 38.50 | % | | $ | — | | | — | % |
Frankfurt JV | | 26,167 | | | 20.00 | % | | 26,500 | | | 20.00 | % |
MakeSpace JV | | 30,154 | | | 49.99 | % | | 16,924 | | | 38.86 | % |
| | | | | | | | |
79 | IRON MOUNTAIN 2021 FORM 10-K | |
Part IV
IRON MOUNTAIN INCORPORATED
NOTES TO CONSOLIDATED FINANCIAL STATEMENTS (CONTINUED)
DECEMBER 31, 2021
(In thousands, except share and per share data)
6. DERIVATIVE INSTRUMENTS AND HEDGING ACTIVITIES (CONTINUED)
Derivative instruments we are party to include: (i) interest rate swap agreements (which are designated as cash flow hedges), (ii) cross-currency swap agreements (which are designated as net investment hedges) and (iii) foreign exchange currency forward contracts (which are not designated as hedges).
INTEREST RATE SWAP AGREEMENTS DESIGNATED AS CASH FLOW HEDGES
In March 2018, we entered into interest rate swap agreements to limit our exposure to changes in interest rates on a portion of our floating rate indebtedness. As of December 31, 2021 and 2020, we had $350,000 in notional value of interest rate swap agreements outstanding, which expire in March 2022. Under the interest rate swap agreements, we receive variable rate interest payments associated with the notional amount of each interest rate swap, based upon one-month LIBOR, in exchange for the payment of fixed interest rates as specified in the interest rate swap agreements.
In July 2019, we entered into forward-starting interest rate swap agreements to limit our exposure to changes in interest rates on a portion of our floating rate indebtedness once our current interest rate swap agreements expire in March 2022. The forward-starting interest rate swap agreements have $350,000 in notional value, commence in March 2022 and expire in March 2024. Under the swap agreements, we will receive variable rate interest payments based upon one-month LIBOR, in exchange for the payment of fixed interest rates as specified in the interest rate swap agreements.
We have designated these interest rate swap agreements, including the forward-starting interest rate swap agreements, as cash flow hedges. Unrealized gains are recognized as assets, while unrealized losses are recognized as liabilities.
CROSS-CURRENCY SWAP AGREEMENTS DESIGNATED AS A HEDGE OF NET INVESTMENT
In August 2019, we entered into cross-currency swap agreements to hedge the variability of exchange rate impacts between the United States dollar and the Euro. Under the terms of the cross-currency swap agreements we notionally exchanged approximately $110,000 at an interest rate of 6.0% for approximately 99,055 Euros at a weighted average interest rate of approximately 3.65%. These cross-currency swap agreements expire in August 2023 (“August 2023 Cross Currency Swap Agreements”).
In September 2020, we entered into cross-currency swap agreements to hedge the variability of exchange rates impacts between the United States dollar and the Euro. Under the terms of the cross-currency swap agreements, we notionally exchanged approximately $359,200 at an interest rate of 4.5% for approximately 300,000 Euros at a weighted average interest rate of approximately 3.4%. These cross-currency swap agreements expire in February 2026 (“February 2026 Cross Currency Swap Agreements”).
We have designated these cross-currency swap agreements as hedge of net investments against certain of our Euro denominated subsidiaries and they require an exchange of the notional amounts at maturity. These cross-currency swap agreements are marked to market at each reporting period, representing the fair values of the cross-currency swap agreements, and any changes in fair value are recognized as a component of Accumulated other comprehensive items, net. Unrealized gains are recognized as assets while unrealized losses are recognized as liabilities.
FOREIGN EXCHANGE CURRENCY FORWARD CONTRACTS NOT DESIGNATED AS HEDGING INSTRUMENTS
On occasion, we enter into forward contracts to hedge our exposures associated with certain foreign currencies. We have not designated any of these forward contracts as hedges. Our policy is to record the fair value of each derivative instrument on a gross basis. As of December 31, 2021 and 2020, we had no outstanding forward contracts.
| | | | | | | | |
| IRON MOUNTAIN 2021 FORM 10-K | 80 |
Part IV
IRON MOUNTAIN INCORPORATED
NOTES TO CONSOLIDATED FINANCIAL STATEMENTS (CONTINUED)
DECEMBER 31, 2021
(In thousands, except share and per share data)
6. DERIVATIVE INSTRUMENTS AND HEDGING ACTIVITIES
(Liabilities) assets recognized in our Consolidated Balance Sheets as of December 31, 2021 and 2020 by derivative instrument are as follows:
| | | | | | | | | | | | | | |
DERIVATIVE INSTRUMENT(1) | | DECEMBER 31, 2021 | | DECEMBER 31, 2020 |
Cash Flow Hedges(2) | | | | |
| Interest Rate Swap Agreements | | $ | (7,680) | | | $ | (21,062) | |
Net Investment Hedges(3) | | | | |
| August 2023 Cross Currency Swap Agreements | | (664) | | | (8,229) | |
| February 2026 Cross Currency Swap Agreements | | 11,021 | | | (20,412) | |
(1)Our derivative assets are included as a component of Other within Other assets, net and our derivative liabilities are included as a component of (i) Accrued expenses and other current liabilities or (ii) Other long-term liabilities in our Consolidated Balance Sheets. As of December 31, 2021, $11,021 is included within Other assets, $2,082 is included within Accrued expense and other current liabilities and $6,262 is included within Other long-term liabilities. As of December 31, 2020, $49,703 is included within Other long-term liabilities.
(2)As of December 31, 2021, cumulative net losses of $7,680 are recorded within Accumulated other comprehensive items, net associated with these interest rate swap agreements.
(3)As of December 31, 2021, cumulative net gains of $10,357 are recorded within Accumulated other comprehensive items, net associated with these cross currency swap agreements.
Gains (losses) recognized during the years ending December 31, 2021, 2020 and 2019, by derivative instrument, are as follows:
| | | | | | | | | | | | | | | | | | | | |
| | YEAR ENDED DECEMBER 31, |
| DERIVATIVE INSTRUMENT | | 2021 | | 2020 | | 2019 |
Derivative Instruments Designated as Hedging Instruments(1) | | | | | | |
| Cash Flow Hedges | | | | | | |
| Interest Rate Swap Agreements | | $ | 13,382 | | | $ | (12,288) | | | $ | (7,801) | |
| Net Investment Hedges | | | | | | |
| August 2023 Cross Currency Swap Agreements | | 7,565 | | | (7,247) | | | (982) | |
| February 2026 Cross Currency Swap Agreements | | 31,433 | | | (20,412) | | | — | |
Derivative Instruments Not Designated as Hedging Instruments(2) | | | | | | |
| Foreign Exchange Currency Forward Contracts | | — | | | — | | | (737) | |
(1)These amounts are recognized as unrealized gains (losses), a component of Accumulated other comprehensive items, net.
(2)These amounts are recognized as foreign exchange gains (losses), a component of Other (income) expense, net. Net cash receipts (payments) included in cash from operating activities related to settlements associated with foreign currency forward contracts for the years ended December 31, 2021, 2020 and 2019 are $0, $0 and $(737), respectively.
EURO NOTES DESIGNATED AS A HEDGE OF NET INVESTMENT
Prior to their redemption in August 2020, we designated a portion of our Euro Notes as a hedge of net investment of certain of our Euro denominated subsidiaries. From January 1, 2020 through the date of redemption and for the year ended December 31, 2019 we designated, on average, 300,000 and 284,986 Euros, respectively, of our Euro Notes as a hedge of net investment of certain of our Euro denominated subsidiaries. As a result, we recorded the following foreign exchange gains (losses) related to the change in fair value of such debt due to currency translation adjustments as a component of Accumulated other comprehensive items, net:
| | | | | | | | | | | | | | | | | |
| | YEAR ENDED DECEMBER 31, |
| | 2021 | | 2020 | | 2019 |
| Foreign exchange gains (losses) associated with net investment hedge | $ | — | | | $ | (17,005) | | | $ | (6,003) | |
| | | | | |
| | | | | |
As of December 31, 2021, cumulative net gains of $3,256, net of tax, are recorded in Accumulated other comprehensive items, net associated with this net investment hedge.
| | | | | | | | |
81 | IRON MOUNTAIN 2021 FORM 10-K | |
Part IV
IRON MOUNTAIN INCORPORATED
NOTES TO CONSOLIDATED FINANCIAL STATEMENTS (CONTINUED)
DECEMBER 31, 2021
(In thousands, except share and per share data)
7. DEBT
Long-term debt is as follows:
| | | | | | | | | | | | | | | | | | | | | | | | | | | | | | | | | | | | | | | | | | | | | | | | | | | | | |
| | | DECEMBER 31, 2021 | | | DECEMBER 31, 2020 |
| | | DEBT (INCLUSIVE OF DISCOUNT) | | UNAMORTIZED DEFERRED FINANCING COSTS | | CARRYING AMOUNT | | FAIR
VALUE | | | DEBT (INCLUSIVE OF DISCOUNT) | | UNAMORTIZED DEFERRED FINANCING COSTS | | CARRYING AMOUNT | | FAIR
VALUE |
Revolving Credit Facility(1) | | $ | — | | | $ | (5,174) | | | $ | (5,174) | | | $ | — | | | | $ | — | | | $ | (8,620) | | | $ | (8,620) | | | $ | — | |
Term Loan A(1) | | 203,125 | | | — | | | 203,125 | | | 203,125 | | | | 215,625 | | | — | | | 215,625 | | | 215,625 | |
Term Loan B(1)(2) | | 672,847 | | | (4,995) | | | 667,852 | | | 675,500 | | | | 679,621 | | | (6,244) | | | 673,377 | | | 680,750 | |
Australian Dollar Term Loan (the “AUD Term Loan”)(3)(4) | | 223,182 | | | (656) | | | 222,526 | | | 223,530 | | | | 243,152 | | | (1,624) | | | 241,528 | | | 244,014 | |
UK Bilateral Revolving Credit Facility(4) | | 189,168 | | | (709) | | | 188,459 | | | 189,168 | | | | 191,101 | | | (1,307) | | | 189,794 | | | 191,101 | |
| | | | | | | | | | | | | | | | | |
| | | | | | | | | | | | | | | | | |
| | | | | | | | | | | | | | | | | |
| | | | | | | | | | | | | | | | | |
| | | | | | | | | | | | | | | | | |
37/8% GBP Senior Notes due 2025 (the “GBP Notes “)(5)(7)(8) | | 540,481 | | | (3,912) | | | 536,569 | | | 542,508 | | | | 546,003 | | | (4,983) | | | 541,020 | | | 553,101 | |
| | | | | | | | | | | | | | | | | |
47/8% Senior Notes due 2027 (the “47/8% Notes due 2027”)(5)(6)(7) | | 1,000,000 | | | (8,176) | | | 991,824 | | | 1,030,000 | | | | 1,000,000 | | | (9,598) | | | 990,402 | | | 1,046,250 | |
51/4% Senior Notes due 2028 (the “51/4% Notes due 2028”)(5)(6)(7) | | 825,000 | | | (7,380) | | | 817,620 | | | 862,125 | | | | 825,000 | | | (8,561) | | | 816,439 | | | 868,313 | |
5% Senior Notes due 2028 (the “5% Notes due 2028”)(5)(6)(7) | | 500,000 | | | (4,763) | | | 495,237 | | | 513,750 | | | | 500,000 | | | (5,486) | | | 494,514 | | | 523,125 | |
47/8% Senior Notes due 2029 (the “47/8% Notes due 2029”)(5)(6)(7) | | 1,000,000 | | | (11,211) | | | 988,789 | | | 1,022,500 | | | | 1,000,000 | | | (12,658) | | | 987,342 | | | 1,050,000 | |
51/4% Senior Notes due 2030 (the “51/4% Notes due 2030”)(5)(6)(7) | | 1,300,000 | | | (12,911) | | | 1,287,089 | | | 1,355,250 | | | | 1,300,000 | | | (14,416) | | | 1,285,584 | | | 1,400,750 | |
41/2% Senior Notes due 2031 (the “41/2% Notes”)(5)(6)(7) | | 1,100,000 | | | (11,404) | | | 1,088,596 | | | 1,094,500 | | | | 1,100,000 | | | (12,648) | | | 1,087,352 | | | 1,138,500 | |
5% Senior Notes due 2032 (the “5% Notes due 2032”)(5)(7)(9) | | 750,000 | | | (13,782) | | | 736,218 | | | 767,813 | | | | — | | | — | | | — | | | — | |
55/8% Senior Notes due 2032 (the “55/8% Notes”)(5)(6)(7) | | 600,000 | | | (6,147) | | | 593,853 | | | 637,500 | | | | 600,000 | | | (6,727) | | | 593,273 | | | 660,000 | |
Real Estate Mortgages, Financing Lease Liabilities and Other(10) | | 460,648 | | | (840) | | | 459,808 | | | 460,648 | | | | 511,922 | | | (1,086) | | | 510,836 | | | 511,922 | |
Accounts Receivable Securitization Program(11) | | — | | | (450) | | | (450) | | | — | | | | 85,000 | | | (152) | | | 84,848 | | | 85,000 | |
| Total Long-term Debt | | 9,364,451 | | | (92,510) | | | 9,271,941 | | | | | | 8,797,424 | | | (94,110) | | | 8,703,314 | | | |
| Less Current Portion | | (310,084) | | | 656 | | | (309,428) | | | | | | (193,759) | | | — | | | (193,759) | | | |
| Long-term Debt, Net of Current Portion | | $ | 9,054,367 | | | $ | (91,854) | | | $ | 8,962,513 | | | | | | $ | 8,603,665 | | | $ | (94,110) | | | $ | 8,509,555 | | | |
(1)The capital stock or other equity interests of most of our United States subsidiaries, and up to 66% of the capital stock or other equity interests of most of our first-tier foreign subsidiaries, are pledged to secure these debt instruments, together with all intercompany obligations (including promissory notes) of subsidiaries owed to us or to one of our United States subsidiary guarantors. In addition, Iron Mountain Canada Operations ULC (“Canada Company”) has pledged 66% of the capital stock of its subsidiaries, and all intercompany obligations (including promissory notes) owed to or held by it, to secure the Canadian dollar subfacility under the Revolving Credit Facility. The fair value (Level 3 of fair value hierarchy described at Note 2.o.) of these debt instruments approximates the carrying value (as borrowings under these debt instruments are based on current variable market interest rates (plus a margin that is subject to change based on our consolidated leverage ratio)), as of December 31, 2021 and 2020.
(2)The amount of debt for the Term Loan B (as defined below) reflects an unamortized original issue discount of $903 and $1,129 as of December 31, 2021 and 2020, respectively.
(3)The amount of debt for the AUD Term Loan reflects an unamortized original issue discount of $348 and $862 as of December 31, 2021 and 2020, respectively.
(4)The fair value (Level 3 of fair value hierarchy described at Note 2.o.) of this debt instrument approximates the carrying value as borrowings under this debt instrument are based on a current variable market interest rate.
(5)The fair values (Level 1 of fair value hierarchy described at Note 2.o.) of these debt instruments are based on quoted market prices for these notes on December 31, 2021 and 2020, respectively.
| | | | | | | | |
| IRON MOUNTAIN 2021 FORM 10-K | 82 |
Part IV
IRON MOUNTAIN INCORPORATED
NOTES TO CONSOLIDATED FINANCIAL STATEMENTS (CONTINUED)
DECEMBER 31, 2021
(In thousands, except share and per share data)
7. DEBT (CONTINUED)
(6)Collectively, the “Parent Notes". IMI is the direct obligor on the Parent Notes, which are fully and unconditionally guaranteed, on a senior basis, by IMI’s direct and indirect 100% owned United States subsidiaries that represent the substantial majority of our United States operations (the “Guarantors”). These guarantees are joint and several obligations of the Guarantors. The remainder of our subsidiaries do not guarantee the Parent Notes.
(7)Collectively, the “Unregistered Notes". The Unregistered Notes have not been registered under the Securities Act of 1933, as amended (the “Securities Act”), or under the securities laws of any other jurisdiction. Unless they are registered, the Unregistered Notes may be offered only in transactions that are exempt from registration under the Securities Act or the securities laws of any other jurisdiction.
(8)Iron Mountain (UK) PLC (“IM UK”) is the direct obligor on the GBP Notes, which are fully and unconditionally guaranteed, on a senior basis, by IMI and the Guarantors. These guarantees are joint and several obligations of IMI and the Guarantors.
(9)Iron Mountain Information Management Services, Inc. (“IMIM Services”) is the direct obligor on the 5% Notes due 2032, which are fully and unconditionally guaranteed, on a senior basis, by IMI and the other Guarantors. These guarantees are joint and several obligations of IMI and such Guarantors.
(10) We believe the fair value (Level 3 of fair value hierarchy described at Note 2.o.) of this debt approximates its carrying value. This debt includes the following:
| | | | | | | | | | | |
| | DECEMBER 31, 2021 | | DECEMBER 31, 2020 |
Real estate mortgages(i) | $ | 58,933 | | | $ | 71,673 | |
Financing lease liabilities(ii) | 356,729 | | | 366,311 | |
Other notes and other obligations(iii) | 44,986 | | | 73,938 | |
| | $ | 460,648 | | | $ | 511,922 | |
(i)Bear interest at approximately 3.6% and 3.3% at December 31, 2021 and 2020, respectively, and includes $50,000 outstanding under our Mortgage Securitization Program at both December 31, 2021 and 2020.
(ii)Bear a weighted average interest rate of 5.9% at both December 31, 2021 and 2020.
(iii)These notes and other obligations, which were assumed by us as a result of certain acquisitions bear a weighted average interest rate of 10.7% at both December 31, 2021 and 2020.
(11) The Accounts Receivable Securitization Special Purpose Subsidiaries are the obligors under this program. We believe the fair value (Level 3 of fair value hierarchy described at Note 2.o.) of this debt approximates its carrying value.
A. CREDIT AGREEMENT
Our credit agreement (the "Credit Agreement") consists of a revolving credit facility (the “Revolving Credit Facility”) and a term loan (the “Term Loan A”). The Revolving Credit Facility enables IMI and certain of its United States and foreign subsidiaries to borrow in United States dollars and (subject to sublimits) a variety of other currencies (including Canadian dollars, British pounds sterling and Euros, among other currencies) in an aggregate outstanding amount not to exceed $1,750,000. Under the Credit Agreement, we have the option to request additional commitments of up to $1,260,000, in the form of term loans or through increased commitments under the Revolving Credit Facility, subject to the conditions specified in the Credit Agreement. The Credit Agreement is scheduled to mature on June 3, 2023, at which point all obligations become due. The original principal amount of the Term Loan A was $250,000 and is to be paid in quarterly installments in an amount equal to $3,125 per quarter, with the remaining balance due on June 3, 2023. IMI and the Guarantors guarantee all obligations under the Credit Agreement. The interest rate on borrowings under the Credit Agreement varies depending on our choice of interest rate and currency options, plus an applicable margin, which varies based on our consolidated leverage ratio. Additionally, the Credit Agreement requires the payment of a commitment fee on the unused portion of the Revolving Credit Facility, which fee ranges from between 0.25% to 0.4% based on our consolidated leverage ratio and fees associated with outstanding letters of credit. As of December 31, 2021, we had no outstanding borrowings under the Revolving Credit Facility and $203,125 aggregate outstanding principal amount under the Term Loan A. At December 31, 2021, we had various outstanding letters of credit totaling $3,039 under the Revolving Credit Facility. The remaining amount available for borrowing under the Revolving Credit Facility as of December 31, 2021, which is based on IMI’s leverage ratio, the last 12 months' earnings before interest, taxes, depreciation and amortization and rent expense (“EBITDAR”), other adjustments as defined in the Credit Agreement and current external debt, was $1,746,961 (which amount represents the maximum availability as of such date). Available borrowings under the Revolving Credit Facility are subject to compliance with our indenture covenants as discussed below. The average interest rate in effect under the Revolving Credit Facility and Term Loan A was 1.9% as of both December 31, 2021 and 2020.
| | | | | | | | |
83 | IRON MOUNTAIN 2021 FORM 10-K | |
Part IV
IRON MOUNTAIN INCORPORATED
NOTES TO CONSOLIDATED FINANCIAL STATEMENTS (CONTINUED)
DECEMBER 31, 2021
(In thousands, except share and per share data)
7. DEBT (CONTINUED)
IMI’s wholly owned subsidiary, Iron Mountain Information Management, LLC (“IMIM”), has an incremental term loan B with a principal amount of $700,000 (the “Term Loan B”). The Term Loan B, which matures on January 2, 2026, was issued at 99.75% of par. The Term Loan B holders benefit from the same security and guarantees as other borrowings under the Credit Agreement. The Term Loan B holders also benefit from the same affirmative and negative covenants as other borrowings under the Credit Agreement; however, the Term Loan B holders are not generally entitled to the benefits of the financial covenants under the Credit Agreement.
Principal payments on the Term Loan B are to be paid in quarterly installments of $1,750 per quarter during the period June 30, 2018 through December 31, 2025, with the balance due on January 2, 2026. The Term Loan B may be prepaid without penalty at any time. The Term Loan B bears interest at a rate of LIBOR plus 1.75%. As of December 31, 2021, we had $673,750 aggregate outstanding principal amount under the Term Loan B. The interest rate in effect under Term Loan B as of December 31, 2021 and 2020 was 3.1% and 1.9%, respectively.
| | | | | | | | | | | | | | | | | | | | |
REVOLVING CREDIT FACILITY $1,750,000 | | | TERM LOAN A $250,000 | | | TERM LOAN B $700,000 |
Outstanding borrowings $0 | | | Aggregate outstanding principal amount $203,125 | | | Aggregate outstanding principal amount $673,750 |
| | | | | | |
N/A Interest rate | | | 1.9% Interest rate | | | 3.1% Interest rate |
| As of December 31, 2021 | | | As of December 31, 2021 | | | As of December 31, 2021 |
B. NOTES ISSUED UNDER INDENTURES
Each series of notes shown below (i) is effectively subordinated to all of our secured indebtedness, including under the Credit Agreement, to the extent of the value of the collateral securing such indebtedness, (ii) ranks pari passu in right of payment with each other and with debt outstanding under the Credit Agreement, the senior notes shown below and other “senior debt” we incur from time to time, and (iii) is structurally subordinated to all liabilities of our subsidiaries that do not guarantee such series of notes.
The key terms of our indentures are as follows:
| | | | | | | | | | | | | | | | | | | | | | | | | | | | | | | | | | | | | | |
| SENIOR NOTES | | AGGREGATE
PRINCIPAL
AMOUNT | | DIRECT
OBLIGOR | | MATURITY DATE | | CONTRACTUAL INTEREST RATE | | INTEREST PAYMENTS DUE | | PAR CALL DATE(1) |
| GBP Notes | | £ | 400,000 | | | IM UK | | November 15, 2025 | | 37/8% | | May 15 and November 15 | | November 15, 2022 |
47/8% Notes due 2027 | | $ | 1,000,000 | | | IMI | | September 15, 2027 | | 47/8% | | March 15 and September 15 | | September 15, 2025 |
51/4% Notes due 2028 | | $ | 825,000 | | | IMI | | March 15, 2028 | | 51/4% | | March 15 and September 15 | | March 15, 2025 |
| 5% Notes due 2028 | | $ | 500,000 | | | IMI | | July 15, 2028 | | 5% | | January 15 and July 15 | | July 15, 2025 |
47/8% Notes due 2029 | | $ | 1,000,000 | | | IMI | | September 15, 2029 | | 47/8% | | March 15 and September 15 | | September 15, 2027 |
51/4% Notes due 2030 | | $ | 1,300,000 | | | IMI | | July 15, 2030 | | 51/4% | | January 15 and July 15 | | July 15, 2028 |
41/2% Notes | | $ | 1,100,000 | | | IMI | | February 15, 2031 | | 41/2% | | February 15 and August 15 | | February 15, 2029 |
| 5% Notes due 2032 | | $ | 750,000 | | | IMIM Services | | July 15, 2032 | | 5% | | May 15 and November 15 | | July 15, 2027 |
55/8% Notes | | $ | 600,000 | | | IMI | | July 15, 2032 | | 55/8% | | January 15 and July 15 | | July 15, 2029 |
(1)We may redeem the notes at any time, at our option, in whole or in part. Prior to the par call date, we may redeem the notes at the redemption price or make-whole premium specified in the applicable indenture, together with accrued and unpaid interest to, but excluding, the redemption date. On or after the par call date, we may redeem the notes at a price equal to 100% of the principal amount being redeemed, together with accrued and unpaid interest to, but excluding, the redemption date.
Each of the indentures for the notes provides that we must repurchase, at the option of the holders, the notes at 101% of their principal amount, plus accrued and unpaid interest, upon the occurrence of a “Change of Control,” which is defined in each respective indenture. Except for required repurchases upon the occurrence of a Change of Control or in the event of certain asset sales, each as described in the respective indenture, we are not required to make sinking fund or redemption payments with respect to any of the notes.
| | | | | | | | |
| IRON MOUNTAIN 2021 FORM 10-K | 84 |
Part IV
IRON MOUNTAIN INCORPORATED
NOTES TO CONSOLIDATED FINANCIAL STATEMENTS (CONTINUED)
DECEMBER 31, 2021
(In thousands, except share and per share data)
7. DEBT (CONTINUED)
DECEMBER 2021 OFFERING
On December 28, 2021, IMIM Services completed a private offering of:
| | | | | |
| SERIES OF NOTES | AGGREGATE PRINCIPAL AMOUNT |
5% Notes due 2032 | $ | 750,000 | |
The 5% Notes due 2032 were issued at 100.000% of par. The total net proceeds of approximately $737,800 from the issuance of the 5% Notes due 2032, after deducting the initial purchasers’ commissions, were used to finance the purchase price of the ITRenew Transaction, which closed on January 25, 2022, and to pay related fees and expenses. At December 31, 2021, the net proceeds from the 5% Notes due 2032 were used to temporarily repay borrowings under our Revolving Credit Facility and Accounts Receivable Securitization Program and invest in money market funds.
2020 OFFERINGS
a. JUNE 2020 OFFERINGS
On June 22, 2020, IMI completed private offerings of the following series of notes in the amounts set forth below (collectively, the "June 2020 Offerings"):
| | | | | |
| SERIES OF NOTES | AGGREGATE PRINCIPAL AMOUNT |
| 5% Notes due 2028 | $ | 500,000 | |
51/4% Notes due 2030 | 1,300,000 | |
55/8% Notes | 600,000 | |
The 5% Notes due 2028, the 51/4% Notes due 2030 and the 55/8% Notes were issued at 100.000% of par. The total net proceeds of approximately $2,376,000 from the June 2020 Offerings, after deducting the initial purchasers’ commissions, were used to redeem all of the 43/8% Notes, the 6% Notes and the 53/4% Notes and to repay a portion of the outstanding borrowings under the Revolving Credit Facility.
On June 29, 2020, we redeemed all of the $500,000 in aggregate principal outstanding of the 43/8% Notes at 100.000% of par and all of the $600,000 in aggregate principal outstanding of the 6% Notes at 102.000% of par, plus, in each case, accrued and unpaid interest to, but excluding, the redemption date. We recorded a charge of $17,040 to Other (income) expense, net during the second quarter of 2020 related to the early extinguishment of this debt, representing the call premium associated with the early redemption of the 6% Notes, as well as a write-off of unamortized deferred financing costs associated with the early redemption of the 43/8% Notes and the 6% Notes.
On July 2, 2020, we redeemed all of the $1,000,000 in aggregate principal outstanding of the 53/4% Notes at 100.958% of par, plus accrued and unpaid interest to, but excluding, the redemption date. We recorded a charge of $15,310 to Other (income) expense, net during the third quarter of 2020 related to the early extinguishment of this debt, representing the call premium and write-off of unamortized deferred financing fees.
b. AUGUST 2020 OFFERING
On August 18, 2020, IMI completed a private offering of:
| | | | | |
| SERIES OF NOTES | AGGREGATE PRINCIPAL AMOUNT |
41/2% Notes | $ | 1,100,000 | |
The 41/2% Notes were issued at 100.000% of par. The total net proceeds of approximately $1,089,000 from the issuance of the 41/2% Notes, after deducting the initial purchasers’ commissions, were used to redeem all of the CAD Notes, the Euro Notes, and the 53/8% Notes and to repay a portion of the outstanding borrowings under the Revolving Credit Facility.
| | | | | | | | |
85 | IRON MOUNTAIN 2021 FORM 10-K | |
Part IV
IRON MOUNTAIN INCORPORATED
NOTES TO CONSOLIDATED FINANCIAL STATEMENTS (CONTINUED)
DECEMBER 31, 2021
(In thousands, except share and per share data)
7. DEBT (CONTINUED)
On August 21, 2020, we redeemed all of the 250,000 CAD in aggregate principal outstanding of the CAD Notes at 104.031% of par, 300,000 Euro in aggregate principal outstanding of the Euro Notes at 101.500% of par and $250,000 in aggregate principal outstanding of the 53/8% Notes at 106.628% of par, plus, in each case accrued and unpaid interest to, but excluding, the redemption date. We recorded a charge of $35,950 to Other (income) expense, net during the third quarter of 2020 related to the early extinguishment of the CAD Notes, the Euro Notes and the 53/8% Notes, representing the call premiums and write off unamortized deferred financing costs associated with the early redemption of these debt instruments.
C. AUSTRALIAN DOLLAR TERM LOAN
Iron Mountain Australia Group Pty, Ltd. (“IM Australia”), a wholly owned subsidiary of IMI, has an AUD term loan with an original principal balance of 350,000 Australian dollars (“AUD Term Loan”). All indebtedness associated with the AUD Term Loan was issued at 99% of par. Principal payments on the AUD Term Loan are to be paid in quarterly installments in an aggregate amount of 8,750 Australian dollars per year. The AUD Term Loan bears interest at BBSY (an Australian benchmark variable interest rate) plus 3.875%. The AUD Term Loan is scheduled to mature on September 22, 2022, at which point all obligations become due. The full amount of the AUD Term Loan is classified within the current portion of long-term debt in our Consolidated Balance Sheet as of December 31, 2021.
| | | | | | | | | | | | | | | | | |
As of December 31, 2021, we had 307,813 Australian dollars ($223,530 based upon the exchange rate between the United States dollar and the Australian dollar as of December 31, 2021) outstanding on the AUD Term Loan. As of December 31, 2020, we had 316,563 Australian dollars ($244,014 based upon the exchange rate between the United States dollar and the Australian dollar as of December 31, 2020) outstanding on the AUD Term Loan. The interest rate in effect under the AUD Term Loan was 4.0% and 3.9% as of December 31, 2021 and 2020, respectively. | | | OUTSTANDING BORROWINGS AU$307,813 |
| | 4.0% Interest rate | | |
| | As of December 31, 2021 |
D. UK BILATERAL REVOLVING CREDIT FACILITY
| | | | | | | | | | | | | | | | | |
IM UK and Iron Mountain (UK) Data Centre Limited has a 140,000 British pounds sterling Revolving Credit Facility (the “UK Bilateral Facility”) with Barclays Bank PLC. The maximum amount permitted to be borrowed under the UK Bilateral Facility is 140,000 British pounds sterling, and we have the option to request additional commitments of up to 125,000 British pounds sterling, subject to the conditions specified in the UK Bilateral Facility. The UK Bilateral Facility is fully drawn. The UK Bilateral Facility is secured by certain properties in the United Kingdom. IMI and the Guarantors guarantee all obligations under the UK Bilateral Facility.
On May 25, 2021, Iron Mountain (UK) PLC and Iron Mountain (UK) Data Centre Limited (collectively, the "UK Borrowers") entered into an amendment to the UK Bilateral Facility with Barclays Bank PLC to (i) modify the interest rate from LIBOR plus 2.25% to LIBOR plus 2.0% (with flexibility built in for the expected transition away from LIBOR) and (ii) add an additional option to extend the maturity date by one year. After this amendment, the UK Bilateral Facility contains two one-year options that allow us to extend the maturity date beyond the September 23, 2022 expiration date, subject to certain conditions specified in the UK Bilateral Facility, including the lender's consent. On September 23, 2021, the UK Borrowers executed the one-year option to extend the maturity date to September 24, 2023.The interest rate in effect under the UK Bilateral Facility was 2.1% and 2.3% as of December 31, 2021 and 2020, respectively. | | | MAXIMUM AMOUNT £140,000 OPTIONAL ADDITIONAL COMMITMENTS £125,000
2.1% Interest rate |
| |
| | As of December 31, 2021 |
| | | | |
| | | | |
| | | | | | | | |
| IRON MOUNTAIN 2021 FORM 10-K | 86 |
Part IV
IRON MOUNTAIN INCORPORATED
NOTES TO CONSOLIDATED FINANCIAL STATEMENTS (CONTINUED)
DECEMBER 31, 2021
(In thousands, except share and per share data)
7. DEBT (CONTINUED)
E. ACCOUNTS RECEIVABLE SECURITIZATION PROGRAM
We participate in an accounts receivable securitization program (the “Accounts Receivable Securitization Program”) involving several of our wholly owned subsidiaries and certain financial institutions. Under the Accounts Receivable Securitization Program, certain of our subsidiaries sell substantially all of their United States accounts receivable balances to our wholly owned special purpose entities, Iron Mountain Receivables QRS, LLC and Iron Mountain Receivables TRS, LLC (the “Accounts Receivable Securitization Special Purpose Subsidiaries”). The Accounts Receivable Securitization Special Purpose Subsidiaries use the accounts receivable balances to collateralize loans obtained from certain financial institutions. The Accounts Receivable Securitization Special Purpose Subsidiaries are consolidated subsidiaries of IMI. The Accounts Receivable Securitization Program is accounted for as a collateralized financing activity, rather than a sale of assets, and therefore: (i) accounts receivable balances pledged as collateral are presented as assets and borrowings are presented as liabilities on our Consolidated Balance Sheets, (ii) our Consolidated Statements of Operations reflect the associated charges for bad debt expense related to pledged accounts receivable (a component of selling, general and administrative expenses) and reductions to revenue due to billing and service related credit memos issued to customers and related reserves, as well as interest expense associated with the collateralized borrowings and (iii) receipts from customers related to the underlying accounts receivable are reflected as operating cash flows and borrowings and repayments under the collateralized loans are reflected as financing cash flows within our Consolidated Statements of Cash Flows. IMIM retains the responsibility of servicing the accounts receivable balances pledged as collateral for the Accounts Receivable Securitization Program and IMI provides a performance guaranty. The maximum availability allowed is limited by eligible accounts receivable, as defined under the terms of the Accounts Receivable Securitization Program.
| | | | | | | | | | | |
On June 28, 2021, we entered into an amendment to the Accounts Receivable Securitization Program to extend the maturity date from July 30, 2021 to July 1, 2023, at which point all obligations become due. The interest rate under the amended Accounts Receivable Securitization Program is LIBOR plus 1.0%. The full amount outstanding under the Accounts Receivable Securitization Program is classified within current portion of long-term debt at December 31, 2020 in our Condensed Consolidated Balance Sheets. There were no other changes to the terms of the Accounts Receivable Securitization Program. | | | MAXIMUM AMOUNT $300,000 |
| | OUTSTANDING BORROWINGS $0 N/A Interest rate As of December 31, 2021 |
| | |
F. CASH POOLINGCertain of our subsidiaries participate in cash pooling arrangements (the “Cash Pools”) to help manage global liquidity requirements. Under the Cash Pools, cash deposited by participating subsidiaries with certain financial institutions are pledged as security against the debit balances of other participating subsidiaries, and legal rights of offset are provided and, therefore, amounts are presented in our Consolidated Balance Sheets on a net basis. Each subsidiary receives interest on the cash balances held on deposit or pays interest on its debit balances based on an applicable rate as defined in the Cash Pools.
We utilize two separate Cash Pools with Bank Mendes Gans (“BMG”), an independently operated wholly owned subsidiary of ING Group, one of which we utilize to manage global liquidity requirements for our qualified REIT subsidiaries (the “BMG QRS Cash Pool”) and the other for our taxable REIT subsidiaries (the “BMG TRS Cash Pool”). We have executed overdraft facility agreements for the BMG QRS Cash Pool and BMG TRS Cash Pool, each in an amount not to exceed $10,000. Each overdraft facility permits us to cover a temporary net debit position in the applicable pool.
| | | | | | | | |
87 | IRON MOUNTAIN 2021 FORM 10-K | |
Part IV
IRON MOUNTAIN INCORPORATED
NOTES TO CONSOLIDATED FINANCIAL STATEMENTS (CONTINUED)
DECEMBER 31, 2021
(In thousands, except share and per share data)
7. DEBT (CONTINUED)
During the third quarter of 2021, certain of our subsidiaries in the Asia Pacific region began to participate in two cash pooling arrangements with JP Morgan Chase Bank, N.A. (“JPM”), one of which we utilize to manage global liquidity requirements for our QRSs in the Asia Pacific region (the “JPM QRS Cash Pool") and the other for our TRSs in the Asia Pacific region (the "JPM TRS Cash Pool") (collectively, the “JPM Cash Pools”). We have executed overdraft facility agreements for the JPM QRS Cash Pool and the JPM TRS Cash Pool in amounts not to exceed $12,000 and $10,000, respectively. Each overdraft facility permits us to cover a temporary net debit position in the applicable pool.
The approximate amount of the net cash position, gross position and outstanding debit balances for each of our cash pools as of December 31, 2021 and 2020 were as follows:
| | | | | | | | | | | | | | | | | | | | | | | | | | | | | | | | | | | |
| DECEMBER 31, 2021 | | DECEMBER 31, 2020 |
| | GROSS CASH POSITION | | OUTSTANDING DEBIT BALANCES | | NET CASH POSITION | | GROSS CASH POSITION | | OUTSTANDING DEBIT BALANCES | | NET CASH POSITION |
| BMG QRS Cash Pool | $ | 552,900 | | | $ | (552,100) | | | $ | 800 | | | $ | 448,700 | | | $ | (447,400) | | | $ | 1,300 | |
| BMG TRS Cash Pool | 606,000 | | | (603,900) | | | 2,100 | | | 555,500 | | | (553,500) | | | 2,000 | |
| JPM QRS Cash Pool | 9,400 | | | (9,200) | | | 200 | | | — | | | — | | | — | |
| JPM TRS Cash Pool | 12,000 | | | (9,900) | | | 2,100 | | | — | | | — | | | — | |
The net cash position balances as of December 31, 2021 and 2020 are reflected as Cash and cash equivalents in our Consolidated Balance Sheets.
G. LETTERS OF CREDIT
As of December 31, 2021, we had outstanding letters of credit totaling $36,480, of which $3,039 reduce our borrowing capacity under the Revolving Credit Facility (as described above). The letters of credit expire at various dates between January 2022 and March 2025.
H. DEBT COVENANTS
The Credit Agreement, our bond indentures and other agreements governing our indebtedness contain certain restrictive financial and operating covenants, including covenants that restrict our ability to complete acquisitions, pay cash dividends, incur indebtedness, make investments, sell assets and take other specified corporate actions. The covenants do not contain a rating trigger. Therefore, a change in our debt rating would not trigger a default under the Credit Agreement, our bond indentures or other agreements governing our indebtedness. The Credit Agreement requires that we satisfy a fixed charge coverage ratio, a net total lease adjusted leverage ratio and a net secured debt lease adjusted leverage ratio on a quarterly basis and our bond indentures require that, among other things, we satisfy a leverage ratio (not lease adjusted) or a fixed charge coverage ratio (not lease adjusted), as a condition to taking actions such as paying dividends and incurring indebtedness.
The Credit Agreement uses EBITDAR-based calculations and the bond indentures use EBITDA-based calculations as the primary measures of financial performance for purposes of calculating leverage and fixed charge coverage ratios. The bond indenture EBITDA-based calculations include our consolidated subsidiaries, other than those we have designated as “Unrestricted Subsidiaries” as defined in the bond indentures. Generally, the Credit Agreement and the bond indentures use a trailing four fiscal quarter basis for purposes of the relevant calculations and require certain adjustments and exclusions for purposes of those calculations, which make the calculation of financial performance for purposes of those calculations under the Credit Agreement and bond indentures not directly comparable to Adjusted EBITDA as presented herein. We are in compliance with our leverage and fixed charge coverage ratios under the Credit Agreement, our bond indentures and other agreements governing our indebtedness as of December 31, 2021 and 2020. Noncompliance with these leverage and fixed charge coverage ratios would have a material adverse effect on our financial condition.
| | | | | | | | |
| IRON MOUNTAIN 2021 FORM 10-K | 88 |
Part IV
IRON MOUNTAIN INCORPORATED
NOTES TO CONSOLIDATED FINANCIAL STATEMENTS (CONTINUED)
DECEMBER 31, 2021
(In thousands, except share and per share data)
7. DEBT (CONTINUED)
I. MATURITIES OF LONG-TERM DEBT (GROSS OF DISCOUNTS) ARE AS FOLLOWS:
| | | | | | | | |
| YEAR | | AMOUNT |
| 2022 | | $ | 310,432 | |
| 2023 | | 445,318 | |
| 2024 | | 42,716 | |
| 2025 | | 569,806 | |
| 2026 | | 717,368 | |
| Thereafter | | 7,280,062 | |
| | 9,365,702 | |
| Net Discounts | | (1,251) | |
| Net Deferred Financing Costs | | (92,510) | |
| Total Long-term Debt (including current portion) | | $ | 9,271,941 | |
8. COMMITMENTS AND CONTINGENCIES
A. PURCHASE COMMITMENTS
We have certain contractual obligations related to purchase commitments which require minimum payments as follows:
| | | | | | | | |
| YEAR | | PURCHASE COMMITMENTS(1) |
| 2022 | | $ | 295,529 | |
| 2023 | | 70,853 | |
| 2024 | | 64,105 | |
| 2025 | | 38,567 | |
| 2026 | | 7,646 | |
| Thereafter | | 855 | |
| | $ | 477,555 | |
(1)Purchase commitments (i) include obligations for future construction costs associated with the expansion of our Global Data Center Business, which represent a significant amount of the purchase commitments due in 2022 and (ii) exclude our operating and financing lease obligations (see Note 2.i.).
B. SELF-INSURED LIABILITIES
We are self-insured up to certain limits for costs associated with workers’ compensation claims, vehicle accidents, property and general business liabilities, and benefits paid under employee healthcare and short-term disability programs. At December 31, 2021 and 2020, there were $46,797 and $47,959, respectively, of self-insurance accruals reflected in Accrued expenses on our Consolidated Balance Sheets. The measurement of these costs requires the consideration of historical cost experience and judgments about the present and expected levels of cost per claim. We account for these costs primarily through actuarial methods, which develop estimates of the undiscounted liability for claims incurred, including those claims incurred but not reported. These methods provide estimates of future claim costs based on claims incurred as of the balance sheet date.
| | | | | | | | |
89 | IRON MOUNTAIN 2021 FORM 10-K | |
Part IV
IRON MOUNTAIN INCORPORATED
NOTES TO CONSOLIDATED FINANCIAL STATEMENTS (CONTINUED)
DECEMBER 31, 2021
(In thousands, except share and per share data)
8. COMMITMENTS AND CONTINGENCIES (CONTINUED)
C. LITIGATION—GENERAL
We are involved in litigation from time to time in the ordinary course of business, including litigation arising from damage to customer assets in our facilities caused by fires and other natural disasters. A portion of the defense and/or settlement costs associated with such litigation is covered by various commercial liability insurance policies purchased by us and, in limited cases, indemnification from third parties. Our policy is to establish reserves for loss contingencies when the losses are both probable and reasonably estimable. We record legal costs associated with loss contingencies as expenses in the period in which they are incurred. While the outcome of litigation is inherently uncertain, we do not believe any current litigation will have a material adverse effect on our consolidated financial condition, results of operations or cash flows. We have estimated a reasonably possible range for all loss contingencies and believe it is reasonably possible that we could incur aggregate losses in addition to amounts currently accrued for all matters up to an additional $25,000 over the next several years.
9. STOCKHOLDERS’ EQUITY MATTERS
Our board of directors has adopted a dividend policy under which we have paid, and in the future intend to pay, quarterly cash dividends on our common stock. The amount and timing of future dividends will continue to be subject to the approval of our board of directors, in its sole discretion, and to applicable legal requirements.
In 2019, 2020 and 2021, our board of directors declared the following dividends:
| | | | | | | | | | | | | | | | | | | | | | | | | | |
| DECLARATION DATE | | DIVIDEND
PER SHARE | | RECORD DATE | | TOTAL AMOUNT | | PAYMENT DATE |
| | | | | | | | |
| | | | | | | | |
| | | | | | | | |
| | | | | | | | |
| February 7, 2019 | | $ | 0.6110 | | | March 15, 2019 | | $ | 175,242 | | | April 2, 2019 |
| May 22, 2019 | | 0.6110 | | | June 17, 2019 | | 175,389 | | | July 2, 2019 |
| July 26, 2019 | | 0.6110 | | | September 16, 2019 | | 175,434 | | | October 2, 2019 |
| October 31, 2019 | | 0.6185 | | | December 16, 2019 | | 177,687 | | | January 2, 2020 |
| February 13, 2020 | | 0.6185 | | | March 16, 2020 | | 178,047 | | | April 6, 2020 |
| May 5, 2020 | | 0.6185 | | | June 15, 2020 | | 178,212 | | | July 2, 2020 |
| August 5, 2020 | | 0.6185 | | | September 15, 2020 | | 178,224 | | | October 2, 2020 |
| November 4, 2020 | | 0.6185 | | | December 15, 2020 | | 178,290 | | | January 6, 2021 |
| February 24, 2021 | | 0.6185 | | | March 15, 2021 | | 178,569 | | | April 6, 2021 |
| May 6, 2021 | | 0.6185 | | | June 15, 2021 | | 179,026 | | | July 6, 2021 |
| August 5, 2021 | | 0.6185 | | | September 15, 2021 | | 179,080 | | | October 6, 2021 |
| November 4, 2021 | | 0.6185 | | | December 15, 2021 | | 179,132 | | | January 6, 2022 |
On February 24, 2022, we declared a dividend to our stockholders of record as of March 15, 2022 of $0.6185 per share, payable on April 6, 2022.
| | | | | | | | |
| IRON MOUNTAIN 2021 FORM 10-K | 90 |
Part IV
IRON MOUNTAIN INCORPORATED
NOTES TO CONSOLIDATED FINANCIAL STATEMENTS (CONTINUED)
DECEMBER 31, 2020
(In thousands, except share and per share data)
9. STOCKHOLDERS’ EQUITY MATTERS (CONTINUED)
During the years ended December 31, 2021, 2020 and 2019, we declared dividends in an aggregate and per share amount, based on the weighted average number of common shares outstanding during each respective year, as follows:
| | | | | | | | | | | | | | | | | |
| | YEAR ENDED DECEMBER 31, |
| | 2021 | | 2020 | | 2019 |
| Declared distributions | $ | 715,807 | | | $ | 712,773 | | | $ | 703,752 | |
| Amount per share each distribution represents based on weighted average number of common shares outstanding | 2.47 | | | 2.47 | | | 2.45 | |
For federal income tax purposes, distributions to our stockholders are generally treated as nonqualified ordinary dividends (potentially eligible for the lower effective tax rates available for “qualified REIT dividends”), qualified ordinary dividends or return of capital. The United States Internal Revenue Service requires historical C corporation earnings and profits to be distributed prior to any REIT distributions, which may affect the character of each distribution to our stockholders, including whether and to what extent each distribution is characterized as a qualified or nonqualified ordinary dividend. In addition, certain of our distributions qualify as capital gain distributions. For the years ended December 31, 2021, 2020, and 2019, the dividends we paid on our common shares were classified as follows: | | | | | | | | | | | | | | | | | |
| YEAR ENDED DECEMBER 31, |
| | 2021 | | 2020 | | 2019 |
| Nonqualified ordinary dividends | 53.9 | % | | 43.0 | % | | 54.8 | % |
| Qualified ordinary dividends | 13.0 | % | | 0.0 | % | | 4.5 | % |
| Capital gains | 21.8 | % | | 49.5 | % | | 14.7 | % |
| Return of capital | 11.3 | % | | 7.5 | % | | 26.0 | % |
| 100.0 | % | | 100.0 | % | | 100.0 | % |
Dividends paid during the years ended December 31, 2021, 2020, and 2019 which were classified as qualified ordinary dividends for federal income tax purposes primarily related to the distribution of historical C corporation earnings and profits related to certain acquisitions completed during the years ended December 31, 2021, 2020, and 2019. In 2021, the percentage of our dividend that was classified as a capital gain was 21.8% and was primarily related to the sale of land and buildings in the United States and the United Kingdom. In 2020, the percentage of our dividend that was classified as a capital gain was 49.5% and primarily related to the sale of land and buildings in the United States. In 2019, the percentage of our dividend that was classified as a capital gain was 14.7% and primarily related to the sale of land and buildings in the United Kingdom.
10. INCOME TAXES
We have been organized and have operated as a REIT effective beginning with our taxable year that ended on December 31, 2014. As a REIT, we are generally permitted to deduct from our federal taxable income the dividends we pay to our stockholders. The income represented by such dividends is not subject to federal taxation at the entity level but is taxed, if at all, at the stockholder level. The income of our domestic taxable REIT subsidiaries (“TRSs”), which hold our domestic operations that may not be REIT-compliant as currently operated and structured, is subject, as applicable, to federal and state corporate income tax. In addition, we and our subsidiaries continue to be subject to foreign income taxes in other jurisdictions in which we have business operations or a taxable presence, regardless of whether assets are held or operations are conducted through subsidiaries disregarded for federal income tax purposes or TRSs. We will also be subject to a separate corporate income tax on any gains recognized on the sale or disposition of any asset previously owned by a C corporation during a five-year period after the date we first owned the asset as a REIT asset that are attributable to “built-in gains” with respect to that asset on that date. We will also be subject to a built-in gains tax on our depreciation recapture recognized into income as a result of accounting method changes in connection with our acquisition activities. If we fail to remain qualified for taxation as a REIT, we will be subject to federal income tax at regular corporate income tax rates. Even if we remain qualified for taxation as a REIT, we may be subject to some federal, state, local and foreign taxes on our income and property in addition to taxes owed with respect to our TRS operations. In particular, while state income tax regimes often parallel the federal income tax regime for REITs, many states do not completely follow federal rules and some do not follow them at all.
| | | | | | | | |
91 | IRON MOUNTAIN 2021 FORM 10-K | |
Part IV
IRON MOUNTAIN INCORPORATED
NOTES TO CONSOLIDATED FINANCIAL STATEMENTS (CONTINUED)
DECEMBER 31, 2021
(In thousands, except share and per share data)
10. INCOME TAXES (CONTINUED)
The significant components of our deferred tax assets and deferred tax liabilities as of December 31, 2021 and 2020 are presented below:
| | | | | | | | | | | |
| | DECEMBER 31, |
| | 2021 | | 2020 |
| Deferred Tax Assets: | | | |
| Accrued liabilities and other adjustments | $ | 54,859 | | | $ | 52,527 | |
| Net operating loss carryforwards | 90,996 | | | 96,710 | |
| | | |
| Valuation allowance | (51,744) | | | (46,938) | |
| 94,111 | | | 102,299 | |
| Deferred Tax Liabilities: | | | |
| Other assets, principally due to differences in amortization | (178,657) | | | (186,682) | |
| Plant and equipment, principally due to differences in depreciation | (76,204) | | | (59,711) | |
| Other | (46,281) | | | (29,265) | |
| (301,142) | | | (275,658) | |
| Net deferred tax liability | $ | (207,031) | | | $ | (173,359) | |
The deferred tax assets and deferred tax liabilities as of December 31, 2021 and 2020 are presented below:
| | | | | | | | | | | |
| | DECEMBER 31, |
| | 2021 | | 2020 |
| Noncurrent deferred tax assets (Included in Other, a component of Other assets, net) | $ | 16,903 | | | $ | 25,018 | |
| Deferred income taxes | (223,934) | | | (198,377) | |
At December 31, 2021, we have federal and state net operating loss carryforwards of which we are expecting an insignificant tax benefit to be realized. We have assets for foreign net operating losses of $85,466, with various expiration dates (and in some cases no expiration date), subject to a valuation allowance of approximately 47%.
Rollforward of the valuation allowance is as follows:
| | | | | | | | | | | | | | | | | | | | | | | | | | |
| YEAR ENDED DECEMBER 31, | | BALANCE AT BEGINNING OF
THE YEAR | | CHARGED
(CREDITED) TO
EXPENSE | | OTHER INCREASES/ (DECREASES)(1) | | BALANCE
AT END OF
THE YEAR |
| 2021 | | $ | 46,938 | | | $ | 8,406 | | | $ | (3,600) | | | $ | 51,744 | |
| 2020 | | 60,003 | | | (8,337) | | | (4,728) | | | 46,938 | |
| 2019 | | 55,666 | | | 6,211 | | | (1,874) | | | 60,003 | |
(1)Other increases and decreases in valuation allowances are primarily related to changes in foreign currency exchange rates.
| | | | | | | | |
| IRON MOUNTAIN 2021 FORM 10-K | 92 |
Part IV
IRON MOUNTAIN INCORPORATED
NOTES TO CONSOLIDATED FINANCIAL STATEMENTS (CONTINUED)
DECEMBER 31, 2021
(In thousands, except share and per share data)
10. INCOME TAXES (CONTINUED)
The components of income (loss) from continuing operations before provision (benefit) for income taxes for the years ended December 31, 2021, 2020 and 2019 are as follows:
| | | | | | | | | | | | | | | | | |
| | YEAR ENDED DECEMBER 31, |
| | 2021 | | 2020 | | 2019 |
| United States | $ | 212,460 | | | $ | 276,145 | | | $ | 203,225 | |
| Canada | 78,780 | | | 52,332 | | | 48,326 | |
| Other Foreign | 337,775 | | | 44,228 | | | 76,591 | |
| $ | 629,015 | | | $ | 372,705 | | | $ | 328,142 | |
The provision (benefit) for income taxes for the years ended December 31, 2021, 2020 and 2019 consist of the following components:
| | | | | | | | | | | | | | | | | |
| | YEAR ENDED DECEMBER 31, |
| | 2021 | | 2020 | | 2019 |
| Federal—current | $ | 54,867 | | | $ | (10,424) | | | $ | 7,262 | |
| Federal—deferred | 14,322 | | | 8,834 | | | (3,356) | |
| State—current | 9,566 | | | 2,956 | | | 3,943 | |
| State—deferred | (526) | | | (625) | | | (1,126) | |
| Foreign—current | 83,154 | | | 50,063 | | | 49,350 | |
| Foreign—deferred | 14,907 | | | (21,195) | | | 3,858 | |
| Provision (Benefit) for Income Taxes | $ | 176,290 | | | $ | 29,609 | | | $ | 59,931 | |
A reconciliation of total income tax expense and the amount computed by applying the current federal statutory tax rate of 21.0% to income (loss) from continuing operations before provision (benefit) for income taxes for the years ended December 31, 2021, 2020 and 2019, respectively, is as follows:
| | | | | | | | | | | | | | | | | |
| | YEAR ENDED DECEMBER 31, |
| | 2021 | | 2020 | | 2019 |
| Computed "expected” tax provision | $ | 132,093 | | | $ | 78,268 | | | $ | 68,910 | |
| Changes in income taxes resulting from: | | | | | |
| Tax adjustment relating to REIT | (8,203) | | | (60,378) | | | (40,577) | |
| State taxes (net of federal tax benefit) | 8,027 | | | 2,258 | | | 2,115 | |
| Increase (decrease) in valuation allowance (net operating losses) | 8,406 | | | (8,337) | | | 6,211 | |
| Withholding Taxes | 23,654 | | | 6,835 | | | 5,281 | |
| | | | | |
| Reserve (reversal) accrual and audit settlements (net of federal tax benefit) | 3,072 | | | (7,409) | | | 514 | |
| Foreign tax rate differential | 9,856 | | | 9,472 | | | 8,562 | |
| Disallowed foreign interest, Subpart F income, and other foreign taxes | (3,437) | | | 13,407 | | | 8,960 | |
| Other, net | 2,822 | | | (4,507) | | | (45) | |
| Provision (Benefit) for Income Taxes | $ | 176,290 | | | $ | 29,609 | | | $ | 59,931 | |
Our effective tax rates for the years ended December 31, 2021, 2020 and 2019 were 28.0%, 7.9% and 18.3%, respectively. Our effective tax rate is subject to variability in the future due to, among other items: (1) changes in the mix of income between our qualified REIT subsidiaries (“QRSs”) and our TRSs, as well as among the jurisdictions in which we operate; (2) tax law changes; (3) volatility in foreign exchange gains and losses; (4) the timing of the establishment and reversal of tax reserves; and (5) our ability to utilize net operating losses that we generate.
| | | | | | | | |
93 | IRON MOUNTAIN 2021 FORM 10-K | |
Part IV
IRON MOUNTAIN INCORPORATED
NOTES TO CONSOLIDATED FINANCIAL STATEMENTS (CONTINUED)
DECEMBER 31, 2021
(In thousands, except share and per share data)
10. INCOME TAXES (CONTINUED)
The primary reconciling items between the federal statutory tax rate of 21.0% and our overall effective tax rate were:
| | | | | | | | |
| YEAR ENDED DECEMBER 31, |
| 2021 | 2020 | 2019 |
The benefit derived from the dividends paid deduction of $8,203 which was offset by (1) the impact of differences in the tax rates at which our foreign earnings are subject to, resulting in a tax provision of $9,856, and (2) foreign withholding taxes of $23,654, which were either paid during the year or accrued, for the deferred tax liability for the U.S. tax impact of undistributed earnings of foreign TRSs that are no longer intended to be permanently reinvested outside the United States. | The benefit derived from the dividends paid deduction of $60,378 and the impact of differences in the tax rates at which our foreign earnings are subject to, resulting in a tax provision of $9,472. | The benefit derived from the dividends paid deduction of $40,577 and the impact of differences in the tax rates at which our foreign earnings are subject to, resulting in a tax provision of $8,562. |
As a REIT, we are entitled to a deduction for dividends paid, resulting in a substantial reduction of federal income tax expense. As a REIT, substantially all of our income tax expense will be incurred based on the earnings generated by our foreign subsidiaries and our domestic TRSs.
Following our conversion to a REIT in 2014, we concluded that it was not our intent to reinvest our current and future undistributed earnings of our foreign subsidiaries indefinitely outside the United States. As of December 31, 2016, we concluded that it is our intent to indefinitely reinvest our current and future undistributed earnings of certain of our unconverted foreign TRSs outside the United States. During 2021, as a result of the enactment of a tax law and the closing of various acquisitions, we reassessed this intention and concluded that it is no longer our intention to reinvest our undistributed earnings of our foreign TRSs indefinitely outside the United States. As a REIT, future repatriation of incremental undistributed earnings of our foreign subsidiaries will not be subject to federal or state income tax, with the exception of foreign withholding taxes. However, such future repatriations may require distributions to our stockholders in accordance with REIT distribution rules, and any such distribution may then be taxable, as appropriate, at the stockholder level. We expect to provide for foreign withholding taxes on the current and future earnings of all of our foreign subsidiaries as the result of such reassessment.
The evaluation of an uncertain tax position is a two-step process. The first step is a recognition process whereby we determine whether it is more likely than not that a tax position will be sustained upon examination, including resolution of any related appeals or litigation processes, based on the technical merits of the position. The second step is a measurement process whereby a tax position that meets the more likely than not recognition threshold is calculated to determine the amount of benefit to recognize in the financial statements. The tax position is measured as the largest amount of benefit that is greater than 50% likely of being realized upon ultimate settlement.
We have elected to recognize interest and penalties associated with uncertain tax positions as a component of the provision (benefit) for income taxes in the accompanying Consolidated Statements of Operations. We recorded an increase of $823 and $1,780 for gross interest and penalties for the years ended December 31, 2021 and 2019, respectively. We recorded a decrease of $1,499 for gross interest and penalties for the year ended December 31, 2020. We had $6,805 and $6,212 accrued for the payment of interest and penalties as of December 31, 2021 and 2020, respectively.
A summary of tax years that remain subject to examination by major tax jurisdictions is as follows:
| | | | | | | | |
| TAX YEARS | | TAX JURISDICTION |
| See Below | | United States—Federal and State |
| 2020 to present | | United Kingdom |
| 2014 to present | | Canada |
| | | | | | | | |
| IRON MOUNTAIN 2021 FORM 10-K | 94 |
Part IV
IRON MOUNTAIN INCORPORATED
NOTES TO CONSOLIDATED FINANCIAL STATEMENTS (CONTINUED)
DECEMBER 31, 2021
(In thousands, except share and per share data)
10. INCOME TAXES (CONTINUED)
The normal statute of limitations for United States federal tax purposes is three years from the date the tax return is filed; however, the statute of limitations may remain open for periods longer than three years in instances where a federal tax examination is in progress. The 2020, 2019 and 2018 tax years remain subject to examination for United States federal tax purposes as well as net operating loss carryforwards utilized in these years. The normal statute of limitations for state purposes is between three to five years. However, certain of our state statute of limitations remain open for periods longer than this when audits are in progress.
We are subject to income taxes in the United States and numerous foreign jurisdictions. We are subject to examination by various tax authorities in jurisdictions in which we have business operations or a taxable presence. We regularly assess the likelihood of additional assessments by tax authorities and provide for these matters as appropriate. As of December 31, 2021, we had $27,772 of reserves related to uncertain tax positions, of which $24,627 and $3,145 is included in other long-term liabilities and deferred income taxes, respectively, in the accompanying Consolidated Balance Sheet. As of December 31, 2020, we had $25,969 of reserves related to uncertain tax positions, of which $23,402 and $2,567 is included in other long-term liabilities and deferred income taxes, respectively, in the accompanying Consolidated Balance Sheet. Although we believe our tax estimates are appropriate, the final determination of tax audits and any related litigation could result in changes in our estimates.
A rollforward of unrecognized tax benefits is as follows:
| | | | | |
| Gross tax contingencies—December 31, 2018 | $ | 35,320 | |
| Gross additions based on tax positions related to the current year | 2,914 | |
| Gross additions for tax positions of prior years | 1,271 | |
| Gross reductions for tax positions of prior years | (299) | |
| Lapses of statutes | (4,034) | |
| Settlements | (104) | |
| Gross tax contingencies—December 31, 2019 | 35,068 | |
| Gross additions based on tax positions related to the current year | 2,907 | |
| Gross additions for tax positions of prior years | 80 | |
| Gross reductions for tax positions of prior years | (5,617) | |
| Lapses of statutes | (4,480) | |
| Settlements | (1,989) | |
| Gross tax contingencies—December 31, 2020 | 25,969 | |
| Gross additions based on tax positions related to the current year | 3,893 | |
| Gross additions for tax positions of prior years | 344 | |
| Gross reductions for tax positions of prior years | (536) | |
| Lapses of statutes | (1,663) | |
| Settlements | (235) | |
| Gross tax contingencies—December 31, 2021 | $ | 27,772 | |
The reversal of these reserves of $27,772 as of December 31, 2021 will be recorded as a reduction of our income tax provision, if sustained. We believe that it is reasonably possible that an amount up to approximately $5,364 of our unrecognized tax positions may be recognized by the end of 2022 as a result of a lapse of statute of limitations or upon closing and settling significant audits in various worldwide jurisdictions.
| | | | | | | | |
95 | IRON MOUNTAIN 2021 FORM 10-K | |
Part IV
IRON MOUNTAIN INCORPORATED
NOTES TO CONSOLIDATED FINANCIAL STATEMENTS (CONTINUED)
DECEMBER 31, 2021
(In thousands, except share and per share data)
11. SEGMENT INFORMATION
As a result of the realignment of our global managerial structure, as discussed in Note 2.k., we reassessed the composition of our reportable segments and note that (i) our Entertainment Services offerings are now managed as part of our Global Records and Information Management ("Global RIM") Business segment; (ii) certain commercial costs that were previously managed as part of Corporate and Other Business are now managed as part of our Global RIM Business segment; and (iii) our ALM services, which includes our legacy secure IT disposition business and our business acquired from ITRenew, are now managed as a separate operating segment that is included in Corporate and Other Business. Our reportable segments are described in more detail below, and previously reported segment information has been restated to reflect the changes described above.
(1)Global RIM Business includes several distinct offerings:
(i)Records Management, which stores physical records and provides healthcare information services, vital records services, courier operations, and the collection, handling and disposal of sensitive documents (collectively, “Records Management”) for customers in 63 countries around the globe.
(ii)Data Management, which provides storage and rotation of backup computer media as part of corporate disaster recovery plans, including service and courier operations (“Data Protection & Recovery”); server and computer backup services; and related services offerings, (collectively, “Data Management”).
(iii)Global Digital Solutions, which develops, implements and supports comprehensive storage and information management solutions for the complete lifecycle of our customers’ information, including the management of physical records, conversion of documents to digital formats and digital storage of information, primarily in the United States and Canada.
(iv)Secure Shredding, which includes the scheduled pick-up of office records that customers accumulate in specially designed secure containers we provide and is a natural extension of our hardcopy records management operations, completing the lifecycle of a record. Through a combination of shredding facilities and mobile shredding units consisting of custom built trucks, we are able to offer secure shredding services to our customers throughout the United States, Canada and South Africa.
(v)Entertainment Services, entertainment and media services which help industry clients store, safeguard and deliver physical media of all types, and provides digital content repository systems that house, distribute, and archive key media assets, through the United States, Canada, France, China - Hong Kong S.A.R, the Netherlands and the United Kingdom.
(vi)Consumer Storage, which provides on-demand, valet storage for consumers (“Consumer Storage”) across 31 markets in North America through a strategic partnership that utilizes data analytics and machine learning to provide effective customer acquisition and a convenient and seamless consumer storage experience.
(2)Global Data Center Business, which provides enterprise-class data center facilities and hyperscale-ready capacity to protect mission-critical assets and ensure the continued operation of our customers’ IT infrastructure, with secure, reliable and flexible data center options. As of December 31, 2021, our Global Data Center Business footprint spans nine markets in the United States and seven international markets.
| | | | | |
| UNITED STATES | INTERNATIONAL MARKETS |
Denver, Colorado | Amsterdam |
Kansas City, Missouri | London |
Boston, Massachusetts | Singapore |
Boyers, Pennsylvania | Frankfurt (directly and through an unconsolidated joint venture) |
Manassas, Virginia | Mumbai (through an unconsolidated joint venture) |
Edison, New Jersey | Pune (through an unconsolidated joint venture) |
Columbus, Ohio | Noida (through an unconsolidated joint venture) |
Phoenix and Scottsdale, Arizona | |
| | | | | | | | |
| IRON MOUNTAIN 2021 FORM 10-K | 96 |
Part IV
IRON MOUNTAIN INCORPORATED
NOTES TO CONSOLIDATED FINANCIAL STATEMENTS (CONTINUED)
DECEMBER 31, 2021
(In thousands, except share and per share data)
11. SEGMENT INFORMATION (CONTINUED)
(3) Corporate and Other Business consists primarily of our Fine Arts and Asset Lifecycle Management businesses and other corporate items.
(i) Fine Arts provides technical expertise in the handling, installation and storing of art in the United States, Canada and Europe.
(ii) ALM provides hyperscale and corporate IT infrastructure managers with services and solutions that enable the decommissioning and disposition or sale of IT hardware and component assets. ALM services are enabled by: secure logistics and chain of custody practices, environmentally-responsible asset processing and recycling, and data sanitization and asset refurbishment services that enable value recovery through asset remarketing. Our ALM services focus on protecting and eradicating customer data while maintaining strong, auditable and transparent chain of custody practices.
Corporate and Other Business also includes costs related to executive and staff functions, including finance, human resources and IT, which benefit the enterprise as a whole.
An analysis of our business segment information and reconciliation to the accompanying Consolidated Financial Statements is as follows:
| | | | | | | | |
97 | IRON MOUNTAIN 2021 FORM 10-K | |
Part IV
IRON MOUNTAIN INCORPORATED
NOTES TO CONSOLIDATED FINANCIAL STATEMENTS (CONTINUED)
DECEMBER 31, 2021
(In thousands, except share and per share data)
11. SEGMENT INFORMATION (CONTINUED)
| | | | | | | | | | | | | | | | | | | | | | | | | |
| GLOBAL RIM BUSINESS | | GLOBAL
DATA CENTER BUSINESS | | | | CORPORATE
AND OTHER
BUSINESS | | TOTAL
CONSOLIDATED |
| As of and for the Year Ended December 31, 2021 | | | | | | | | | |
| Total Revenues | $ | 3,994,988 | | | $ | 326,898 | | | | | $ | 169,645 | | | $ | 4,491,531 | |
| Storage Rental | 2,517,208 | | | 289,592 | | | | | 63,319 | | | 2,870,119 | |
| Service | 1,477,780 | | | 37,306 | | | | | 106,326 | | | 1,621,412 | |
| Depreciation and Amortization | 477,713 | | | 148,023 | | | | | 54,686 | | | 680,422 | |
| Depreciation | 320,451 | | | 93,679 | | | | | 50,942 | | | 465,072 | |
| Amortization | 157,262 | | | 54,344 | | | | | 3,744 | | | 215,350 | |
| Adjusted EBITDA | 1,709,525 | | | 137,349 | | | | | (212,175) | | | 1,634,699 | |
Total Assets(1) | 11,101,557 | | | 2,911,823 | | | | | 436,651 | | | 14,450,031 | |
| Expenditures for Segment Assets | 369,749 | | | 422,274 | | | | | 94,875 | | | 886,898 | |
| Capital Expenditures | 213,395 | | | 320,768 | | | | | 76,919 | | | 611,082 | |
| Cash Paid for Acquisitions, Net of Cash Acquired | 97,044 | | | 88,998 | | | | | 17,956 | | | 203,998 | |
| Acquisitions of Customer Relationships, Customer Inducements and Contract Fulfillment Costs | 59,310 | | | 12,508 | | | | | — | | | 71,818 | |
| As of and for the Year Ended December 31, 2020 | | | | | | | | | |
| Total Revenues | $ | 3,748,604 | | | $ | 279,312 | | | | | $ | 119,354 | | | $ | 4,147,270 | |
| Storage Rental | 2,416,147 | | | 263,695 | | | | | 74,249 | | | 2,754,091 | |
| Service | 1,332,457 | | | 15,617 | | | | | 45,105 | | | 1,393,179 | |
| Depreciation and Amortization | 464,745 | | | 134,844 | | | | | 52,480 | | | 652,069 | |
| Depreciation | 316,575 | | | 83,106 | | | | | 47,881 | | | 447,562 | |
| Amortization | 148,170 | | | 51,738 | | | | | 4,599 | | | 204,507 | |
| Adjusted EBITDA | 1,565,941 | | | 126,576 | | | | | (216,796) | | | 1,475,721 | |
Total Assets(1) | 11,015,684 | | | 2,727,654 | | | | | 405,929 | | | 14,149,267 | |
| Expenditures for Segment Assets | 352,745 | | | 249,459 | | | | | 29,650 | | | 631,854 | |
| Capital Expenditures | 164,914 | | | 243,699 | | | | | 29,650 | | | 438,263 | |
| Cash Paid for Acquisitions, Net of Cash Acquired | 118,581 | | | — | | | | | — | | | 118,581 | |
| Acquisitions of Customer Relationships, Customer Inducements and Contract Fulfillment Costs | 69,250 | | | 5,760 | | | | | — | | | 75,010 | |
| As of and for the Year Ended December 31, 2019 | | | | | | | | | |
| Total Revenues | $ | 3,858,742 | | | $ | 257,151 | | | | | $ | 146,691 | | | $ | 4,262,584 | |
| Storage Rental | 2,360,794 | | | 246,925 | | | | | 73,368 | | | 2,681,087 | |
| Service | 1,497,948 | | | 10,226 | | | | | 73,323 | | | 1,581,497 | |
| Depreciation and Amortization | 462,607 | | | 133,927 | | | | | 61,667 | | | 658,201 | |
| Depreciation | 335,602 | | | 78,939 | | | | | 41,782 | | | 456,323 | |
| Amortization | 127,005 | | | 54,988 | | | | | 19,885 | | | 201,878 | |
| Adjusted EBITDA | 1,557,223 | | | 121,517 | | | | | (209,731) | | | 1,469,009 | |
Total Assets(1) | 10,836,995 | | | 2,535,848 | | | | | 443,973 | | | 13,816,816 | |
| Expenditures for Segment Assets | 403,943 | | | 427,935 | | | | | 50,989 | | | 882,867 | |
| Capital Expenditures | 253,485 | | | 392,029 | | | | | 47,469 | | | 692,983 | |
| Cash Paid for Acquisitions, Net of Cash Acquired | 54,717 | | | — | | | | | 3,520 | | | 58,237 | |
| Acquisitions of Customer Relationships, Customer Inducements, Contract Fulfillment Costs and third-party commissions | 95,741 | | | 35,906 | | | | | — | | | 131,647 | |
(1)Excludes all intercompany receivables or payables and investment in subsidiary balances.
| | | | | | | | |
| IRON MOUNTAIN 2021 FORM 10-K | 98 |
Part IV
IRON MOUNTAIN INCORPORATED
NOTES TO CONSOLIDATED FINANCIAL STATEMENTS (CONTINUED)
DECEMBER 31, 2021
(In thousands, except share and per share data)
11. SEGMENT INFORMATION (CONTINUED)
The accounting policies of the reportable segments are the same as those described in Note 2. Adjusted EBITDA for each segment is defined as income (loss) from continuing operations before interest expense, net, provision (benefit) for income taxes, depreciation and amortization (inclusive of our share of Adjusted EBITDA from our unconsolidated joint ventures), and excluding certain items we do not believe to be indicative of our core operating results, specifically:
| | | | | |
| |
| EXCLUDED | |
•Acquisition and Integration Costs •Restructuring Charges •Intangible impairments •(Gain) loss on disposal/write-down of property, plant and equipment, net (including real estate) | •Other (income) expense, net •Stock-based compensation expense •COVID-19 Costs (as defined below)
|
| |
Internally, we use Adjusted EBITDA as the basis for evaluating the performance of, and allocated resources to, our operating segments.
A reconciliation of Income (Loss) from Continuing Operations to Adjusted EBITDA on a consolidated basis for the years ended December 31, 2021, 2020 and 2019 is as follows:
| | | | | | | | | | | | | | | | | |
| | YEAR ENDED DECEMBER 31, |
| | 2021 | | 2020 | | 2019 |
| Income (Loss) from Continuing Operations | $ | 452,725 | | | $ | 343,096 | | | $ | 268,211 | |
| Add/(Deduct): | | | | | |
| Interest expense, net | 417,961 | | | 418,535 | | | 419,298 | |
| Provision (benefit) for income taxes | 176,290 | | | 29,609 | | | 59,931 | |
| Depreciation and amortization | 680,422 | | | 652,069 | | | 658,201 | |
| Acquisition and Integration Costs | 12,764 | | | — | | | 13,293 | |
| Restructuring Charges | 206,426 | | | 194,396 | | | 48,597 | |
| Intangible impairments | — | | | 23,000 | | | — | |
| (Gain) loss on disposal/write-down of property, plant and equipment, net (including real estate) | (172,041) | | | (363,537) | | | (63,824) | |
Other (income) expense, net, excluding our share of losses (gains) from our unconsolidated joint ventures(1) | (205,746) | | | 133,611 | | | 25,720 | |
| Stock-based compensation expense | 61,001 | | | 34,272 | | | 36,194 | |
COVID-19 Costs(2) | — | | | 9,285 | | | — | |
| Our share of Adjusted EBITDA reconciling items from our unconsolidated joint ventures | 4,897 | | | 1,385 | | | 3,388 | |
| Adjusted EBITDA | $ | 1,634,699 | | | $ | 1,475,721 | | | $ | 1,469,009 | |
(1)Includes foreign currency transaction (gains) losses, net, debt extinguishment expense and other, net.
(2)Costs that are incremental and directly attributable to the COVID-19 pandemic which are not expected to recur once the pandemic ends (“COVID-19 Costs”). For the year ended December 31, 2020, approximately $7,600 and $1,600 of COVID-19 Costs are included within Cost of sales and Selling, general and administrative expenses, respectively, on our Consolidated Statement of Operations. These costs include the purchase of personal protective equipment for our employees and incremental cleaning costs of our facilities, among other direct costs.
| | | | | | | | |
99 | IRON MOUNTAIN 2021 FORM 10-K | |
Part IV
IRON MOUNTAIN INCORPORATED
NOTES TO CONSOLIDATED FINANCIAL STATEMENTS (CONTINUED)
DECEMBER 31, 2021
(In thousands, except share and per share data)
11. SEGMENT INFORMATION (CONTINUED)
Information as to our operations in different geographical areas for the years ended December 31, 2021, 2020 and 2019 is as follows:
| | | | | | | | | | | | | | | | | |
| | YEAR ENDED DECEMBER 31, |
| | 2021 | | 2020 | | 2019 |
| Revenues: | | | | | |
| United States | $ | 2,713,147 | | | $ | 2,577,084 | | | $ | 2,632,586 | |
| United Kingdom | 294,675 | | | 247,667 | | | 274,931 | |
| Canada | 252,385 | | | 224,860 | | | 243,033 | |
| Australia | 148,431 | | | 133,815 | | | 143,511 | |
| Remaining Countries | 1,082,893 | | | 963,844 | | | 968,523 | |
| | | | | |
| Long-lived Assets: | | | | | |
| United States | $ | 7,867,841 | | | $ | 7,818,059 | | | $ | 7,862,262 | |
| United Kingdom | 914,732 | | | 838,491 | | | 755,859 | |
| Canada | 562,911 | | | 556,120 | | | 556,591 | |
| Australia | 528,703 | | | 575,862 | | | 530,755 | |
| Remaining Countries | 3,134,577 | | | 3,090,948 | | | 2,875,010 | |
| | | | | |
Information as to our revenues by product and service lines by segment for the years ended December 31, 2021, 2020 and 2019 is as follows:
| | | | | | | | | | | | | | | | | | | | | | | | | |
| GLOBAL RIM BUSINESS | | GLOBAL
DATA CENTER BUSINESS | | | | CORPORATE
AND OTHER BUSINESS | | TOTAL
CONSOLIDATED |
| For the Year Ended December 31, 2021 | | | | | | | | | |
Records Management(1) | $ | 3,074,605 | | | $ | — | | | | | $ | 125,571 | | | $ | 3,200,176 | |
Data Management(1) | 529,416 | | | — | | | | | — | | | 529,416 | |
Information Destruction(1)(2) | 390,967 | | | — | | | | | 44,074 | | | 435,041 | |
Data Center(1) | — | | | 326,898 | | | | | — | | | 326,898 | |
| | | | | | | | | |
| | | | | | | | | |
| For the Year Ended December 31, 2020 | | | | | | | | | |
Records Management(1) | $ | 2,852,296 | | | $ | — | | | | | $ | 101,975 | | | $ | 2,954,271 | |
Data Management(1) | 554,901 | | | — | | | | | — | | | 554,901 | |
Information Destruction(1)(2) | 341,407 | | | — | | | | | 17,379 | | | 358,786 | |
Data Center(1) | — | | | 279,312 | | | | | — | | | 279,312 | |
| | | | | | | | | |
| | | | | | | | | |
| For the Year Ended December 31, 2019 | | | | | | | | | |
Records Management(1) | $ | 2,866,192 | | | $ | — | | | | | $ | 130,690 | | | $ | 2,996,882 | |
Data Management(1) | 582,392 | | | — | | | | | — | | | 582,392 | |
Information Destruction(1)(2) | 410,158 | | | — | | | | | 16,001 | | | 426,159 | |
Data Center(1) | — | | | 257,151 | | | | | — | | | 257,151 | |
| | | | | | | | | |
| | | | | | | | | |
(1)Each of the offerings within our product and service lines has a component of revenue that is storage rental related and a component that is service revenues, except the destruction services offering, which does not have a storage rental component.
(2)Includes Secure Shredding services.
| | | | | | | | |
| IRON MOUNTAIN 2021 FORM 10-K | 100 |
Part IV
IRON MOUNTAIN INCORPORATED
NOTES TO CONSOLIDATED FINANCIAL STATEMENTS (CONTINUED)
DECEMBER 31, 2021
(In thousands, except share and per share data)
12. RELATED PARTY TRANSACTIONS
In October 2020, in connection with the Frankfurt JV Transaction, we entered into agreements whereby we will earn various fees, including (i) special project revenue and (ii) property management and construction and development fees for services we are providing to the Frankfurt JV (the “Frankfurt JV Agreements”). Revenues and expenses associated with the Frankfurt JV Agreements are presented as a component of our Global Data Business segment. During the years ended December 31, 2021 and 2020, we recognized revenue of approximately $19,600 and $400, respectively, associated with the Frankfurt JV Agreements.
In March 2019, in connection with the Consumer Storage Transaction and the MakeSpace Investment, we entered into a storage and service agreement with the MakeSpace JV to provide certain storage and related services to the MakeSpace JV (the "MakeSpace Agreement”). Revenues and expenses associated with the MakeSpace Agreement are presented as a component of our Global RIM Business segment. During the years ended December 31, 2021, 2020 and 2019, we recognized revenue of approximately $34,700, $33,600, and $22,500, respectively, associated with the MakeSpace Agreement.
During the years ended December 31, 2021, 2020 and 2019, the Company had no other related party transactions.
13. PROJECT SUMMIT
In October 2019, we announced Project Summit, our global program designed to better position us for future growth and achievement of our strategic objectives. We expanded Project Summit during the first quarter of 2020 to include additional opportunities to streamline our business and operations, as well as accelerated the timing of certain opportunities previously identified. As of December 31, 2021, we have completed Project Summit. As a result of the program we have simplified our global structure, rebalanced resources to focus on higher growth areas, realigned our management structure to create a more dynamic, agile organization, made investments to enhance the customer experience and leveraged new technology solutions that enabled us to modernize our service delivery model and more efficiently utilize our fleet, labor and real estate.
The implementation of Project Summit resulted in total operating expenditures ("Restructuring Charges") of approximately $450,000 that primarily consisted of: (1) employee severance costs; (2) internal costs associated with the development and implementation of Project Summit initiatives; (3) professional fees, primarily related to third party consultants who assisted with the design and execution of various initiatives as well as project management activities and (4) system implementation and data conversion costs.
Restructuring Charges included in the accompanying Consolidated Statement of Operations for the years ended December 31, 2021, 2020 and 2019, and from the inception of Project Summit through December 31, 2021, are as follows:
| | | | | | | | | | | | | | | | | | | | | | | | | | |
| | YEAR ENDED DECEMBER 31, 2021 | | YEAR ENDED DECEMBER 31, 2020 | | YEAR ENDED DECEMBER 31, 2019 | | FROM INCEPTION OF PROJECT SUMMIT THROUGH
DECEMBER 31, 2021 |
| Employee severance costs | | $ | 22,809 | | | $ | 47,349 | | | $ | 20,850 | | | $ | 91,008 | |
| Professional fees and other costs | | 183,617 | | | 147,047 | | | 27,747 | | | 358,411 | |
| Restructuring Charges | | $ | 206,426 | | | $ | 194,396 | | | $ | 48,597 | | | $ | 449,419 | |
Restructuring Charges included in the accompanying Consolidated Statement of Operations by segment for the years ended December 31, 2021, 2020 and 2019, and from inception of Project Summit through December 31, 2021, are as follows:
| | | | | | | | |
101 | IRON MOUNTAIN 2021 FORM 10-K | |
Part IV
IRON MOUNTAIN INCORPORATED
NOTES TO CONSOLIDATED FINANCIAL STATEMENTS (CONTINUED)
DECEMBER 31, 2021
(In thousands, except share and per share data)
13. PROJECT SUMMIT (CONTINUED)
| | | | | | | | | | | | | | | | | | | | | | | | | | |
| | YEAR ENDED DECEMBER 31, 2021 | | YEAR ENDED DECEMBER 31, 2020 | | YEAR ENDED DECEMBER 31, 2019 | | FROM INCEPTION OF PROJECT SUMMIT THROUGH
DECEMBER 31, 2021 |
| Global RIM Business | | $ | 59,033 | | | $ | 67,140 | | | $ | 21,900 | | | $ | 148,073 | |
| Global Data Center Business | | 3,062 | | | 1,632 | | | 306 | | | 5,000 | |
| Corporate and Other Business | | 144,331 | | | 125,624 | | | 26,391 | | | 296,346 | |
| Restructuring Charges | | $ | 206,426 | | | $ | 194,396 | | | $ | 48,597 | | | $ | 449,419 | |
A rollforward of the accrued Restructuring Charges, which is included as a component of Accrued expenses and other current liabilities in our Consolidated Balance Sheet from the inception of Project Summit through December 31, 2021 is as follows:
| | | | | | | | | | | | | | | | | | | | |
| | EMPLOYEE SEVERANCE COSTS | | PROFESSIONAL FEES AND OTHER | | TOTAL ACCRUED RESTRUCTURING CHARGES |
| Inception of Project Summit | | $ | — | | | $ | — | | | $ | — | |
| Amounts accrued | | 20,850 | | | 27,747 | | | 48,597 | |
| Payments | | (16,027) | | | (14,793) | | | (30,820) | |
| | | | | | |
| Balance as of December 31, 2019 | | 4,823 | | | 12,954 | | | 17,777 | |
| Amounts accrued | | 47,349 | | | 147,047 | | | 194,396 | |
| Payments | | (32,455) | | | (136,222) | | | (168,677) | |
| Other, including currency translation adjustments | | (3,439) | | | (4) | | | (3,443) | |
| Balance as of December 31, 2020 | | $ | 16,278 | | | $ | 23,775 | | | $ | 40,053 | |
| Amounts accrued | | 22,809 | | | 183,617 | | | 206,426 | |
| Payments | | (29,956) | | | (199,664) | | | (229,620) | |
| Other, including currency translation adjustments | | 2,858 | | | — | | | 2,858 | |
| Balance as of December 31, 2021 | | $ | 11,989 | | | $ | 7,728 | | | $ | 19,717 | |
14. SUBSEQUENT EVENTS
On January 25, 2022, we acquired an approximately 80% interest in Intercept Parent, Inc. (“ITRenew”), a company with asset lifecycle management operations primarily in the United States, for approximately $725,000 (the “ITRenew Transaction”). The acquisition agreement also provides us the option to purchase, and the shareholders the option to sell, the remaining approximately 20% interest in ITRenew as follows: (i) approximately 16% on or after the second anniversary of the ITRenew Transaction and (ii) approximately 4% on or after the third anniversary of the ITRenew Transaction (collectively, the ”Remaining Interest"), each at a purchase price to be determined based upon the achievement of certain performance metrics, but for no less than $200,000 in total.
| | | | | | | | |
| IRON MOUNTAIN 2021 FORM 10-K | 102 |
Part IV
IRON MOUNTAIN INCORPORATED
SCHEDULE III—SCHEDULE OF REAL ESTATE AND ACCUMULATED DEPRECIATION
DECEMBER 31, 2021
(Dollars in thousands)
Schedule III - Schedule of Real Estate and Accumulated Depreciation (“Schedule III”) reflects the cost and associated accumulated depreciation for the real estate facilities that are owned. The gross cost included in Schedule III includes the cost for land, land improvements, buildings, building improvements and racking. Schedule III does not reflect the 1,184 leased facilities in our real estate portfolio. In addition, Schedule III does not include any value for financing leases for property that is classified as land, buildings and building improvements in our consolidated financial statements.
The following table presents a reconciliation of the gross amount of real estate assets, as presented in Schedule III below, to the sum of the historical book value of land, buildings and building improvements, racking and construction in progress as disclosed in Note 2.h. to Notes to Consolidated Financial Statements as of December 31, 2021:
| | | | | |
| Gross Amount of Real Estate Assets, As Reported on Schedule III | $ | 4,129,251 | |
| Add Reconciling Items: | |
Book value of racking included in leased facilities(1) | 1,483,435 | |
Book value of financing leases(2) | 385,238 | |
Book value of construction in progress(3) | 225,817 | |
| Total Reconciling Items | 2,094,490 | |
| Gross Amount of Real Estate Assets, As Disclosed in Note 2.h. | $ | 6,223,741 | |
(1)Represents the gross book value of racking installed in our 1,184 leased facilities, which is included in historical book value of racking in Note 2.h., but excluded from Schedule III.
(2)Represents the gross book value of buildings and building improvements that are subject to financing leases, which are included in the historical book value of building and building improvements in Note 2.h., but excluded from Schedule III.
(3)Represents the gross book value of non-real estate assets that are included in the historical book value of construction in progress assets in Note 2.h. The historical book value of real estate assets associated with owned buildings that were related to construction in progress as of December 31, 2021 is included in Schedule III.
The following table presents a reconciliation of the accumulated depreciation of real estate assets, as presented in Schedule III below, to the total accumulated depreciation for all property, plant and equipment presented on our Consolidated Balance Sheet as of December 31, 2021:
| | | | | |
| Accumulated Depreciation of Real Estate Assets, As Reported on Schedule III | $ | 1,160,490 | |
| Add Reconciling Items: | |
Accumulated Depreciation - non-real estate assets(1) | 1,662,689 | |
Accumulated Depreciation - racking in leased facilities(2) | 1,032,075 | |
Accumulated Depreciation - financing leases(3) | 123,905 | |
| Total Reconciling Items | 2,818,669 | |
| Accumulated Depreciation, As Reported on Consolidated Balance Sheet | $ | 3,979,159 | |
(1)Represents the accumulated depreciation of non-real estate assets that is included in the total accumulated depreciation of property, plant and equipment on our Consolidated Balance Sheet, but excluded from Schedule III as the assets to which this accumulated depreciation relates are not considered real estate assets associated with owned buildings.
(2)Represents the accumulated depreciation of racking as of December 31, 2021 installed in our 1,184 leased facilities, which is included in total accumulated depreciation of property, plant and equipment on our Consolidated Balance Sheet, but excluded from Schedule III, as disclosed in Footnote 1 to Schedule III.
(3)Represents the accumulated depreciation of buildings and building improvements as of December 31, 2021 that are subject to financing leases, which is included in the total accumulated depreciation of property, plant and equipment on our Consolidated Balance Sheet, but excluded from Schedule III, as disclosed in Footnote 1 to Schedule III.
| | | | | | | | |
103 | IRON MOUNTAIN 2021 FORM 10-K | |
Part IV
IRON MOUNTAIN INCORPORATED
SCHEDULE III—SCHEDULE OF REAL ESTATE AND ACCUMULATED DEPRECIATION (CONTINUED)
DECEMBER 31, 2021
(Dollars in thousands)
| | | | | | | | | | | | | | | | | | | | | | | | | | | | | | | | | | | | | | | | | | | | | | | | | | |
| (A) | | | | (B) | | (C) | | (D) | | (E) | | (F) | | | | |
REGION/COUNTRY/
STATE/CAMPUS
ADDRESS | | FACILITIES(1) | | ENCUMBRANCES | | INITIAL COST TO COMPANY(1) | | COST CAPITALIZED SUBSEQUENT TO ACQUISITION(1)(2) | | GROSS AMOUNT CARRIED AT CLOSE OF CURRENT PERIOD(1)(8) | | ACCUMULATED DEPRECIATION AT CLOSE OF CURRENT PERIOD(1)(8) | | DATE OF CONSTRUCTION OR ACQUIRED(3) | LIFE ON WHICH
DEPRECIATION IN
LATEST INCOME
STATEMENT IS
COMPUTED |
| North America | | | | | | | | | | | | | | | | |
United States
(Including Puerto Rico) | | | | | | | | | | | | | | |
| 140 Oxmoor Ct, Birmingham, Alabama | | 1 | | | $ | — | | | $ | 1,322 | | | $ | 978 | | | $ | 2,300 | | | $ | 1,252 | | | 2001 | | Up to 40 years |
| 1420 North Fiesta Blvd, Gilbert, Arizona | | 1 | | | — | | | 1,637 | | | 2,777 | | | 4,414 | | | 2,291 | | | 2001 | | Up to 40 years |
| 4802 East Van Buren, Phoenix, Arizona | | 1 | | | — | | | 15,599 | | | 276,487 | | | 292,086 | | | 7,309 | | | 2019 | | Up to 40 years |
| 615 North 48th Street, Phoenix, Arizona | | 1 | | | — | | | 423,107 | | | 28,176 | | | 451,283 | | | 59,325 | | | 2018 | (5) | Up to 40 years |
| 2955 S. 18th Place, Phoenix, Arizona | | 1 | | | — | | | 12,178 | | | 14,690 | | | 26,868 | | | 6,956 | | | 2007 | | Up to 40 years |
| 4449 South 36th St, Phoenix, Arizona | | 1 | | | — | | | 7,305 | | | 1,059 | | | 8,364 | | | 5,355 | | | 2012 | | Up to 40 years |
| 8521 E. Princess Drive, Scottsdale, Arizona | | 1 | | | — | | | 87,865 | | | 2,576 | | | 90,441 | | | 16,742 | | | 2018 | (5) | Up to 40 years |
| 600 Burning Tree Rd, Fullerton, California | | 1 | | | — | | | 4,762 | | | 1,911 | | | 6,673 | | | 3,212 | | | 2002 | | Up to 40 years |
| 21063 Forbes St, Hayward, California | | 1 | | | — | | | 13,407 | | | 378 | | | 13,785 | | | 3,158 | | | 2019 | (9) | Up to 40 years |
| 1025 North Highland Ave, Los Angeles, California | | 1 | | | — | | | 10,168 | | | 27,117 | | | 37,285 | | | 16,371 | | | 1988 | | Up to 40 years |
| 1010 - 1006 North Mansfield, Los Angeles, California | | 1 | | | — | | | 749 | | | — | | | 749 | | | 147 | | | 2014 | | Up to 40 years |
| 1350 West Grand Ave, Oakland, California | | 1 | | | — | | | 15,172 | | | 7,606 | | | 22,778 | | | 15,728 | | | 1997 | | Up to 40 years |
| 1760 North Saint Thomas Circle, Orange, California | | 1 | | | — | | | 4,576 | | | 510 | | | 5,086 | | | 2,098 | | | 2002 | | Up to 40 years |
| 1915 South Grand Ave, Santa Ana, California | | 1 | | | — | | | 3,420 | | | 1,305 | | | 4,725 | | | 2,099 | | | 2001 | | Up to 40 years |
| 2680 Sequoia Dr, South Gate, California | | 1 | | | — | | | 6,329 | | | 2,914 | | | 9,243 | | | 4,416 | | | 2002 | | Up to 40 years |
| 336 Oyster Point Blvd, South San Francisco, California | | 1 | | | — | | | 15,100 | | | 233 | | | 15,333 | | | 2,717 | | | 2019 | (9) | Up to 40 years |
| 25250 South Schulte Rd, Tracy, California | | 1 | | | — | | | 3,049 | | | 1,785 | | | 4,834 | | | 2,379 | | | 2001 | | Up to 40 years |
| 3576 N. Moline, Aurora, Colorado | | 1 | | | — | | | 1,583 | | | 4,492 | | | 6,075 | | | 2,239 | | | 2001 | | Up to 40 years |
| 5151 E. 46th Ave, Denver, Colorado | | 1 | | | — | | | 6,312 | | | 724 | | | 7,036 | | | 1,974 | | | 2014 | | Up to 40 years |
| | | | | | | | |
| IRON MOUNTAIN 2021 FORM 10-K | 104 |
Part IV
IRON MOUNTAIN INCORPORATED
SCHEDULE III—SCHEDULE OF REAL ESTATE AND ACCUMULATED DEPRECIATION (CONTINUED)
DECEMBER 31, 2021
(Dollars in thousands)
| | | | | | | | | | | | | | | | | | | | | | | | | | | | | | | | | | | | | | | | | | | | | | | | | | |
| (A) | | | | (B) | | (C) | | (D) | | (E) | | (F) | | | | |
REGION/COUNTRY/
STATE/CAMPUS
ADDRESS | | FACILITIES(1) | | ENCUMBRANCES | | INITIAL COST TO COMPANY(1) | | COST CAPITALIZED SUBSEQUENT TO ACQUISITION(1)(2) | | GROSS AMOUNT CARRIED AT CLOSE OF CURRENT PERIOD(1)(8) | | ACCUMULATED DEPRECIATION AT CLOSE OF CURRENT PERIOD(1)(8) | | DATE OF CONSTRUCTION OR ACQUIRED(3) | LIFE ON WHICH
DEPRECIATION IN
LATEST INCOME
STATEMENT IS
COMPUTED |
| North America (continued) | | | | | | | | | | | | | | |
United States
(Including Puerto Rico
(continued) | | | | | | | | | | | | | | |
| 11333 E 53rd Ave, Denver, Colorado | | 1 | | | $ | — | | | $ | 7,403 | | | $ | 10,348 | | | $ | 17,751 | | | $ | 10,571 | | | 2001 | | Up to 40 years |
| 4300 Brighton Boulevard, Denver, Colorado | | 1 | | | — | | | 116,336 | | | 23,590 | | | 139,926 | | | 18,893 | | | 2017 | | Up to 40 years |
| 20 Eastern Park Rd, East Hartford, Connecticut | | 1 | | | — | | | 7,417 | | | 1,905 | | | 9,322 | | | 6,549 | | | 2002 | | Up to 40 years |
| Kennedy Road, Windsor, Connecticut | | 2 | | | — | | | 10,447 | | | 32,111 | | | 42,558 | | | 23,522 | | | 2001 | | Up to 40 years |
| 150-200 Todds Ln, Wilmington, Delaware | | 1 | | | — | | | 7,226 | | | 1,137 | | | 8,363 | | | 5,370 | | | 2002 | | Up to 40 years |
| 13280 Vantage Way, Jacksonville, Florida | | 1 | | | — | | | 1,853 | | | 590 | | | 2,443 | | | 1,085 | | | 2001 | | Up to 40 years |
| 12855 Starkey Rd, Largo, Florida | | 1 | | | — | | | 3,293 | | | 3,005 | | | 6,298 | | | 3,609 | | | 2001 | | Up to 40 years |
| 7801 Riviera Blvd, Miramar, Florida | | 1 | | | — | | | 8,250 | | | 264 | | | 8,514 | | | 1,247 | | | 2017 | | Up to 40 years |
| 10002 Satellite Blvd, Orlando, Florida | | 1 | | | — | | | 1,927 | | | 343 | | | 2,270 | | | 993 | | | 2001 | | Up to 40 years |
| 3501 Electronics Way, West Palm Beach, Florida | | 1 | | | — | | | 4,201 | | | 13,933 | | | 18,134 | | | 8,252 | | | 2001 | | Up to 40 years |
| 1890 MacArthur Blvd, Atlanta, Georgia | | 1 | | | — | | | 1,786 | | | 825 | | | 2,611 | | | 1,265 | | | 2002 | | Up to 40 years |
| 3881 Old Gordon Rd, Atlanta, Georgia | | 1 | | | — | | | 1,185 | | | 899 | | | 2,084 | | | 955 | | | 2001 | | Up to 40 years |
| 5319 Tulane Drive SW, Atlanta, Georgia | | 1 | | | — | | | 2,808 | | | 3,963 | | | 6,771 | | | 3,975 | | | 2002 | | Up to 40 years |
| 6111 Live Oak Parkway, Norcross, Georgia | | 1 | | | — | | | 3,542 | | | 2,802 | | | 6,344 | | | 683 | | | 2017 | | Up to 40 years |
| 3150 Nifda Dr, Smyrna, Georgia | | 1 | | | — | | | 463 | | | 779 | | | 1,242 | | | 795 | | | 1990 | | Up to 40 years |
| 2425 South Halsted St, Chicago, Illinois | | 1 | | | — | | | 7,470 | | | 1,717 | | | 9,187 | | | 4,694 | | | 2006 | | Up to 40 years |
| 1301 S. Rockwell St, Chicago, Illinois | | 1 | | | — | | | 7,947 | | | 20,032 | | | 27,979 | | | 17,288 | | | 1999 | | Up to 40 years |
| 2604 West 13th St, Chicago, Illinois | | 1 | | | $ | — | | | 404 | | | 2,954 | | | 3,358 | | | 2,948 | | | 2001 | | Up to 40 years |
| 2211 W. Pershing Rd, Chicago, Illinois | | 1 | | | — | | | 4,264 | | | 14,131 | | | 18,395 | | | 9,614 | | | 2001 | | Up to 40 years |
| | | | | | | | |
105 | IRON MOUNTAIN 2021 FORM 10-K | |
Part IV
IRON MOUNTAIN INCORPORATED
SCHEDULE III—SCHEDULE OF REAL ESTATE AND ACCUMULATED DEPRECIATION (CONTINUED)
DECEMBER 31, 2021
(Dollars in thousands)
| | | | | | | | | | | | | | | | | | | | | | | | | | | | | | | | | | | | | | | | | | | | | | | | | | |
| (A) | | | | (B) | | (C) | | (D) | | (E) | | (F) | | | | |
REGION/COUNTRY/
STATE/CAMPUS
ADDRESS | | FACILITIES(1) | | ENCUMBRANCES | | INITIAL COST TO COMPANY(1) | | COST CAPITALIZED SUBSEQUENT TO ACQUISITION(1)(2) | | GROSS AMOUNT CARRIED AT CLOSE OF CURRENT PERIOD(1)(8) | | ACCUMULATED DEPRECIATION AT CLOSE OF CURRENT PERIOD(1)(8) | | DATE OF CONSTRUCTION OR ACQUIRED(3) | LIFE ON WHICH
DEPRECIATION IN
LATEST INCOME
STATEMENT IS
COMPUTED |
| North America (continued) | | | | | | | | | | | | | | |
United States
(Including Puerto Rico)
(continued) | | | | | | | | | | | | | | |
| 2255 Pratt Blvd, Elk Grove, Illinois | | 1 | | | $ | — | | | $ | 1,989 | | | $ | 3,930 | | | $ | 5,919 | | | $ | 1,847 | | | 2000 | | Up to 40 years |
| 4175 Chandler Dr Opus No. Corp, Hanover Park, Illinois | | 1 | | | — | | | 22,048 | | | 2,909 | | | 24,957 | | | 11,051 | | | 2014 | | Up to 40 years |
| 2600 Beverly Drive, Lincoln, Illinois | | 1 | | | — | | | 1,378 | | | 938 | | | 2,316 | | | 382 | | | 2015 | | Up to 40 years |
| 6090 NE 14th Street, Des Moines, Iowa | | 1 | | | — | | | 622 | | | 511 | | | 1,133 | | | 478 | | | 2003 | | Up to 40 years |
| South 7th St, Louisville, Kentucky | | 4 | | | — | | | 709 | | | 14,664 | | | 15,373 | | | 6,482 | | | Various | | Up to 40 years |
| 26 Parkway Drive (fka 133 Pleasant), Scarborough, Maine | | 1 | | | — | | | 8,337 | | | 528 | | | 8,865 | | | 3,620 | | | 2015 | (9) | Up to 40 years |
| 8928 McGaw Ct, Columbia, Maryland | | 1 | | | — | | | 2,198 | | | 6,529 | | | 8,727 | | | 4,220 | | | 1999 | | Up to 40 years |
| 10641 Iron Bridge Rd, Jessup, Maryland | | 1 | | | — | | | 3,782 | | | 1,608 | | | 5,390 | | | 2,965 | | | 2000 | | Up to 40 years |
| 96 High St, Billerica, Massachusetts | | 1 | | | — | | | 3,221 | | | 3,956 | | | 7,177 | | | 3,901 | | | 1998 | | Up to 40 years |
| 120 Hampden St, Boston, Massachusetts | | 1 | | | — | | | 164 | | | 939 | | | 1,103 | | | 609 | | | 2002 | | Up to 40 years |
| 32 George St, Boston, Massachusetts | | 1 | | | — | | | 1,820 | | | 5,442 | | | 7,262 | | | 5,754 | | | 1991 | | Up to 40 years |
| 14500 Weston Pkwy, Cary, North Carolina | | 1 | | | — | | | 1,880 | | | 2,229 | | | 4,109 | | | 2,234 | | | 1999 | | Up to 40 years |
| 3435 Sharps Lot Rd, Dighton, Massachusetts | | 1 | | | — | | | 1,911 | | | 797 | | | 2,708 | | | 2,175 | | | 1999 | | Up to 40 years |
| 77 Constitution Boulevard, Franklin, Massachusetts | | 1 | | | — | | | 5,413 | | | 288 | | | 5,701 | | | 1,001 | | | 2014 | | Up to 40 years |
| Bearfoot Road, Northboro, Massachusetts | | 2 | | | — | | | 55,923 | | | 15,151 | | | 71,074 | | | 44,118 | | | Various | | Up to 40 years |
| 6601 Sterling Dr South, Sterling Heights, Michigan | | 1 | | | — | | | 1,294 | | | 1,255 | | | 2,549 | | | 1,332 | | | 2002 | | Up to 40 years |
| 31155 Wixom Rd, Wixom, Michigan | | 1 | | | — | | | 4,000 | | | 1,509 | | | 5,509 | | | 3,060 | | | 2001 | | Up to 40 years |
| 3140 Ryder Trail South, Earth City, Missouri | | 1 | | | — | | | 3,072 | | | 3,429 | | | 6,501 | | | 2,765 | | | 2004 | | Up to 40 years |
| Leavenworth St/18th St, Omaha, Nebraska | | 2 | | | — | | | 2,924 | | | 18,489 | | | 21,413 | | | 8,555 | | | Various | | Up to 40 years |
| | | | | | | | |
| IRON MOUNTAIN 2021 FORM 10-K | 106 |
Part IV
IRON MOUNTAIN INCORPORATED
SCHEDULE III—SCHEDULE OF REAL ESTATE AND ACCUMULATED DEPRECIATION (CONTINUED)
DECEMBER 31, 2021
(Dollars in thousands)
| | | | | | | | | | | | | | | | | | | | | | | | | | | | | | | | | | | | | | | | | | | | | | | | | | |
| (A) | | | | (B) | | (C) | | (D) | | (E) | | (F) | | | | |
REGION/COUNTRY/
STATE/CAMPUS
ADDRESS | | FACILITIES(1) | | ENCUMBRANCES | | INITIAL COST TO COMPANY(1) | | COST CAPITALIZED SUBSEQUENT TO ACQUISITION(1)(2) | | GROSS AMOUNT CARRIED AT CLOSE OF CURRENT PERIOD(1)(8) | | ACCUMULATED DEPRECIATION AT CLOSE OF CURRENT PERIOD(1)(8) | | DATE OF CONSTRUCTION OR ACQUIRED(3) | LIFE ON WHICH
DEPRECIATION IN
LATEST INCOME
STATEMENT IS
COMPUTED |
| North America (continued) | | | | | | | | | | | | | | |
United States
(Including Puerto Rico)
(continued) | | | | | | | | | | | | | | |
| 4105 North Lamb Blvd, Las Vegas, Nevada | | 1 | | | $ | — | | | $ | 3,430 | | | $ | 8,976 | | | $ | 12,406 | | | $ | 6,701 | | | 2002 | | Up to 40 years |
| 17 Hydro Plant Rd, Milton, New Hampshire | | 1 | | | — | | | 6,179 | | | 4,499 | | | 10,678 | | | 7,269 | | | 2001 | | Up to 40 years |
| 3003 Woodbridge Avenue, Edison, New Jersey | | 1 | | | — | | | 310,404 | | | 63,228 | | | 373,632 | | | 41,572 | | | 2018 | (5) | Up to 40 years |
| 811 Route 33, Freehold, New Jersey | | 3 | | | — | | | 38,697 | | | 59,867 | | | 98,564 | | | 59,006 | | | Various | | Up to 40 years |
| 51-69 & 77-81 Court St, Newark, New Jersey | | 1 | | | — | | | 11,734 | | | 10,532 | | | 22,266 | | | 2,899 | | | 2015 | | Up to 40 years |
| 560 Irvine Turner Blvd, Newark, New Jersey | | 1 | | | — | | | 9,522 | | | 2,875 | | | 12,397 | | | 1,350 | | | 2015 | | Up to 40 years |
| 231 Johnson Ave, Newark, New Jersey | | 1 | | | — | | | 8,945 | | | 2,907 | | | 11,852 | | | 1,457 | | | 2015 | | Up to 40 years |
| 650 Howard Avenue, Somerset, New Jersey | | 1 | | | — | | | 3,585 | | | 11,892 | | | 15,477 | | | 7,080 | | | 2006 | | Up to 40 years |
| 100 Bailey Ave, Buffalo, New York | | 1 | | | — | | | 1,324 | | | 11,413 | | | 12,737 | | | 7,530 | | | 1998 | | Up to 40 years |
| 64 Leone Ln, Chester, New York | | 1 | | | — | | | 5,086 | | | 1,450 | | | 6,536 | | | 3,740 | | | 2000 | | Up to 40 years |
| 1368 County Rd 8, Farmington, New York | | 1 | | | — | | | 2,611 | | | 4,908 | | | 7,519 | | | 5,120 | | | 1998 | | Up to 40 years |
| County Rd 10, Linlithgo, New York | | 2 | | | — | | | 102 | | | 3,249 | | | 3,351 | | | 1,912 | | | 2001 | | Up to 40 years |
| 37 Hurds Corner Road, Pawling, New York | | 1 | | | — | | | 4,323 | | | 1,371 | | | 5,694 | | | 2,673 | | | 2005 | | Up to 40 years |
| Ulster Ave/Route 9W, Port Ewen, New York | | 3 | | | — | | | 23,137 | | | 12,301 | | | 35,438 | | | 24,492 | | | 2001 | | Up to 40 years |
| Binnewater Rd, Rosendale, New York | | 2 | | | — | | | 5,142 | | | 11,992 | | | 17,134 | | | 8,301 | | | Various | | Up to 40 years |
| 220 Wavel St, Syracuse, New York | | 1 | | | — | | | 2,929 | | | 2,765 | | | 5,694 | | | 3,270 | | | 1997 | | Up to 40 years |
| 2235 Cessna Drive, Burlington, North Carolina | | 1 | | | — | | | 1,602 | | | 334 | | | 1,936 | | | 332 | | | 2015 | | Up to 40 years |
| 826 Church Street, Morrisville, North Carolina | | 1 | | | — | | | 7,087 | | | 266 | | | 7,353 | | | 1,780 | | | 2017 | | Up to 40 years |
| 1275 East 40th, Cleveland, Ohio | | 1 | | | — | | | 3,129 | | | 606 | | | 3,735 | | | 2,234 | | | 1999 | | Up to 40 years |
| 7208 Euclid Avenue, Cleveland, Ohio | | 1 | | | — | | | 3,336 | | | 4,140 | | | 7,476 | | | 3,795 | | | 2001 | | Up to 40 years |
| | | | | | | | |
107 | IRON MOUNTAIN 2021 FORM 10-K | |
Part IV
IRON MOUNTAIN INCORPORATED
SCHEDULE III—SCHEDULE OF REAL ESTATE AND ACCUMULATED DEPRECIATION (CONTINUED)
DECEMBER 31, 2021
(Dollars in thousands)
| | | | | | | | | | | | | | | | | | | | | | | | | | | | | | | | | | | | | | | | | | | | | | | | | | |
| (A) | | | | (B) | | (C) | | (D) | | (E) | | (F) | | | | |
REGION/COUNTRY/
STATE/CAMPUS
ADDRESS | | FACILITIES(1) | | ENCUMBRANCES | | INITIAL COST TO COMPANY(1) | | COST CAPITALIZED SUBSEQUENT TO ACQUISITION(1)(2) | | GROSS AMOUNT CARRIED AT CLOSE OF CURRENT PERIOD(1)(8) | | ACCUMULATED DEPRECIATION AT CLOSE OF CURRENT PERIOD(1)(8) | | DATE OF CONSTRUCTION OR ACQUIRED(3) | LIFE ON WHICH
DEPRECIATION IN
LATEST INCOME
STATEMENT IS
COMPUTED |
| North America (continued) | | | | | | | | | | | | | | |
United States
(Including Puerto Rico)
(continued) | | | | | | | | | | | | | | |
| 4260 Tuller Ridge Rd, Dublin, Ohio | | 1 | | | $ | — | | | $ | 1,030 | | | $ | 1,881 | | | $ | 2,911 | | | $ | 1,641 | | | 1999 | | Up to 40 years |
| 3366 South Tech Boulevard, Miamisburg, Ohio | | 1 | | | — | | | 29,092 | | | 1,291 | | | 30,383 | | | 4,165 | | | 2018 | (5) | Up to 40 years |
| 7530 N. Leadbetter Road, Portland, Oregon | | 1 | | | — | | | 5,187 | | | 1,874 | | | 7,061 | | | 4,449 | | | 2002 | | Up to 40 years |
| Branchton Rd, Boyers, Pennsylvania | | 2 | | | — | | | 21,166 | | | 253,496 | | | 274,662 | | | 79,855 | | | Various | | Up to 40 years |
| 800 Carpenters Crossings, Folcroft, Pennsylvania | | 1 | | | — | | | 2,457 | | | 1,055 | | | 3,512 | | | 2,257 | | | 2000 | | Up to 40 years |
| Las Flores Industrial Park, Rio Grande, Puerto Rico | | 1 | | | — | | | 4,185 | | | 3,598 | | | 7,783 | | | 4,971 | | | 2001 | | Up to 40 years |
| 24 Snake Hill Road, Chepachet, Rhode Island | | 1 | | | — | | | 2,659 | | | 2,254 | | | 4,913 | | | 3,308 | | | 2001 | | Up to 40 years |
| 1061 Carolina Pines Road, Columbia, South Carolina | | 1 | | | — | | | 11,776 | | | 2,413 | | | 14,189 | | | 4,189 | | | 2016 | (9) | Up to 40 years |
| 2301 Prosperity Way, Florence, South Carolina | | 1 | | | — | | | 2,846 | | | 1,287 | | | 4,133 | | | 1,625 | | | 2016 | (9) | Up to 40 years |
| Mitchell Street, Knoxville, Tennessee | | 2 | | | — | | | 718 | | | 4,575 | | | 5,293 | | | 2,438 | | | Various | | Up to 40 years |
| 6005 Dana Way, Nashville, Tennessee | | 2 | | | — | | | 1,827 | | | 3,671 | | | 5,498 | | | 2,290 | | | 2000 | | Up to 40 years |
| 6600 Metropolis Drive, Austin, Texas | | 1 | | | — | | | 4,519 | | | 454 | | | 4,973 | | | 1,700 | | | 2011 | | Up to 40 years |
| Capital Parkway, Carrollton, Texas | | 3 | | | — | | | 8,299 | | | 759 | | | 9,058 | | | 2,958 | | | 2015 | (9) | Up to 40 years |
| 1800 Columbian Club Dr, Carrolton, Texas | | 1 | | | — | | | 19,673 | | | 1,746 | | | 21,419 | | | 10,709 | | | 2013 | | Up to 40 years |
| 1905 John Connally Dr, Carrolton, Texas | | 1 | | | — | | | 2,174 | | | 868 | | | 3,042 | | | 1,555 | | | 2000 | | Up to 40 years |
| 13425 Branchview Ln, Dallas, Texas | | 1 | | | — | | | 3,518 | | | 3,693 | | | 7,211 | | | 4,470 | | | 2001 | | Up to 40 years |
| 1819 S. Lamar St, Dallas, Texas | | 1 | | | — | | | 3,215 | | | 1,768 | | | 4,983 | | | 2,828 | | | 2000 | | Up to 40 years |
| 2000 Robotics Place Suite B, Fort Worth, Texas | | 1 | | | — | | | 5,328 | | | 3,068 | | | 8,396 | | | 3,378 | | | 2002 | | Up to 40 years |
| 1202 Ave R, Grand Prairie, Texas | | 1 | | | — | | | 8,354 | | | 2,266 | | | 10,620 | | | 6,548 | | | 2003 | | Up to 40 years |
| | | | | | | | |
| IRON MOUNTAIN 2021 FORM 10-K | 108 |
Part IV
IRON MOUNTAIN INCORPORATED
SCHEDULE III—SCHEDULE OF REAL ESTATE AND ACCUMULATED DEPRECIATION (CONTINUED)
DECEMBER 31, 2021
(Dollars in thousands)
| | | | | | | | | | | | | | | | | | | | | | | | | | | | | | | | | | | | | | | | | | | | | | | | | | |
| (A) | | | | (B) | | (C) | | (D) | | (E) | | (F) | | | | |
REGION/COUNTRY/
STATE/CAMPUS
ADDRESS | | FACILITIES(1) | | ENCUMBRANCES | | INITIAL COST TO COMPANY(1) | | COST CAPITALIZED SUBSEQUENT TO ACQUISITION(1)(2) | | GROSS AMOUNT CARRIED AT CLOSE OF CURRENT PERIOD(1)(8) | | ACCUMULATED DEPRECIATION AT CLOSE OF CURRENT PERIOD(1)(8) | | DATE OF CONSTRUCTION OR ACQUIRED(3) | LIFE ON WHICH
DEPRECIATION IN
LATEST INCOME
STATEMENT IS
COMPUTED |
| North America (continued) | | | | | | | | | | | | | | |
United States
(Including Puerto Rico)
(continued) | | | | | | | | | | | | | | |
| 6203 Bingle Rd, Houston, Texas | | 1 | | | $ | — | | | $ | 3,188 | | | $ | 11,719 | | | $ | 14,907 | | | $ | 9,488 | | | 2001 | | Up to 40 years |
| 3502 Bissonnet St, Houston, Texas | | 1 | | | — | | | 7,687 | | | 734 | | | 8,421 | | | 6,228 | | | 2002 | | Up to 40 years |
| 2600 Center Street, Houston, Texas | | 1 | | | — | | | 2,840 | | | 2,619 | | | 5,459 | | | 2,857 | | | 2000 | | Up to 40 years |
| 5707 Chimney Rock, Houston, Texas | | 1 | | | — | | | 1,032 | | | 1,211 | | | 2,243 | | | 1,198 | | | 2002 | | Up to 40 years |
| 5249 Glenmont Ave, Houston, Texas | | 1 | | | — | | | 3,467 | | | 2,416 | | | 5,883 | | | 3,126 | | | 2000 | | Up to 40 years |
| 15333 Hempstead Hwy, Houston, Texas | | 3 | | | — | | | 6,327 | | | 38,154 | | | 44,481 | | | 16,481 | | | 2004 | | Up to 40 years |
| 5757 Royalton Dr, Houston, Texas | | 1 | | | — | | | 1,795 | | | 1,036 | | | 2,831 | | | 1,450 | | | 2000 | | Up to 40 years |
| 9601 West Tidwell, Houston, Texas | | 1 | | | — | | | 1,680 | | | 2,408 | | | 4,088 | | | 1,533 | | | 2001 | | Up to 40 years |
| 7800 Westpark, Houston, Texas | | 1 | | | — | | | 6,323 | | | 1,359 | | | 7,682 | | | 2,171 | | | 2015 | (9) | Up to 40 years |
| 1665 S. 5350 West, Salt Lake City, Utah | | 1 | | | — | | | 6,239 | | | 4,321 | | | 10,560 | | | 6,005 | | | 2002 | | Up to 40 years |
| 11052 Lakeridge Pkwy, Ashland, Virginia | | 1 | | | — | | | 1,709 | | | 1,927 | | | 3,636 | | | 2,107 | | | 1999 | | Up to 40 years |
| 2301 International Parkway, Fredericksburg, Virginia | | 1 | | | — | | | 20,980 | | | 194 | | | 21,174 | | | 7,023 | | | 2015 | (7) | Up to 40 years |
| 11660 Hayden Road, Manassas, Virginia | | 1 | | | — | | | 104,824 | | | 219,296 | | | 324,120 | | | 31,501 | | | 2020 | | Up to 40 years |
| 4555 Progress Road, Norfolk, Virginia | | 1 | | | — | | | 6,527 | | | 1,903 | | | 8,430 | | | 3,767 | | | 2011 | | Up to 40 years |
| 3725 Thirlane Rd. N.W., Roanoke, Virginia | | 1 | | | — | | | 2,577 | | | 287 | | | 2,864 | | | 1,337 | | | 2015 | (9) | Up to 40 years |
| 7700-7730 Southern Dr, Springfield, Virginia | | 1 | | | — | | | 14,167 | | | 2,830 | | | 16,997 | | | 10,053 | | | 2002 | | Up to 40 years |
| 22445 Randolph Dr, Sterling, Virginia | | 1 | | | — | | | 7,598 | | | 4,450 | | | 12,048 | | | 6,643 | | | 2005 | | Up to 40 years |
| 307 South 140th St, Burien, Washington | | 1 | | | — | | | 2,078 | | | 2,405 | | | 4,483 | | | 2,624 | | | 1999 | | Up to 40 years |
| 8908 W. Hallett Rd, Cheney, Washington | | 1 | | | — | | | 510 | | | 4,281 | | | 4,791 | | | 2,434 | | | 1999 | | Up to 40 years |
| | | | | | | | |
109 | IRON MOUNTAIN 2021 FORM 10-K | |
Part IV
IRON MOUNTAIN INCORPORATED
SCHEDULE III—SCHEDULE OF REAL ESTATE AND ACCUMULATED DEPRECIATION (CONTINUED)
DECEMBER 31, 2021
(Dollars in thousands)
| | | | | | | | | | | | | | | | | | | | | | | | | | | | | | | | | | | | | | | | | | | | | | | | | | |
| (A) | | | | (B) | | (C) | | (D) | | (E) | | (F) | | | | |
REGION/COUNTRY/
STATE/CAMPUS
ADDRESS | | FACILITIES(1) | | ENCUMBRANCES | | INITIAL COST TO COMPANY(1) | | COST CAPITALIZED SUBSEQUENT TO ACQUISITION(1)(2) | | GROSS AMOUNT CARRIED AT CLOSE OF CURRENT PERIOD(1)(8) | | ACCUMULATED DEPRECIATION AT CLOSE OF CURRENT PERIOD(1)(8) | | DATE OF CONSTRUCTION OR ACQUIRED(3) | LIFE ON WHICH
DEPRECIATION IN
LATEST INCOME
STATEMENT IS
COMPUTED |
| North America (continued) | | | | | | | | | | | | | | |
United States
(Including Puerto Rico)
(continued) | | | | | | | | | | | | | | |
| 6600 Hardeson Rd, Everett, Washington | | 1 | | | $ | — | | | $ | 5,399 | | | $ | 3,476 | | | $ | 8,875 | | | $ | 4,006 | | | 2002 | | Up to 40 years |
| 1201 N. 96th St, Seattle, Washington | | 1 | | | — | | | 4,496 | | | 2,655 | | | 7,151 | | | 3,926 | | | 2001 | | Up to 40 years |
| 4330 South Grove Road, Spokane, Washington | | 1 | | | — | | | 3,906 | | | 880 | | | 4,786 | | | 748 | | | 2015 | | Up to 40 years |
| 12021 West Bluemound Road, Wauwatosa, Wisconsin | | 1 | | | — | | | 1,307 | | | 2,143 | | | 3,450 | | | 1,640 | | | 1999 | | Up to 40 years |
| | 138 | | | $ | — | | | $ | 1,761,530 | | | $ | 1,420,439 | | | $ | 3,181,969 | | | $ | 850,818 | | | | | |
| | | | | | | | |
| IRON MOUNTAIN 2021 FORM 10-K | 110 |
Part IV
IRON MOUNTAIN INCORPORATED
SCHEDULE III—SCHEDULE OF REAL ESTATE AND ACCUMULATED DEPRECIATION (CONTINUED)
DECEMBER 31, 2021
(Dollars in thousands)
| | | | | | | | | | | | | | | | | | | | | | | | | | | | | |
| (A) | | (B) | (C) | (D) | (E) | (F) | | | |
REGION/COUNTRY/
STATE/CAMPUS
ADDRESS | FACILITIES(1) | ENCUMBRANCES | INITIAL COST TO COMPANY(1) | COST CAPITALIZED SUBSEQUENT TO ACQUISITION(1)(2) | GROSS AMOUNT CARRIED AT CLOSE OF CURRENT PERIOD(1)(8) | ACCUMULATED DEPRECIATION AT CLOSE OF CURRENT PERIOD(1)(8) | DATE OF CONSTRUCTION OR ACQUIRED(3) | LIFE ON WHICH
DEPRECIATION IN LATEST INCOME
STATEMENT IS
COMPUTED |
| North America (continued) | | | | | | | | |
| Canada | | | | | | | | | |
| One Command Court, Bedford | 1 | | $ | — | | $ | 3,847 | | $ | 4,768 | | $ | 8,615 | | $ | 4,794 | | 2000 | | Up to 40 years |
| 195 Summerlea Road, Brampton | 1 | | — | | 5,403 | | 7,123 | | 12,526 | | 6,452 | | 2000 | | Up to 40 years |
| 10 Tilbury Court, Brampton | 1 | | — | | 5,007 | | 18,163 | | 23,170 | | 9,865 | | 2000 | | Up to 40 years |
| 8825 Northbrook Court, Burnaby | 1 | | — | | 8,091 | | 2,601 | | 10,692 | | 5,330 | | 2001 | | Up to 40 years |
| 8088 Glenwood Drive, Burnaby | 1 | | — | | 4,326 | | 7,502 | | 11,828 | | 5,549 | | 2005 | | Up to 40 years |
| 5811 26th Street S.E., Calgary | 1 | | — | | 14,658 | | 9,829 | | 24,487 | | 12,767 | | 2000 | | Up to 40 years |
| 3905-101 Street, Edmonton | 1 | | — | | 2,020 | | 1,067 | | 3,087 | | 1,786 | | 2000 | | Up to 40 years |
| 68 Grant Timmins Drive, Kingston | 1 | | — | | 3,639 | | 790 | | 4,429 | | 587 | | 2016 | | Up to 40 years |
| 3005 Boul. Jean-Baptiste Deschamps, Lachine | 1 | | — | | 2,751 | | 831 | | 3,582 | | 1,606 | | 2000 | | Up to 40 years |
| 1655 Fleetwood, Laval | 1 | | — | | 8,196 | | 20,519 | | 28,715 | | 14,996 | | 2000 | | Up to 40 years |
| 4005 Richelieu, Montreal | 1 | | — | | 1,800 | | 2,702 | | 4,502 | | 2,067 | | 2000 | | Up to 40 years |
| 1209 Algoma Rd, Ottawa | 1 | | — | | 1,059 | | 7,210 | | 8,269 | | 4,738 | | 2000 | | Up to 40 years |
| 1650 Comstock Rd, Ottawa | 1 | | — | | 7,478 | | 116 | | 7,594 | | 3,074 | | 2017 | | Up to 40 years |
| 235 Edson Street, Saskatoon | 1 | | — | | 829 | | 1,748 | | 2,577 | | 1,038 | | 2008 | | Up to 40 years |
| 640 Coronation Drive, Scarborough | 1 | | — | | 1,853 | | 1,370 | | 3,223 | | 1,496 | | 2000 | | Up to 40 years |
| 610 Sprucewood Ave, Windsor | 1 | | — | | 1,243 | | 742 | | 1,985 | | 869 | | 2007 | | Up to 40 years |
| 16 | | $ | — | | $ | 72,200 | | $ | 87,081 | | $ | 159,281 | | $ | 77,014 | | | | |
| 154 | | $ | — | | $ | 1,833,730 | | $ | 1,507,520 | | $ | 3,341,250 | | $ | 927,832 | | | | |
| | | | | | | | |
111 | IRON MOUNTAIN 2021 FORM 10-K | |
Part IV
IRON MOUNTAIN INCORPORATED
SCHEDULE III—SCHEDULE OF REAL ESTATE AND ACCUMULATED DEPRECIATION (CONTINUED)
DECEMBER 31, 2021
(Dollars in thousands)
| | | | | | | | | | | | | | | | | | | | | | | | | | | | | |
| (A) | | (B) | (C) | (D) | (E) | (F) | | | |
REGION/COUNTRY/
STATE/CAMPUS
ADDRESS | FACILITIES(1) | ENCUMBRANCES | INITIAL COST TO COMPANY(1) | COST CAPITALIZED SUBSEQUENT TO ACQUISITION(1)(2) | GROSS AMOUNT CARRIED AT CLOSE OF CURRENT PERIOD(1)(8) | ACCUMULATED DEPRECIATION AT CLOSE OF CURRENT PERIOD(1)(8) | DATE OF CONSTRUCTION OR ACQUIRED(3) | LIFE ON WHICH
DEPRECIATION IN LATEST INCOME
STATEMENT IS
COMPUTED |
| Europe | | | | | | | | | |
| Gewerbeparkstr. 3, Vienna, Austria | 1 | | $ | — | | $ | 6,542 | | $ | 8,234 | | $ | 14,776 | | $ | 4,788 | | 2010 | | Up to 40 years |
| Woluwelaan 147, Diegem, Belgium | 1 | | — | | 2,541 | | 6,410 | | 8,951 | | 4,922 | | 2003 | | Up to 40 years |
| Stupničke Šipkovine 62, Zagreb, Croatia | 1 | | — | | 1,408 | | 1,517 | | 2,925 | | 221 | | 2003 | | Up to 40 years |
| Kratitirion 9 Kokkinotrimithia Industrial District, Nicosia, Cyprus | 1 | | — | | 3,136 | | 2,723 | | 5,859 | | 807 | | 2003 | | Up to 40 years |
| Karyatidon 1, Agios Sylas Industrial Area (3rd), Limassol, Cyprus | 1 | | — | | 1,935 | | (23) | | 1,912 | | 260 | | 2018 | | Up to 40 years |
| G2-B, Engineering Square IDG Developer’s Area, 6th Oct City Giza, Egypt | 1 | | — | | 8,984 | | 224 | | 9,208 | | 86 | | 2021 | (7) | Up to 40 years |
| 65 Egerton Road, Birmingham, England | 1 | | — | | 6,980 | | 2,169 | | 9,149 | | 5,451 | | 2003 | | Up to 40 years |
| Otterham Quay Lane, Gillingham, England | 9 | | — | | 7,418 | | 3,762 | | 11,180 | | 5,951 | | 2004 | | Up to 40 years |
| Kemble Industrial Park, Kemble, England | 2 | | — | | 5,277 | | 7,343 | | 12,620 | | 9,213 | | 2003 | | Up to 40 years |
| Gayton Road, Kings Lynn, England | 3 | | — | | 3,119 | | 1,809 | | 4,928 | | 3,117 | | 2003 | | Up to 40 years |
| 17 Broadgate, Oldham, England | 1 | | — | | 4,039 | | 468 | | 4,507 | | 2,631 | | 2008 | | Up to 40 years |
| Harpway Lane, Sopley, England | 1 | | — | | 681 | | 1,509 | | 2,190 | | 1,547 | | 2004 | | Up to 40 years |
| Unit 1A Broadmoor Road, Swindom, England | 1 | | — | | 2,636 | | 555 | | 3,191 | | 1,405 | | 2006 | | Up to 40 years |
| Jeumont-Schneider, Champagne Sur Seine, France | 3 | | — | | 1,750 | | 2,563 | | 4,313 | | 2,543 | | 2003 | | Up to 40 years |
| Bat I-VII Rue de Osiers, Coignieres, France | 4 | | — | | 21,318 | | (431) | | 20,887 | | 6,003 | | 2016 | (4) | Up to 40 years |
| 26 Rue de I Industrie, Fergersheim, France | 1 | | — | | 1,322 | | (14) | | 1,308 | | 367 | | 2016 | (4) | Up to 40 years |
| Bat A, B, C1, C2, C3 Rue Imperiale, Gue de Longroi, France | 1 | | — | | 3,390 | | 754 | | 4,144 | | 1,322 | | 2016 | (4) | Up to 40 years |
| Le Petit Courtin Site de Dois, Gueslin, Mingieres, France | 1 | | — | | 14,141 | | (44) | | 14,097 | | 2,876 | | 2016 | (4) | Up to 40 years |
| ZI des Sables, Morangis, France | 1 | | — | | 12,407 | | 15,637 | | 28,044 | | 20,016 | | 2004 | | Up to 40 years |
| | | | | | | | |
| IRON MOUNTAIN 2021 FORM 10-K | 112 |
Part IV
IRON MOUNTAIN INCORPORATED
SCHEDULE III—SCHEDULE OF REAL ESTATE AND ACCUMULATED DEPRECIATION (CONTINUED)
DECEMBER 31, 2021
(Dollars in thousands)
| | | | | | | | | | | | | | | | | | | | | | | | | | | | | |
| (A) | | (B) | (C) | (D) | (E) | (F) | | | |
REGION/COUNTRY/
STATE/CAMPUS
ADDRESS | FACILITIES(1) | ENCUMBRANCES | INITIAL COST TO COMPANY(1) | COST CAPITALIZED SUBSEQUENT TO ACQUISITION(1)(2) | GROSS AMOUNT CARRIED AT CLOSE OF CURRENT PERIOD(1)(8) | ACCUMULATED DEPRECIATION AT CLOSE OF CURRENT PERIOD(1)(8) | DATE OF CONSTRUCTION OR ACQUIRED(3) | LIFE ON WHICH
DEPRECIATION IN LATEST INCOME
STATEMENT IS
COMPUTED |
| Europe (continued) | | | | | | | | | |
| 45 Rue de Savoie, Manissieux, Saint Priest, France | $ | 1 | | $ | — | | $ | 5,546 | | $ | (103) | | $ | 5,443 | | $ | 1,201 | | 2016 | (4) | Up to 40 years |
| Heinrich Lanz Alee 47, Frankfurt, Germany | 1 | | — | | 80,591 | | (2,079) | | 78,512 | | — | | 2021 | (8) | Up to 40 years |
| Gutenbergstrabe 55, Hamburg, Germany | 1 | | — | | 4,022 | | 803 | | 4,825 | | 1,519 | | 2016 | (4) | Up to 40 years |
| Brommer Weg 1, Wipshausen, Germany | 1 | | — | | 3,220 | | 1,855 | | 5,075 | | 3,564 | | 2006 | | Up to 40 years |
| Warehouse and Offices 4 Springhill, Cork, Ireland | 1 | | — | | 9,040 | | 2,666 | | 11,706 | | 5,555 | | 2014 | | Up to 40 years |
| 17 Crag Terrace, Dublin, Ireland | 1 | | — | | 2,818 | | 783 | | 3,601 | | 1,531 | | 2001 | | Up to 40 years |
| Damastown Industrial Park, Dublin, Ireland | 1 | | — | | 16,034 | | 7,399 | | 23,433 | | 9,453 | | 2012 | | Up to 40 years |
| Al Qastal, Amman, Jordan | 1 | | — | | 1,431 | | 463 | | 1,894 | | 40 | | 2021 | (7) | Up to 40 years |
| Vareseweg 130, Rotterdam, The Netherlands | 1 | | — | | 1,357 | | 1,049 | | 2,406 | | 1,804 | | 2015 | (9) | Up to 40 years |
| Howemoss Drive, Aberdeen, Scotland | 2 | | — | | 6,970 | | 6,008 | | 12,978 | | 5,878 | | Various | | Up to 40 years |
| Traquair Road, Innerleithen, Scotland | 1 | | — | | 113 | | 2,235 | | 2,348 | | 1,305 | | 2004 | | Up to 40 years |
| Nettlehill Road, Houston Industrial Estate, Livingston, Scotland | 1 | | — | | 11,517 | | 28,248 | | 39,765 | | 20,910 | | 2001 | | Up to 40 years |
| Av Madrid s/n Poligono Industrial Matillas, Alcala de Henares, Spain | 1 | | — | | 186 | | 236 | | 422 | | 347 | | 2014 | | Up to 40 years |
| Calle Bronce, 37, Chiloeches, Spain | 1 | | — | | 11,011 | | 3,696 | | 14,707 | | 3,814 | | 2010 | | Up to 40 years |
| Ctra M.118 , Km.3 Parcela 3, Madrid, Spain | 1 | | — | | 3,981 | | 5,504 | | 9,485 | | 6,974 | | 2001 | | Up to 40 years |
| Abanto Ciervava, Spain | 2 | | — | | 1,053 | | (68) | | 985 | | 483 | | Various | | Up to 40 years |
| Plot No. S20704, Jebel Ali Free Zone Authority, United Arab Emirates | 1 | | — | | 29,300 | | 2,194 | | 31,494 | | 439 | | 2021 | (7) | Up to 40 years |
| 54 | | $ | — | | $ | 297,214 | | $ | 116,054 | | $ | 413,268 | | $ | 138,343 | | | | |
| | | | | | | | |
113 | IRON MOUNTAIN 2021 FORM 10-K | |
Part IV
IRON MOUNTAIN INCORPORATED
SCHEDULE III—SCHEDULE OF REAL ESTATE AND ACCUMULATED DEPRECIATION (CONTINUED)
DECEMBER 31, 2021
(Dollars in thousands)
| | | | | | | | | | | | | | | | | | | | | | | | | | | | | |
| (A) | | (B) | (C) | (D) | (E) | (F) | | | |
REGION/COUNTRY/
STATE/CAMPUS
ADDRESS | FACILITIES(1) | ENCUMBRANCES | INITIAL COST TO COMPANY(1) | COST CAPITALIZED SUBSEQUENT TO ACQUISITION(1)(2) | GROSS AMOUNT CARRIED AT CLOSE OF CURRENT PERIOD(1)(8) | ACCUMULATED DEPRECIATION AT CLOSE OF CURRENT PERIOD(1)(8) | DATE OF CONSTRUCTION OR ACQUIRED(3) | LIFE ON WHICH
DEPRECIATION IN LATEST INCOME
STATEMENT IS
COMPUTED |
| Latin America | | | | | | | | | |
| Amancio Alcorta 2396, Buenos Aires, Argentina | 2 | | $ | — | | $ | 655 | | $ | 872 | | $ | 1,527 | | $ | 410 | | Various | | Up to 40 years |
| Azara 1245, Buenos Aires, Argentina | 1 | | — | | 166 | | (164) | | 2 | | — | | 1998 | | Up to 40 years |
| Spegazzini, Ezeiza Buenos Aires, Argentina | 1 | | — | | 12,773 | | (10,726) | | 2,047 | | 497 | | 2012 | | Up to 40 years |
| Av Ernest de Moraes 815, Bairro Fim do Campo, Jarinu Brazil | 1 | | — | | 12,562 | | (5,091) | | 7,471 | | 1,726 | | 2016 | (4) | Up to 40 years |
| Rua Peri 80, Jundiai, Brazil | 1 | | — | | 8,894 | | (3,729) | | 5,165 | | 1,297 | | 2016 | (4) | Up to 40 years |
| Francisco de Souza e Melo, Rio de Janerio, Brazil | 3 | | — | | 1,868 | | 7,056 | | 8,924 | | 3,310 | | Various | | Up to 40 years |
| Hortolandia, Sao Paulo, Brazil | 1 | | | 24,078 | | (5,747) | | 18,331 | | 3,639 | | | | |
| El Taqueral 99, Santiago, Chile | 10 | | — | | 2,629 | | 28,322 | | 30,951 | | 11,863 | | Various | | Up to 40 years |
| Panamericana Norte 18900, Santiago, Chile | 7 | | — | | 4,001 | | 15,776 | | 19,777 | | 7,382 | | Various | | Up to 40 years |
Avenida Prolongacion
del Colli 1104, Guadalajara, Mexico | 1 | | — | | 374 | | 1,291 | | 1,665 | | 1,131 | | 2002 | | Up to 40 years |
| Privada Las Flores No. 25 (G3), Guadalajara, Mexico | 1 | | — | | 905 | | 1,160 | | 2,065 | | 1,049 | | 2004 | | Up to 40 years |
| Tula KM Parque de Las, Huehuetoca, Mexico | 2 | | — | | 19,937 | | (298) | | 19,639 | | 4,468 | | 2016 | (4) | Up to 40 years |
| Carretera Pesqueria Km2.5(M3), Monterrey, Mexico | 2 | | — | | 3,537 | | 4,400 | | 7,937 | | 3,889 | | 2004 | | Up to 40 years |
| Lote 2, Manzana A, (T2& T3), Toluca, Mexico | 1 | | — | | 2,204 | | 4,436 | | 6,640 | | 5,285 | | 2002 | | Up to 40 years |
| Prolongacion de la Calle 7 (T4), Toluca, Mexico | 1 | | — | | 7,544 | | 14,524 | | 22,068 | | 7,970 | | 2007 | | Up to 40 years |
| Panamericana Sur, KM 57.5, Lima, Peru | 7 | | — | | 1,549 | | 462 | | 2,011 | | 1,105 | | Various | | Up to 40 years |
| Av. Elmer Faucett 3462, Lima, Peru | 2 | | — | | 4,112 | | 4,161 | | 8,273 | | 4,239 | | Various | | Up to 40 years |
| Calle Los Claveles-Seccion 3, Lima, Peru | 1 | | — | | 8,179 | | 26,235 | | 34,414 | | 10,044 | | 2010 | | Up to 40 years |
| 45 | | $ | — | | $ | 115,967 | | $ | 82,940 | | $ | 198,907 | | $ | 69,304 | | | | |
| | | | | | | | |
| IRON MOUNTAIN 2021 FORM 10-K | 114 |
Part IV
IRON MOUNTAIN INCORPORATED
SCHEDULE III—SCHEDULE OF REAL ESTATE AND ACCUMULATED DEPRECIATION (CONTINUED)
DECEMBER 31, 2021
(Dollars in thousands)
| | | | | | | | | | | | | | | | | | | | | | | | | | | | | |
| (A) | | (B) | (C) | (D) | (E) | (F) | | | |
REGION/COUNTRY/
STATE/CAMPUS
ADDRESS | FACILITIES(1) | ENCUMBRANCES | INITIAL COST TO COMPANY(1) | COST CAPITALIZED SUBSEQUENT TO ACQUISITION(1)(2) | GROSS AMOUNT CARRIED AT CLOSE OF CURRENT PERIOD(1)(8) | ACCUMULATED DEPRECIATION AT CLOSE OF CURRENT PERIOD(1)(8) | DATE OF CONSTRUCTION OR ACQUIRED(3) | LIFE ON WHICH
DEPRECIATION IN
LATEST INCOME
STATEMENT IS
COMPUTED |
| Asia | | | | | | | | | |
| Warehouse No 4, Shanghai, China | 1 | | $ | — | | $ | 1,530 | | $ | 881 | | $ | 2,411 | | $ | 567 | | 2013 | | Up to 40 years |
| Jalan Karanggan Muda Raya No 59, Bogor Indonesia | 1 | | — | | 7,897 | | 5,142 | | 13,039 | | 2,999 | | 2017 | | Up to 40 years |
| Jl. Amd Projakal KM 5.5 Rt 46, Kel. Graha Indah, Kec. Balikpapan Utara, Indonesia | 1 | | — | | 125 | | — | | 125 | | 5 | | 2021 | | Up to 40 years |
| 1 Serangoon North Avenue 6, Singapore | 1 | | — | | 58,637 | | 52,044 | | 110,681 | | 10,931 | | 2018 | (9) | Up to 40 years |
| 2 Yung Ho Road, Singapore | 1 | | — | | 10,395 | | 1,780 | | 12,175 | | 2,884 | | 2016 | (4) | Up to 40 years |
| 26 Chin Bee Drive, Singapore | 1 | | — | | 15,699 | | 2,655 | | 18,354 | | 2,279 | | 2016 | (4) | Up to 40 years |
| IC1 69 Moo 2, Soi Wat Namdaeng, Bangkok, Thailand | 2 | | — | | 13,226 | | 1,445 | | 14,671 | | 4,651 | | 2016 | (4) | Up to 40 years |
| 8 | | $ | — | | $ | 107,509 | | $ | 63,947 | | $ | 171,456 | | $ | 24,316 | | | | |
| Australia | | | | | | | | | |
| 8 Whitestone Drive, Austins Ferry, Australia | 1 | | — | | 681 | | 2,646 | | 3,327 | | 559 | | 2012 | | Up to 40 years |
| 6 Norwich Street, South Launceston, Australia | 1 | | — | | 1,090 | | (47) | | 1,043 | | 136 | | 2015 | | Up to 40 years |
| 2 | | $ | — | | $ | 1,771 | | $ | 2,599 | | $ | 4,370 | | $ | 695 | | | | |
| Total | 263 | | $ | — | | $ | 2,356,191 | | $ | 1,773,060 | | $ | 4,129,251 | | $ | 1,160,490 | | | | |
(1)The above information only includes the real estate facilities that are owned. The gross cost includes the cost for land, land improvements, buildings, building improvements and racking. The listing does not reflect the 1,184 leased facilities in our real estate portfolio. In addition, the above information does not include any value for financing leases for property that is classified as land, buildings and building improvements in our consolidated financial statements.
(2)Amount includes cumulative impact of foreign currency translation fluctuations.
(3)Date of construction or acquired represents the date we constructed the facility or acquired the facility through purchase or acquisition.
(4)Property was acquired in connection with our acquisition of Recall Holdings Limited.
(5)Property was acquired in connection with our acquisition of IO Data Centers, LLC.
(6)Property was acquired in connection with our acquisition of Credit Suisse International and Credit Suisse AG.
(7)Property was acquired in connection with our acquisition of Information Fort, LLC.
(8)Property was acquired in connection with the Frankfurt data center acquisition.
(9)This date represents the date the categorization of the property was changed from a leased facility to an owned facility.
| | | | | | | | |
115 | IRON MOUNTAIN 2021 FORM 10-K | |
Part IV
IRON MOUNTAIN INCORPORATED
SCHEDULE III—SCHEDULE OF REAL ESTATE AND ACCUMULATED DEPRECIATION (CONTINUED)
DECEMBER 31, 2021
(Dollars in thousands)
(8)The following tables present the changes in gross carrying amount of real estate owned and accumulated depreciation for the years ended December 31, 2021 and 2020:
| | | | | | | | | | | | | | |
| | YEAR ENDED DECEMBER 31, |
| GROSS CARRYING AMOUNT OF REAL ESTATE | | 2021 | | 2020 |
| Gross amount at beginning of period | | $ | 3,830,489 | | | $ | 3,856,515 | |
| Additions during period: | | | | |
| Acquisitions | | 120,307 | | | — | |
| Discretionary capital projects | | 386,752 | | | 157,239 | |
Other adjustments(1) | | — | | | 66,978 | |
| Foreign currency translation fluctuations | | (51,363) | | | 10,198 | |
| | 455,696 | | | 234,415 | |
| Deductions during period: | | | | |
| Cost of real estate sold, disposed or written-down | | (119,154) | | | (178,869) | |
Other adjustments(2) | | (37,780) | | | (81,572) | |
| | | (156,934) | | | (260,441) | |
| | | | |
| Gross amount at end of period | | $ | 4,129,251 | | | $ | 3,830,489 | |
(1)For the year ended December 31, 2020, this includes previously recorded construction in progress, not classified as owned real estate at December 31, 2019.
(2)For the years ended December 31, 2021 and 2020, this includes the cost of racking associated with the facilities sold as part of the sale-leaseback transactions.
| | | | | | | | | | | | | | |
| | YEAR ENDED DECEMBER 31, |
| ACCUMULATED DEPRECIATION | | 2021 | | 2020 |
| Gross amount of accumulated depreciation at beginning of period | | $ | 1,097,616 | | | $ | 1,072,013 | |
| Additions during period: | | | | |
| Depreciation | | 147,134 | | | 123,447 | |
| Foreign currency translation fluctuations | | (15,135) | | | 8,590 | |
| | 131,999 | | | 132,037 | |
| Deductions during period: | | | | |
| Amount of accumulated depreciation for real estate assets sold, disposed or written-down | | (41,376) | | | (54,978) | |
Other adjustments(1) | | (27,749) | | | (51,456) | |
| | (69,125) | | | (106,434) | |
| | | | |
| Gross amount of end of period | | $ | 1,160,490 | | | $ | 1,097,616 | |
(1)For the years ended December 31, 2021 and 2020, this includes the accumulated depreciation of racking associated with the facilities sold as part of the sale-leaseback transactions.
The aggregate cost of our real estate assets for federal tax purposes at December 31, 2021 was approximately $3,910,000.
| | | | | | | | |
| IRON MOUNTAIN 2021 FORM 10-K | 116 |