Exhibit 13
FIVE-YEAR SUMMARY
| (in millions, except per share amounts) |
2006 | 2005 | 2004 | 2003 | 2002 | |||||||||||||||
| For the year |
||||||||||||||||||||
| Revenues |
$ | 47,829 | $ | 42,725 | $ | 37,445 | $ | 31,034 | $ | 28,212 | ||||||||||
| Research and development |
1,529 | 1,367 | 1,267 | 1,040 | 1,203 | |||||||||||||||
| Income before cumulative effect of a change in accounting principle 1 |
3,732 | 3,164 | 2,673 | 2,236 | 2,118 | |||||||||||||||
| Net income |
3,732 | 3,069 | 2,673 | 2,236 | 2,118 | |||||||||||||||
| Earnings per share: |
||||||||||||||||||||
| Basic: |
||||||||||||||||||||
| Income before cumulative effect of a change in accounting principle 1 |
3.81 | 3.19 | 2.69 | 2.33 | 2.21 | |||||||||||||||
| Cumulative effect of a change in accounting principle 1 |
— | (.09 | ) | — | — | — | ||||||||||||||
| Net income |
3.81 | 3.10 | 2.69 | 2.33 | 2.21 | |||||||||||||||
| Diluted: |
||||||||||||||||||||
| Income before cumulative effect of a change in accounting principle 1 |
3.71 | 3.12 | 2.64 | 2.22 | 2.09 | |||||||||||||||
| Cumulative effect of a change in accounting principle 1 |
— | (.09 | ) | — | — | — | ||||||||||||||
| Net income |
3.71 | 3.03 | 2.64 | 2.22 | 2.09 | |||||||||||||||
| Cash dividends per common share |
1.02 | .88 | .70 | .57 | .49 | |||||||||||||||
| Average number of shares of Common Stock outstanding: |
||||||||||||||||||||
| Basic |
980 | 991 | 993 | 948 | 945 | |||||||||||||||
| Diluted |
1,006 | 1,014 | 1,011 | 1,006 | 1,011 | |||||||||||||||
| Cash flow from operations |
4,803 | 4,334 | 3,596 | 2,827 | 2,829 | |||||||||||||||
| Voluntary pension contributions 2 |
190 | 663 | 906 | 994 | 530 | |||||||||||||||
| Capital expenditures |
954 | 929 | 795 | 530 | 586 | |||||||||||||||
| Acquisitions, including debt assumed |
1,049 | 4,583 | 1,295 | 2,305 | 424 | |||||||||||||||
| Share repurchase |
2,068 | 1,181 | 992 | 401 | 700 | |||||||||||||||
| Dividends on Common Stock 3 |
951 | 832 | 660 | 533 | 462 | |||||||||||||||
| At year end |
||||||||||||||||||||
| Working capital |
$ | 3,636 | $ | 1,861 | $ | 2,575 | $ | 2,069 | $ | 4,050 | ||||||||||
| Total assets 4 |
47,141 | 45,925 | 40,441 | 35,674 | 30,254 | |||||||||||||||
| Long-term debt, including current portion |
7,074 | 6,628 | 4,271 | 4,632 | 4,676 | |||||||||||||||
| Total debt |
7,931 | 8,240 | 5,591 | 5,301 | 4,873 | |||||||||||||||
| Debt to total capitalization 4 |
31 | % | 33 | % | 28 | % | 31 | % | 36 | % | ||||||||||
| ESOP Preferred Stock, net 5 |
— | — | — | — | 428 | |||||||||||||||
| Shareowners’ equity 4 |
17,297 | 16,991 | 14,266 | 11,953 | 8,557 | |||||||||||||||
| Number of employees |
214,500 | 218,200 | 209,700 | 203,300 | 155,000 | |||||||||||||||
| Note 1: | During 2005, we acquired Kidde, which in conjunction with Chubb (acquired during 2003) forms the UTC Fire & Security segment. |
| Note 2: | During 2005, a 2-for-1 split of our common stock was effected in the form of a share dividend. All common share and per share amounts for periods prior to the split have been adjusted to reflect the split. |
| 1 |
During 2005, we adopted the provisions of FIN 47, “Accounting for Conditional Asset Retirement Obligations” and SFAS 123R, “Share-Based Payment”. |
| 2 |
Represents the cash contribution amount. In addition, during 2006, 2005 and 2002 we contributed UTC common stock of $150, $157 and $253, respectively. |
| 3 |
Excludes dividends paid on Employee Stock Ownership Plan (ESOP) common stock. |
| 4 |
During 2006, we adopted the provisions of SFAS 158, “Employers’ Accounting for Defined Benefit Pension and Other Postretirement Plans – an amendment of FASB Statements No. 87,88,106 and 132(R),” which resulted in an approximately $1.8 billion non-cash charge to equity and a $2.4 billion non-cash reduction to total assets. |
| 5 |
During 2003, we converted all of our outstanding shares of ESOP Preferred Stock into common stock. |
1
| 2 |
| 3 |
| 4 |
Selling, General and Administrative
| (in millions of dollars) |
2006 | 2005 | 2004 | |||||||||
| Selling, general and administrative |
$ | 5,462 | $ | 5,241 | $ | 4,635 | ||||||
| Percentage of sales |
11.6 | % | 12.4 | % | 12.6 | % | ||||||
Both the 2006 and 2005 increase in selling, general and administrative expenses is due principally to acquisitions and general increases across the businesses in support of higher volumes. The reduction as a percent of sales is attributable to cost control initiatives and to the savings from prior restructuring actions.
Interest Expense
| (in millions of dollars) |
2006 | 2005 | 2004 | |||||||||
| Interest expense |
$ | 606 | $ | 498 | $ | 363 | ||||||
| Average interest rate during the year: |
||||||||||||
| Short-term borrowings |
6.2 | % | 5.5 | % | 4.9 | % | ||||||
| Total debt |
6.4 | % | 6.3 | % | 6.3 | % | ||||||
Interest expense increased in 2006, primarily as a result of the $2.4 billion issuance of long-term debt in April 2005 in connection with the acquisitions of Kidde, Rocketdyne and Lenel, higher average commercial paper balances, as well as higher average interest rates on short-term borrowings, and the additional $1.1 billion long-term debt issuance in May 2006. The increase in 2005 as compared to 2004 was also due to the April 2005 long-term debt issuance, a higher average commercial paper balance and higher average interest rates on short-term borrowings.
The average interest rate for commercial paper increased in 2006 as compared to 2005 generating the increase in the average short-term borrowing rate. The weighted-average interest rate applicable to debt outstanding at December 31, 2006 was 5.9% for short-term borrowings and 6.1% for total debt as compared to 5.2% and 6.1%, respectively, at December 31, 2005.
Income Taxes
| 2006 | 2005 | 2004 | |||||||
| Effective income tax rate |
27.2 | % | 26.8 | % | 26.2 | % |
The effective tax rate for 2006, 2005 and 2004 reflects the tax benefit associated with lower tax rates on international earnings, which we intend to permanently reinvest outside the United States.
In the normal course of business, various tax authorities examine us, including the IRS. The 2005 effective tax rate reflects an approximately $66 million reduction in tax expense primarily as a result of the reevaluation of our liabilities and contingencies in light of the completion and commencement of exam cycles. In 2006, a residual disputed issue related to the 1999 disposition of a business segment was settled with the Appeals Division of the IRS and was reviewed by the U.S. Congress Joint Committee on Taxation. The settlement resulted in an approximately $35 million reduction in tax expense. The 2004 effective tax rate reflects an approximately $80 million reduction in tax expense as a result of a settlement with the IRS with respect to claims and other disputed items related to the 1986 to 1993 tax years. In 2007, we expect that the IRS will complete the examination phase of the 2000 through 2003 audit and commence examination of 2004 and 2005. Although the outcome of these matters cannot currently be determined, we believe adequate provision has been made for any potentially unfavorable financial statement impact.
The 2005 effective rate reflects a benefit of approximately $135 million related to an amended return, filed in 2005, which claimed credits for 2003 foreign taxes previously recognized as deductions. The 2005 effective tax rate also reflects a tax benefit of approximately $19 million associated with noncore business divestitures. We recognized a tax cost related to the tax gain from the sale of a Hamilton Sundstrand division, and tax benefits related to tax losses from the sale of a Carrier refrigeration operation and the sale and liquidation of a Pratt & Whitney subsidiary. The third-party sales did not result in significant pre-tax gains or losses for financial reporting purposes.
The American Jobs Creation Act, signed into law in October 2004, provided an opportunity in 2005 to repatriate up to $500 million of reinvested foreign earnings and to claim an 85% dividend received deduction against the repatriated amount. We evaluated the potential effects of the repatriation provision and decided not to repatriate earnings under the provision.
We expect our effective income tax rate in 2007 to be approximately 28%, before the impacts of any discrete events.
| 5 |
For additional discussion of income taxes, see “Critical Accounting Estimates – Income Taxes” and Note 9 to the Consolidated Financial Statements.
Net Income and Earnings Per Share
| (in millions of dollars, except per share amounts) |
2006 | 2005 | 2004 | |||||||
| Income before cumulative effect of a change in accounting principle |
$ | 3,732 | $ | 3,164 | $ | 2,673 | ||||
| Cumulative effect of a change in accounting principle |
— | (95 | ) | — | ||||||
| Net income |
$ | 3,732 | $ | 3,069 | $ | 2,673 | ||||
| Diluted Earnings per Share: |
||||||||||
| Income before cumulative effect of a change in accounting principle |
$ | 3.71 | $ | 3.12 | $ | 2.64 | ||||
| Cumulative effect of a change in accounting principle |
— | (.09 | ) | — | ||||||
| Diluted Earnings per Share |
$ | 3.71 | $ | 3.03 | $ | 2.64 | ||||
Foreign currency translation had a favorable impact of $.01 per share in 2006, did not have a significant impact on earnings per share in 2005 and had a favorable impact of $.09 per share in 2004. As discussed in Note 1 to the Consolidated Financial Statements, we adopted the provisions of Financial Accounting Standards Board (FASB) Interpretation No. 47, “Accounting for Conditional Asset Retirement Obligations (an interpretation of FASB Statement No. 143)” effective December 31, 2005. The cumulative effect of this adoption reduced 2005 diluted earnings per share by $.09 and did not have a significant impact to 2006 operating results.
Restructuring and Other Costs
We recorded net pre-tax restructuring and related charges totaling $288 million in 2006 and $267 million in 2005 for new and ongoing restructuring actions. We recorded these charges in the segments as follows:
| (in millions of dollars) |
2006 | 2005 | ||||
| Otis |
$ | 46 | $ | 52 | ||
| Carrier |
69 | 80 | ||||
| UTC Fire & Security |
44 | 21 | ||||
| Pratt & Whitney |
68 | 39 | ||||
| Hamilton Sundstrand |
40 | 66 | ||||
| Sikorsky |
21 | 3 | ||||
| Eliminations and Other |
— | 6 | ||||
The 2006 charges include $223 million in cost of sales, $64 million in selling, general and administrative expenses and $1 million in other income. The 2005 charges include $180 million in cost of sales, $73 million in selling, general and administrative expenses and $14 million in other income. As described below, these charges relate to actions initiated during 2006, 2005 and certain actions initiated in the fourth quarter of 2004.
Restructuring actions are an essential component of our operating margin improvement efforts and relate to both existing operations and those recently acquired. We have acquired certain businesses at beneficial values, such as Linde, Chubb and Kidde, with the expectation of restructuring the underlying cost structure in order to bring operating margins up to expected levels. Restructuring actions focus on streamlining costs through workforce reductions, the consolidation of manufacturing, sales and service facilities, and the transfer of work to more cost-effective locations. For acquisitions, the costs of restructuring actions, contemplated at the date of acquisition, are recorded under purchase accounting. Actions initiated subsequently are recorded through operating results.
2006 Actions. During 2006, we initiated restructuring actions relating to ongoing cost reduction efforts, including selling, general and administrative reductions, principally at Carrier and UTC Fire & Security; workforce reductions, principally in Korea at Otis and Carrier and voluntary separations at Sikorsky; and the consolidation of manufacturing facilities. These actions, when complete, will provide for workforce reductions of approximately 3,800 hourly and salaried employees, the exiting of approximately 500,000 net square feet of facilities and the disposal of assets associated with the exited facilities. Savings are expected to increase over the two-year period subsequent to initiating the actions, resulting in recurring pre-tax savings of approximately $150 million. We expect pre-tax cash outflows on these programs to be approximately $230 million, of which $130 million has been funded to date.
| 6 |
Segment Review
| Revenues | Operating Profits | Operating Profit Margin |
|||||||||||||||||||||||||
| (in millions of dollars) |
2006 | 2005 | 2004 | 2006 | 2005 | 2004 | 2006 | 2005 | 2004 | ||||||||||||||||||
| Otis |
$ | 10,290 | $ | 9,575 | $ | 8,937 | $ | 1,888 | $ | 1,712 | $ | 1,413 | 18.3 | % | 17.9 | % | 15.8 | % | |||||||||
| Carrier |
13,481 | 12,512 | 10,620 | 1,237 | 1,104 | 830 | 9.2 | % | 8.8 | % | 7.8 | % | |||||||||||||||
| UTC Fire & Security |
4,747 | 4,250 | 2,879 | 301 | 235 | 130 | 6.3 | % | 5.5 | % | 4.5 | % | |||||||||||||||
| Pratt & Whitney |
11,112 | 9,295 | 8,281 | 1,817 | 1,449 | 1,083 | 16.4 | % | 15.6 | % | 13.1 | % | |||||||||||||||
| Hamilton Sundstrand |
4,995 | 4,382 | 3,921 | 832 | 675 | 583 | 16.7 | % | 15.4 | % | 14.9 | % | |||||||||||||||
| Sikorsky |
3,230 | 2,802 | 2,506 | 173 | 250 | 200 | 5.4 | % | 8.9 | % | 8.0 | % | |||||||||||||||
7
In 2006, Otis revenues increased $715 million (7%), reflecting growth in all geographic regions aided by a strong opening backlog in North America, Europe and China. The 2006 increase reflects volume growth (6%) and the favorable impact of foreign currency translation (1%). The 2005 increase of $638 million (7%) reflects volume growth (5%) in all geographic regions, and the favorable impact of foreign currency translation (2%).
Otis operating profits increased $176 million (10%) in 2006 compared with 2005. The operating profit increase reflects profit improvement at constant currency due to higher volume, product cost reduction and operational efficiencies (9%) and the favorable impact of foreign currency translation (1%). Operating profits increased $299 million (21%) in 2005 compared to 2004. The operating profit increase reflects profit improvement at constant currency due to higher volume, product cost reduction and operational efficiencies (12%), lower restructuring charges (7%) and the favorable impact of foreign currency translation (2%).
CARRIER is the world’s largest manufacturer and distributor of HVAC and refrigeration systems. It also produces food service equipment and HVAC and refrigeration related controls for residential, commercial, industrial and transportation applications. Carrier also provides installation, retrofit and aftermarket services and components for the products it sells and those of other manufacturers in the HVAC and refrigeration industries. Sales are made both directly to the end customer and through manufacturers’ representatives, distributors, wholesalers, dealers and retail outlets.
In the first half of 2006, strong demand in the commercial HVAC and refrigeration business, a positive North American construction market and a transition in the U.S. residential market to the higher value 13 SEER product, all contributed to generate strong organic growth. Volume growth within transport refrigeration was generated primarily in the truck/trailer refrigeration business as the container refrigeration market was essentially flat. While both the North American and international commercial HVAC and refrigeration markets remained strong throughout the balance of the year, a significant downturn in the North American residential housing industry and difficult compares from the 2005 13 SEER pre-buy led to declining orders and shipments in Carrier’s residential business in the second half of 2006. Carrier’s residential split system unit shipments dropped by approximately 30% in the third quarter and 50% in the fourth quarter. Further contributing to the second-half reduction in North American residential revenues was a decline in gas furnace shipments due to the softening housing market and the unseasonably mild weather at the end of 2006.
As a result of commodity cost increases in 2006 and 2005, Carrier implemented price increases on many of its products, which partially offset the impact in both years. Cost pressures from commodity price increases are expected to continue in 2007, however, we expect to offset these increases
through additional price increases. Certain of Carrier’s HVAC businesses are seasonal and are impacted by weather. Carrier customarily offers its customers incentives to purchase products to ensure adequate supply of our products in the distribution channel.
Carrier’s revenues increased $969 million (8%) in 2006 compared to 2005. Organic revenue growth for the year was 5%, driven primarily by the commercial and international HVAC businesses. Unit orders in the North American residential market declined substantially due to a market downturn and the 13 SEER pre-buy activity. However, revenues increased overall as a result of higher value 13 SEER product and pricing increases. Revenues from acquisitions (1%), the favorable impact of foreign currency translation (1%) and gains from dispositions (1%), principally the third quarter 2006 sale of Carrier’s interest in a compressor manufacturing joint venture, generated the remaining revenue growth. Revenues increased $1,892 million (18%) in 2005 compared to 2004. The increase primarily resulted from acquisitions (9%), principally Linde, and growth in the North American HVAC business (6%).
Carrier’s operating profits increased $133 million (12%) in 2006 compared to 2005. The operating profit improvement was generated principally by higher volumes and the benefits from previous restructuring actions, partially offset by manufacturing inefficiencies associated with the ramp up of 13 SEER production and the decline in North American residential volume (net 7%). Gains from dispositions (6%), principally the third quarter 2006 sale of Carrier’s interest in a compressor manufacturing joint venture, lower restructuring charges (1%) and the favorable impact of foreign currency translation (1%) were partially offset by the impact of higher commodity and energy costs, net of price increases (3%). Carrier’s operating profits increased $274 million (33%) in 2005 compared to 2004 due in large part to a reduction in restructuring charges of $161 million (19%). The net impact of higher volumes and restructuring benefits (15%), Linde (8%), and favorable currency translation (1%) was partially offset by higher commodity costs including a related last-in, first-out (LIFO) charge, net of price increases (6%) and the expenses related to the new 13 SEER platform (4%).
UTC FIRE & SECURITY is a global provider of security and fire safety products and services. We created the UTC Fire & Security segment in the second quarter of 2005 upon acquiring Kidde. The UTC Fire & Security segment includes our former Chubb segment, Kidde’s industrial, retail and commercial fire safety businesses and Lenel, a leader in the development and delivery of scalable, integrated security software systems and business solutions. In the electronic security industry, UTC Fire & Security provides system integration, installation and service of intruder alarms, access control systems and video
| 8 |
surveillance systems. In the fire safety industry, UTC Fire & Security designs, manufactures, integrates, installs and services fire and specialty hazard detection and fixed suppression systems and manufactures, sells and services portable fire extinguishers and other fire fighting equipment. UTC Fire & Security also provides monitoring, response and security personnel services, including cash-in-transit security, to complement its electronic security and fire safety businesses. UTC Fire & Security’s operations are predominantly outside the U.S. UTC Fire & Security sells directly to the customer as well as through manufacturers’ representatives, distributors and dealers.
UTC Fire & Security’s revenues increased $497 million (12%) in 2006 as compared with 2005 due largely to acquisitions (10%), principally Kidde, with volume, price increases and foreign exchange translation (combined 2%) contributing the remainder. Revenues increased $1,371 million (48%) in 2005 as compared with 2004 due largely to the acquisition of Kidde (43%) in the second quarter. Volume and pricing increases (combined 3%) and foreign currency translation (2%), contributed the remainder.
Operating profit increased $66 million (28%) in 2006 as compared with 2005. The majority of the operating profit increase was generated principally from the cost reductions realized on previous restructuring actions and some slight volume related impact (combined 35%), in line with management’s focus on integration efforts and margin expansion. Further operating profit increases from acquisitions (9%), principally Kidde, were offset by additional restructuring charges (10%) and the adverse impact of higher commodity costs (4%). Operating profit increased $105 million (81%) in 2005 as compared with 2004, with acquisitions (63%) contributing the majority. The balance of the operating profit increase was generated principally from increased volume, pricing and net cost reductions from previous restructuring actions (combined 27%), offset partially by additional restructuring charges (16%).
Aerospace Businesses
The financial performance of Pratt & Whitney, Hamilton Sundstrand and Sikorsky is directly tied to the economic conditions of the commercial aerospace and defense industries. Traffic growth, load factors, worldwide airline profits, general economic activity and global defense spending have been reliable indicators for new aircraft and aftermarket orders in the aerospace industry. Spare part sales and aftermarket service trends are affected by many factors including usage, pricing, regulatory changes and retirement of older aircraft. Performance in the general aviation sector is closely tied to the overall health of the economy and is positively correlated to corporate profits.
The continued growth in revenue passenger miles (RPMs) is benefiting both commercial aircraft production as well as aftermarket service and spares revenue levels. However, as the commercial airline industry continues its recovery after years of poor financial performance, which was exacerbated by escalating fuel prices, airlines and aircraft manufacturers will continue to pursue lower-cost products and services from their suppliers. The bankruptcy filings of major U.S. airlines during 2005 did not have a significant impact on our operating results. Notwithstanding the poor health of the airlines, strong production levels at airframers, as well as the continued high usage of aircraft, as evidenced by the growth in RPMs, drove growth in the aerospace businesses in 2006. Growth was further augmented by strong commercial helicopter sales, resulting partially from higher corporate profits and increased oil industry activity, and record military helicopter orders. Further increases in RPMs and continued positive global economic conditions are expected to result in additional increases to commercial aerospace volume in 2007. However, the rate of growth in the commercial aerospace aftermarket realized in 2006 is not expected to be sustainable and is projected to decline in 2007 to approximately half of the 2006 levels.
Our total sales to the U.S. government increased in 2006 to $6.4 billion or 14% of total sales, compared with $5.8 billion or 14% of total sales in 2005 and $5.5 billion or 15% of total sales in 2004. The defense portion of our aerospace business is affected by changes in market demand and the global political environment. Our participation in long-term production and development programs for the U.S. government has contributed positively to our results in 2006 and is expected to continue to benefit results in 2007.
PRATT & WHITNEY is among the world’s leading suppliers of commercial, general aviation and military aircraft engines. Pratt & Whitney’s Global Service Partners provides maintenance, repair and overhaul services, including the sale of spare parts, as well as fleet management services. Pratt & Whitney produces families of engines for wide, narrow body and military aircraft that power both Boeing and Airbus aircraft. Pratt & Whitney also sells engines for auxiliary power units, industrial applications and space propulsion systems. Pratt & Whitney Canada (P&WC) is a world leader for engines powering business, regional, light jet, utility and military aircraft and helicopters. Pratt & Whitney Rocketdyne (PWR) is a leader in the design, development and manufacture of sophisticated aerospace propulsion systems for military and commercial applications, including the space shuttle. Pratt & Whitney’s products are sold principally to aircraft manufacturers, airlines and other aircraft operators, aircraft leasing companies, space launch vehicle providers and U.S. and foreign governments. During 2006, Pratt & Whitney launched Global Material Solutions, a new business that intends to engineer, certify, manufacture, sell, distribute and service new OEM caliber parts, including life limited parts, for CFM56-3® engines. Pratt &
| 9 |
| 10 |
Operating profits increased $92 million (16%) in 2005 as compared with 2004 due principally to the net impact of acquisitions and divestitures (11%) and volume growth in both the commercial aftermarket (6%) and industrial businesses (2%). This operating profit improvement was partially offset by the effects of increased development spending, net of gains on the disposition of noncore businesses, principally Falk.
SIKORSKY is one of the world’s largest manufacturers of military and commercial helicopters and also provides aftermarket helicopter and aircraft parts and services. Current production programs at Sikorsky include the UH-60L and UH-60M Black Hawk medium-transport helicopters for the U.S. and foreign governments, the MH-60S and MH-60R helicopters for the U.S. Navy, the International Naval Hawk for multiple naval missions, and the S-76 and the S-92 helicopters for commercial operations. Sikorsky is also developing the U.S. Marine Corps CH-53K next generation heavy lift helicopter. Sikorsky’s aftermarket business includes spare parts sales, overhaul and repair services, maintenance contracts, and logistics support programs for helicopters and other aircraft. Sales are made directly by Sikorsky and by its subsidiaries and joint ventures. Sikorsky is increasingly engaging in logistics support programs and partnering with its government and commercial customers to manage and provide maintenance and repair services.
As discussed previously, Sikorsky’s operating results were adversely impacted by a strike of its union workforce from February through early April 2006. Although helicopter deliveries improved significantly following the resumption of full production after settlement of the strike, Sikorsky incurred additional manufacturing costs as it worked to accommodate the steep ramp up needed to meet the requirements of both a record backlog and more complex helicopters. Concurrently, Sikorsky also worked to reconfigure its manufacturing processes, including the sourcing of certain manufacturing activities.
Sikorsky’s revenues increased $428 million (15%) in 2006 as compared to 2005. Increases in commercial and military aircraft deliveries (2%), strong aftermarket sales (5%) and acquisitions (5%) contributed the majority of the increase in revenues. The remainder of the revenue increase was attributable to program support and development efforts. Revenues increased $296 million (12%) in 2005 as compared to 2004 with commercial aircraft deliveries (10%) and strong aftermarket sales (10%), offsetting the loss of Comanche revenues (10%).
Sikorsky’s operating profit decreased $77 million (31%) in 2006 as compared to 2005. The profit contribution from higher revenues was more than offset by higher manufacturing costs at Sikorsky related to the strike and subsequent ramp up to full production (net 16%). The adverse impact of commodity and energy prices (10%) and an increase in restructuring costs (7%), offset in part by the contribution from acquisitions (2%), comprised the remainder. Operating profit increased $50 million (25%) in
2005 as compared to 2004 due principally to higher aircraft and aftermarket volume (47%). The balance of the operating profit change primarily reflects the termination of the Comanche program (12%) and an increase in development spending (11%), offset by lower restructuring charges (3%).
Liquidity and Financing Commitments
| (in millions of dollars) |
2006 | 2005 | ||||||
| Cash and cash equivalents |
$ | 2,546 | $ | 2,247 | ||||
| Total debt |
7,931 | 8,240 | ||||||
| Net debt (total debt less cash and cash equivalents) |
5,385 | 5,993 | ||||||
| Shareowners’ equity |
17,297 | 16,991 | ||||||
| Total capitalization (debt plus equity) |
25,228 | 25,231 | ||||||
| Net capitalization (debt plus equity less cash and cash equivalents) |
22,682 | 22,984 | ||||||
| Debt to total capitalization |
31 | % | 33 | % | ||||
| Net debt to net capitalization |
24 | % | 26 | % | ||||
We adopted the provisions of Statement of Financial Accounting Standards No. 158, “Employers’ Accounting for Defined Benefit Pension and Other Postretirement Plans – an amendment of FASB Statements No. 87, 88, 106 and 132(R)” (SFAS 158) on December 31, 2006. The adoption resulted in a decrease in total assets by approximately $2.4 billion, an increase of total liabilities by approximately $549 million and a reduction of total shareowners’ equity by approximately $1.8 billion, net of tax. The impact of the adoption had an adverse impact on our debt to total capitalization and net debt to net capitalization of two percentage points in 2006.
We assess our liquidity in terms of our ability to generate cash to fund our operating, investing and financing activities. Our principal source of liquidity is operating cash flows, which, after netting out capital expenditures, we target to equal or exceed net income. In addition to operating cash flows, other significant factors that affect our overall management of liquidity include: capital expenditures, customer financing requirements, investments in businesses, dividends, common stock repurchases, pension funding, adequacy of available bank lines of credit, and the ability to attract long-term capital at satisfactory terms.
| 11 |
| 12 |
| 13 |
from the need to make estimates about the effects of matters that are inherently uncertain. The most significant areas involving management judgments and estimates are described below. Actual results in these areas could differ from management’s estimates.
LONG-TERM CONTRACT ACCOUNTING. We utilize percentage of completion accounting on certain of our long-term contracts. The percentage of completion method requires estimates of future revenues and costs over the full term of product delivery.
Losses, if any, on long-term contracts are provided for when anticipated. We recognize loss provisions on original equipment contracts to the extent that estimated inventoriable manufacturing, engineering, product warranty and product performance guarantee costs exceed the projected revenue from the products contemplated under the contractual arrangement. Products contemplated under the contractual arrangement include products purchased under the contract and, in the aerospace businesses, required replacement parts that are purchased separately and subsequently for incorporation into the original equipment. Revenue projections used in determining contract loss provisions are based upon estimates of the quantity, pricing and timing of future product deliveries. We recognize losses on shipment to the extent that inventoriable manufacturing costs, estimated warranty costs and product performance guarantee costs exceed revenue realized. We measure the extent of progress toward completion on our long-term commercial aerospace equipment and helicopter contracts using units of delivery. In addition, we use the cost-to-cost method for development contracts in the aerospace businesses and for elevator and escalator sales, installation and modernization contracts in the commercial businesses. For long-term aftermarket contracts, we recognize revenue over the contract period in proportion to the costs expected to be incurred in performing services under the contract. Contract accounting also requires estimates of future costs over the performance period of the contract as well as an estimate of award fees and other sources of revenue.
Contract costs are incurred over a period of time, which can be several years, and the estimation of these costs requires management’s judgment. The long-term nature of these contracts, the complexity of the products, and the strict safety and performance standards under which they are regulated can affect our ability to estimate costs precisely. As a result, we review and update our cost estimates on significant contracts on a quarterly basis, and no less than annually for all others, or when circumstances change and warrant a modification to a previous estimate. We record adjustments to contract loss provisions in earnings when identified.
INCOME TAXES. The future tax benefit arising from net deductible temporary differences and tax carryforwards is $3.0 billion at December 31, 2006 and $2.1 billion at December 31, 2005. Management believes that our earnings during the periods when the temporary differences become
deductible will be sufficient to realize the related future income tax benefits. For those jurisdictions where the expiration date of tax carryforwards or the projected operating results indicate that realization is not likely, a valuation allowance is provided.
In assessing the need for a valuation allowance, we estimate future taxable income, considering the feasibility of ongoing tax planning strategies and the realizability of tax loss carryforwards. Valuation allowances related to deferred tax assets can be affected by changes to tax laws, changes to statutory tax rates and future taxable income levels. In the event we were to determine that we would not be able to realize all or a portion of our deferred tax assets in the future, we would reduce such amounts through a charge to income in the period in which that determination is made. Conversely, if we were to determine that we would be able to realize our deferred tax assets in the future in excess of the net carrying amounts, we would decrease the recorded valuation allowance through an increase to income in the period in which that determination is made. Subsequently recognized tax benefits associated with valuation allowances recorded in a business combination will be recorded as an adjustment to goodwill.
We have exposures related to tax filings in the ordinary course of business. We periodically assess our liabilities and contingencies for all tax years under audit based upon the latest information available. For those matters where it is probable that an adjustment will be asserted, we have recorded our best estimate of the tax liability, including related interest charges, in our Consolidated Financial Statements. See Notes 1 and 9 to the Consolidated Financial Statements for further discussion.
GOODWILL AND INTANGIBLE ASSETS. Our net investments in businesses in 2006 totaled $1.0 billion, including approximately $138 million of debt assumed. The assets and liabilities of acquired businesses are recorded under the purchase method of accounting at their estimated fair values at the dates of acquisition. Goodwill represents costs in excess of fair values assigned to the underlying net assets of acquired businesses. We have recorded goodwill of $14.1 billion at December 31, 2006 and $13.0 billion at December 31, 2005.
Goodwill and intangible assets deemed to have indefinite lives are not amortized, but are subject to annual impairment testing. The identification and measurement of goodwill impairment involves the estimation of the fair value of reporting units. The estimates of fair value of reporting units are based on the best information available as of the date of the assessment, which primarily incorporate management assumptions about expected future cash flows and contemplate other
| 14 |
valuation techniques. Future cash flows can be affected by changes in industry or market conditions or the rate and extent to which anticipated synergies or cost savings are realized with newly acquired entities. Although no goodwill impairment has been recorded to date, there can be no assurances that future goodwill impairments will not occur. See Note 2 to the Consolidated Financial Statements for further discussion.
PRODUCT PERFORMANCE. We extend performance and operating cost guarantees beyond our normal service and warranty policies for extended periods on some of our products, particularly commercial aircraft engines. Liability under such guarantees is based upon future product performance and durability. In addition, we incur discretionary costs to service our products in connection with product performance issues. We accrue for such costs that are probable and can be reasonably estimated. The costs associated with these product performance and operating cost guarantees require estimates over the full terms of the agreements, and require management to consider factors such as the extent of future maintenance requirements and the future cost of material and labor to perform the services. These cost estimates are largely based upon historical experience. See Note 13 to the Consolidated Financial Statements for further discussion.
CONTRACTING WITH THE U.S. GOVERNMENT. Our contracts with the U.S. government are subject to government oversight and audit. Like many defense contractors, we have received audit reports, which recommend that certain contract prices should be reduced to comply with various government regulations. Some of these audit reports have involved substantial amounts. We have made voluntary refunds in those cases we believe appropriate. In addition, we accrue for liabilities associated with those government contracting matters that are probable and can be reasonably estimated. The inherent uncertainty related to the outcome of these matters can result in amounts materially different from any provisions made with respect to their resolution. See Note 14 to the Consolidated Financial Statements for further discussion. We recorded sales to the U.S. government of $6.4 billion in 2006 and $5.8 billion in 2005.
EMPLOYEE BENEFIT PLANS. We sponsor domestic and foreign defined benefit pension and other postretirement plans. Major assumptions used in the accounting for these employee benefit plans include the discount rate, expected return on plan assets, rate of increase in employee compensation levels, and health care cost increase projections. Assumptions are determined based on company data and appropriate market indicators, and are evaluated each year as of the plans’ measurement date. A change in any of these assumptions would have an effect on net periodic pension and postretirement benefit costs reported in the Consolidated Financial Statements.
The weighted-average discount rate used to measure pension liabilities and costs is set by reference to published high-quality bond indices. However, these indices give only an indication of the appropriate discount rate because the cash flows of the bonds comprising the indices do not match the projected benefit payment stream of the plan precisely. For this reason, we also consider the individual characteristics of the plan, such as projected cash flow patterns and payment durations, when setting the discount rate. Market interest rates were essentially flat in 2006 as compared with 2005 and, as a result, the weighted-average discount rate used to measure pension liabilities and costs essentially remained flat at 5.4%. Pension expense in 2007 is expected to decline as the amortization of prior investment losses begins to be replaced with the amortization of prior investment gains. See Note 10 to the Consolidated Financial Statements for further discussion.
Off-Balance Sheet Arrangements and Contractual Obligations
We extend a variety of financial guarantees to third parties in support of unconsolidated affiliates and for potential financing requirements of commercial aerospace customers. We also have obligations arising from sales of certain businesses and assets, including representations and warranties and related indemnities for environmental, health and safety, tax, and employment matters. Circumstances that could cause the contingent obligations and liabilities arising from these arrangements to come to fruition are changes in an underlying transaction (e.g., hazardous waste discoveries, adverse tax audit, etc.), nonperformance under a contract, customer requests for financing, or deterioration in the financial condition of the guaranteed party.
A summary of our consolidated contractual obligations and commitments as of December 31, 2006 is as follows:
| Payments Due by Period | |||||||||||||||
| (in millions of |
Total | Less than 1 Year |
1-3 Years |
3-5 Years |
More than 5 Years | ||||||||||
| Long-term debt * |
$ | 7,074 | $ | 37 | $ | 998 | $ | 1,639 | $ | 4,400 | |||||
| Operating leases |
1,382 | 372 | 504 | 256 | 250 | ||||||||||
| Purchase obligations |
11,388 | 6,558 | 3,059 | 807 | 964 | ||||||||||
| Other long-term liabilities |
3,450 | 774 | 814 | 673 | 1,189 | ||||||||||
| Total contractual obligations |
$ | 23,294 | $ | 7,741 | $ | 5,375 | $ | 3,375 | $ | 6,803 | |||||
| * | Principal only; excludes associated interest payments |
| 15 |
| 16 |
as hedges of the cash flow variability that results from the forecasted purchases. Gains and losses on those derivatives are deferred in other comprehensive income to the extent they are effective as hedges and reclassified into cost of products sold in the period in which the hedged transaction affects earnings.
Environmental Matters
Our operations are subject to environmental regulation by federal, state and local authorities in the U.S. and regulatory authorities with jurisdiction over our foreign operations. As a result, we have established, and continually update, policies relating to environmental standards of performance for our operations worldwide. We believe that expenditures necessary to comply with the present regulations governing environmental protection will not have a material effect upon our competitive position, consolidated financial position, results of operations or cash flows.
We have identified approximately 556 locations, mostly in the United States, at which we may have some liability for remediating contamination. We do not believe that any individual location’s exposure will have a material effect on our results of operations. Sites in the investigation, remediation or operation and maintenance stage represent approximately 93% of our accrued environmental liability.
We have been identified as a potentially responsible party under the Comprehensive Environmental Response Compensation and Liability Act (CERCLA or Superfund) at approximately 106 sites. The number of Superfund sites, in and of itself, does not represent a relevant measure of liability because the nature and extent of environmental concerns vary from site to site and our share of responsibility varies from sole responsibility to very little responsibility. In estimating our liability for remediation, we consider our likely proportionate share of the anticipated remediation expense and the ability of other potentially responsible parties to fulfill their obligations.
At December 31, 2006, we had $539 million reserved for environmental remediation. Cash outflows for environmental remediation were $79 million in 2006, $43 million in 2005 and $49 million in 2004. We estimate that ongoing environmental remediation expenditures in each of the next two years will approximate $75 million.
Government Matters
As described in the “Critical Accounting Estimates – Contracting with the U.S. government,” our contracts with the U.S. government are subject to audits. Such audits may recommend that certain contract prices should be reduced to comply with various government regulations. We are also the subject of one or more investigations and legal proceedings initiated by the U.S. government with respect to government contract matters.
As previously disclosed and described in Note 14 to the Consolidated Financial Statements, we were in litigation with the Department of Defense (DoD) as to whether Pratt & Whitney’s government cost accounting practices for engine parts produced by foreign companies under commercial collaboration programs since 1984 were acceptable. In 2001, the U.S. Armed Services Board of Contract Appeals (ASBCA) ruled in our favor, but the U.S. Court of Appeals for the Federal Circuit reversed in 2003 and remanded the case to the ASBCA to determine the appropriate accounting. The U.S. Supreme Court declined to review that decision. In November 2003, the DoD supplemented its claim to add damages and interest for the period after 1996, bringing the DoD’s claim to approximately $367 million in damages through 2002 and approximately $388 million in interest through 2001. Our appeal of this supplemental claim was consolidated with the original matter. On June 5, 2006, we entered into an agreement with the DoD to pay $283 million in settlement of this litigation and paid the entire settlement amount in July 2006.
In addition and as previously disclosed, the U.S. Department of Justice (DoJ) sued us in 1999 under the civil False Claims Act and other theories related to the “Fighter Engine Competition” between Pratt & Whitney’s F100 engine and GE’s F110 engine. The DoJ alleges that the government overpaid for engines because Pratt & Whitney inflated certain costs and withheld data. The government claims damages of $624 million. We believe this estimate is substantially overstated, deny any liability and are vigorously defending the matter. Trial of this matter was completed in December 2004, and a decision is pending. This matter is described in Note 14 to the Consolidated Financial Statements. Should the U.S. government ultimately prevail with respect to the foregoing government contracting matter, the outcome could result in a material effect on our results of operations in the period in which a liability would be recognized or cash flows for the period in which damages would be paid. However, we believe that the resolution of this matter will not have a material adverse effect on our results of operations, competitive position, cash flows or financial condition.
As previously reported, the European Commission’s Competition Directorate (EU Commission) conducted inspections in early 2004 at offices of our Otis subsidiary in Berlin, Brussels, Luxembourg and Paris relating to an investigation of possible unlawful collusive arrangements involving the European elevator and escalator industry. Based on the result of our own internal investigation, we believe that some Otis employees engaged in activities at a local level in Belgium,
| 17 |
Luxembourg, the Netherlands and Germany in violation of Otis and UTC policies and European competition law. On October 13, 2005, we received a Statement of Objections (SO) from the EU Commission relating to this investigation. The SO, an administrative complaint, alleges infringements of EU competition rules by certain elevator companies, including Otis, in Belgium, Luxembourg, the Netherlands and Germany. We responded to the SO on February 21, 2006 and have cooperated fully with the EU Commission. We expect the EU Commission to issue a decision in the near term, but cannot reasonably estimate the range of civil fines to which we or Otis would likely be subject. The aggregate amount of such fines could be material to our operating results for the period in which the liability would be recognized or cash flows for the period in which the fines would be paid. We do not believe that any such fines would have a material adverse effect on our financial condition, or that resolution of this matter would have a material adverse effect on Otis’ competitive position.
Since the EU Commission’s investigation became public, class action lawsuits were filed in various federal district courts in the United States alleging that we, Otis and other elevator manufacturers engaged in violations of Sections 1 and 2 of the Sherman Act. Those lawsuits were transferred to and consolidated in the U.S. District Court for the Southern District of New York. On June 6, 2006, the district court judge granted our motion to dismiss without leave to replead. On June 30, 2006, the plaintiffs appealed this decision to the U.S. Court of Appeals for the Second Circuit. We expect a decision in the second or third quarter of 2007. We continue to believe that this litigation is without merit.
Additional discussion of our environmental, U.S. Government contract matters, product performance and other contingent liabilities is included in “Critical Accounting Estimates” and Notes 1, 13 and 14 to the Consolidated Financial Statements. For additional discussion of our legal proceedings, see Item 3, “Legal Proceedings,” in our 2006 Form 10-K.
New Accounting Pronouncements
In September 2005, the Financial Accounting Standards Board (FASB) issued a Proposed Statement of Financial Accounting Standards which amends FASB Statement No. 128, “Earnings per Share”. The proposed statement is intended to clarify guidance on the computation of earnings per share for certain items such as mandatorily convertible instruments, the treasury stock method, and contingently issuable shares. We have evaluated the proposed statement as presently drafted and have determined that if adopted in its current form it would not have a significant impact on the computation of our earnings per share.
In September 2006, the FASB issued Statement of Financial Accounting Standards No. 157, “Fair Value Measurements” which is effective for fiscal years beginning
after November 15, 2007 and for interim periods within those years. This statement defines fair value, establishes a framework for measuring fair value and expands the related disclosure requirements. We have evaluated the new statement and have determined that it will not have a significant impact on the determination or reporting of our financial results.
In September 2006, the FASB issued Statement of Financial Accounting Standards No. 158, “Employers’ Accounting for Defined Benefit Pension and Other Postretirement Plans – an amendment of FASB Statements No. 87, 88, 106 and 132(R)” (SFAS 158). This statement requires balance sheet recognition of the overfunded or underfunded status of pension and postretirement benefit plans. Under SFAS 158, actuarial gains and losses, prior service costs or credits, and any remaining transition assets or obligations that have not been recognized under previous accounting standards must be recognized in Accumulated Other Non-Shareowners’ Changes in Equity, net of tax effects, until they are amortized as a component of net periodic benefit cost. In addition, the measurement date (the date at which plan assets and the benefit obligation are measured) is required to be the Company’s fiscal year end. Presently, we use a November 30 measurement date for a majority of our pension and postretirement benefit plans. We adopted the recognition provisions of SFAS 158 effective December 31, 2006, except for the measurement date provisions, which are not effective until fiscal years ending after December 15, 2008. However, we have early-adopted the measurement date provisions effective January 1, 2007. The non-cash effect of the adoption resulted in a decrease to total assets of approximately $2.4 billion, an increase to total liabilities of approximately $549 million and a reduction to total shareowners’ equity of approximately $1.8 billion, net of tax. The adoption of SFAS 158 did not affect our results of operations.
In June 2006, the FASB issued FASB Interpretation No. 48, “Accounting for Uncertainty in Income Taxes – an interpretation of FASB Statement No. 109” which is effective for fiscal years beginning after December 15, 2006. This interpretation was issued to clarify the accounting for uncertainty in income taxes recognized in the financial statements by prescribing a recognition threshold and measurement attribute for the financial statement recognition and measurement of a tax position taken or expected to be taken in a tax return. We are evaluating our tax positions and anticipate that the Interpretation will not have a significant impact on our results of operations.
| 18 |
Cautionary Note Concerning Factors That May Affect Future Results
This annual report contains statements which, to the extent they are not statements of historical or present fact, constitute “forward-looking statements” under the securities laws. From time to time, oral or written forward-looking statements may also be included in other materials released to the public. These forward-looking statements are intended to provide management’s current expectations or plans for our future operating and financial performance, based on assumptions currently believed to be valid. Forward-looking statements can be identified by the use of words such as “believe,” “expect,” “plans,” “strategy,” “prospects,” “estimate,” “project,” “target,” “anticipate” and other words of similar meaning in connection with a discussion of future operating or financial performance. These include, among others, statements relating to:
| • | Future earnings and other measures of financial performance |
| • | Future cash flow and uses of cash |
| • | The effect of economic downturns or growth in particular regions |
| • | The effect of changes in the level of activity in particular industries or markets |
| • | The availability and cost of materials, components, services and supplies |
| • | The scope, nature or impact of acquisition activity and integration into our businesses |
| • | The development, production and support of advanced technologies and new products and services |
| • | New business opportunities |
| • | Restructuring costs and savings |
| • | The effective negotiation of collective bargaining agreements |
| • | The outcome of contingencies |
| • | Future repurchases of common stock |
| • | Future levels of indebtedness and capital spending |
| • | Pension plan assumptions and future contributions |
All forward-looking statements involve risks and uncertainties that may cause actual results to differ materially from those expressed or implied in the forward-looking statements. For additional information identifying factors that may cause actual results to vary materially from those stated in the forward-looking statements, see our reports on Forms 10-K, 10-Q and 8-K filed with the Securities and Exchange Commission from time to time. Our Annual Report on Form 10-K for 2006 includes important information as to these factors in the “Business” section under the headings “General”, “Description of Business by Segment” and “Other Matters Relating to our Business as a Whole” and in the “Risk Factors” and “Legal Proceedings” sections.
| 19 |
Management’s Report on Internal Control Over Financial Reporting
The management of UTC is responsible for establishing and maintaining adequate internal control over financial reporting. Internal control over financial reporting is a process designed to provide reasonable assurance regarding the reliability of financial reporting and the preparation of financial statements for external reporting purposes in accordance with accounting principles generally accepted in the United States of America. Because of its inherent limitations, internal control over financial reporting may not prevent or detect misstatements. Management has assessed the effectiveness of UTC’s internal
control over financial reporting as of December 31, 2006. In making its assessment, management has utilized the criteria set forth by the Committee of Sponsoring Organizations (COSO) of the Treadway Commission in Internal Control – Integrated Framework. Management concluded that based on its assessment, UTC’s internal control over financial reporting was effective as of December 31, 2006. UTC management’s assessment of the effectiveness of UTC’s internal control over financial reporting, as of December 31, 2006, has been audited by PricewaterhouseCoopers LLP, an independent registered public accounting firm, as stated in their report which appears on page 21.
| /s/ George David |
| George David Chairman and Chief Executive Officer |
| /s/ Louis R. Chênevert |
| Louis R. Chênevert President and Chief Operating Officer |
| /s/ James E. Geisler |
| James E. Geisler Vice President, Finance |
| /s/ Gregory J. Hayes |
| Gregory J. Hayes Vice President, Accounting & Finance |
| 20 |
Report of Independent Registered Public Accounting Firm
To the Board of Directors and Shareowners of United Technologies Corporation:
We have completed integrated audits of United Technologies Corporation’s consolidated financial statements and of its internal control over financial reporting as of December 31, 2006 in accordance with the standards of the Public Company Accounting Oversight Board (United States). Our opinions, based on our audits, are presented below.
Consolidated financial statements
In our opinion, the accompanying consolidated balance sheets and the related consolidated statements of operations, of cash flows and of changes in shareowners’ equity present fairly, in all material respects, the financial position of United Technologies Corporation and its subsidiaries at December 31, 2006 and 2005, and the results of their operations and their cash flows for each of the three years in the period ended December 31, 2006 in conformity with accounting principles generally accepted in the United States of America. These financial statements are the responsibility of the Corporation’s management. Our responsibility is to express an opinion on these financial statements based on our audits. We conducted our audits of these statements in accordance with the standards of the Public Company Accounting Oversight Board (United States). Those standards require that we plan and perform the audit to obtain reasonable assurance about whether the financial statements are free of material misstatement. An audit of financial statements includes examining, on a test basis, evidence supporting the amounts and disclosures in the financial statements, assessing the accounting principles used and significant estimates made by management, and evaluating the overall financial statement presentation. We believe that our audits provide a reasonable basis for our opinion.
As discussed in Note 1 of the consolidated financial statements, the Corporation has recognized conditional asset retirement obligations to conform with the provisions of FASB Interpretation No. 47, Accounting for Conditional Asset Retirement Obligations as of December 31, 2005, and recognized the funded status of its benefit plans in accordance with the provisions of FASB Statement No. 158, Employers’ Accounting for Defined Benefit Pension and Other Postretirement Plans — an amendment of FASB Statements No. 87, 88, 106, and 132(R), as of December 31, 2006.
Internal control over financial reporting
Also, in our opinion, management’s assessment, included in the accompanying Management’s Report on Internal Control Over Financial Reporting, that the Corporation maintained effective internal control over financial reporting as of December 31, 2006 based on criteria established in Internal Control — Integrated Framework issued by the Committee of Sponsoring Organizations of
the Treadway Commission (COSO), is fairly stated, in all material respects, based on those criteria. Furthermore, in our opinion, the Corporation maintained, in all material respects, effective internal control over financial reporting as of December 31, 2006, based on criteria established in Internal Control — Integrated Framework issued by the COSO. The Corporation’s management is responsible for maintaining effective internal control over financial reporting and for its assessment of the effectiveness of internal control over financial reporting. Our responsibility is to express opinions on management’s assessment and on the effectiveness of the Corporation’s internal control over financial reporting based on our audit. We conducted our audit of internal control over financial reporting in accordance with the standards of the Public Company Accounting Oversight Board (United States). Those standards require that we plan and perform the audit to obtain reasonable assurance about whether effective internal control over financial reporting was maintained in all material respects. An audit of internal control over financial reporting includes obtaining an understanding of internal control over financial reporting, evaluating management’s assessment, testing and evaluating the design and operating effectiveness of internal control, and performing such other procedures as we consider necessary in the circumstances. We believe that our audit provides a reasonable basis for our opinions.
A corporation’s internal control over financial reporting is a process designed to provide reasonable assurance regarding the reliability of financial reporting and the preparation of financial statements for external purposes in accordance with generally accepted accounting principles. A corporation’s internal control over financial reporting includes those policies and procedures that (i) pertain to the maintenance of records that, in reasonable detail, accurately and fairly reflect the transactions and dispositions of the assets of the corporation; (ii) provide reasonable assurance that transactions are recorded as necessary to permit preparation of financial statements in accordance with generally accepted accounting principles, and that receipts and expenditures of the corporation are being made only in accordance with authorizations of management and directors of the corporation; and (iii) provide reasonable assurance regarding prevention or timely detection of unauthorized acquisition, use, or disposition of the corporation’s assets that could have a material effect on the financial statements.
Because of its inherent limitations, internal control over financial reporting may not prevent or detect misstatements. Also, projections of any evaluation of effectiveness to future periods are subject to the risk that controls may become inadequate because of changes in conditions, or that the degree of compliance with the policies or procedures may deteriorate.
/s/ PRICEWATERHOUSECOOPERS LLP
Hartford, Connecticut
February 8, 2007
| 21 |
CONSOLIDATED STATEMENT OF OPERATIONS
| (in millions of dollars, except per share amounts) |
2006 | 2005 | 2004 | ||||||
| Revenues |
|||||||||
| Product sales |
$ | 34,271 | $ | 30,641 | $ | 26,209 | |||
| Service sales |
12,847 | 11,637 | 10,491 | ||||||
| Financing revenues and other income, net |
711 | 447 | 745 | ||||||
| 47,829 | 42,725 | 37,445 | |||||||
| Costs and Expenses |
|||||||||
| Cost of products sold |
26,089 | 23,320 | 20,404 | ||||||
| Cost of services sold |
8,651 | 7,615 | 6,838 | ||||||
| Research and development |
1,529 | 1,367 | 1,267 | ||||||
| Selling, general and administrative |
5,462 | 5,241 | 4,635 | ||||||
| Operating Profit |
6,098 | 5,182 | 4,301 | ||||||
| Interest |
606 | 498 | 363 | ||||||
| Income before income taxes and minority interests |
5,492 | 4,684 | 3,938 | ||||||
| Income taxes |
1,494 | 1,253 | 1,031 | ||||||
| Minority interests in subsidiaries’ earnings |
266 | 267 | 234 | ||||||
| Income before cumulative effect of a change in accounting principle |
3,732 | 3,164 | 2,673 | ||||||
| Cumulative effect of a change in accounting principle, net of tax (Note 1) |
— | 95 | — | ||||||
| Net Income |
$ | 3,732 | $ | 3,069 | $ | 2,673 | |||
| Earnings per Share of Common Stock |
|||||||||
| Basic: |
|||||||||
| Income before cumulative effect of a change in accounting principle |
$ | 3.81 | $ | 3.19 | $ | 2.69 | |||
| Cumulative effect of a change in accounting principle |
$ | — | $ | 0.09 | $ | — | |||
| Net income |
$ | 3.81 | $ | 3.10 | $ | 2.69 | |||
| Diluted: |
|||||||||
| Income before cumulative effect of a change in accounting principle |
$ | 3.71 | $ | 3.12 | $ | 2.64 | |||
| Cumulative effect of a change in accounting principle |
$ | — | $ | 0.09 | $ | — | |||
| Net income |
$ | 3.71 | $ | 3.03 | $ | 2.64 | |||
See accompanying Notes to Consolidated Financial Statements
22
| (in millions of dollars, except per share amounts— shares in thousands) |
2006 | 2005 | ||||||
| Assets |
||||||||
| Cash and cash equivalents |
$ | 2,546 | $ | 2,247 | ||||
| Accounts receivable (net of allowance for doubtful accounts of $324 and $318) |
7,679 | 7,240 | ||||||
| Inventories and contracts in progress |
6,657 | 5,659 | ||||||
| Future income tax benefits |
1,261 | 1,427 | ||||||
| Other current assets |
701 | 633 | ||||||
| Total Current Assets |
18,844 | 17,206 | ||||||
| Customer financing assets |
1,073 | 1,152 | ||||||
| Future income tax benefits |
1,690 | 719 | ||||||
| Fixed assets |
5,725 | 5,623 | ||||||
| Goodwill |
14,146 | 13,007 | ||||||
| Intangible assets |
3,216 | 3,059 | ||||||
| Other assets |
2,447 | 5,159 | ||||||
| Total Assets |
$ | 47,141 | $ | 45,925 | ||||
| Liabilities and Shareowners’ Equity |
||||||||
| Short-term borrowings |
$ | 857 | $ | 1,612 | ||||
| Accounts payable |
4,263 | 3,820 | ||||||
| Accrued liabilities |
10,051 | 9,220 | ||||||
| Long-term debt currently due |
37 | 693 | ||||||
| Total Current Liabilities |
15,208 | 15,345 | ||||||
| Long-term debt |
7,037 | 5,935 | ||||||
| Future pension and postretirement benefit obligations |
2,926 | 2,813 | ||||||
| Other long-term liabilities |
3,837 | 4,063 | ||||||
| Total Liabilities |
29,008 | 28,156 | ||||||
| Commitments and Contingent Liabilities (Notes 4 and 14) |
||||||||
| Minority interests in subsidiary companies |
836 | 778 | ||||||
| Shareowners’ Equity: |
||||||||
| Capital Stock: |
||||||||
| Preferred Stock, $1 par value; Authorized—250,000 shares; None issued or outstanding |
— | — | ||||||
| Common Stock, $1 par value; Authorized—4,000,000 shares; Issued 1,351,471 and 1,339,444 shares |
9,622 | 8,793 | ||||||
| Treasury Stock 355,771 and 325,591 common shares at cost |
(9,413 | ) | (7,418 | ) | ||||
| Retained earnings |
18,754 | 16,051 | ||||||
| Unearned ESOP shares |
(227 | ) | (241 | ) | ||||
| Accumulated other non-shareowners’ changes in equity: |
||||||||
| Foreign currency translation |
633 | 20 | ||||||
| Minimum pension liability |
— | (344 | ) | |||||
| Other |
(2,072 | ) | 130 | |||||
| Total Accumulated Other Non-Shareowners’ Changes in Equity |
(1,439 | ) | (194 | ) | ||||
| Total Shareowners’ Equity |
17,297 | 16,991 | ||||||
| Total Liabilities and Shareowners’ Equity |
$ | 47,141 | $ | 45,925 | ||||
See accompanying Notes to Consolidated Financial Statements
23
CONSOLIDATED STATEMENT OF CASH FLOWS
| (in millions of dollars) |
2006 | 2005 | 2004 | |||||||||
| Operating Activities |
||||||||||||
| Net income |
$ | 3,732 | $ | 3,069 | $ | 2,673 | ||||||
| Adjustments to reconcile net income to net cash flows provided by operating activities: |
||||||||||||
| Depreciation and amortization |
1,033 | 984 | 978 | |||||||||
| Deferred income tax (benefit) provision |
(214 | ) | 262 | 196 | ||||||||
| Minority interests in subsidiaries’ earnings |
266 | 267 | 234 | |||||||||
| Stock compensation cost |
180 | 153 | 169 | |||||||||
| Change in: |
||||||||||||
| Accounts receivable |
(35 | ) | (830 | ) | (368 | ) | ||||||
| Inventories and contracts in progress |
(789 | ) | (430 | ) | (106 | ) | ||||||
| Other current assets |
25 | (39 | ) | 15 | ||||||||
| Accounts payable and accrued liabilities |
990 | 862 | 372 | |||||||||
| Voluntary contributions to global pension plans |
(190 | ) | (663 | ) | (906 | ) | ||||||
| Other, net |
(195 | ) | 699 | 339 | ||||||||
| Net Cash Provided by Operating Activities |
4,803 | 4,334 | 3,596 | |||||||||
| Investing Activities |
||||||||||||
| Capital expenditures |
(954 | ) | (929 | ) | (795 | ) | ||||||
| Increase in customer financing assets |
(314 | ) | (285 | ) | (309 | ) | ||||||
| Decrease in customer financing assets |
382 | 215 | 258 | |||||||||
| Business acquisitions |
(911 | ) | (4,063 | ) | (1,075 | ) | ||||||
| Dispositions of businesses |
451 | 308 | 27 | |||||||||
| Other, net |
85 | 105 | 132 | |||||||||
| Net Cash Used in Investing Activities |
(1,261 | ) | (4,649 | ) | (1,762 | ) | ||||||
| Financing Activities |
||||||||||||
| Issuance of long-term debt |
1,109 | 2,373 | — | |||||||||
| Repayment of long-term debt |
(825 | ) | (504 | ) | (535 | ) | ||||||
| (Decrease) increase in short-term borrowings |
(817 | ) | 237 | 577 | ||||||||
| Common Stock issued under employee stock plans |
346 | 282 | 343 | |||||||||
| Dividends paid on Common Stock |
(951 | ) | (832 | ) | (660 | ) | ||||||
| Repurchase of Common Stock |
(2,068 | ) | (1,181 | ) | (992 | ) | ||||||
| Dividends to minority interests and other |
(136 | ) | (40 | ) | (32 | ) | ||||||
| Net Cash (Used in) Provided by Financing Activities |
(3,342 | ) | 335 | (1,299 | ) | |||||||
| Effect of foreign exchange rate changes on Cash and cash equivalents |
99 | (38 | ) | 107 | ||||||||
| Net increase (decrease) in Cash and cash equivalents |
299 | (18 | ) | 642 | ||||||||
| Cash and cash equivalents, beginning of year |
2,247 | 2,265 | 1,623 | |||||||||
| Cash and cash equivalents, end of year |
$ | 2,546 | $ | 2,247 | $ | 2,265 | ||||||
| Supplemental Disclosure of Cash Flow Information: |
||||||||||||
| Interest paid, net of amounts capitalized |
$ | 575 | $ | 509 | $ | 522 | ||||||
| Income taxes paid, net of refunds |
$ | 1,347 | $ | 932 | $ | 758 | ||||||
| Non-cash investing and financing activities include: |
||||||||||||
| Contributions of UTC common stock of $150 and $157 in 2006 and 2005, respectively, to domestic defined benefit pension plans |
||||||||||||
See accompanying Notes to Consolidated Financial Statements
24
CONSOLIDATED STATEMENT OF CHANGES IN SHAREOWNERS’ EQUITY
| (in millions of dollars, except per share amounts) |
Common Stock |
Treasury Stock |
Retained Earnings |
Unearned ESOP Shares |
Accumulated Other Non-Shareowners’ Changes in Equity |
Non-Shareowners’ Changes in Equity for the Period |
|||||||||||||||||
| December 31, 2003 |
$ | 7,407 | $ | (5,335 | ) | $ | 11,953 | $ | (273 | ) | $ | (1,799 | ) | $ | 3,414 | ||||||||
| Common Stock issued under employee plans (15.8 million shares), including tax benefit of $141 |
699 | 15 | (51 | ) | 17 | ||||||||||||||||||
| Common Stock repurchased (21.8 million shares) |
(992 | ) | |||||||||||||||||||||
| Dividends on Common Stock ($0.70 per share) |
(660 | ) | |||||||||||||||||||||
| Dividends on ESOP Common Stock ($0.70 per share) |
(35 | ) | |||||||||||||||||||||
| Non-Shareowners’ Changes in Equity: |
|||||||||||||||||||||||
| Net income |
2,673 | 2,673 | |||||||||||||||||||||
| Foreign currency translation adjustments |
514 | 514 | |||||||||||||||||||||
| Minimum pension liability adjustments, net of income taxes of $46 |
32 | 32 | |||||||||||||||||||||
| Unrealized holding gain on marketable equity securities, net of income taxes of $57 |
91 | 91 | |||||||||||||||||||||
| Unrealized cash flow hedging gain, net of income taxes of $7 |
10 | 10 | |||||||||||||||||||||
| December 31, 2004 |
$ | 8,106 | $ | (6,312 | ) | $ | 13,880 | $ | (256 | ) | $ | (1,152 | ) | $ | 3,320 | ||||||||
| Common Stock issued under employee plans (11.2 million shares), including tax benefit of $59 |
592 | 13 | (25 | ) | 15 | ||||||||||||||||||
| Common Stock contributed to defined benefit pension plans (3.0 million shares) |
95 | 62 | |||||||||||||||||||||
| Common Stock repurchased (22.6 million shares) |
(1,181 | ) | |||||||||||||||||||||
| Dividends on Common Stock ($0.88 per share) |
(832 | ) | |||||||||||||||||||||
| Dividends on ESOP Common Stock ($0.88 per share) |
(41 | ) | |||||||||||||||||||||
| Non-Shareowners’ Changes in Equity: |
|||||||||||||||||||||||
| Net income |
3,069 | 3,069 | |||||||||||||||||||||
| Foreign currency translation adjustments |
(190 | ) | (190 | ) | |||||||||||||||||||
| Minimum pension liability adjustments, net of income taxes of $711 |
1,205 | 1,205 | |||||||||||||||||||||
| Unrealized holding loss on marketable equity securities, including tax benefit of $32 |
(49 | ) | (49 | ) | |||||||||||||||||||
| Unrealized cash flow hedging loss, including tax benefit of $2 |
(8 | ) | (8 | ) | |||||||||||||||||||
| December 31, 2005 |
$ | 8,793 | $ | (7,418 | ) | $ | 16,051 | $ | (241 | ) | $ | (194 | ) | $ | 4,027 | ||||||||
| Common Stock issued under employee plans (12.6 million shares), including tax benefit of $101 |
738 | 14 | (34 | ) | 14 | ||||||||||||||||||
| Common Stock contributed to defined benefit pension plans (2.5 million shares) |
91 | 59 | |||||||||||||||||||||
| Common Stock repurchased (33.3 million shares) |
(2,068 | ) | |||||||||||||||||||||
| Dividends on Common Stock ($1.02 per share) |
(951 | ) | |||||||||||||||||||||
| Dividends on ESOP Common Stock ($1.02 per share) |
(44 | ) | |||||||||||||||||||||
| Adjustment to initially apply SFAS No. 158, including tax benefit of $1,145 |
(1,831 | ) | |||||||||||||||||||||
| Non-Shareowners’ Changes in Equity: |
|||||||||||||||||||||||
| Net income |
3,732 | 3,732 | |||||||||||||||||||||
| Foreign currency translation adjustments |
613 | 613 | |||||||||||||||||||||
| Minimum pension liability adjustment, net of income taxes of $8 |
20 | 20 | |||||||||||||||||||||
| Unrealized holding gain on marketable equity securities, net of income taxes of $4 |
6 | 6 | |||||||||||||||||||||
| Unrealized cash flow hedging loss, including tax benefit of $28 |
(53 | ) | (53 | ) | |||||||||||||||||||
| December 31, 2006 |
$ | 9,622 | $ | (9,413 | ) | $ | 18,754 | $ | (227 | ) | $ | (1,439 | ) | $ | 4,318 | ||||||||
See accompanying Notes to Consolidated Financial Statements
25
| 26 |
Sales under elevator and escalator sales, installation and modernization contracts are accounted for under the percentage-of-completion method.
Losses, if any, on contracts are provided for when anticipated. Loss provisions on original equipment contracts are recognized to the extent that estimated inventoriable manufacturing, engineering, product warranty and product performance guarantee costs exceed the projected revenue from the products contemplated under the contractual arrangement. Products contemplated under the contractual arrangement include products purchased under the contract and, in the aerospace business, required replacement parts that are purchased separately and subsequently for incorporation into the original equipment. Revenue projections used in determining contract loss provisions are based upon estimates of the quantity, pricing and timing of future product deliveries. Losses are recognized on shipment to the extent that inventoriable manufacturing costs, estimated warranty costs and product performance guarantee costs exceed revenue realized. Contract accounting requires estimates of future costs over the performance period of the contract as well as estimates of award fees and other sources of revenue. These estimates are subject to change and result in adjustments to margins on contracts in progress. The extent of progress toward completion on our long-term commercial aerospace equipment and helicopter contracts is measured using units of delivery. In addition, we use the cost-to-cost method for development contracts in the aerospace businesses and for elevator and escalator sales, installation and modernization contracts. For long-term aftermarket contracts, revenue is recognized over the contract period in proportion to the costs expected to be incurred in performing services under the contract. We review our cost estimates on significant contracts on a quarterly basis, and for others, no less frequently than annually or when circumstances change and warrant a modification to a previous estimate. Adjustments to contract loss provisions are recorded in earnings upon identification.
Service sales, representing aftermarket repair and maintenance activities, are recognized over the contractual period or as services are performed.
Revenues from engine programs under collaboration agreements are recorded as earned and the collaborator share of revenue is recorded as a reduction of revenue at that time. The collaborator share of revenues under Pratt & Whitney’s engine programs was approximately $795 million, $664 million and $583 million for 2006, 2005 and 2004, respectively. Costs associated with engine programs under collaboration agreements are expensed as incurred. The collaborator share of program costs is recorded as a reduction of the related expense item at that time.
RESEARCH AND DEVELOPMENT. Research and development costs not specifically covered by contracts and those related to the company sponsored share of research and development activity in connection with cost-sharing arrangements are charged to expense as incurred. Government research and development support, not associated with specific contracts, is recorded as a reduction to research and development expense in the period earned. Repayment, if any, is in the form of future royalties and is conditioned upon the achievement of certain financial targets.
Research and development costs incurred under contracts with customers are expensed as incurred and are reported as a component of cost of products sold. Revenue from such contracts is recognized as product sales when earned.
FOREIGN EXCHANGE AND HEDGING ACTIVITY. We conduct business in many different currencies and, accordingly, are subject to the inherent risks associated with foreign exchange rate movements. The financial position and results of operations of substantially all of our foreign subsidiaries are measured using the local currency as the functional currency. Foreign currency denominated assets and liabilities are translated into U.S. dollars at the exchange rates existing at the respective balance sheet dates, and income and expense items are translated at the average exchange rates during the respective periods. The aggregate effects of translating the balance sheets of these subsidiaries are deferred as a separate component of Shareowners’ Equity.
We use derivative instruments, including swaps, forward contracts and options, to manage certain foreign currency, interest rate and commodity price exposures. Derivative instruments are viewed as risk management tools by us and are not used for trading or speculative purposes. Derivatives used for hedging purposes must be designated and effective as a hedge of the identified risk exposure at the inception of the contract. Accordingly, changes in fair value of the derivative contract must be highly correlated with changes in the fair value of the underlying hedged item at inception of the hedge and over the life of the hedge contract.
All derivative instruments are recorded on the balance sheet at fair value. Derivatives used to hedge foreign-currency-denominated balance sheet items are reported directly in earnings along with offsetting transaction gains and losses on the items being hedged. Derivatives used to hedge forecasted cash flows associated with foreign currency commitments or forecasted commodity purchases are accounted for as cash flow hedges. Gains and losses on derivatives designated as cash flow hedges are recorded in other comprehensive income and reclassified to earnings in a manner that matches the timing of the earnings impact of the hedged transactions. The ineffective portion of all hedges, if any, is recognized currently in earnings.
| 27 |
| 28 |
| (in millions of dollars) |
|||
| Current assets |
$ | 942 | |
| Property, plant and equipment |
201 | ||
| Intangible assets |
966 | ||
| Goodwill |
2,046 | ||
| Other assets |
56 | ||
| Total assets acquired |
$ | 4,211 | |
| Accounts payable and accrued liabilities |
$ | 465 | |
| Long-term debt and short-term borrowings |
523 | ||
| Deferred taxes |
389 | ||
| Pension and postretirement obligations |
100 | ||
| Other liabilities |
43 | ||
| Total liabilities assumed |
$ | 1,520 | |
| Net assets acquired |
$ | 2,691 | |
In connection with the acquisition of Kidde, we recorded $966 million of identifiable intangible assets. The Kidde trademark, valued at $132 million, was assigned an indefinite life. The amortized intangible assets and the weighted-average amortization periods are as follows: trademarks - $73 million (15 years), customer relationships - $696 million (3-32 years) and completed technology - $65 million (10 years).
Beginning in the second quarter of 2005, Kidde’s aircraft fire protection systems business was included in our Hamilton Sundstrand segment, while Kidde’s industrial fire protection and residential and commercial fire safety businesses were consolidated with Chubb creating the UTC Fire & Security segment.
Rocketdyne was acquired on August 2, 2005 for a purchase price of approximately $700 million in cash. Rocketdyne is a leader in sophisticated aerospace propulsion systems including the space shuttle main engine and engines used on the Delta rocket programs. We recorded approximately $439 million of goodwill and $87 million of intangible assets in connection with this acquisition. The addition of Rocketdyne strengthens our core space propulsion, power and exploration business by increasing product breadth and leveraging complementary technologies. The Rocketdyne business has been integrated into our existing space propulsion, space power and energy businesses within the Pratt & Whitney and Hamilton Sundstrand segments.
In May 2005, we completed the acquisition of Lenel for approximately $440 million. Lenel provides software and integrated systems for the corporate and government security markets and will provide us with high-end technological access to these markets as part of UTC’s Fire & Security segment. We recorded approximately $380 million of goodwill and $80 million of intangible assets in connection with this acquisition.
In October 2005, we acquired the remaining 19.9% minority interest in our joint venture, Otis LG Elevator Company for $315 million and renamed the company Otis Elevator Korea. As part of the acquisition, we recorded $168 million of goodwill and $27 million of other identifiable intangible assets.
The 2004 investments in businesses include the purchase of slightly less than 20% of Kidde shares for $450 million and Carrier’s acquisition of Linde AG’s refrigeration division for $324 million, including assumed debt of $162 million.
The assets and liabilities of the acquired businesses are accounted for under the purchase method of accounting and recorded at their fair values at the dates of acquisition. The excess of the purchase price over the estimated fair values of the net assets acquired was recorded as an increase in goodwill of $646 million in 2006, $3.3 billion in 2005, and $471 million in 2004. The results of operations of acquired businesses have been included in the Consolidated Statement of Operations beginning as of the effective date of acquisition. The final purchase price allocation for acquisitions is subject to the finalization of the valuation of certain assets and liabilities, plans for consolidation of facilities and relocation of employees and other integration activities. As a result, preliminary amounts assigned to assets and liabilities will be subject to revision in future periods.
| 29 |
GOODWILL. The changes in the carrying amount of goodwill, by segment, are as follows:
| (in millions of dollars) |
Balance 2006 |
Goodwill resulting from business combinations |
Foreign currency translation and other |
Balance as 2006 | |||||||||
| Otis |
$ | 1,165 | $ | 28 | $ | 112 | $ | 1,305 | |||||
| Carrier |
2,384 | 166 | 54 | 2,604 | |||||||||
| UTC Fire & Security |
3,920 | 232 | 278 | 4,430 | |||||||||
| Pratt & Whitney |
928 | 76 | (2 | ) | 1,002 | ||||||||
| Hamilton Sundstrand |
4,361 | 113 | 51 | 4,525 | |||||||||
| Sikorsky |
161 | 31 | — | 192 | |||||||||
| Total Segments |
12,919 | 646 | 493 | 14,058 | |||||||||
| Eliminations & Other |
88 | — | — | 88 | |||||||||
| Total |
$ | 13,007 | $ | 646 | $ | 493 | $ | 14,146 | |||||
Contributing to the $1,139 million increase in goodwill during 2006, are the impacts of changes in foreign currency exchange rates and the finalization of purchase accounting, which includes approximately $100 million of Kidde restructuring costs.
INTANGIBLE ASSETS. Identifiable intangible assets are comprised of the following:
| 2006 | 2005 | |||||||||||||
| (in millions of dollars) |
Gross Amount |
Accumulated Amortization |
Gross Amount |
Accumulated Amortization |
||||||||||
| Amortized: |
||||||||||||||
| Service portfolios |
$ | 1,304 | $ | (507 | ) | $ | 1,126 | $ | (392 | ) | ||||
| Patents and trademarks |
362 | (79 | ) | 315 | (58 | ) | ||||||||
| Other, principally customer relationships |
1,845 | (421 | ) | 1,631 | (248 | ) | ||||||||
| $ | 3,511 | $ | (1,007 | ) | $ | 3,072 | $ | (698 | ) | |||||
| Unamortized: |
||||||||||||||
| Trademarks and other |
$ | 712 | $ | — | $ | 685 | $ | — | ||||||
Amortization of intangible assets for the year ended December 31, 2006 was $250 million. Amortization of these intangible assets for 2007 through 2011 is expected to approximate $225 million per year.
| 30 |
| 31 |
connection with V2500 engine sales. At December 31, 2006, IAE had financing commitments of $815 million and asset value guarantees of $45 million. Our share of IAE’s financing commitments and asset value guarantees was approximately $280 million at December 31, 2006. In addition, IAE had lease obligations under long-term noncancelable leases of approximately $348 million, on an undiscounted basis, through 2020 related to aircraft, which are subleased to customers under long-term leases. These aircraft have fair market values, which approximate the financed amounts, net of reserves. The shareholders of IAE have guaranteed IAE’s financing arrangements to the extent of their respective ownership interests. In the event of default by a shareholder on certain of these financing arrangements, the other shareholders would be proportionately responsible.
Total reserves related to receivables and financing assets, financing commitments and guarantees were $287 million at December 31, 2006 and 2005.
[note 5] Inventories and Contracts in Progress
| (in millions of dollars) |
2006 | 2005 | ||||||
| Inventories consist of the following: |
||||||||
| Raw material |
$ | 1,082 | $ | 1,000 | ||||
| Work-in-process |
2,409 | 1,752 | ||||||
| Finished goods |
2,956 | 2,640 | ||||||
| Contracts in progress |
3,603 | 2,971 | ||||||
| 10,050 | 8,363 | |||||||
| Less: |
||||||||
| Progress payments, secured by lien, on U.S. Government contracts |
(259 | ) | (133 | ) | ||||
| Billings on contracts in progress |
(3,134 | ) | (2,571 | ) | ||||
| $ | 6,657 | $ | 5,659 | |||||
Raw materials, work-in-process and finished goods are net of valuation reserves of $422 million and $391 million as of December 31, 2006 and 2005, respectively.
Contracts in progress principally relate to elevator and escalator contracts and include costs of manufactured components, accumulated installation costs and estimated earnings on incomplete contracts.
Our sales contracts in many cases are long-term contracts expected to be performed over periods exceeding twelve months. At December 31, 2006 and 2005, approximately 63% and 57%, respectively, of total inventories and contracts in progress have been acquired or manufactured under such long-term contracts, a portion of which is not scheduled for delivery within the next twelve months.
[note 6] Fixed Assets
| (in millions of dollars) |
Estimated Useful Lives |
2006 | 2005 | |||||||
| Land |
$ | 344 | $ | 356 | ||||||
| Buildings and improvements |
20-40 years | 4,306 | 4,331 | |||||||
| Machinery, tools and equipment |
3-20 years | 8,561 | 8,060 | |||||||
| Other, including under construction |
527 | 581 | ||||||||
| 13,738 | 13,328 | |||||||||
| Accumulated depreciation |
(8,013 | ) | (7,705 | ) | ||||||
| $ | 5,725 | $ | 5,623 | |||||||
Depreciation expense was $724 million in 2006, $709 million in 2005 and $793 million in 2004.
| 32 |
[note 7] Accrued Liabilities
| (in millions of dollars) |
2006 | 2005 | ||||
| Advances on sales contracts and service billings |
$ | 3,552 | $ | 2,642 | ||
| Accrued salaries, wages and employee benefits |
1,626 | 1,623 | ||||
| Litigation and contract matters |
560 | 862 | ||||
| Service and warranty |
508 | 478 | ||||
| Income taxes payable |
748 | 545 | ||||
| Interest payable |
228 | 197 | ||||
| Accrued property, sales and use taxes |
191 | 169 | ||||
| Accrued restructuring costs |
178 | 269 | ||||
| Accrued workers compensation |
156 | 118 | ||||
| Other |
2,304 | 2,317 | ||||
| $ | 10,051 | $ | 9,220 | |||
[note 8] Borrowings and Lines of Credit
Short-term borrowings consist of the following:
| (in millions of dollars) |
2006 | 2005 | ||||
| Domestic borrowings |
$ | 6 | $ | 5 | ||
| Foreign bank borrowings |
401 | 548 | ||||
| Commercial paper |
450 | 1,059 | ||||
| $ | 857 | $ | 1,612 | |||
The weighted-average interest rates applicable to short-term borrowings outstanding at December 31, 2006 and 2005 were 5.9% and 5.2%, respectively. At December 31, 2006, approximately $1.9 billion was available under short-term lines of credit with local banks at our various domestic and international subsidiaries.
At December 31, 2006, we had credit commitments from banks totaling $2.5 billion. We had a credit commitment of $1.5 billion under a revolving credit agreement, which serves as a backup facility for the issuance of commercial paper. This revolving credit agreement was renewed in October 2006 and will expire in October 2011. In November 2006, we entered into a $1.0 billion multi-currency revolving credit agreement that is to be used for general corporate funding purposes, including acquisitions. There were no borrowings under either of these revolving credit agreements at December 31, 2006.
In May 2006, we issued $1.1 billion of long-term debt, the proceeds of which were used to repay commercial paper borrowings. We generally use our commercial paper borrowings for general corporate purposes including financing acquisitions and the repurchase of our stock. The long-term debt issued in May 2006 is comprised of two series of notes as follows:
| (in millions of dollars) | ||||||||
| Principal | Rate | Maturity | ||||||
| $ | 600 | 6.05 | % | June 1, 2036 | ||||
| $ | 500 | LIBOR + .07 | % | June 1, 2009 | ||||
We may redeem the notes due in 2009, in whole or in part, at any time after June 1, 2007 at a redemption price in U.S. dollars equal to 100% of the principal amount, plus interest accrued.
In April 2005, we issued $2.4 billion of long-term debt, the proceeds of which were used primarily to support the funding of the Kidde acquisition. The long-term debt is comprised of three series of notes as follows:
| (in millions of dollars) | ||||||||
| Principal | Rate | Maturity | ||||||
| $ | 600 | 4.375 | % | May 1, 2010 | ||||
| $ | 1,200 | 4.875 | % | May 1, 2015 | ||||
| $ | 600 | 5.400 | % | May 1, 2035 | ||||
| 33 |
Total long-term debt consists of the following:
| (in millions of dollars) |
Weighted- Average Interest Rate |
Maturity | 2006 | 2005 | |||||||
| Notes and other debt denominated in: |
|||||||||||
| U.S. dollars |
6.1 | % | 2007-2036 | $ | 6,947 | $ | 6,455 | ||||
| Foreign currency |
5.7 | % | 2007-2019 | 29 | 42 | ||||||
| ESOP debt |
7.7 | % | 2008-2009 | 98 | 131 | ||||||
| 7,074 | 6,628 | ||||||||||
| Less: Long-term debt currently due |
37 | 693 | |||||||||
| $ | 7,037 | $ | 5,935 | ||||||||
Principal payments required on long-term debt for the next five years are: $37 million in 2007, $48 million in 2008, $950 million in 2009, $1,104 million in 2010, and $535 million in 2011.
At December 31, 2006, up to approximately $900 million of additional debt and equity securities could be issued under a shelf registration statement on file with the Securities and Exchange Commission.
The percentage of total debt at floating interest rates was 17% and 26% at December 31, 2006 and 2005, respectively.
[note 9] Taxes on Income
| (in millions of dollars) |
2006 | 2005 | 2004 | |||||||||
| Current: |
||||||||||||
| United States: |
||||||||||||
| Federal |
$ | 667 | $ | 230 | $ | 149 | ||||||
| State |
11 | 64 | 48 | |||||||||
| Foreign |
1,030 | 697 | 638 | |||||||||
| 1,708 | 991 | 835 | ||||||||||
| Future: |
||||||||||||
| United States: |
||||||||||||
| Federal |
(82 | ) | 135 | 283 | ||||||||
| State |
38 | 6 | (40 | ) | ||||||||
| Foreign |
(170 | ) | 121 | (47 | ) | |||||||
| (214 | ) | 262 | 196 | |||||||||
| Income tax expense |
$ | 1,494 | $ | 1,253 | $ | 1,031 | ||||||
| Attributable to items credited (charged) to equity and goodwill |
$ | 1,287 | $ | (597 | ) | $ | 109 | |||||
Future income taxes represent the tax effects of transactions, which are reported in different periods for tax and financial reporting purposes. These amounts consist of the tax effects of temporary differences between the tax and financial reporting balance sheets and tax carryforwards. Pursuant to SFAS 109, “Accounting for Income Taxes”, current and non-current future income tax benefits and payables within the same tax jurisdiction are generally offset for presentation in the Consolidated Balance Sheet.
| 34 |
The tax effects of net temporary differences and tax carryforwards which gave rise to future income tax benefits and payables at December 31, 2006 and 2005 are as follows:
| (in millions of dollars) |
2006 | 2005 | ||||||
| Future income tax benefits: |
||||||||
| Insurance and employee benefits |
$ | 1,279 | $ | 576 | ||||
| Other asset basis differences |
(303 | ) | 420 | |||||
| Other liability basis differences |
1,339 | 780 | ||||||
| Tax loss carryforwards |
523 | 444 | ||||||
| Tax credit carryforwards |
638 | 422 | ||||||
| Valuation allowance |
(525 | ) | (496 | ) | ||||
| $ | 2,951 | $ | 2,146 | |||||
| Future income taxes payable: |
||||||||
| Fixed assets |
$ | 330 | $ | 472 | ||||
| Other items, net |
272 | 678 | ||||||
| $ | 602 | $ | 1,150 | |||||
Valuation allowances have been established primarily for tax credit, tax loss carryforwards, and certain foreign temporary differences to reduce the future income tax benefits to expected realizable amounts. Of the total valuation allowance amount of $542 million, $307 million was established in purchase accounting, relating primarily to the purchase of Chubb. Subsequently recognized tax benefits associated with a valuation allowance recorded in a business combination will be recorded as an adjustment to goodwill.
The sources of income from continuing operations before income taxes and minority interests are:
| (in millions of dollars) |
2006 | 2005 | 2004 | ||||||
| United States |
$ | 2,410 | $ | 1,936 | $ | 1,808 | |||
| Foreign |
3,082 | 2,748 | 2,130 | ||||||
| $ | 5,492 | $ | 4,684 | $ | 3,938 | ||||
United States income taxes have not been provided on undistributed earnings of international subsidiaries. It is not practicable to estimate the amount of tax that might be payable. Our intention is to reinvest these earnings permanently or to repatriate the earnings only when it is tax effective to do so. Accordingly, we believe that any U.S. tax on repatriated earnings would be substantially offset by U.S. foreign tax credits.
The American Jobs Creation Act, signed into law in October of 2004, provided an opportunity in 2005 to repatriate up to $500 million of reinvested foreign earnings and to claim an 85% dividend received deduction against the repatriated amount. We evaluated the potential effects of the repatriation provision and determined not to repatriate earnings under this provision.
Differences between effective income tax rates and the statutory U.S. federal income tax rates are as follows:
| 2006 | 2005 | 2004 | |||||||
| Statutory U.S. federal income tax rate |
35.0 | % | 35.0 | % | 35.0 | % | |||
| Tax on international activities including exports |
(7.8 | ) | (4.9 | ) | (7.9 | ) | |||
| Benefit of prior period foreign tax credits |
— | (2.9 | ) | — | |||||
| Impact of noncore business transactions |
— | (0.4 | ) | — | |||||
| Tax audit settlements |
(0.6 | ) | (1.4 | ) | (1.9 | ) | |||
| Other |
0.6 | 1.4 | 1.0 | ||||||
| Effective income tax rate |
27.2 | % | 26.8 | % | 26.2 | % | |||
The effective tax rate for 2006, 2005 and 2004 reflects the tax benefit associated with lower tax rates on international earnings, which we intend to permanently reinvest outside the United States.
In the normal course of business, various tax authorities examine us, including the Internal Revenue Service (IRS). The 2005 effective tax rate reflects an approximately $66 million reduction in tax expense primarily as a result of the reevaluation of our liabilities and contingencies in light of the completion and commencement of exam cycles. In 2006, a residual disputed issue related to the 1999 disposition of a business segment was settled with the Appeals Division of the IRS and was
| 35 |
| 36 |
We use a November 30 measurement date for a majority of our pension plans.
| (in millions of dollars) |
2006 | 2005 | ||||||
| Change in Benefit Obligation: |
||||||||
| Beginning balance |
$ | 20,937 | $ | 18,811 | ||||
| Service cost |
432 | 389 | ||||||
| Interest cost |
1,128 | 1,101 | ||||||
| Actuarial loss |
103 | 1,238 | ||||||
| Total benefits paid |
(1,055 | ) | (1,059 | ) | ||||
| Net settlement and curtailment gain |
(51 | ) | (44 | ) | ||||
| Acquisitions |
2 | 746 | ||||||
| Other |
452 | (245 | ) | |||||
| Ending balance |
$ | 21,948 | $ | 20,937 | ||||
| Change in Plan Assets: |
||||||||
| Beginning balance |
$ | 18,131 | $ | 15,672 | ||||
| Actual return on plan assets |
2,763 | 2,090 | ||||||
| Employer contributions |
508 | 865 | ||||||
| Benefits paid from plan assets |
(1,032 | ) | (992 | ) | ||||
| Acquisitions |
— | 665 | ||||||
| Other |
223 | (169 | ) | |||||
| Ending balance |
$ | 20,593 | $ | 18,131 | ||||
| Funded status |
$ | (1,355 | ) | $ | (2,806 | ) | ||
| Unrecognized net actuarial loss |
* | 4,793 | ||||||
| Unrecognized prior service cost |
* | 242 | ||||||
| Unrecognized net transition obligation |
* | 14 | ||||||
| Post-measurement date contributions |
174 | 243 | ||||||
| Net amount recognized |
$ | (1,181 | ) | $ | 2,486 | |||
| Amounts Recognized in the Consolidated Balance Sheet Consist of: |
||||||||
| Noncurrent assets |
$ | 641 | $ | * | ||||
| Current liability |
(23 | ) | * | |||||
| Noncurrent liability |
(1,799 | ) | * | |||||
| Prepaid benefit cost |
* | 3,152 | ||||||
| Accrued benefit cost |
* | (1,275 | ) | |||||
| Intangible assets |
* | 65 | ||||||
| Accumulated other non-shareowners’ changes in equity |
* | 544 | ||||||
| Net amount recognized |
$ | (1,181 | ) | $ | 2,486 | |||
| Amounts Recognized in Accumulated Other Comprehensive Income Consist of: |
||||||||
| Net actuarial loss |
$ | 3,253 | $ | * | ||||
| Prior service cost |
247 | * | ||||||
| Transition obligation |
14 | * | ||||||
| Net amount recognized |
$ | 3,514 | $ | * | ||||
| * | Not applicable due to change in accounting standard. |
The amounts included in Other in the preceding table reflect the impact of foreign exchange translation, primarily for plans in England and Canada, and amendments to certain domestic plans.
Qualified domestic pension plan benefits comprise approximately 72% of the projected benefit obligation. Benefits for union employees are generally based on a stated amount for each year of service. For non-union employees, benefits are generally based on an employee’s years of service and compensation near retirement. A cash balance formula was adopted in 2003 for newly hired non-union employees and for other non-union employees who made a one-time voluntary election to have future benefit accruals determined under this formula. Certain foreign plans, which comprise approximately 26% of the projected benefit obligation, are considered defined benefit plans for accounting purposes. Nonqualified domestic pension plans provide supplementary retirement benefits to certain employees and are not a material component of the projected benefit obligation.
| 37 |
| 38 |
| 39 |
We use a November 30 measurement date for a majority of our postretirement benefit plans.
| (in millions of dollars) |
2006 | 2005 | ||||||
| Change in Benefit Obligation: |
||||||||
| Beginning balance |
$ | 1,079 | $ | 1,001 | ||||
| Service cost |
8 | 7 | ||||||
| Interest cost |
57 | 59 | ||||||
| Actuarial loss |
15 | 17 | ||||||
| Total benefits paid |
(81 | ) | (102 | ) | ||||
| Net settlement and curtailment loss |
— | 7 | ||||||
| Acquisitions |
— | 91 | ||||||
| Other |
(4 | ) | (1 | ) | ||||
| Ending balance |
$ | 1,074 | $ | 1,079 | ||||
| Change in Plan Assets: |
||||||||
| Beginning balance |
$ | 58 | $ | 59 | ||||
| Actual return on plan assets |
13 | 4 | ||||||
| Employer contributions |
3 | 7 | ||||||
| Benefits paid from plan assets |
(12 | ) | (9 | ) | ||||
| Other |
3 | (3 | ) | |||||
| Ending balance |
$ | 65 | $ | 58 | ||||
| Funded status |
$ | (1,009 | ) | $ | (1,021 | ) | ||
| Unrecognized net actuarial gain |
* | (25 | ) | |||||
| Unrecognized prior service cost |
* | (28 | ) | |||||
| Postmeasurement date contributions |
15 | 10 | ||||||
| Net amount recognized |
$ | (994 | ) | $ | (1,064 | ) | ||
| Amounts Recognized in the Consolidated Balance Sheet Consist of: |
||||||||
| Current liability |
$ | (67 | ) | $ | * | |||
| Noncurrent liability |
(927 | ) | (1,064 | ) | ||||
| $ | (994 | ) | $ | (1,064 | ) | |||
| Amounts Recognized in the Accumulated Other Comprehensive Income Consist of: |
||||||||
| Net actuarial gain |
$ | (26 | ) | $ | * | |||
| Prior service cost |
(14 | ) | * | |||||
| $ | (40 | ) | $ | * | ||||
| * | Not applicable due to change in accounting standard. |
| (in millions of dollars) |
2006 | 2005 | 2004 | |||||||||
| Components of Net Periodic Benefit Cost: |
||||||||||||
| Other Postretirement Benefits: |
||||||||||||
| Service cost |
$ | 8 | $ | 7 | $ | 7 | ||||||
| Interest cost |
57 | 59 | 61 | |||||||||
| Expected return on plan assets |
(4 | ) | (4 | ) | (4 | ) | ||||||
| Amortization of prior service cost |
(26 | ) | (26 | ) | (23 | ) | ||||||
| Net settlement and curtailment gain |
(1 | ) | (8 | ) | (5 | ) | ||||||
| Net periodic other postretirement benefit cost |
$ | 34 | $ | 28 | $ | 36 | ||||||
The estimated amounts that will be amortized from accumulated other comprehensive income into Net Periodic Benefit Cost in 2007 include net actuarial losses of $1 million and prior service credits of $9 million.
| 40 |
| 41 |
| 42 |
| 43 |
| 44 |
| 45 |
| 46 |
| (in millions of dollars) |
2006 | 2005 | ||||||
| Balance as of January 1 |
$ | 1,183 | $ | 1,185 | ||||
| Warranties and guarantees issued |
533 | 463 | ||||||
| Settlements made |
(396 | ) | (459 | ) | ||||
| Adjustments to provision |
1 | (6 | ) | |||||
| Balance as of December 31 |
$ | 1,321 | $ | 1,183 | ||||
[note 14] Commitments and Contingent Liabilities
LEASES. We occupy space and use certain equipment under lease arrangements. Rental commitments of $1,382 million at December 31, 2006 under long-term noncancelable operating leases are payable as follows: $372 million in 2007, $289 million in 2008, $215 million in 2009, $153 million in 2010, $103 million in 2011 and $250 million thereafter. Rent expense was $373 million in 2006, $299 million in 2005 and $321 million in 2004.
Additional information pertaining to commercial aerospace rental commitments is included in Note 4.
ENVIRONMENTAL. Our operations are subject to environmental regulation by federal, state and local authorities in the United States and regulatory authorities with jurisdiction over our foreign operations. As described in Note 1, we have accrued for the costs of environmental remediation activities and periodically reassess these amounts. We believe that the likelihood of incurring losses materially in excess of amounts accrued is remote.
GOVERNMENT. We are now, and believe that in light of the current U.S. government contracting environment we will continue to be, the subject of one or more U.S. government investigations. If we or one of our business units were charged with wrongdoing as a result of any of these investigations or other government investigations (including violations of certain environmental or export laws) the U.S. government could suspend us from bidding on or receiving awards of new U.S. government contracts pending the completion of legal proceedings. If convicted or found liable, the U.S. government could fine and debar us from new U.S. government contracting for a period generally not to exceed three years. The U.S. government could void any contracts found to be tainted by fraud.
Our contracts with the U.S. government are also subject to audits. Like many defense contractors, we have received audit reports, which recommend that certain contract prices should be reduced to comply with various government regulations. Some of these audit reports involved substantial amounts. We have made voluntary refunds in those cases we believe appropriate and continue to litigate certain cases. In addition, we accrue for liabilities associated with those matters that are probable and can be reasonably estimated.
As previously disclosed, we had been in litigation with the Department of Defense (DoD) as to whether Pratt & Whitney’s government cost accounting practices for engine parts produced by foreign companies under commercial collaboration programs since 1984 were acceptable. In 2001, the U.S. Armed Services Board of Contract Appeals (ASBCA) ruled in our favor, but the U.S. Court of Appeals for the Federal Circuit reversed in 2003 and remanded the case to the ASBCA to determine the appropriate accounting. The U.S. Supreme Court declined to review that decision. In November 2003, the DoD supplemented its claim to add damages and interest for the period after 1996, bringing the DoD’s claim to approximately $367 million in damages through 2002 and approximately $388 million in interest through 2001. Our appeal of this supplemental claim was consolidated with the original matter. On June 5, 2006 we entered into an agreement with the DoD to pay $283 million in settlement of this litigation and paid the entire settlement amount in July 2006.
In addition and as previously disclosed, the U.S. Department of Justice (DoJ) sued us in 1999 under the civil False Claims Act and other theories related to the “Fighter Engine Competition” between Pratt & Whitney’s F100 engine and GE’s F110 engine. The DoJ alleges that the Government overpaid for engines because Pratt & Whitney inflated certain costs and withheld data. The Government claims damages of $624 million. We believe this estimate is substantially overstated, deny any liability and are vigorously defending the matter. Trial of this matter was completed in December 2004 and a decision is pending. Should the U.S. government ultimately prevail with respect to the foregoing government contracting matter, the outcome could result in a material effect on our results of operations in the period in which a liability would be recognized or cash flows for the period in which damages would be paid. However, we believe that the resolution of this matter will not have a material adverse effect on our results of operations, competitive position, cash flows or financial condition.
As previously reported, the European Commission’s Competition Directorate (EU Commission) conducted inspections in early 2004 at offices of our Otis subsidiary in Berlin, Brussels, Luxembourg and Paris relating to an investigation of possible unlawful collusive arrangements involving the European elevator and escalator industry. Based on the result of our own internal investigation, we believe that some Otis employees engaged in activities at a local level in Belgium, Luxembourg, the Netherlands and Germany in violation of Otis and UTC policies and European competition law. On
| 47 |
October 13, 2005, we received a Statement of Objections (SO) from the EU Commission relating to this investigation. The SO, an administrative complaint, alleges infringements of EU competition rules by certain elevator companies, including Otis, in Belgium, Luxembourg, the Netherlands and Germany. We responded to the SO on February 21, 2006 and have cooperated fully with the EU Commission. We expect the EU Commission to issue a decision in the near term, but cannot reasonably estimate the range of civil fines to which we or Otis would likely be subject. The aggregate amount of such fines could be material to our operating results for the period in which the liability would be recognized or cash flows for the period in which the fines would be paid. We do not believe that any such fines would have a material adverse effect on our financial condition, or that the resolution of this matter would have a material adverse effect on Otis’ competitive position.
Since the EU Commission’s investigation became public, class action lawsuits were filed in various federal district courts in the United States alleging that we, Otis and other elevator manufacturers engaged in violations of Sections 1 and 2 of the Sherman Act. Those lawsuits were transferred to and consolidated in the U.S. District Court for the Southern District of New York. On June 6, 2006, the district court judge granted our motion to dismiss without leave to replead. On June 30, 2006, the plaintiffs appealed this decision to the U.S. Court of Appeals for the Second Circuit. We expect a decision in the second or third quarter of 2007. We continue to believe this litigation is without merit.
OTHER. As described in Note 13, we extend performance and operating cost guarantees beyond our normal warranty and service policies for extended periods on some of our products. We have accrued our estimate of the liability that may result under these guarantees and for service costs, which are probable and can be reasonably estimated.
We have accrued for environmental investigatory, remediation, operating and maintenance costs, performance guarantees and other litigation and claims based on our estimate of the probable outcome of these matters. While it is possible that the outcome of these matters may differ from the recorded liability, we believe the resolution of these matters will not have a material impact on our financial position, results of operations or cash flows.
We also have other commitments and contingent liabilities related to legal proceedings, self-insurance programs and matters arising out of the normal course of business.
[note 15] Segment Financial Data
Our operations are classified in six principal segments. Our UTC Fire & Security segment was created in the second quarter of 2005 upon the acquisition of Kidde and includes our former Chubb segment and the acquired Kidde business, excluding the aircraft fire protection systems business, which
is included in the Hamilton Sundstrand segment. The segments are generally determined based on the management of the businesses and on the basis of separate groups of operating companies, each with general operating autonomy over diversified products and services.
OTIS products include elevators, escalators, moving walkways and service sold to customers in the commercial and residential property industries around the world.
CARRIER products include residential, commercial and industrial heating, ventilating, air conditioning and refrigeration systems and equipment, food service equipment, building automation and controls, HVAC and refrigeration components and installation, retrofit and aftermarket services.
UTC FIRE & SECURITY products include fire and special hazard and suppression systems and fire fighting equipment, electronic security, monitoring and rapid response systems and service and security personnel for a diversified international customer base principally in the industrial, commercial and residential property sectors.
PRATT & WHITNEY products include commercial, general aviation and military aircraft engines, parts and service, industrial gas turbines and space propulsion sold to a diversified customer base, including international and domestic commercial airlines and aircraft leasing companies, aircraft manufacturers, and U.S. and foreign governments. Pratt & Whitney also provides product support and a full range of overhaul, repair and fleet management services and produces land-based power generation equipment.
HAMILTON SUNDSTRAND provides aerospace and industrial products and aftermarket services for diversified industries worldwide. Aerospace products include power generation, management and distribution systems, flight systems, engine control systems, environmental control systems, fire protection and detection systems, auxiliary power units and propeller systems. Industrial products include air compressors, metering pumps and fluid handling equipment.
SIKORSKY products include military and commercial helicopters, aftermarket helicopter and aircraft parts and services.
| 48 |
Segment information for the years ended December 31 is as follows:
| Total Revenues | Operating Profits | ||||||||||||||||||||||
| (in millions of dollars) |
2006 | 2005 | 2004 | 2006 | 2005 | 2004 | |||||||||||||||||
| Otis |
$ | 10,290 | $ | 9,575 | $ | 8,937 | $ | 1,888 | $ | 1,712 | $ | 1,413 | |||||||||||
| Carrier |
13,481 | 12,512 | 10,620 | 1,237 | 1,104 | 830 | |||||||||||||||||
| UTC Fire & Security |
4,747 | 4,250 | 2,879 | 301 | 235 | 130 | |||||||||||||||||
| Pratt & Whitney |
11,112 | 9,295 | 8,281 | 1,817 | 1,449 | 1,083 | |||||||||||||||||
| Hamilton Sundstrand |
4,995 | 4,382 | 3,921 | 832 | 675 | 583 | |||||||||||||||||
| Sikorsky |
3,230 | 2,802 | 2,506 | 173 | 250 | 200 | |||||||||||||||||
| Total segment |
47,855 | 42,816 | 37,144 | 6,248 | 5,425 | 4,239 | |||||||||||||||||
| Eliminations & Other |
(26 | ) | (91 | ) | 301 | 187 | 81 | 368 | |||||||||||||||
| General corporate expenses |
— | — | — | (337 | ) | (324 | ) | (306 | ) | ||||||||||||||
| Consolidated |
$ | 47,829 | $ | 42,725 | $ | 37,445 | $ | 6,098 | $ | 5,182 | $ | 4,301 | |||||||||||
| Total Assets | Capital Expenditures | Depreciation & Amortization | ||||||||||||||||||||||||||
| (in millions of dollars) |
2006 | 2005 | 2004 | 2006 | 2005 | 2004 | 2006 | 2005 | 2004 | |||||||||||||||||||
| Otis |
$ | 6,973 | $ | 6,094 | $ | 5,939 | $ | 93 | $ | 79 | $ | 79 | $ | 183 | $ | 165 | $ | 175 | ||||||||||
| Carrier |
10,127 | 9,433 | 9,166 | 148 | 243 | 176 | 157 | 169 | 200 | |||||||||||||||||||
| UTC Fire & Security |
8,518 | 7,595 | 4,974 | 106 | 79 | 69 | 176 | 150 | 95 | |||||||||||||||||||
| Pratt & Whitney |
9,828 | 9,515 | 7,514 | 335 | 303 | 244 | 280 | 255 | 273 | |||||||||||||||||||
| Hamilton Sundstrand |
9,418 | 8,986 | 7,473 | 142 | 137 | 134 | 142 | 149 | 129 | |||||||||||||||||||
| Sikorsky |
3,145 | 2,592 | 1,965 | 66 | 49 | 46 | 47 | 42 | 42 | |||||||||||||||||||
| Total segment |
48,009 | 44,215 | 37,031 | 890 | 890 | 748 | 985 | 930 | 914 | |||||||||||||||||||
| Eliminations & Other |
(868 | ) | 1,710 | 3,410 | 64 | 39 | 47 | 48 | 54 | 64 | ||||||||||||||||||
| Consolidated |
$ | 47,141 | $ | 45,925 | $ | 40,441 | $ | 954 | $ | 929 | $ | 795 | $ | 1,033 | $ | 984 | $ | 978 | ||||||||||
SEGMENT REVENUES AND OPERATING PROFIT. Total revenues by segment include intersegment sales, which are generally made at prices approximating those that the selling entity is able to obtain on external sales.
Geographic Areas
| External Revenues | Operating Profits | Long-Lived Assets | ||||||||||||||||||||||||||||
| (in millions of dollars) |
2006 | 2005 | 2004 | 2006 | 2005 | 2004 | 2006 | 2005 | 2004 | |||||||||||||||||||||
| United States operations |
$ | 23,524 | $ | 20,505 | $ | 18,512 | $ | 3,067 | $ | 2,498 | $ | 1,972 | $ | 2,939 | $ | 2,882 | $ | 2,540 | ||||||||||||
| International operations |
||||||||||||||||||||||||||||||
| Europe |
12,069 | 11,255 | 9,389 | 1,731 | 1,457 | 1,167 | 1,130 | 1,020 | 1,036 | |||||||||||||||||||||
| Asia Pacific |
7,056 | 6,525 | 5,717 | 814 | 968 | 781 | 717 | 733 | 758 | |||||||||||||||||||||
| Other |
4,809 | 4,137 | 3,288 | 637 | 502 | 401 | 698 | 646 | 558 | |||||||||||||||||||||
| Eliminations & Other |
371 | 303 | 539 | (151 | ) | (243 | ) | (20 | ) | 241 | 342 | 339 | ||||||||||||||||||
| Consolidated |
$ | 47,829 | $ | 42,725 | $ | 37,445 | $ | 6,098 | $ | 5,182 | $ | 4,301 | $ | 5,725 | $ | 5,623 | $ | 5,231 | ||||||||||||
49
GEOGRAPHIC EXTERNAL REVENUES AND OPERATING PROFIT. Geographic external revenues and operating profits are attributed to the geographic regions based on their location of origin. United States external revenues include export sales to commercial customers outside the U.S. and sales to the U.S. government, commercial and affiliated customers, which are known to be for resale to customers outside the U.S.
Revenues from United States operations include export sales as follows:
| (in millions of dollars) |
2006 | 2005 | 2004 | ||||||
| Europe |
$ | 1,448 | $ | 1,273 | $ | 1,126 | |||
| Asia Pacific |
1,629 | 1,480 | 1,309 | ||||||
| Other |
1,771 | 1,371 | 1,128 | ||||||
| $ | 4,848 | $ | 4,124 | $ | 3,563 | ||||
GEOGRAPHIC LONG-LIVED ASSETS. Long-lived assets are net fixed assets attributed to the specific geographic regions.
MAJOR CUSTOMERS. Revenues include sales under prime contracts and subcontracts to the U.S. government, primarily related to Pratt & Whitney, Hamilton Sundstrand and Sikorsky products, as follows:
| (in millions of dollars) |
2006 | 2005 | 2004 | ||||||
| Pratt & Whitney |
$ | 3,652 | $ | 3,278 | $ | 2,990 | |||
| Hamilton Sundstrand |
934 | 868 | 761 | ||||||
| Sikorsky |
1,819 | 1,546 | 1,692 | ||||||
| Other |
40 | 60 | 62 | ||||||
| $ | 6,445 | $ | 5,752 | $ | 5,505 | ||||
| 50 |
Selected Quarterly Financial Data (Unaudited)
| 2006 Quarters | 2005 Quarters | |||||||||||||||||||||||
| (in millions of dollars, except per share amounts) |
First | Second | Third | Fourth | First | Second | Third | Fourth | ||||||||||||||||
| Sales |
$ | 10,446 | $ | 12,046 | $ | 11,972 | $ | 12,654 | $ | 9,309 | $ | 10,974 | $ | 10,823 | $ | 11,172 | ||||||||
| Gross margin |
2,796 | 3,271 | 3,178 | 3,133 | 2,494 | 2,984 | 2,932 | 2,933 | ||||||||||||||||
| Income before cumulative effect of a change in accounting principle |
768 | 1,103 | 996 | 865 | 651 | 971 | 821 | 721 | ||||||||||||||||
| Net income |
768 | 1,103 | 996 | 865 | 651 | 971 | 821 | 626 | ||||||||||||||||
| Earnings per share of Common Stock: |
||||||||||||||||||||||||
| Basic – income before cumulative effect of a change in accounting principle |
$ | .78 | $ | 1.12 | $ | 1.02 | $ | .89 | $ | .66 | $ | .98 | $ | .83 | $ | .73 | ||||||||
| Basic – net income |
$ | .78 | $ | 1.12 | $ | 1.02 | $ | .89 | $ | .66 | $ | .98 | $ | .83 | $ | .64 | ||||||||
| Diluted – income before cumulative effect of a change in accounting principle |
$ | .76 | $ | 1.09 | $ | .99 | $ | .87 | $ | .64 | $ | .95 | $ | .81 | $ | .71 | ||||||||
| Diluted – net income |
$ | .76 | $ | 1.09 | $ | .99 | $ | .87 | $ | .64 | $ | .95 | $ | .81 | $ | .62 | ||||||||
Comparative Stock Data (Unaudited)
| 2006 | 2005 | |||||||||||||||||
| Common Stock | High | Low | Dividend | High | Low | Dividend | ||||||||||||
| First quarter |
$ | 59.94 | $ | 54.20 | $ | .220 | $ | 52.35 | $ | 49.03 | $ | .220 | ||||||
| Second quarter |
$ | 66.39 | $ | 56.58 | $ | .265 | $ | 54.00 | $ | 48.43 | $ | .220 | ||||||
| Third quarter |
$ | 64.74 | $ | 57.45 | $ | .265 | $ | 52.60 | $ | 49.20 | $ | .220 | ||||||
| Fourth quarter |
$ | 67.47 | $ | 61.80 | $ | .265 | $ | 58.89 | $ | 49.29 | $ | .220 | ||||||
Our common stock is listed on the New York Stock Exchange. The high and low prices are based on the Composite Tape of the New York Stock Exchange. There were approximately 21,000 registered shareholders at December 31, 2006.
Performance Graph (Unaudited)
The following graph presents the cumulative total shareholder return for the five years ending December 31, 2006 for our common stock, as compared to the Standard & Poor’s 500 Stock Index and to the Dow Jones 30 Industrial Average. Our common stock price is a component of both indices. These figures assume that all dividends paid over the five-year period were reinvested, and that the starting value of each index and the investment in common stock was $100.00 on December 31, 2001.
51
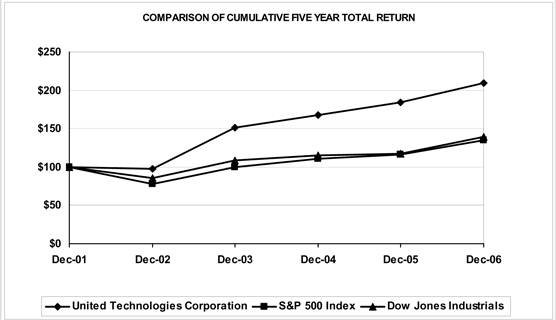
| December | ||||||||||||||||||
| 2001 | 2002 | 2003 | 2004 | 2005 | 2006 | |||||||||||||
| United Technologies Corporation |
$ | 100.00 | $ | 97.28 | $ | 151.17 | $ | 167.39 | $ | 184.21 | $ | 209.37 | ||||||
| S&P 500 Index |
$ | 100.00 | $ | 77.90 | $ | 100.25 | $ | 111.15 | $ | 116.61 | $ | 135.03 | ||||||
| Dow Jones Industrial Average |
$ | 100.00 | $ | 84.99 | $ | 109.05 | $ | 115.11 | $ | 117.12 | $ | 139.41 | ||||||
52
| Board of Directors | Permanent Committees | |||||
| Louis R. Chênevert President and Chief Operating Officer United Technologies Corporation (Diversified Manufacturer)
George David Chairman and Chief Executive Officer United Technologies Corporation (Diversified Manufacturer)
John V. Faraci Chairman and Chief Executive Officer International Paper (Paper, Packaging and Wood Products)
Jean-Pierre Garnier Chief Executive Officer GlaxoSmithKline plc (Pharmaceuticals)
Jamie S. Gorelick Partner WilmerHale (Law Firm)
Charles R. Lee Retired Chairman and Co-Chief Executive Officer Verizon Communications (Telecommunications)
Richard D. McCormick Retired Chairman, President and Chief Executive Officer US West, Inc. (Telecommunications) |
Harold McGraw III Chairman, President and Chief Executive Officer The McGraw-Hill Companies (Global Information Services)
Richard B. Myers General, U.S. Air Force (Ret.) and former Chairman of the Joint Chiefs of Staff
Frank P. Popoff Retired Chairman and Chief Executive Officer The Dow Chemical Company (Chemicals and Chemical Products)
H. Patrick Swygert President Howard University (Educational Institution)
André Villeneuve Non-Executive Chairman Euronext.liffe (London Futures and Derivatives Exchange)
H.A. Wagner Retired Chairman Air Products and Chemicals, Inc. (Industrial Gases and Chemicals)
Christine Todd Whitman President The Whitman Strategy Group (Management Consulting Firm) Former EPA Administrator Former Governor of New Jersey |
Audit Committee Frank P. Popoff, Chairman John V. Faraci Richard D. McCormick Richard B. Myers H. Patrick Swygert André Villeneuve H.A. Wagner
Committee on Compensation & Executive Development H.A. Wagner, Chairman Jean-Pierre Garnier Charles R. Lee Richard D. McCormick Harold McGraw III Frank P. Popoff
Executive Committee George David, Chairman Charles R. Lee Frank P. Popoff H.A. Wagner
Finance Committee Charles R. Lee, Chairman Louis R. Chênevert George David Jamie S. Gorelick Harold McGraw III Richard B. Myers Frank P. Popoff André Villeneuve
Committee on Nominations and Governance Richard D. McCormick, Chairman John V. Faraci Jean-Pierre Garnier Charles R. Lee H. Patrick Swygert H.A. Wagner Christine Todd Whitman
Public Issues Review Committee Jean-Pierre Garnier, Chairman Jamie S. Gorelick Harold McGraw III H. Patrick Swygert André Villeneuve Christine Todd Whitman | ||||
53
| Leadership | ||||||
| Mario Abajo President, South Europe and Middle East, Otis
Paul R. Adams Vice President, Engineering, Pratt & Whitney
David Adler Senior Vice President, Worldwide Customer Service, Sikorsky
Ted F. Amyuni President, Refrigeration, Carrier
Alain M. Bellemare President, Pratt & Whitney Canada
Richard H. Bennett, Jr. Vice President, Environment, Health & Safety
Todd Bluedorn President, North and South America, Otis
Ari Bousbib President, Otis
J. Thomas Bowler, Jr. Vice President, Human Resources
William M. Brown President, UTC Fire & Security
William L. Bucknall, Jr. Senior Vice President, Human Resources and Organization
Tony Chamberlain President, Security Services Australasia, UTC Fire & Security
Louis R. Chênevert President and Chief Operating Officer |
Jean Colpin Director, United Technologies Research Center
Halsey M. Cook President, Residential and Light Commercial North America, Carrier
Geraud Darnis President, Carrier
George David Chairman and Chief Executive Officer
John J. Doucette Vice President and Chief Information Officer
Michael R. Dumais Vice President and General Manager, Customer Service, Hamilton Sundstrand
Thomas E. Farmer President, Military Engines, Pratt & Whitney
Stephen N. Finger President, Pratt & Whitney
James E. Geisler Vice President, Finance
Bruno Grob President, North and East Europe, Otis
Gregory J. Hayes Vice President, Accounting and Finance
David P. Hess President, Hamilton Sundstrand
Darryl Hughes President, Security Services Europe, Middle East and Africa, UTC Fire & Security |
Todd J. Kallman President, Commercial Engines, Pratt & Whitney
Alison Kaufman Senior Vice President, Government & International Affairs
James E. Keenan Senior Vice President and General Manager, Global Service Partners, Pratt & Whitney
Robert F. Leduc President, Flight Systems, Hamilton Sundstrand
Patrick L’Hostis President, Residential and Light Commercial International, Carrier
Nancy T. Lintner Vice President, Communications
Paul W. Martin Senior Vice President, U.S. Government & Advanced Development Programs, Sikorsky
J. Michael McQuade Senior Vice President, Science & Technology
Didier Michaud-Daniel President, U.K. & Central Europe, Otis
Raymond J. Moncini Senior Vice President, Operations, Otis
Michael A. Monts Vice President, Business Practices
Larry O. Moore Senior Vice President, Module Centers and Operations, Pratt & Whitney |
Timothy M. Morris President, Aerospace Power Systems, Hamilton Sundstrand
Stephen G. Oswald President, Industrial, Hamilton Sundstrand
Eric Patry President, Fire Safety Europe, Middle East and Africa, UTC Fire & Security
Jeffrey P. Pino President, Sikorsky
Jothi Purushotaman Vice President, Operations
Thomas I. Rogan Vice President, Treasurer
Kelly Romano President, Building Systems and Services, Carrier
William H. Trachsel Senior Vice President and General Counsel
Tobin J. Treichel Vice President, Tax
Joseph E. Triompo President, Engine and Control Systems, Hamilton Sundstrand
Debra A. Valentine Vice President, Secretary and Associate General Counsel
Jan van Dokkum President, UTC Power
Charles Vo President, North Asia Pacific, Otis
Randal E. Wilcox President, South Asia Pacific, Otis | |||
54
| Shareowner Information | ||||
| Corporate Office United Technologies Corporation United Technologies Building Hartford, Connecticut 06101 Telephone 860.728.7000
This report is made available to shareowners in advance of the annual meeting of shareowners to be held at 2:00 p.m., April 11, 2007, in New York, New York. The proxy statement will be made available to shareowners on or about February 23, 2007, at which time proxies for the meeting will be requested.
Information about UTC, including financial information, can be found at our Web site: www.utc.com
Stock Listing New York Stock Exchange
Ticker Symbol UTX
Transfer Agent and Registrar
Computershare Trust Company, N.A., is the transfer agent, registrar and dividend disbursing agent for UTC’s Common Stock. Questions and communications regarding transfer of stock, replacement of lost certificates, dividends and address changes, and the Direct Stock Purchase and Dividend Reinvestment Plan should be directed to:
Computershare Trust Company, N.A. 250 Royall Street Canton, Massachusetts 02021 Telephone: within the U.S.: 1.800.488.9281 outside the U.S.: 1.781.575.2724 Web site: www.computershare.com/investor
TDD: 1.800.952.9245 Telecommunications device for the hearing impaired. |
Certifications
UTC has included as Exhibit 31 to its Annual Report on Form 10-K for fiscal year 2006 filed with the Securities and Exchange Commission certificates of its principal executive officers and principal financial officers certifying, among other things, the information contained in the Form 10-K. Annually UTC submits to the New York Stock Exchange (NYSE) a certificate of UTC’s Chief Executive Officer certifying that he was not aware of any violation by UTC of NYSE corporate governance listing standards as of the date of the certification.
Dividends
Dividends are usually paid on the 10th day of March, June, September and December.
Electronic Access
Shareowners of record may sign up at the following Web site for electronic access to future annual reports and proxy materials, rather than receiving mailed copies: www.computershare.com/us/ecomms
Your enrollment is revocable until each year’s record date for the annual meeting. Beneficial shareowners may be able to request electronic access by contacting their broker or bank, or ADP at: www.utc.com/investors/econsent/ics.htm
Additional Information
Shareowners may obtain a copy of the UTC Annual Report on Form 10-K for 2006 filed with the Securities and Exchange Commission by writing to:
Corporate Secretary United Technologies Corporation United Technologies Building Hartford, Connecticut 06101
For additional information about UTC please contact Investor Relations at the above corporate office address, or visit our Web site at www.utc.com |
Shareowner Information Services
Our Internet and telephone services give shareowners fast access to UTC financial results. The 24-hour-a-day, toll-free telephone service includes recorded summaries of UTC’s quarterly earnings information and other company news. Callers also may request copies of our quarterly earnings and news releases, by either fax or mail, and obtain copies of the UTC Annual Report and Form 10-K.
To access the service, dial 1.800.881.1914 from any touchtone phone and follow the recorded instructions.
Direct Registration System
If your shares are held in street name through a broker and you are interested in participating in the Direct Registration System, you may have your broker transfer the shares to Computershare Trust Company, N.A., electronically through the Direct Registration System. Interested investors can request a description of this book-entry form of registration by calling Shareowner Information Services at 1.800.881.1914.
Environmentally Friendly Report
This annual report is printed on recycled and recyclable paper.
www.utc.com www.carrier.com www.hamiltonsundstrand.com www.otis.com www.pratt-whitney.com www.sikorsky.com www.utcfireandsecurity.com www.utcpower.com |
55