Table of Contents
UNITED STATES
SECURITIES AND EXCHANGE COMMISSION
Washington, D.C. 20549
FORM N-CSR
CERTIFIED SHAREHOLDER REPORT OF REGISTERED
MANAGEMENT INVESTMENT COMPANIES
Investment Company Act file number 811-07739
Harding, Loevner Funds, Inc.
(Exact name of registrant as specified in charter)
400 Crossing Boulevard
Fourth Floor
Bridgewater, NJ 08807
(Address of principal executive offices) (Zip code)
Tanya S. Tancheff
The Northern Trust Company
333 South Wabash Avenue
Chicago, IL 60604
With a copy to:
Stephen H. Bier, Esq.
Dechert LLP
1095 Avenue of the Americas
New York, NY 10036
(Name and address of agent for service)
Registrant’s telephone number, including area code: (877) 435-8105
Date of fiscal year end: 10/31
Date of reporting period: 10/31/2022
Table of Contents
Item 1. Reports to Stockholders.
| (a) | The following is a copy of the report transmitted to shareholders pursuant to Rule 30e-1 under the Investment Company Act of 1940 (17 CFR 270.30e-1) |
Table of Contents

|
Global Equity Portfolio
International Equity Portfolio
International Small Companies Portfolio
Institutional Emerging Markets Portfolio
Emerging Markets Portfolio
Frontier Emerging Markets Portfolio
Global Equity Research Portfolio
International Equity Research Portfolio
Emerging Markets Research Portfolio
Chinese Equity Portfolio
Emerging Markets ex China Portfolio
International Developed Markets Equity Portfolio |
Table of Contents
Harding Loevner Funds
Global equity investing is Harding Loevner’s exclusive focus. Through Harding Loevner Funds it offers distinct global strategies based on its quality-and-growth investment philosophy. It seeks to purchase shares of growing, financially strong, well-managed companies at favorable prices. Harding Loevner manages each of the Funds’ Portfolios according to a disciplined, research-based investment process. It identifies companies with sustainable competitive advantages and assesses the durability of their earnings growth by conducting in-depth fundamental research into global industries. In constructing portfolios, Harding Loevner diversifies carefully to limit risk.
Receive Investor Materials Electronically
Shareholders may sign up for electronic delivery of investor materials. By doing so, you will receive the information faster and help us reduce the impact on the environment of providing these materials. To enroll in electronic delivery,
| 1. | Go to http://www.icsdelivery.com |
| 2. | Select the first letter of your brokerage firm’s name. |
| 3. | From the list that follows, select your brokerage firm. If your brokerage firm is not listed, electronic delivery may not be available. Please contact your brokerage firm. |
| 4. | Complete the information requested, including the e-mail address where you would like to receive notifications for electronic documents. |
Your information will be kept confidential and will not be used for any purpose other than electronic delivery. If you change your mind, you can cancel electronic delivery at any time and revert to physical delivery of your materials. Just go to http://www.icsdelivery.com, perform the first three steps above, and follow the instructions for cancelling electronic delivery. If you have any questions, please contact your brokerage firm.
Table of Contents
| 2 | ||||||
| 4 | ||||||
| 8 | ||||||
| 12 | ||||||
| 16 | ||||||
| 20 | ||||||
| 24 | ||||||
| 28 | ||||||
| 32 | ||||||
| 36 | ||||||
| 40 | ||||||
| 44 | ||||||
Must be preceded or accompanied by a current Prospectus.
Quasar Distributors, LLC, Distributor
Table of Contents
October 31, 2022


David Loevner, CFA
Chairman of the Funds
and Chief Executive Officer of the Adviser
Ferrill Roll, CFA
Chief Investment Officer of the Adviser
Simon Hallett, CFA
Vice Chairman of the Adviser
The past year has been a difficult one for investors. The headwinds for high-priced growth stocks transmogrified into a deep bear market across all asset classes except commodities. Our emphasis on high-quality companies has done little, so far this year, to shelter our Portfolios from the ravages of soaring energy prices, tight labor markets, rising interest rates, crumbling Chinese property markets, and fraught geopolitics. The last six months have hinted at the resilience of the businesses and the robustness of the balance sheets of the companies in which we invest, with most of the Portfolios outperforming their benchmarks modestly as anticipation of global recession rises. Small solace indeed. Our portfolio managers and analysts remain focused on reviewing the investment case for each holding and on uncovering bargains made available by the lower prices on offer. You will read about those efforts to respond to the changing landscape in the accompanying pages.
Meanwhile, we’ve taken steps to serve the needs of our investors in additional, if more prosaic, ways. Asset owners themselves face new challenges and priorities, and their different return objectives, investment horizons, risk tolerances, and strong views about the best—or worst—sources of future returns can require investment vehicles more narrowly defined than our longstanding offerings. In response, we’ve introduced new Portfolios that attempt to meet those changing investment objectives and specific preferences.
As an example, our Emerging Markets (EM) strategy has exposure limits for each country; two years ago, the limit for China was 35%. With the Chinese market’s outperformance in 2020 due to China’s early containment of COVID-19, some shareholders were dissatisfied with the underweight that
constraint produced relative to the EM benchmark. With them in mind, we launched our Chinese Equity Portfolio, which allows investors who favor following our bottom-up approach to identifying high-quality growing companies to deepen and tailor their exposure to the Chinese market as they desire.
This year, we expanded upon that logic by launching a complementary fund, the Emerging Markets ex China Portfolio, as a means for investors to manage their China and EM exposures independently—including the ability to avoid exposure to China altogether if, for instance, they have come to believe that China’s recent regulatory interventions, the scale of its property bubble, or its more aggressive posture toward Taiwan have rendered the market suspect, or even “uninvestable.” We believe these two Portfolios, because they share portfolio managers with our EM strategy and draw from the opportunity set qualified by our research team, should deliver good risk-adjusted returns over time even though each individual Portfolio may prove to be more volatile than their more diversified progenitor, our main Emerging Markets Portfolio.
With emerging markets having generally disappointed in the past few years and been so tumultuous recently, some investors have become disenchanted with the entire market segment. To accommodate that view (which, to be clear, we do not share), we added to the Harding, Loevner Funds’ lineup a Portfolio that expressly de-emphasizes emerging markets. The International Developed Markets Equity Portfolio makes broadly accessible a strategy that we’ve managed very successfully for institutional clients for over a decade. This strategy is managed in conjunction with our flagship International Equity strategy by a member of the latter’s portfolio management team.
Strong views abound on fossil fuels and the urgency of the need to lower carbon emissions. The energy crisis triggered by Russia’s invasion of Ukraine has highlighted the world’s unreadiness to do without fossil fuels in the short or even medium term, affording spectacular profits to those able to deliver product to make up the shortfall. The recent high returns to fossil fuel investments have betrayed the wishful thinking that the alignment of investments according to environmental, social, and governance (ESG) criteria would in and of itself lead to superior returns. Regardless, asset owners who wish to help address the looming crisis posed by a rapidly warming climate are undeterred. Because some are asking for restrictions on fossil fuel investments or positive bias toward companies lowering their carbon emissions, we’ve introduced pooled funds that steer heavily toward investments that align with carbon emission reduction goals. Following on the launch earlier this year of a Global Paris-Aligned strategy through our European UCITS fund family, we are set shortly to launch a similarly oriented International Carbon Transition Equity strategy that will
| 2 |
Table of Contents
be available through Harding, Loevner Funds. Both strategies will exclude fossil fuel companies from the portfolio (among other exclusions) and screen companies’ emission reduction practices to determine whether there is a viable pathway to net-zero greenhouse gas (GHG) emissions.
Our approach to assessing the risks of regulation and environmental damage and the growth opportunities stemming from climate change has always been to incorporate our analysis into the full panel of investment considerations against which we make financial judgments about companies and their shares. Our approach to assessing the investment risks and opportunities related to China and emerging markets falls along similar lines. And yet we recognize that consideration of material financial
risks and opportunities at the company level may be inadequate to the needs of some investors. By offering more customized building blocks, we aim to help meet those needs while still pursuing superior returns and limiting risk to the absolute best of our ability. Each of these new strategies is closely related to an existing strategy and relies on its portfolio managers; therefore, the incremental demands on the investment team are not burdensome. That strikes us as a win-win: to increase opportunities for shareholders to benefit from our core investment insights in whichever configuration they may need, while keeping our investment eyes scouring the landscape for the opportunities—or still-hidden risks—that the difficult environment may expose.
| Sincerely,
|
||||

|

|

| ||
| David R. Loevner, CFA | Ferrill D. Roll, CFA | Simon Hallett, CFA | ||
Opinions expressed are those of Harding Loevner and are not intended to be forecasts of future events, a guarantee of future results, nor investment advice. Please read the separate disclosure page for important information, including the risks of investing in the Portfolios. Past performance is not a guarantee of future results.
| 3 |
Table of Contents
Institutional Investors: HLMVX and HLGZX | Individual Investors: HLMGX
Portfolio Management Team

|
Peter Baughan, CFA Co-Lead Portfolio Manager
Jingyi Li Co-Lead Portfolio Manager
Scott Crawshaw Portfolio Manager
Christopher Mack, CFA Portfolio Manager
Richard Schmidt, CFA Portfolio Manager
Moon Surana, CFA Portfolio Manager |
Performance Summary
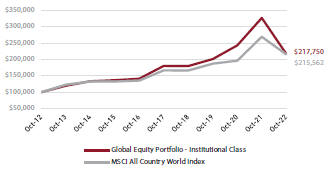
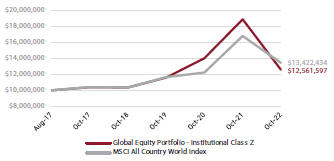
For the Global Equity Portfolio, the Institutional Class fell 33.35% (net of fees and expenses) in the twelve-month period ended October 31, 2022. The Portfolio’s benchmark, the MSCI All Country World Index, fell 19.96% (net of source taxes).
Market Review
Global stock markets are down significantly for the trailing twelve months, a period marked by persistent inflation and ongoing economic consequences of the Russia-Ukraine conflict. Every region and nearly every sector finished in the red.
Early in the period, amid worldwide supply chain issues, the emergence of the COVID-19 Omicron variant dealt a hiccup to investor confidence; markets were still processing the economic impact of the outbreak and governments’ responses to it when Russia invaded Ukraine in late February. The US and other Western governments imposed crippling economic sanctions on Russia; prices of commodities for which Russia is a key exporter rose sharply, furthering inflation and prompting central banks to tighten monetary policy.
Amidst rising prices, the US Federal Reserve, following pledges to increase rates until inflation is under control, boosted its benchmark interest rate three times between April and October. Other central banks, including the Bank of England, the European Central Bank, and the Central Bank of Australia, raised their rates as well. A notable exception was the Bank of Japan, which remained committed to its ultra-accommodative monetary policy in the period. In June, the World Bank forecasted economic growth slowing to 2.9% for 2022, a drop
| Fund Facts at October 31, 2022 | ||
| Total Net Assets |
$1,015.2M | |
| Sales Charge |
None | |
| Number of Holdings |
68 | |
| Turnover (5 Yr. Avg.) |
48% | |
| Dividend Policy |
Annual | |
| Institutional Investors | Individual Investors | |||||
| Inst. Class | Inst. Class Z | Advisor Class | ||||
| Ticker |
HLMVX |
HLGZX | HLMGX | |||
| CUSIP |
412295602 |
412295727 | 412295206 | |||
| Inception Date |
11/3/2009 |
8/1/2017 | 12/1/1996 | |||
| Minimum Investment |
$100,0001 |
$10,000,000 | $5,0001 | |||
| Expense Ratio2 |
0.87%3 |
0.80%4 | 1.08%5 | |||
1Lower minimums available through certain brokerage firms; 2The Expense Ratios are as of the most recent Prospectus and have been restated to reflect current fees; 3Harding Loevner’s contractual agreement caps the net expense ratio at 0.90% through February 28, 2023. The expense ratio (without cap) is applicable to investors; 4Harding Loevner’s contractual agreement caps the net expense ratio at 0.80% through February 28, 2023. The expense ratio (without cap) is applicable to investors; 5Harding Loevner’s contractual agreement caps the net expense ratio at 1.20% through February 28, 2023. The expense ratio (without cap) is applicable to investors.
from the 4.1% growth it forecasted at the start of the calendar year. In July, markets took a brief reprise from declining, with improving US core inflation measures raising the possibility of an earlier-than-expected end to the Federal Reserve’s monetary tightening. But the brightening of sentiment proved fleeting. While headline inflation continued to moderate due to oil and gas prices coming down off their previous highs, underlying measures indicated that price increases could become entrenched, and rising expectations of future inflation introduced the specter of a wage-price spiral; global stock markets resumed their retreat by late August.
On a sector basis, Energy was the only sector to rise; commodity prices soared in 2022 due to supply shocks from war and sanctions. Communication Services and Consumer Discretionary performed the worst. Communication Services companies—largely comprised of highly priced growth stocks—were impacted by central bank efforts to tame inflation and faced slowing advertising spending while Consumer Discretionary companies, generally more sensitive to business and consumer confidence, were impacted by persistent inflation.
All regions fell, though Emerging Markets, anchored by China, and eurozone markets suffered the most. The eurozone continued to grapple with the impacts of sanctions against Russia, while China fell sharply in the final months of the period due to dimming economic prospects stemming from its severe property slowdown and strict COVID-19 lockdowns. Non-eurozone European countries fell the least despite the
| 4 |
Table of Contents
Performance (% Total Return)
| For periods ended September 30, 2022 | For periods ended October 31, 2022 | |||||||||||||||||||||||||||||||||||||||||||||||||||||||
| 1 | 3 | 5 | 10 | Since Inception* | 1 | 3 | 5 | 10 | Since Inception* | |||||||||||||||||||||||||||||||||||||||||||||||
| Year | Years | Years | Years | Nov-09 | Aug-17 | Dec-96 | Year | Years | Years | Years | Nov-09 | Aug-17 | Dec-96 | |||||||||||||||||||||||||||||||||||||||||||
| Global Equity Portfolio – Inst. Class | -32.39 | 2.29 | 3.57 | 7.39 | 7.80 | -33.35 | 2.66 | 3.82 | 8.09 | 8.07 | ||||||||||||||||||||||||||||||||||||||||||||||
| Global Equity Portfolio – Inst. Class Z | -32.36 | 2.36 | 3.63 | – | 3.73 | -33.31 | 2.74 | 3.89 | – | 4.44 | ||||||||||||||||||||||||||||||||||||||||||||||
| Global Equity Portfolio – Advisor Class | -32.54 | 2.10 | 3.36 | 7.14 | 6.45 | -33.50 | 2.47 | 3.61 | 7.84 | 6.59 | ||||||||||||||||||||||||||||||||||||||||||||||
| MSCI All Country World Index | -20.66 | 3.75 | 4.44 | 7.28 | 7.48 | 4.67 | – | -19.96 | 4.85 | 5.24 | 7.98 | 7.91 | 5.77 | – | ||||||||||||||||||||||||||||||||||||||||||
Returns are annualized for periods greater than 1 year. *Inception of the Institutional Class, November 3, 2009. Inception of the Institutional Class Z, August 1, 2017. Inception of the Advisor Class, December 1, 1996. Index performance prior to January 1, 2001 cannot be shown since it relies on back-filled data.
Performance data quoted represents past performance; past performance does not guarantee future results. The investment return and principal value of an investment will fluctuate so that an investor’s shares, when redeemed, may be worth more or less than their original cost. Current performance of the Portfolio may be lower or higher than the performance quoted. Performance data current to the most recent month end may be obtained by calling (877) 435-8105 or visiting hardingloevnerfunds.com.
UK’s economic calamities, which involved its bonds tumbling and the pound falling to a record low against the US dollar after then-PM Liz Truss’s announcement of aggressive tax cuts and greater borrowing. The Bank of England, caught unaware, hastily announced it would buy bonds “on whatever scale necessary” to stabilize markets, effectively abandoning its earlier commitment to begin reducing the size of its balance sheet.
Performance Attribution
The Portfolio’s concentration in expensive stocks, a hazard of our commitment to investing in the stocks of high-quality rapidly growing businesses, hurt relative performance in a period during which investors fled from richly priced companies. So stiff was this style headwind that, when viewed through the standard lenses of sector and geographic attribution, our Portfolio underperformed within each region and nearly all sectors.
Weak Health Care, Information Technology, and Financials stocks detracted from relative performance. Chinese biologics services provider WuXi Biologics was placed on a US “Unverified List” of export destinations in December 2021 due to COVID-19 lockdowns preventing officials from inspecting its facilities; WuXi saw more share price pressure three quarters later from a September 2022 executive order by the Biden administration intended to accelerate development of the domestic biotech industry, which investors worried could impede the company’s access to the US market. US-based SVB Financial Group suffered from the negative outlook for technology and startup companies, which make up the bulk of its clients. The Portfolio’s underweight in Energy also hurt. Strong Industrials stocks helped; US agricultural machinery producer John Deere reported strong fiscal third quarter growth in 2022, affirming the company’s ability to overcome supply chain challenges and rising raw materials costs.
Viewing our returns in terms of the Portfolio’s exposure to growth and valuation factors, the Portfolio’s emphasis on companies in the most expensive quintile continued to hurt, accounting for more than a quarter of our underperformance in the period. Weak stock selection within the same quintile, which is heavy in Health Care and Information Technology companies,
Total Return Based on a $100,000 Investment Institutional Class
Total Return Based on a $10,000,000 Investment Institutional Class Z
Total Return Based on a $5,000 Investment Advisor Class
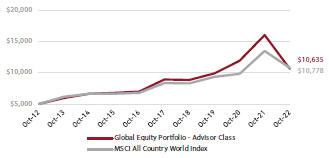
The charts above illustrate the hypothetical return of an investment made in the corresponding share classes. Investment return reflects voluntary fee waivers in effect. Absent such waivers, total return would be reduced. The performance provided in the table and charts above do not reflect the deduction of taxes that a shareholder would pay on Portfolio distributions or the redemption of Portfolio shares.
| 5 |
Table of Contents
also hurt significantly. Our parallel emphasis on quality provided no defense in the period.
Perspective and Outlook
Within a few months in the summer and fall of 2022, markets lurched from a consensus that the fight against inflation would soon be won toward a despairing view that slaying inflation would require sustained punishment by high interest rates. As practiced observers of both markets and policymakers, we have not put much belief in either narrative or tried to predict which outcome will ultimately drive the markets.
Instead, we have intensified our efforts to reconfirm the long-term business prospects of the companies we own and those qualified by our analysts for investment. We aim to build a portfolio of companies that is resilient to changes in the economic environment, knowing full well that we can’t predict which environment they will face tomorrow. We are continuously questioning whether they have as defensible a competitive position, as resilient a business model, and as robust a balance sheet as we had previously thought. We seek to uncover unseen vulnerabilities to worsening or new threats. Such threats could be economic in nature, such as a reversion to persistent inflation following two generations of disinflation. They could be financial, such as a shift from negative to positive real interest rates. Or they could be geopolitical, including risks of widening military conflicts with potentially cataclysmic effects on the global economy.
This last one is no longer simply academic. The global economy has already been dramatically affected by the Ukrainian conflict, including by the still-unfolding energy crisis in Europe. Nancy Pelosi’s August visit to Taiwan, coming as it did in the wake of the West’s strikingly unified response to Russia’s invasion of Ukraine, and China’s military exercises launched in response offered stark reminders of the risk that Taiwan could be the fuse to ignite an armed conflict pitting the US and its allies against a confident China. The concept of “de-globalization” comes into sharper focus when we imagine entire markets being lost to some of the world’s most successful companies, the severing of supply chains, or the destruction of financial or physical assets.
We have viewed that risk as both low and distant in time, and still view it as low. Several factors (such as China’s unsettled domestic economic situation and the unified Western response to and military debacle encountered by Russia in Ukraine) substantially reduce the likelihood of imminent invasion. Nevertheless, there is good reason we don’t presume to be experts in US-Sino relations. And even a low probability risk must be considered when the event can have catastrophic consequences if preparations aren’t made.
Beyond geopolitical risks, the threat from inflation remains at the fore. Few securities analysts working today are experienced in examining companies’ resilience to persistent inflation, since
for the last 40 years the trend in developed economies has been toward disinflation. We have a leg up since many of our analysts have covered companies in developing countries where inflation has been a persistent concern. Moreover, for at least the past 15 years our valuation models have explicitly incorporated inflation assumptions for every company we cover.
A further complication of analysis under inflationary conditions is that the growth of intangible assets has made it hard to parse the effects of today’s inflation on sustainability of profits. In prior inflationary periods, what distinguished winners from losers was pricing power—that is, whether a company could pass higher input costs through to its customers without affecting its unit sales. Today, the value of intellectual property (IP), such as embedded research and development costs, plays a far larger role in fostering the profits of the most rapidly growing companies, and this secondary effect is more difficult to quantify, since there is too little visibility into the accounting inputs to those intangible costs. Also, compared with the ability to renew physical plant and equipment, the ability to renew IP is more vulnerable to the high employment mobility of younger, more educated digital workers. These contemporary twists mean that pricing power may no longer be the paramount measure of a company’s inflation resilience; instead, its bargaining power
Portfolio Positioning (% Weight) at October 31, 2022
| Sector | Portfolio | Benchmark1 |
||||||
| Comm Services |
9.0 | 6.9 | ||||||
| Cons Discretionary |
7.7 | 10.8 | ||||||
| Cons Staples |
2.7 | 7.6 | ||||||
| Energy |
1.8 | 5.8 | ||||||
| Financials |
13.2 | 14.8 | ||||||
| Health Care |
22.7 | 13.3 | ||||||
| Industrials |
16.8 | 9.8 | ||||||
| Info Technology |
22.5 | 20.9 | ||||||
| Materials |
0.0 | 4.6 | ||||||
| Real Estate |
0.3 | 2.5 | ||||||
| Utilities |
0.0 | 3.0 | ||||||
| Cash |
3.3 | – | ||||||
| Geography | Portfolio | Benchmark1 | ||||||
| Canada |
0.0 | 3.2 | ||||||
| Emerging Markets |
8.7 | 10.2 | ||||||
| Europe EMU |
10.3 | 7.5 | ||||||
| Europe ex-EMU |
10.2 | 7.8 | ||||||
| Frontier Markets2 |
0.0 | – | ||||||
| Japan |
2.5 | 5.2 | ||||||
| Middle East |
0.0 | 0.2 | ||||||
| Pacific ex-Japan |
1.0 | 2.9 | ||||||
| United States |
64.0 | 63.0 | ||||||
| Cash |
3.3 | – | ||||||
1MSCI All Country World Index; 2Includes countries with less-developed markets outside the Index.
| 6 |
Table of Contents
over its IP suppliers (including its employees) has in some cases become more critical.
If 40 years have passed since analysts needed to worry about inflation, it’s only been a decade since analysts and portfolio managers last operated in an environment where they needed to take account of positive real interest rates. Although short-term rates are still far below headline inflation in most countries, in the developed world real yields on long sovereign bonds have tipped into positive territory. After a period during which there were almost no limits to the demand for borrowing for just about any purpose, positive real long-term interest rates should at least lead to a more efficient allocation of capital.
The journey to sustained higher interest rates, if indeed that is where we are headed, is bound to be bumpy. The most concerning vulnerability exposed (so far) has been the weaknesses hidden in some underfunded UK corporate pension plans that had built up opaque and contorted derivative and collateral structures predicated on well-behaved long-term interest rates. Their struggles to meet ensuant margin calls were the catalyst for the intervention by the Bank of England in its domestic bond market. Might similar vulnerabilities exist elsewhere waiting to be exposed? As always, our preference for transparency and insistence on financial strength at our companies is designed to keep our portfolios relatively sheltered from this kind of distress.
Portfolio Highlights
No sector better encapsulates the challenges for companies inherent in the current economic environment than Industrials. The pandemic laid bare the vulnerability of global industrial supply chains to unforeseen disruption, and rising geopolitical risks are eroding the economic logic that drove their geographic expansion. Manufacturers already reeling from rising costs for labor, materials, energy, and transport are also vulnerable to shortages of critical inputs and the threat of slowing global growth. Such a confluence of challenges will test even the most insightful and capable management teams.
That said, recent data suggest just how fluid the current environment is. Even as concerns mounted that inflation was becoming entrenched, costs of certain key inputs, such as steel, iron ore, and aluminum, have fallen in US dollar terms in 2022. Although it’s too early to draw any broad conclusions, we’ll note simply that shortages are typically followed by gluts.
Supply chain near-shoring and increased adoption of automation to alleviate shortages of skilled workers are creating tailwinds for industrial equipment makers. US government policies promoting clean energy, semiconductor, and biotechnology production domestically may hurt some China-based companies but could also create new markets for US-based firms in their own backyard. Many of our manufacturing-related and other types of industrial holdings are net beneficiaries of these emerging trends.
| Ten Largest Holdings by Weight at October 31, 2022 | ||||||||
| Company | Sector | Market | % | |||||
| Vertex Pharmaceuticals |
Health Care |
US | 4.0 | |||||
| Alphabet |
Comm Services |
US | 3.4 | |||||
| John Deere |
Industrials |
US | 3.3 | |||||
| Schneider Electric |
Industrials |
France | 3.1 | |||||
| UnitedHealth Group |
Health Care |
US | 2.8 | |||||
| First Republic Bank |
Financials |
US | 2.7 | |||||
| Microsoft |
Info Technology |
US | 2.6 | |||||
| Amazon.com |
Cons Discretionary |
US | 2.2 | |||||
| HDFC Bank |
Financials |
India | 2.1 | |||||
| L’Oréal |
Cons Staples |
France | 2.1 | |||||
Rockwell Automation, a Milwaukee-based industrial automation company, struggled early in the year with component shortages that prevented it from clearing its overflowing order books and rising input costs. Uncertainty arising from China’s COVID-19 lockdowns and the Ukraine war prompted management to warn in May of lower profits for the rest of the year. Behind the frustrations, however, were indications that the business outlook remained strong, as order volume continued to grow following price increases at the end of 2021. In the recent quarter, the company reported stronger results despite ongoing supply chain issues that hindered its ability to fulfill orders. To mitigate the risk of supply disruptions, Rockwell has been accumulating inventory and redesigning certain products. We believe Rockwell will see its revenues expand as its resilience improves and supply shortages recede.
Founded in 1987 by its current CEO, Andrew Florance, CoStar has tackled the problem of information asymmetry in the commercial real estate (CRE) market, where transaction data was once dispersed among individual brokers, sellers, buyers, and landlords. It has built a comprehensive database of commercial property data and transaction information, access to which it offers on a subscription basis. The service has lowered the cost of price discovery for smaller participants, leveling the playing field in this highly competitive industry and making itself indispensable to them. In addition to expanding its database to provide similar services in the US residential real estate market, CoStar is looking to expand its global CRE footprint. It has been building a property and transaction database in the UK for more than a decade and recently acquired CRE data businesses in Germany and France. Because of CoStar’s essential role in price discovery, it is relatively insulated from the cyclicality of the CRE market. With US$4.5 billion in cash, much of it earmarked for acquisitions, CoStar can take advantage of any compression in earnings multiples in a downturn to further consolidate its position.
As with the leadership of Rockwell, CoStar’s management has demonstrated ambition and an ability to execute on long-term plans. While no guarantee of success, a credible growth plan, experienced leadership, and substantial financial capacity make CoStar another business with the formula to meet expectations even in the currently challenging environment.
Please read the separate disclosures page for important information, including the risks of investing in the Portfolio.
| 7 |
Table of Contents
International Equity Portfolio
Institutional Investors: HLMIX and HLIZX | Individual Investors: HLMNX
| Portfolio Management Team
| ||

|
Ferrill Roll, CFA Co-Lead Portfolio Manager
Andrew West, CFA Co-Lead Portfolio Manager
Bryan Lloyd, CFA Portfolio Manager
Babatunde Ojo, CFA Portfolio Manager
Patrick Todd, CFA Portfolio Manager | |
Performance Summary
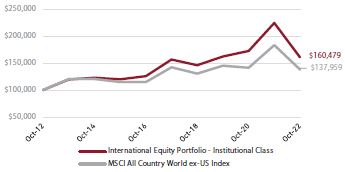
For the International Equity Portfolio, the Institutional Class declined 28.42%, the Institutional Class Z declined 28.36%, and the Investor Class declined 28.63% (net of fees and expenses) in the twelve-month period ended October 31, 2022. The Portfolio’s benchmark, the MSCI All Country World ex-US Index, declined 24.73% (net of source taxes).
Market Review
International equity markets fell sharply in the period amid aggressive central bank rate hikes intended to cool inflation, commodity supply shocks emanating from the war in Ukraine, and overall weakness in China.
The period began with consumer prices in the US climbing at the fastest pace since 1982, leading the US Federal Reserve (Fed) to signal several interest rate increases and an imminent end to its bond-buying program. So far, the Fed has hiked interest rates six times, taking rates from between 0% and 0.25% at the start of the period to between 3.75% and 4% by November 2. Other central bankers across developed and emerging markets continued to raise their own borrowing rates, with Bank of Japan the notable exception as it remained committed to an ultra-accommodative monetary policy.
Russia’s invasion of Ukraine in the closing days of February prompted a swift and emphatic response by Western governments, which nevertheless sought to strike a balance between punishing Russian aggression and avoiding an escalating military conflict. The US and its allies enacted crippling economic sanctions, including freezing a significant
| Fund Facts at October 31, 2022 | ||||
| Total Net Assets |
$14,025.4M |
|||
| Sales Charge |
None |
|||
| Number of Holdings |
60 |
|||
| Turnover (5 Yr. Avg.) |
17% |
|||
| Dividend Policy |
Annual |
|||
| Institutional Investors | Individual Investors | |||||
| Inst. Class | Inst. Class Z | Investor Class | ||||
| Ticker |
HLMIX |
HLIZX | HLMNX | |||
| CUSIP |
412295107 |
412295719 | 412295503 | |||
| Inception Date |
5/11/1994 |
7/17/2017 | 9/30/2005 | |||
| Minimum Investment |
$100,0001 |
$10,000,000 | $5,0001 | |||
| Expense Ratio2 |
0.79%3 |
0.71%4 | 1.11%5 | |||
1Lower minimums available through certain brokerage firms; 2The Expense Ratios are as of the most recent Prospectus and have been restated to reflect current fees; 3Harding Loevner’s contractual agreement caps the net expense ratio at 1.00% through February 28, 2023. The expense ratio (without cap) is applicable to investors; 4Harding Loevner’s contractual agreement caps the net expense ratio at 0.80% through February 28, 2023. The expense ratio (without cap) is applicable to investors; 5Harding Loevner’s contractual agreement caps the net expense ratio at 1.25% through February 28, 2023. The expense ratio (without cap) is applicable to investors.
share of Russian central bank reserve assets, cutting off many of the country’s banks from SWIFT (Society for Worldwide Interbank Financial Telecommunications), and outlawing the export of a variety of industrial and luxury goods to Russia. The revulsion over Russia’s actions also provoked an exodus of Western companies from Russian markets. With foreign investors effectively unable to trade, major market index providers expunged all Russian securities from their indices.
The war’s contribution to inflation was twofold. In September, Russia retaliated against European sanctions by cutting off the flow of natural gas to the continent, sending energy prices soaring as countries scrambled to find other sources. In emerging markets (EMs), the pressures were largely felt in ballooning food prices. Prior to the war, Ukraine was one of the world’s largest suppliers of grains and vegetable oils, and EM countries have been hard-pressed to find alternatives.
China grappled with its own set of challenges. The government’s sweeping lockdown measures in response to waves of COVID-19 cases in major Chinese cities hurt businesses in various industries and caused investors to lose their appetite for Chinese stocks. In the Real Estate sector, regulators’ efforts to prick the country’s residential real estate bubble caused severe strain, as even less-leveraged developers faced resistance to rolling over their debt or issuing new bonds. In Health Care, shares of Chinese biological pharmaceutical companies came under pressure after US President Joe Biden issued an executive order advancing a “secure American bioeconomy,” fueling fears that these businesses may get shut out from the lucrative US market.
| 8 |
Table of Contents
| Performance (% Total Return) |
|
|||||||||||||||||||||||||||||||||||||||||||||||||||||||
| For periods ended September 30, 2022 | For periods ended October 31, 2022 | |||||||||||||||||||||||||||||||||||||||||||||||||||||||
| 1 | 3 | 5 | 10 | Since Inception* | 1 | 3 | 5 | 10 | Since Inception* | |||||||||||||||||||||||||||||||||||||||||||||||
| Year | Years | Years | Years | May-94 | Jul-17 | Sep-05 | Year | Years | Years | Years | May-94 | Jul-17 | Sep-05 | |||||||||||||||||||||||||||||||||||||||||||
| Intl. Equity Portfolio – Inst. Class |
-27.28 | -0.02 | 0.45 | 4.65 | 5.39 | -28.42 | -0.34 | 0.50 | 4.84 | 5.46 | ||||||||||||||||||||||||||||||||||||||||||||||
| Intl. Equity Portfolio – Inst. Class Z |
-27.22 | 0.05 | 0.51 | – | 1.22 | -28.36 | -0.27 | 0.58 | – | 1.66 | ||||||||||||||||||||||||||||||||||||||||||||||
| Intl. Equity Portfolio – Investor Class |
-27.48 | -0.33 | 0.12 | 4.31 | 4.78 | -28.63 | -0.65 | 0.17 | 4.51 | 4.90 | ||||||||||||||||||||||||||||||||||||||||||||||
| MSCI All Country World ex-US Index |
-25.17 | -1.52 | -0.81 | 3.01 | – | -0.13 | 3.16 | -24.73 | -1.68 | -0.60 | 3.27 | – | 0.43 | 3.32 | ||||||||||||||||||||||||||||||||||||||||||
Returns are annualized for periods greater than 1 year. *Inception of the Institutional Class, May 11, 1994. Inception of the Institutional Class Z, July 17, 2017. Inception of the Investor Class, September 30, 2005. Index performance prior to January 1, 2001 cannot be shown since it relies on back-filled data.
Performance data quoted represents past performance; past performance does not guarantee future results. The investment return and principal value of an investment will fluctuate so that an investor’s shares, when redeemed, may be worth more or less than their original cost. Current performance of the Portfolio may be lower or higher than the performance quoted. Performance data current to the most recent month end may be obtained by calling (877) 435-8105 or visiting hardingloevnerfunds.com.
On a sector basis, only Energy was able to eke out modest gains during the period, as supply shocks from the war produced a meteoric rise in commodities prices. Consumer Discretionary and Information Technology (IT) performed the worst; the former was impacted by slumping consumer confidence in the face of surging prices, while central bank efforts to tame inflation hurt IT’s high-priced growth stocks.
All major regions declined. EMs performed the worst, largely due to Russia and China. The eurozone also performed poorly as the sharp rise in energy prices compounded the difficulties of countries already grappling with mounting inflation.
Style factors played a significant role. The most expensive stocks suffered from the regulatory mauling of many Chinese growth leaders and from a reassessment of discount rates in the face of rising inflation. Shares of the fastest-growing companies significantly underperformed their slowest-growing peers, while the highest-quality stocks failed to offer any protection, slightly underperforming their lowest-quality peers.
Performance Attribution
The Portfolio underperformed as style headwinds sustained throughout the period contributed to a negative stock-selection effect across most regions and sectors.
By sector, poor performers in Energy, Health Care, and Communication Services detracted the most from relative performance. In Energy and Communication Services, returns were dragged down by our Russian holdings: oil and gas company Lukoil and internet-search provider Yandex. As the Russian invasion unfolded, we marked down the value of our Russian holdings to zero on March 7, the point at which these US-and UK-listed shares became untradeable because of Western sanctions and actions taken by stock exchanges and brokers. In Health Care, Sysmex, a leading Japanese provider of hematology equipment and reagents, reported disappointing sales in China following the country’s lockdowns and its “Buy China” policy initiative, which overshadowed positive results for the company’s groundbreaking early-detection blood tests for Alzheimer’s. Strong stocks in Materials, including Australian mining company
Total Return Based on a $100,000 Investment Institutional Class
Total Return Based on a $10,000,000 Investment Institutional Class Z
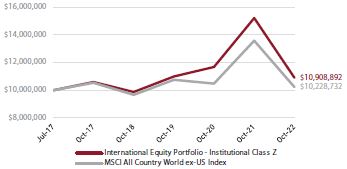
Total Return Based on a $5,000 Investment Investor Class
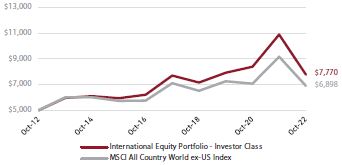
The charts above illustrate the hypothetical return of an investment made in the corresponding share classes. Investment return reflects voluntary fee waivers in effect. Absent such waivers, total return would be reduced. The performance provided in the table and charts above do not reflect the deduction of taxes that a shareholder would pay on Portfolio distributions or the redemption of Portfolio shares.
| 9 |
Table of Contents
BHP Group, helped our relative performance. Shares of BHP rose alongside the prices of commodities for which Russia is a major producer. It also helped that the Portfolio was underweight the poorly performing Consumer Discretionary sector.
On a regional basis, weak stocks in Japan, Europe—both in the eurozone and outside it—and Emerging Markets (Russia) were the biggest detractors from relative performance. In the eurozone, high-priced IT stocks, such as Dutch payment processor Adyen and French software and technology solutions company Dassault Systèmes, hurt returns, along with cyclically exposed German semiconductor maker Infineon Technologies. Outside the eurozone, Swiss contract drug manufacturer Lonza fell despite strong operating results, as investors became wary of expensive health care stocks. Pacific ex-Japan was a bright spot. Singapore-based bank DBS Group continued to show strong business momentum, supported by the financial strength that it has demonstrated throughout the pandemic. DBS also benefited from Singapore’s central bank tightening monetary conditions; net interest margins should rise alongside interest rates.
Perspective and Outlook
Within the span of a few months in the summer and fall of 2022, markets lurched from a consensus that the fight against inflation would soon be won toward a despairing view that slaying inflation would require sustained punishment by high interest rates. As practiced observers of both markets and policymakers, we have not put much belief in either narrative or tried to predict which outcome will ultimately drive the markets. Instead, we intensified our efforts to reaffirm the long-term prospects of the companies we own and those qualified for purchase by our analysts. We aim to build a portfolio of companies that is resilient to many different economic environments, knowing that we can’t predict which environment they will face tomorrow.
The global economy has been dramatically affected by Russia’s invasion of Ukraine and the still-unfolding energy crisis in Europe. Looking ahead, the risk that Taiwan could be the epicenter of a conflict between the US and China is one that we must push higher up the list of risks that our portfolio must be built to withstand. We have long viewed this risk as both low and distant; it is no longer distant. Nevertheless, we don’t pretend to be experts in US-China relations or try to forecast geopolitical events. Our strict adherence to our portfolio guidelines, including the requirement of ample geographic diversification, is one way we protect against the most catastrophic consequences.
Beyond geopolitical risks, the threat of inflation remains at the fore. Analyzing businesses’ resilience to persistent inflation is an area where we think we have a small leg up because many of our analysts have covered companies in developing countries where inflation has been an enduring concern. Moreover, for the last 15 years, our fair value estimates have explicitly incorporated inflation assumptions for every company we cover.
Yet another factor we must consider is an environment of positive real rates, which is exposing vulnerabilities built up over decades of easy money. The most concerning thus far have been the weaknesses hidden in some UK pension plans, whose structures were predicated on well-behaved interest rates. Their struggle to meet margin calls was the catalyst for the “whatever scale necessary” intervention by the Bank or England in its domestic bond market in September. Though similar vulnerabilities likely exist elsewhere, our longstanding preference for transparency and insistence on financial strength at the companies we hold is designed to keep our portfolios relatively sheltered from this kind of distress.
Portfolio Highlights
While heightened risk aversion fed by the war in Ukraine, dramatic currency movements, and interest rate hikes has roiled stock markets, we see far more underlying business resiliency than what is reflected in share prices. We continue to add to our investments in Japan, where many companies with global revenues benefit from the yen’s weakness. Recent additions have brought us close to the benchmark weight.
| Portfolio Positioning (% Weight) at October 31, 2022 |
| |||||||
| Sector | Portfolio | Benchmark1 | ||||||
| Comm Services |
2.7 | 5.7 | ||||||
| Cons Discretionary |
4.5 | 10.7 | ||||||
| Cons Staples |
12.2 | 9.1 | ||||||
| Energy |
2.8 | 6.6 | ||||||
| Financials |
21.2 | 20.9 | ||||||
| Health Care |
13.4 | 10.0 | ||||||
| Industrials |
15.4 | 12.5 | ||||||
| Info Technology |
13.7 | 10.9 | ||||||
| Materials |
9.5 | 8.1 | ||||||
| Real Estate |
0.0 | 2.2 | ||||||
| Utilities |
1.1 | 3.3 | ||||||
| Cash |
3.5 | – | ||||||
| Geography | Portfolio | Benchmark1 | ||||||
| Canada |
4.3 | 8.5 | ||||||
| Emerging Markets |
22.3 | 27.5 | ||||||
| Europe EMU |
20.8 | 20.3 | ||||||
| Europe ex-EMU |
25.0 | 21.2 | ||||||
| Frontier Markets2 |
0.0 | – | ||||||
| Japan |
13.5 | 14.1 | ||||||
| Middle East |
0.0 | 0.6 | ||||||
| Pacific ex-Japan |
9.1 | 7.8 | ||||||
| Other3 |
1.5 | – | ||||||
| Cash |
3.5 | – | ||||||
1MSCI All Country World ex-US Index; 2Includes countries with less-developed markets outside the Index. 3Includes companies classified in countries outside the Index.
| 10 |
Table of Contents
Overall, a weak yen is likely to be a modest net positive for our Japanese companies’ earnings by boosting their global competitiveness. These companies typically have leading global positions in their industries and generate much of their revenue outside their domestic market; in the short run, this results in a large translation gain for their yen-denominated earnings. Offsetting higher foreign revenues are rising imported costs for inputs such as energy and other raw materials along with semiconductors. Producer prices in Japan, which are heavily reliant on imported inputs, have risen more sharply on a year-over-year basis than Japanese consumer prices. In contrast, Japanese labor costs have risen only modestly over the year, and in foreign-currency terms they have fallen sharply, potentially giving our Japanese companies an enduring edge over their global competitors if they can, through cultural affinity, continue to retain talent without ballooning costs.
Our four Japanese Industrials holdings generate on average more than two-thirds of their sales outside of Japan and, based on latest estimates, appear to be on track to deliver positive 2022 earnings growth. Our biggest concern for these companies is that weaker global growth may erode the demand for capital goods.
Our most recent Japanese investment, Shimano, the world’s leading manufacturer of bicycle components with roughly a 70% global share of the high-end drivetrain and braking system market, has an even higher share of foreign sales, almost 90%. More than half of its sales come from Europe and North America, where customers pay a premium for its products. Sales are receiving a boost from the growing market for electric bikes, where Shimano components also dominate the top end. Yen weakness has provided an additional fillip, resulting in year-over-year sales and profit growth of 15% and 22%, respectively, in the first half of this year. The weaker exchange rate is making Shimano and the four industrial companies much more potent in competing against European and US manufacturers, so long as they can contain their domestic costs.
Japanese drugmakers Chugai Pharmaceutical and Shionogi are also enjoying an earnings boost from the weaker yen, as they generate on average a majority of their sales abroad, mainly in the form of royalties. Hematology testing systems maker Sysmex anticipates growth in 2023, helped by a large share of foreign revenues (84%) despite Chinese volumes being suppressed by that country’s lingering lockdowns. Despite producing 69% of its sales abroad, cosmetics maker Shiseido has not been so lucky due to its high direct exposure to the Chinese market (a third of revenues) and indirect exposure through domestic sales to Chinese tourists. To the extent that China’s consumer slowdown is a consequence of the lockdowns, and assuming travel restrictions eventually lift, we expect Shiseido’s revenues to recover in time.
NITORI, a furniture and home-accessories retailer, is our only Japanese holding where yen weakness is an unmitigated negative given that the company sells goods to domestic consumers that it primarily makes in China or Vietnam. The cost in yen to produce its merchandise is therefore rising, pressuring
| Ten Largest Holdings by Weight at October 31, 2022 | ||||||||
| Company | Sector | Market | % | |||||
| DBS Group |
Financials |
Singapore | 3.5 | |||||
| Samsung Electronics |
Info Technology |
South Korea | 3.4 | |||||
| Roche |
Health Care |
Switzerland | 3.4 | |||||
| Atlas Copco |
Industrials |
Sweden | 3.3 | |||||
| L’Oréal |
Cons Staples |
France | 3.3 | |||||
| Schneider Electric |
Industrials |
France | 2.8 | |||||
| SE Banken |
Financials |
Sweden | 2.6 | |||||
| ICICI Bank |
Financials |
India | 2.6 | |||||
| BHP |
Materials |
Australia | 2.6 | |||||
| AIA Group |
Financials |
Hong Kong | 2.5 | |||||
Nitori’s margins. In the first half of 2022, Nitori held the line on retail prices while investing in ways to cut its operating costs, which at least has been easier than for peers given its vertical integration across manufacturing, distribution, and online and brick-and-mortar points of sale. Recently, management indicated it will hike prices on selected products by as much as 20%, having seen competitors do the same and noting Japanese shoppers’ reluctant acceptance of increases across consumer categories.
As interest rates rise globally, we have become more optimistic about the Financials sector; incremental purchases and relative performance over the period increased our holdings by more than a third so that we now hold the index weight in banks and remain overweight insurance. Banks and life insurance companies are among businesses that should benefit most from higher interest rates. Rising rates tend to increase net interest margins for banks, and they augment the returns from new fixed income investments for life insurance companies while reducing the capital they need to set aside today to meet future claims. The Financials sector has performed relatively well during the period—notwithstanding the potential for loan losses a global recession might inflict on banks—outperforming all other sectors except Energy and Utilities.
But, while higher interest rates are positive for business, extreme volatility in bond markets is not, given banks’ and insurers’ roles as counterparties to complex derivative contracts and holders of collateral against leveraged positions of more prosaic instruments. In balancing sentiment in the short term, fear of as yet unseen exposures can outweigh the greed of longer-term benefits of higher yields. The insurance sector fell victim recently to extreme volatility in the gilts market. While shares of our own insurance holdings such as AIA Group, Ping An Insurance, and Allianz likely have been dented by negative marks in their investment portfolios, we view this and their pandemic-related disruptions (in the case of AIA Group and Ping An Insurance) and regulatory compliance lapses (Allianz) to be transitory. We value their low leverage and the low sensitivity of their product sales to the economic cycle.
Please read the separate disclosures page for important information, including the risks of investing in the Portfolio.
| 11 |
Table of Contents
International Small Companies Portfolio
Institutional Investors: HLMRX | Individual Investors: HLMSX
Portfolio Management Team

Jafar Rizvi, CFA
Co-Lead Portfolio Manager
Anix Vyas, CFA
Co-Lead Portfolio Manager
Performance Summary
For the International Small Companies Portfolio, the Institutional Class declined 31.20% and the Investor Class declined 31.39% (net of fees and expenses) in the twelve-month period ended October 31, 2022. The Portfolio’s benchmark, the MSCI All Country World ex-US Small Cap Index, declined 27.75% (net of source taxes).
What Happened
International small capitalization stocks fell sharply in the period amid aggressive central bank rate hikes intended to cool inflation, commodity supply shocks emanating from the war in Ukraine, and overall weakness in China.
The period began with consumer prices in the US climbing at the fastest pace since 1982, leading the US Federal Reserve (Fed) to signal several interest rate increases and an imminent end to its bond-buying program. So far, the Fed has hiked interest rates six times, taking rates from between 0% and 0.25% at the start of the period to between 3.75% and 4% by November 2. Other central bankers across developed and emerging markets continued to raise their own borrowing rates, with Bank of Japan the notable exception as it remained committed to an ultra-accommodative monetary policy.
Russia’s invasion of Ukraine in the closing days of February prompted a swift and emphatic response by Western governments, which nevertheless sought to strike a balance between punishing Russian aggression and avoiding an escalating military conflict. The US and its allies enacted crippling economic sanctions, including freezing a significant
| Fund Facts at October 31, 2022 | ||||
| Total Net Assets |
$488.0M |
|||
| Sales Charge |
None |
|||
| Number of Holdings |
86 |
|||
| Turnover (5 Yr. Avg.) |
31% |
|||
| Dividend Policy |
Annual |
|||
| Institutional Investors | Individual Investors | |||
| Institutional Class | Investor Class | |||
| Ticker |
HLMRX |
HLMSX | ||
| CUSIP |
412295875 |
412295883 | ||
| Inception Date |
6/30/2011 |
3/26/2007 | ||
| Minimum Investment1 |
$100,000 |
$5,000 | ||
| Net Expense Ratio2 |
1.12%3 |
1.30%4 | ||
| Gross Expense Ratio2 |
1.12% |
1.46% | ||
1Lower minimums available through certain brokerage firms; 2The Gross and Net Expense Ratios are as of the most recent Prospectus and have been restated to reflect current fees; 3Harding Loevner’s contractual agreement caps the net expense ratio at 1.15% through February 28, 2023. The expense ratio (without cap) is applicable to investors; 4The Net Expense Ratio is shown net of Harding Loevner’s contractual agreement through February 28, 2024. Harding Loevner’s contractual agreement caps the net expense ratio at 1.30%. The Net Expense Ratio is applicable to investors.
share of Russian central bank reserve assets, cutting off many of the country’s banks from SWIFT (Society for Worldwide Interbank Financial Telecommunications), and outlawing the export of a variety of industrial and luxury goods to Russia. The revulsion over Russia’s actions also provoked an exodus of Western companies from Russian markets. With foreign investors effectively unable to trade, major market index providers expunged all Russian securities from their indexes.
The war’s contribution to inflation was twofold. In September, Russia retaliated against European sanctions by cutting off the flow of natural gas to the continent, sending energy prices soaring as countries scrambled to find other sources. In emerging markets (EMs), the pressures were largely felt in ballooning food prices. Prior to the war, Ukraine was one of the world’s largest suppliers of grains and vegetable oils, and EM countries have been hard-pressed to find alternatives.
China grappled with its own set of challenges. The government’s sweeping lockdown measures in response to waves of COVID-19 cases in major Chinese cities hurt businesses in various industries and caused investors to lose their appetite for Chinese stocks. In the Real Estate sector, regulators’ efforts to prick the country’s residential real estate bubble caused severe strain, as even less-leveraged developers faced resistance to rolling over their debt or issuing new bonds. In Health Care, shares of Chinese biological pharmaceutical companies came under pressure after US President Joe Biden issued an executive order
| 12 |
Table of Contents
Performance (% Total Return)
| For periods ended September 30, 2022 | For periods ended October 31, 2022 | |||||||||||||||||||||||||||||||||||||||||||||||
| 1 Year |
3 Years |
5 Years |
10 Years |
Since Inception* Jun-11 Mar-07 |
1 Year |
3 Years |
5 Years |
10 Years |
Since Inception* Jun-11 Mar-07 |
|||||||||||||||||||||||||||||||||||||||
| Intl. Small Companies Portfolio – Inst. Class |
-31.40 | 0.29 | 0.15 | 5.46 | 4.32 | -31.20 | 0.36 | 0.67 | 5.88 | 4.61 | ||||||||||||||||||||||||||||||||||||||
| Intl. Small Companies Portfolio – Investor Class |
-31.58 | 0.03 | -0.10 | 5.20 | 4.51 | -31.39 | 0.11 | 0.41 | 5.62 | 4.71 | ||||||||||||||||||||||||||||||||||||||
| MSCI All Country World ex-US Small Cap Index |
-28.93 | 0.38 | -0.56 | 4.44 | 3.04 | – | -27.75 | 0.13 | -0.29 | 4.77 | 3.30 | – | ||||||||||||||||||||||||||||||||||||
Returns are annualized for periods greater than 1 year. *Inception of the Institutional Class, June 30, 2011. Inception of the Investor Class, March 26, 2007. Index performance prior to June 1, 2007 cannot be shown since it relies on back-filled data.
Performance data quoted represents past performance; past performance does not guarantee future results. The investment return and principal value of an investment will fluctuate so that an investor’s shares, when redeemed, may be worth more or less than their original cost. Current performance of the Portfolio may be lower or higher than the performance quoted. Performance data current to the most recent month end may be obtained by calling (877) 435-8105 or visiting hardingloevnerfunds.com.
advancing a “secure American bioeconomy,” fueling fears that these businesses may get shut out from the lucrative US market.
Energy was the only positive sector during the period, soaring over 20% as supply shocks from the war produced a meteoric rise in commodities prices. Health Care, Communication Services, Information Technology (IT), Consumer Discretionary, and Real Estate all declined by more than 30%. Consumer Discretionary stocks were impacted by slumping consumer confidence in the face of surging prices, while central bank efforts to tame inflation hurt fast-growing stocks that comprise the IT sector.
All major regions declined. Europe (both inside and outside the eurozone) performed the worst as the sharp rise in energy prices compounded the difficulties of countries already grappling with mounting inflation. EMs also performed poorly, largely due to Russia and China.
Style factors played a significant role. Shares of the fastest-growing and highest-quality companies significantly underperformed their slowest-growing and lowest-quality peers. By value, the cheapest stocks were favored, outperforming the most expensive by more than 1,700 basis points.
How We Did
The Portfolio’s concentration of richly valued, fast-growing, and high-quality companies, a hazard of our investment philosophy, hurt relative performance in a period during which investors fled these stocks. The Portfolio’s emphasis on companies in the highest-quality cohort accounted for approximately 45% of our underperformance in the period. Many of these high-quality companies also happened to be among the most expensive, which provided a dual headwind given value’s outperformance. Examples include Bechtle, a Germany-based provider of IT services and related hardware and Dechra, a UK-based manufacturer of animal pharmaceuticals. Bechtle detracted as higher wages, as well as increases in travel and energy costs, impacted margins and offset good revenue growth. Dechra declined in the face of cost inflation and increased competition from generics. The company also completed two acquisitions that will be dilutive to earnings this year and next. However, the drug pipelines in both deals look promising for Dechra’s growth
outlook, which is underpinned by rising demand in the US for pet medicines.
By sector, poor performers in Materials and Industrials detracted the most from relative returns. In Materials, Vietnamese steel producer Hoa Phat Group fell as troubles in Vietnam’s real estate market reduced demand for steel; meanwhile, the price of coking coal (which accounts for a sizable percentage of steel production costs) has risen sharply since Russia’s invasion of Ukraine. In Industrials, shares of Switzerland-based industrial-components supplier Bossard
Total Return Based on a $100,000 Investment Institutional Class
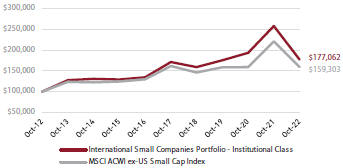
Total Return Based on a $5,000 Investment Investor Class
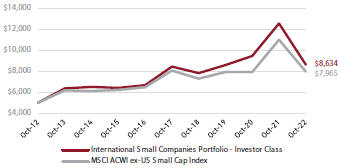
The charts above illustrate the hypothetical return of an investment made in the corresponding share classes. Investment return reflects voluntary fee waivers in effect. Absent such waivers, total return would be reduced. The performance provided in the table and charts above do not reflect the deduction of taxes that a shareholder would pay on Portfolio distributions or the redemption of Portfolio shares.
| 13 |
Table of Contents
fell despite continued strong demand for its fasteners, as investors grew wary of the company’s exposure to the weakening European economy. Strong stocks in Communication Services helped, particularly Swedish video game maker Paradox Interactive. Paradox announced record profits in both the first and second quarters, helped by weakness in the Swedish krona (much of the company’s revenue is in US dollars) and a management reshuffle that’s led to a renewed focus on Paradox’s core gaming franchises.
On a regional basis, weak stocks in Japan and the Portfolio’s off-benchmark exposure to Frontier Markets (Vietnam) detracted. Our worst performer in Japan was Infomart, the dominant business-to-business online-ordering platform for the country’s restaurant industry. Inflation and the lingering impact of the pandemic on restaurants have put a damper on some of the business’s near-term growth. Over the long term, we expect Infomart’s online-invoicing technology to benefit from regulations intended to promote greater adoption of online and digital services to combat Japan’s persistent labor shortages. Strong stocks in Europe outside the eurozone and in Emerging Markets were positive contributors. UK-listed but Georgia-based Bank of Georgia has prospered not just despite, but also because of its proximity to the Ukrainian conflict, as businesses and workers fleeing nearby Russia have led to more money flowing through Georgia’s economy, including into restaurants and real estate. Brazilian rental-car business Localiza reported strong quarterly results throughout 2022, including strong profit and margin growth, as supply-chain challenges eased and allowed the company to obtain new vehicles. Localiza also finalized its merger with Unidas in July.
What’s On Our Minds
Our exposure to Europe warrants a closer look. Although the Portfolio remains diversified across 10 countries and many sectors, compared with the index it has a strikingly high presence in Germany and seemingly the UK. The notional overweight to the UK is deceptive, as it includes four London-listed companies—roughly 5% of portfolio weight—that don’t generate meaningful sales or profits in the country: telecommunications carrier Airtel Africa, Lithuania-based Baltic Classifieds, the aforementioned Bank of Georgia, and payments company Network International, which generates most of its revenue in the Middle East and Africa.
That said, we haven’t neglected the UK itself. During the third quarter, we added Grafton, the parent of the Woodie’s chain of retail home improvement stores and construction materials distributors such as Selco and Chadwicks. In a competitive market the company’s edge comes from its knowledgeable staff and large product selection. In recent years, it has expanded into Finland, Ireland, and the Netherlands, and could stand to benefit from the weaker pound. As a skilled capital allocator armed with a net-cash balance sheet in a deteriorating economy, Grafton may successfully unearth more businesses ripe for acquisition.
The Grafton purchase illustrates that we invest in companies, not countries, and that our investment process is based upon bottom-up business forecasts rather than macroeconomic forecasts. Focusing on businesses that are growing on the back of durable competitive advantages, well led by properly incentivized management teams, financially strong, and reasonably valued has helped us generate excess returns through past economic cycles.
That last criterion—valuation—caused us to reduce some holdings in favor of more attractively priced alternatives. As investors’ fears of a collapse in the UK housing market weigh on Rightmove, the country’s dominant online real estate platform, we decided to reduce this holding to make room for Rightmove’s Lithuanian counterpart, Baltic Classifieds, which was the cheapest stock in the online-classifieds industry despite posting the fastest growth and facing low competitive threats. We also added to Cranswick, a UK chicken and pork processor, following a tour of its new processing facility. Cranswick’s focus on both low-cost and premium cuts is advantageous in a period of economic uncertainty.
Portfolio Positioning (% Weight) at October 31, 2022
| Sector | Portfolio | Benchmark1 | ||||||
| Comm Services |
12.0 | 3.6 | ||||||
| Cons Discretionary |
4.3 | 11.5 | ||||||
| Cons Staples |
8.4 | 6.2 | ||||||
| Energy |
1.9 | 4.5 | ||||||
| Financials |
7.9 | 11.4 | ||||||
| Health Care |
12.1 | 7.0 | ||||||
| Industrials |
17.3 | 19.9 | ||||||
| Info Technology |
22.6 | 10.6 | ||||||
| Materials |
6.7 | 11.7 | ||||||
| Real Estate |
0.6 | 9.9 | ||||||
| Utilities |
2.2 | 3.7 | ||||||
| Cash |
4.0 | – | ||||||
| Geography | Portfolio | Benchmark1 | ||||||
| Canada |
2.0 | 8.0 | ||||||
| Emerging Markets |
23.1 | 26.2 | ||||||
| Europe EMU |
18.6 | 13.0 | ||||||
| Europe ex-EMU |
30.7 | 19.6 | ||||||
| Frontier Markets2 |
5.1 | – | ||||||
| Japan |
11.9 | 20.5 | ||||||
| Middle East |
2.2 | 2.1 | ||||||
| Pacific ex-Japan |
0.3 | 10.6 | ||||||
| Other3 |
2.1 | – | ||||||
| Cash |
4.0 | – | ||||||
1MSCI All Country World ex-US Small Cap Index; 2Includes countries with less-developed markets outside the Index; 3Includes companies classified in countries outside the Index.
| 14 |
Table of Contents
Ten Largest Holdings by Weight at October 31, 2022
| Company | Sector | Market | % | |||
| Cyberark |
Info Technology |
Israel | 2.2 | |||
| Reply |
Info Technology |
Italy | 2.2 | |||
| Rubis |
Utilities |
France | 2.2 | |||
| Abcam |
Health Care |
United Kingdom | 2.2 | |||
| Senior |
Industrials |
United Kingdom | 2.1 | |||
| Bank of Georgia |
Financials |
United Kingdom | 2.1 | |||
| Kinaxis |
Info Technology |
Canada | 2.0 | |||
| Alten |
Info Technology |
France | 2.0 | |||
| Keywords Studios |
Info Technology |
United Kingdom | 2.0 | |||
| Sarana Menara Nusantara |
Comm Services |
Indonesia | 2.0 | |||
In Germany, a crucible in the European energy crisis, none of our holdings directly faces natural gas supply risks. Pressure can be felt in electricity costs, but generally these are a small component of overall costs. One company that warrants our watching closely is Fuchs Petrolub, the world’s top producer of lubricants, used to grease everything from vehicle steering wheels and transmission systems to wind turbines. Lubricants are made from base oils, a byproduct of the oil-refining process. Should Fuchs’s German suppliers experience production cuts that force it to tap the global market for raw materials, it would suffer higher costs and perhaps lower margins. So far, though, Fuchs has exhibited tremendous pricing power in an inflationary environment. Looking further ahead, Fuchs is poised to benefit from the growing interest in wind energy and the shift to electric vehicles, which require specialized greases.
We have continued to be net buyers in Germany, most recently adding Evotec, shares of which had gotten cheaper relative to historical levels. Evotec is a contract research company focused on discovering new drug candidates for its clients. The company provides a differentiated offering through its extensive experience with pluripotent stem cells (which can self-renew and develop into other cells in the body), genomics (the study of genes), and proteomics (the systematic study of proteins). Evotec also utilizes its platforms to discover its own drug candidates and then partners with biopharmaceutical companies at the point of clinical trial. Revenue increased 24% in the first half of 2022, and the factors currently hurting its stock price—a global pullback in biotech funding and Europe’s energy crisis—appear to be temporary.
Please read the separate disclosures page for important information, including the risks of investing in the Portfolio.
| 15 |
Table of Contents
Institutional Investors: HLMEX and HLEZX | Individual Investors: HLEMX
Portfolio Management Team

Pradipta Chakrabortty
Co-Lead Portfolio Manager
Scott Crawshaw
Co-Lead Portfolio Manager
Richard Schmidt, CFA
Portfolio Manager
Performance Summary
The Institutional Emerging Markets Portfolio (Institutional Class and Institutional Class Z) and the Emerging Markets Portfolio (Advisor Class)—collectively, the “Portfolios”—are both managed in strict accordance with Harding Loevner’s Emerging Markets Equity strategy model portfolio. Therefore, the Portfolios have highly similar holdings and characteristics. We have provided a single commentary to cover both Portfolios. The specific performance and characteristics of each are presented separately in the tables that follow.
For the Institutional Emerging Markets Portfolio, the Institutional Class fell 37.14%, and Institutional Class Z fell 37.07% (net of fees and expenses) for the fiscal year ended October 31, 2022. In the same time period, the Emerging Markets Portfolio Advisor Class declined 37.18% (net of fees and expenses). The Portfolios’ benchmark, the MSCI Emerging Markets Index, fell 31.03% (net of source taxes).
Market Review
Emerging markets (EMs) were burdened by a series of adverse macroeconomic and geopolitical events this fiscal year. The period began with heightened concerns over inflation and a slowdown in China’s economic growth, and fears of a global recession intensified over the course of the 12 months. In February came Russia’s appalling attack on Ukraine, which led the US and its allies to enact severe sanctions against Russia and caused spikes in energy and commodities prices. The US Federal Reserve’s hawkish monetary policy to combat inflation—including four 75-basis-point interest rate hikes from June to November—stoked a surge in the value of the US dollar.
| Fund Facts at October 31, 2022 | ||||||
| Sales Charge |
None |
|||||
| Number of Holdings |
78 |
|||||
| Dividend Policy |
Annual |
|||||
| Institutional Investors | Individual Investors | |||||
| Total Net Assets |
$2,664.4M |
$1,397.8M | ||||
| Turnover (5 Yr. Avg.) |
20% |
22% | ||||
| Inst. Class | Inst. Class Z | Advisor Class | ||||
| Ticker |
HLMEX |
HLEZX | HLEMX | |||
| CUSIP |
412295701 |
412295693 | 412295305 | |||
| Inception Date |
10/17/2005 |
3/5/2014 | 11/9/1998 | |||
| Minimum Investment |
$500,0001 |
$10,000,000 | $5,0001 | |||
| Net Expense Ratio2 |
1.10%3 |
1.00%4 | 1.19%5 | |||
| Gross Expense Ratio2 |
1.10% |
1.01% | 1.19% | |||
1Lower minimums available through certain brokerage firms; 2The Gross and Net Expense Ratios are as of the most recent Prospectus and have been restated to reflect current fees; 3Harding Loevner’s contractual agreement caps the net expense ratio at 1.10% through February 28, 2023. The expense ratio (without cap) is applicable to investors; 4The Net Expense Ratio is shown net of Harding Loevner’s contractual agreement through February 28, 2023. Harding Loevner’s contractual agreement caps the net expense ratio at 1.00%. The Net Expense Ratio is applicable to investors; 5Harding Loevner’s contractual agreement caps the net expense ratio at 1.30% through February 28, 2023. The expense ratio (without cap) is applicable to investors.
While the strength of the dollar weighed on dollar-denominated EM returns, the currencies of many developing countries held up better against the greenback than those of developed countries. In Latin America, central banks, including Brazil’s, were ahead of the Fed in lifting rates, bringing these nations closer to the peaks of their tightening cycles. By contrast, Asian countries, including India and Indonesia, resisted pressure to match the Fed’s hikes. China’s monetary policy remained loose, in keeping with the government’s imperative to stimulate a slowing economy.
Markets in the Middle East and Latin America were among the strongest, buoyed in part by the rising (albeit volatile) price of oil. Brazil was boosted by returns from energy giant Petrobras along with an uptick in consumer spending and a recovery in the job market. Signs that the country’s inflation had crested also provided a lift to growth stocks.
After Russia, China was the second-worst performing EM. Its woes were reflected in the sharp declines in the Consumer Discretionary, Real Estate, and Communication Services sectors. The country’s “zero-COVID” policy disrupted normal life and consumer-spending patterns for much of the year. Regulators’ efforts to prick China’s residential real estate bubble also caused home prices to decline, prompting regulators to offer more credit support to help developers complete unfinished projects. Advertising spending, a key source of revenue for Communication Services companies such as Baidu and Tencent, also saw a pullback.
| 16 |
Table of Contents
Performance (% Total Return)
| For periods ended September 30, 2022 | For periods ended October 31, 2022 | |||||||||||||||||||||||||||||||||||||||||||||||||||||||
| 1 Year |
3 Years |
5 Years |
10 Years |
Since Inception* Oct-05 Mar-14 Nov-98 |
1 Year |
3 Years |
5 Years |
10 Years |
Since Inception* Oct-05 Mar-14 Nov-98 |
|||||||||||||||||||||||||||||||||||||||||||||||
| Inst. Emerging Markets Portfolio – Inst. Class |
-36.08 | -6.96 | -4.93 | 0.60 | 3.94 | -37.14 | -8.29 | -5.33 | 0.42 | 3.90 | ||||||||||||||||||||||||||||||||||||||||||||||
| Inst. Emerging Markets Portfolio – Inst. Class Z |
-36.05 | -6.86 | -4.80 | – | -0.06 | -37.07 | -8.19 | -5.21 | – | -0.10 | ||||||||||||||||||||||||||||||||||||||||||||||
| Emerging Markets Portfolio – Advisor Class |
-36.07 | -7.06 | -5.01 | 0.53 | 8.22 | -37.18 | -8.39 | -5.42 | 0.37 | 8.17 | ||||||||||||||||||||||||||||||||||||||||||||||
| MSCI Emerging Markets Index |
-28.11 | -2.07 | -1.81 | 1.05 | 4.50 | 1.39 | – | -31.03 | -4.42 | -3.09 | 0.79 | 4.28 | 1.01 | – | ||||||||||||||||||||||||||||||||||||||||||
Returns are annualized for periods greater than 1 year. *Inception of Institutional Class, October 17, 2005. Inception of Class Z, March 5, 2014. Inception of the Advisor Class, November 9, 1998. Index performance prior to January 1, 2001 cannot be shown since it relies on back-filled data.
Performance data quoted represents past performance; past performance does not guarantee future results. The investment return and principal value of an investment will fluctuate so that an investor’s shares, when redeemed, may be worth more or less than their original cost. Current performance of the Portfolio may be lower or higher than the performance quoted. Performance data current to the most recent month end may be obtained by calling (877) 435-8105 or visiting hardingloevnerfunds.com.
Utilities was the most resilient sector. Financials also outperformed thanks to Brazilian, Indian, and Indonesian banks, which enjoyed robust growth in retail lending and expanding net interest margins amid rising interest rates.
Performance Attribution
The Portfolio’s underperformance this year was primarily caused by our Russian investments. We hold four companies in three sectors: Energy (Novatek and Lukoil, prominent players in the global oil and gas industry); Communication Services (Yandex, Russia’s dominant search engine), and Financials (Sberbank, Russia’s leading banking franchise). At the end of January, these holdings represented about 8.0% of the Portfolio, a significant overweight versus the Index. Soon after Russia’s invasion of Ukraine, the US- and UK-listed shares we hold became untradeable because of Western sanctions and actions taken by stock exchanges and brokers. On March 7, we marked down the value of these Russian holdings to effectively zero.
In Financials, the negative impact of Sberbank was partly mitigated by strong positive contributions from holdings in high-quality banks in Asia and Latin America, including Indonesia’s Bank Central Asia, Brazil’s Itaú Unibanco, and Mexico’s GF Banorte. These companies enjoyed an acceleration in lending growth and a boost in margins from higher interest rates without a notable deterioration in asset quality. The Portfolio outperformed in the Consumer Discretionary sector, where the recovery from COVID-19 triggered a resurgence in the sale of physical goods. This benefited holdings such as Indian automaker Maruti Suzuki, Astra International, which distributes Toyota vehicles in Indonesia, and Brazilian retailer Lojas Renner. As Lojas Renner’s revenue surged, its effective cost management produced solid margins.
The Portfolio’s underweight in Communication Services and overweight in Industrials were also helpful. On a regional basis, the largest detractors after Russia were South Korea and Taiwan. South Korean personal-care and household-products company LG Household & Health Care was hurt by the decline in cosmetics sales in China caused by pandemic-related shutdowns. A drop in the number of Chinese
Total Return Based on a $500,000 Investment Institutional Class
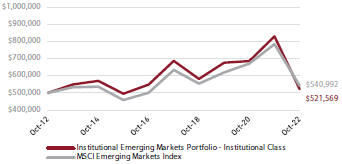
Total Return Based on a $10,000,000 Investment Institutional Class Z
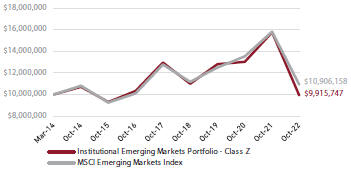
Total Return Based on a $5,000 Investment Advisor Class
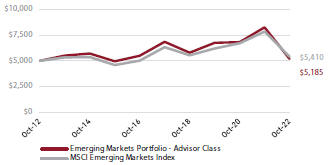
The charts above illustrate the hypothetical return of an investment made in the corresponding share classes. Investment return reflects voluntary fee waivers in effect. Absent such waivers, total return would be reduced. The performance provided in the table and charts above do not reflect the deduction of taxes that a shareholder would pay on Portfolio distributions or the redemption of Portfolio shares.
| 17 |
Table of Contents
citizens traveling abroad on shopping trips—a significant source of LG’s revenues—also hurt. In Taiwan, power-management and analog-chips designer Silergy declined after lowering guidance for the second half of 2022, citing weakening demand in PC and consumer markets.
The Portfolio’s underweight to China and overweight to Brazil and Mexico were helpful this year.
Perspective and Outlook
In a world at odds with itself, as leading nations fight acute economic challenges and look to mold a new order that preserves or advances their global standing, investors flocked this fiscal year to the relative safety of the US dollar. It is widely accepted that, in the face of a strengthening dollar, emerging-market equities will struggle to generate competitive (dollar-based) returns. Indeed, through much of the past 25 years, the dollar-based returns of the MSCI EM Index relative to the developed-market MSCI World Index have been negatively correlated with the strength of the greenback.
One explanation for this relationship is that many EM countries and companies issue dollar-denominated debt, often without a matched source of hard-currency income; a strong dollar makes the debt more costly to pay off. The so-called fragile countries—those burdened with persistent reliance on external financing, such as Brazil, Turkey, Indonesia, and South Africa—are perceived to suffer most in strong-dollar environments.
Macroeconomic predictions don’t direct our investment process. If they did, and if we had correctly foreseen that fiscal 2022 would witness extreme dollar appreciation, the conventional portfolio-construction action would have been to reduce exposure to the stock markets of the most fragile countries. But even though our dollar forecast would have been spot-on, thus far our portfolio reallocations would not have reaped the expected reward—not when countries such as Brazil, Indonesia, and Turkey have produced some of the best returns year to date. This is a good illustration of the futility of basing investment decisions on macroeconomic forecasts.
We wonder whether the recent pattern of returns across EMs and the high dispersion among them partly reflect something new and enduring: the early stages of profound shifts in global supply chains. Various industrialized countries, most notably the US, have been adjusting their industrial policies in reaction to the supply shocks emanating from the pandemic. Geopolitical priorities and strategies are also changing as the world transitions to a multipolar power structure, accelerated by Russia’s invasion of Ukraine. The industrial policy changes are designed to alter companies’ long-term operational decisions and investment plans. The “lowest-cost” strategy that companies pursued for more than a generation, and which led to a high concentration of global manufacturing in China, is giving way to strategies that place greater emphasis on the security of supply chains and control over technology.
The Portfolio holds several EM companies that should be aided by this change in emphasis, including LONGi, China’s largest manufacturer of solar components and a critical player in global solar power generation. The long-term pivot toward renewable energy has been given extra impetus by the crisis surrounding fossil fuel production and distribution since Russia invaded Ukraine. Another example is Aspeed, a Taiwanese fabless chip designer that commands a roughly 70% share of the niche market for baseboard management controllers (BMC), which facilitate data centers by rebooting a problematic component when a server freezes. As data centers become increasingly complex, BMCs provide the ability to manage server components and their security remotely on a more granular level.
The US government’s new industrial policy initiatives appear relevant to both companies’ competitive markets. In August, Congress passed two significant pieces of legislation intended to alter the competitive dynamics and global structure of
Portfolio Positioning (% Weight) at October 31, 2022
| Sector |
Institutional HLMEX / HLEZX |
Advisor HLEMX |
Benchmark1 | |||||||||
| Comm Services |
5.5 | 5.5 | 8.7 | |||||||||
| Cons Discretionary |
16.0 | 16.0 | 12.2 | |||||||||
| Cons Staples |
7.0 | 7.0 | 6.5 | |||||||||
| Energy |
1.9 | 1.9 | 5.6 | |||||||||
| Financials |
25.4 | 25.4 | 23.6 | |||||||||
| Health Care |
3.3 | 3.3 | 4.1 | |||||||||
| Industrials |
14.1 | 14.1 | 6.1 | |||||||||
| Info Technology |
21.4 | 21.4 | 19.1 | |||||||||
| Materials |
1.0 | 1.0 | 9.1 | |||||||||
| Real Estate |
1.8 | 1.8 | 1.8 | |||||||||
| Utilities |
1.0 | 1.0 | 3.2 | |||||||||
| Cash |
1.6 | 1.6 | – | |||||||||
| Geography | Institutional HLMEX / HLEZX |
Advisor HLEMX |
Benchmark1 | |||||||||
| Brazil |
10.8 | 10.8 | 6.5 | |||||||||
| China + Hong Kong2 |
26.5 | 26.5 | 26.9 | |||||||||
| India |
14.5 | 14.5 | 16.2 | |||||||||
| Mexico |
7.2 | 7.2 | 2.6 | |||||||||
| Russia |
0.0 | 0.0 | – | |||||||||
| South Africa |
1.8 | 1.8 | 3.7 | |||||||||
| South Korea |
8.4 | 8.4 | 11.9 | |||||||||
| Taiwan |
10.2 | 10.2 | 13.5 | |||||||||
| Small Emerging Markets3 |
9.4 | 9.4 | 18.7 | |||||||||
| Frontier Markets4 |
1.7 | 1.7 | – | |||||||||
| Developed Markets Listed5 |
7.9 | 7.9 | – | |||||||||
| Cash |
1.6 | 1.6 | – | |||||||||
1MSCI Emerging Markets Index; 2The Emerging Markets Portfolio’s end weight in China at October 31, 2022 is 22.0% and Hong Kong is 4.5%. The Benchmark does not include Hong Kong; 3Includes the remaining emerging markets which, individually, comprise less than 5% of the Index; 4Includes countries with less-developed markets outside the Index; 5Includes emerging markets or frontier markets companies listed in developed markets.
| 18 |
Table of Contents
certain industries: the CHIPS and Science Act (CSA), which aims to secure an advantage for the US in accessing the supply of semiconductors; and the Inflation Reduction Act (IRA), which features an unprecedented US$391 billion directed at climate change and energy transition.
Critically, the incentive packages in the CSA restrict participating companies from making additional investments in countries that present a threat to the US—namely China. If the primary objective is to attract the leading chip technology to the US, it would require the participation of Taiwan’s TSMC and South Korea’s Samsung Electronics, both of which have manufacturing capabilities in China that they are unlikely to give up. This leads us to suspect the CSA’s investment restrictions will be negotiable. It makes sense for these companies to diversify their capacity and gain greater proximity to some of their most important customers by expanding capacity in the US. That said, the cost of manufacturing in the US will likely remain materially higher than in Asia until the US-based supply chain reaches sufficient scale. There is fear that these increased costs will come at a time when the financial wherewithal to spend on technology is constrained by a recession. The risk of a structural deceleration in growth has increased, but we continue to think that rapidly expanding applications for semiconductors support long-term growth prospects for the industry.
Turning from chips to solar, higher tax credits earmarked for solar projects in the IRA, the other major piece of industrial legislation, should both improve solar’s cost relative to other energy sources and incentivize equipment makers to invest in US manufacturing capacity. Fortunately for LONGi, the IRA doesn’t exclude participants based on their country of origin. Securing enduring access to the US market may provide LONGi with a significant growth opportunity at attractive economics.
As nations jostle to enhance the security of their supply chains, it behooves us to analyze the security of operations and revenue opportunities for individual companies and look for those that stand to benefit from the changes afoot. Though it is impossible to predict with confidence the detail of policy changes and their ramifications, financially strong businesses with a competitive edge hold the advantage. It is intriguing that, in this bear market, stocks of the highest-quality companies have been less resilient than in previous market sell-offs, shrinking their valuation premiums. This improves the prospects for strong relative returns from shares of high-quality, growing companies and bolsters the case for holding them.
Portfolio Highlights
In July we welcomed to the leadership of the strategy a new co-lead portfolio manager, Pradipta Chakrabortty, who joins Scott Crawshaw in selecting the Portfolio’s holdings from among the stocks researched by our analysts. Pradipta has run a “paper” model portfolio as a portfolio manager on the EM team for the past eight years. The leadership transition resulted in no material change to the Portfolio’s quality-growth characteristics.
Ten Largest Holdings by Weight (%) at October 31, 2022
| Company | Sector | Market | Institutional HLMEX / HLEZX |
Advisor HLEMX |
||||||||
| Samsung Electronics |
Info Technology |
South Korea | 5.0 | 5.0 | ||||||||
| TSMC |
Info Technology |
Taiwan | 4.3 | 4.3 | ||||||||
| Tata Consultancy Services |
Info Technology |
India | 3.9 | 3.9 | ||||||||
| HDFC Bank |
Financials |
India | 2.9 | 2.9 | ||||||||
| Walmart de México |
Cons Staples |
Mexico | 2.8 | 2.8 | ||||||||
| GF Banorte |
Financials |
Mexico | 2.5 | 2.5 | ||||||||
| EPAM |
Info Technology |
US | 2.5 | 2.5 | ||||||||
| Localiza |
Industrials |
Brazil | 2.4 | 2.4 | ||||||||
| HDFC Corp. |
Financials |
India | 2.2 | 2.2 | ||||||||
| AIA Group |
Financials |
Hong Kong | 2.2 | 2.2 | ||||||||
New purchases during the fiscal year included Asian Paints, the Portfolio’s first holding in the Materials sector since early 2020. The he company is a leading manufacturer in India of consumer-focused decorative paints and paints for industrial applications. The company’s key competitive advantage is its extensive distribution network, which spans 15 countries across South and Southeast Asia and the Middle East, including more than 145,000 retail outlets in India alone. It has delivered an average return on equity of 25% over the past five years and should benefit from rising income levels and increasing urbanization in key markets.
Our new holding in the Gulf Cooperation Council region is Emaar Properties, a UAE real estate company whose flagship developments in Dubai include the Burj Khalifa (the tallest building in the world) and the Dubai Mall (among the largest in the world). The company’s large land bank—about 1.7 billion square feet mostly in prime locations in Dubai—is a significant competitive advantage, as is the UAE government’s large stake in Emaar, which provides the company privileged access to the most-promising development opportunities. We should see strong earnings growth for the company as improving economic activity in the UAE fuels consumer spending.
In China, we trimmed two Communication Services holdings, Baidu and Tencent, on concerns about weakening advertising revenue. We also sold our holding in cybersecurity company Sangfor, partly because the company seemed to be losing market share among government-owned businesses.
Our new purchases in China included a previous holding, Trip. com Group, which is responsible for half of China’s online travel bookings. Among its more than 50,000 travel partners are many upscale hotels, and this abundance of choice continues to attract a vast user base. Trip.com’s international footprint has broadened through its subsidiary Skyscanner, a UK platform, and a partnership with TripAdvisor of the US. The company’s leadership has experience successfully guiding the business through highly competitive conditions. Increasing travel demand in a post-COVID-19 world opens the door to accelerated growth.
Please read the separate disclosures page for important information, including the risks of investing in the Portfolio.
| 19 |
Table of Contents
Frontier Emerging Markets Portfolio
Institutional Investors: HLFMX and HLFFX | Individual Investors: HLMOX
Portfolio Management Team

Pradipta Chakrabortty
Co-Lead Portfolio Manager
Babatunde Ojo, CFA
Co-Lead Portfolio Manager
Sergey Dubin, CFA
Portfolio Manager
Performance Summary
For the Frontier Emerging Markets Equity Portfolio, the Institutional Class I fell 23.56% (net of fees and expenses) in the twelve-month period ended October 31, 2022. The Portfolio’s benchmark, the MSCI Frontier Emerging Markets Index, fell 25.81% (net of source taxes).
Market Review
Frontier Emerging Markets (FEMs) fell over the past year, with negative performances across most sectors and regions. Rising inflation resulted in tightening monetary policies in both FEMs and the developed world; the increasingly aggressive stance of the US Federal Reserve in hiking interest rates to curb inflation resulted in depreciating local currency returns, which negatively impacted FEM returns in the final few months of the period.
Overall, European stocks suffered the most from the war due to concerns around the Ukraine-Russia conflict possibly spreading to neighboring states and key market Kazakhstan’s domestic troubles early in 2022. The Kazakh market plunged in January, when protests over the removal of a fuel price cap turned violent. Soon after President Kassym-Jomart Tokayev made concessions to the protesters, Kazakhstan was inundated in market turmoil again, this time from the impact of the war. Russia is a key transit country for most of Kazakhstan’s foreign trade, and Kazakh supply chains faced difficulty as many western countries stopped trade with Russia to follow sanctions.
| Fund Facts at October 31, 2022 | ||||||
| Total Net Assets |
$171.7M |
|||||
| Sales Charge |
None |
|||||
| Number of Holdings |
56 |
|||||
| Turnover (5 Yr. Avg.) |
24% |
|||||
| Dividend Policy |
Annual |
|||||
| Institutional Investors | Individual Investors | |||||
| Inst. Class I | Inst. Class II | Investor Class | ||||
| Ticker |
HLFMX |
HLFFX | HLMOX | |||
| CUSIP |
412295867 |
412295735 | 412295859 | |||
| Inception Date |
5/27/2008 |
3/1/2017 | 12/31/2010 | |||
| Minimum Investment |
$100,0001 |
$10,000,000 | $5,0001 | |||
| Net Expense Ratio2 |
1.62%3 |
1.35%4 | 2.00%5 | |||
| Gross Expense Ratio2 |
1.62% |
1.53% | 2.12% | |||
1Lower minimums available through certain brokerage firms; 2The Gross and Net Expense Ratios are as of the most recent Prospectus and have been restated to reflect current fees; 3Harding Loevner’s contractual agreement caps the Net Expense Ratio at 1.75% through February 28, 2023. The expense ratio (without cap) is applicable to investors; 4The Net Expense Ratio is shown net of Harding Loevner’s contractual agreement through February 28, 2023. Harding Loevner’s contractual agreement caps the net expense ratio at 1.35%. The Net Expense Ratio is applicable to investors; 5The Net Expense Ratio is shown net of Harding Loevner’s contractual agreement through February 28, 2023. Harding Loevner’s contractual agreement caps the net expense ratio at 2.00%. The Net Expense Ratio is applicable to investors.
Asia was led lower by Vietnam, where strong domestic manufacturing activity was overshadowed by COVID lockdowns in China; Chinese factories are a significant supplier of many Vietnamese companies. The Vietnamese government’s crackdowns on illicit bond issuances and its tightening of real estate credit dragged down shares of Vietnamese bank and property stocks. However, the Vietnamese dong depreciated considerably less against the US dollar than many other currencies, such as the Thai baht, the British pound, the yen, and the renminbi.
Africa was dragged down by Egypt and Kenya. In both countries, inflation spiked, and rising oil and food prices put pressure on trade balances and currency. In the latter, disputed presidential election results between now-President William Ruto and opponent Raila Odinga led to political strife in August 2022; tensions were eased in September after the Kenyan Supreme Court upheld Ruto’s victory and Odinga conceded.
The Gulf States were some of the only markets that ended the period in positive territory. The Gulf was helped first by rising prices of oil and other commodities in 2022, which boosted the exporting region’s economy. The Gulf also suffered less than other
| 20 |
Table of Contents
Performance (% Total Return)
| For periods ended September 30, 2022 | For periods ended October 31, 2022 | |||||||||||||||||||||||||||||||||||||||||||||||||||||||
| 1 | 3 | 5 | 10 | Since Inception* | 1 | 3 | 5 | 10 | Since Inception* | |||||||||||||||||||||||||||||||||||||||||||||||
| Year | Years | Years | Years | May-08 | Mar-17 | Dec-10 | Year | Years | Years | Years | May-08 | Mar-17 | Dec-10 | |||||||||||||||||||||||||||||||||||||||||||
| Frontier EM Portfolio – Inst. Class I | -22.02 | -3.28 | -3.49 | 0.80 | -1.78 | -23.56 | -3.04 | -2.88 | 0.85 | -1.59 | ||||||||||||||||||||||||||||||||||||||||||||||
| Frontier EM Portfolio – Inst. Class II | -21.82 | -3.04 | -3.24 | – | -0.44 | -23.44 | -2.80 | -2.62 | – | 0.03 | ||||||||||||||||||||||||||||||||||||||||||||||
| Frontier EM Portfolio – Investor Class | -22.30 | -3.67 | -3.84 | 0.41 | -0.66 | -23.84 | -3.39 | -3.21 | 0.48 | -0.43 | ||||||||||||||||||||||||||||||||||||||||||||||
| MSCI Frontier Emerging Markets Index | -23.58 | -6.70 | -4.88 | -0.47 | – | -2.04 | -0.91 | -25.81 | -6.83 | -4.49 | -0.37 | – | -1.63 | -0.72 | ||||||||||||||||||||||||||||||||||||||||||
Returns are annualized for periods greater than 1 year. *Inception of the Institutional Class I, May 27, 2008. Inception of the Institutional Class II, March 1, 2017. Inception of the Investor Class, December 31, 2010. Index performance prior to December 2, 2008 cannot be shown since it relies on back-filled data.
Performance data quoted represents past performance; past performance does not guarantee future results. The investment return and principal value of an investment will fluctuate so that an investor’s shares, when redeemed, may be worth more or less than their original cost. Current performance of the Portfolio may be lower or higher than the performance quoted. Performance data current to the most recent month end may be obtained by calling (877) 435-8105 or visiting hardingloevnerfunds.com.
FEMs from the strong US dollar, as many Gulf states’ currencies are pegged to the USD, helping make the region a haven for investors withdrawing from other regions.
Every sector declined in the period, with Information Technology being particularly hard-hit due to the exodus in early 2022 from faster-growing companies, whose valuations took a hit as investors used higher rates to discount their cash flows, which tend to be further out into the future. Financials and Consumer Discretionary stocks generally did not slide as much as other sectors.
Performance Attribution
The Portfolio outperformed the MSCI Frontier Emerging Markets index in the period. By sector, strong Real Estate and Consumer Staples stocks contributed to performance. In the UAE, property developer Emaar Properties reported the highest property sales in the company’s history, while payment processor Network International recovered from pandemic-related demand setbacks, growing both merchant acquisitions and transaction processing. A strong financial position allowed Network International to pay down debt and launch a stock buyback program. The Portfolio’s overweight in the strongly performing Consumer Discretionary sector also helped. Weak Financials and Materials stocks detracted; Kazakhstan’s Halyk Savings Bank was hurt by the effects of the Russia-Ukraine war, while Egypt’s Commercial International Bank fell after the country’s central bank devalued the Egyptian pound to cope with inflation.
By region, strong stocks in Vietnam and the Philippines made up more than half of the Portfolio’s outperformance. Shipping company Saigon Cargo Service Corp (SCS). reported that strong demand for shipping services amid the global supply disruptions contributed to a 40% surge in its international cargo volumes during the first fiscal quarter of 2022. In the Philippines, fast casual restaurant chain Jollibee Foods saw a sharp rise in sales as the easing of COVID restrictions led to a wave of Filipinos once again eating at restaurants. Our underweight to Latin America, a relatively better performing region, hurt.
Total Return Based on a $100,000 Investment Institutional Class I
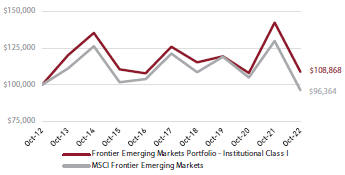
Total Return Based on a $10,000,000 Investment Institutional Class II
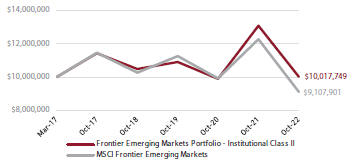
Total Return Based on a $5,000 Investment Investor Class
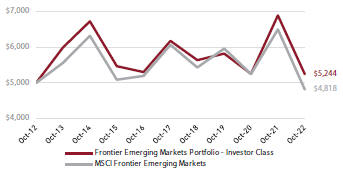
The charts above illustrate the hypothetical return of an investment made in the corresponding share classes. Investment return reflects voluntary fee waivers in effect. Absent such waivers, total return would be reduced. The performance provided in the table and charts above do not reflect the deduction of taxes that a shareholder would pay on Portfolio distributions or the redemption of Portfolio shares.
| 21 |
Table of Contents
Perspective and Outlook
On-the-ground observations can be especially useful in FEMs, where some countries are changing so fast that a newly widened highway from the airport or the connection speed on your phone can be telling clues that help to inform investment decisions. This past quarter, just weeks after the country opened its borders to tourists, co-lead portfolio manager Babatunde Ojo and analyst Samuel Hosseini visited Vietnam for our first trip back to the country since March 2019. Most of the more than 20 companies they met with said we were the first US investors to visit since the pandemic.
Most of the managers they met with, from longtime contacts at a steelmaker to those of an electronics chain we have just started researching, reported that sales have already rebounded to close to pre-pandemic levels. Ojo and Hosseini also met with local IMF officials a few weeks before the organization revised its 2022 economic growth projection for Vietnam from 6% to 7%—the only Asian economy to experience an upward revision this year. While neighbor China’s distress has had a negative current impact on Vietnam’s trade, it has accelerated foreign direct investment (FDI) as manufacturers reliant on Chinese facilities diversify their operations by adding or expanding facilities in Vietnam. Such investment helped to backstop the dong, whose resilience, in turn, has helped keep a lid on inflation, currently running below the central bank’s target of 4%.
SCS is one holding that benefits directly from the flow of FDI and prospective long-term growth in trade. SCS is one of the two industrial cargo handlers at Saigon Tan Son Nhat airport, the country’s busiest. The airport has hit its capacity limit, meaning that any expansion by either cargo handler will need to come from new construction—and SCS owns all the contiguous property suitable for development. Management’s plans for the property see it expanding its capacity from 200,000 metric tons to 350,000, while its rival remains stuck in place. With airlines’ international cargo revenues and profits at record highs and the cargo hub maxed out, SCS has found itself in an unusually strong bargaining position. It has been signing new customers to contracts at prices 80% higher than existing ones—not to cover cost increases, but simply because it can.
Another stop was at Vietcombank (VCB). The bank, also known as the Bank for Foreign Trade of Vietnam, was originally created as a state-owned institution to serve Vietnam’s cross-border business needs and remains the country’s designated foreign exchange clearing center. Every dollar of FDI must at some point flow through VCB. Aside from the steady source of revenue this generates for its currency desk, a portion of those investments also end up as deposits in VCB accounts. The bank’s favored position has contributed to a dominant market share in trade financing and many other types of commercial loan activity. VCB’s experienced management team has hewed to prudent risk management over many years. At this point, non-performing loans represent just 0.6% of its portfolio, the lowest ratio in the country, even as it maintains a credit loss provision buffer of
more than five times that amount. With its large branch and ATM network and digital platforms providing access to cheap deposits and the lowest funding costs in the market, VCB is as leveraged to Vietnam’s long-term economic trajectory as any company in the country.
We are often asked whether Vietnam could ever replace China in global manufacturing. Our answer is “no.” Vietnam’s labor force is too small relative to China’s to replace it. However, Vietnam does not need to replace China. It can follow its own path of economic development, positioning itself favorably as a business-friendly market for investors and seek to avoid the dreaded “middle income trap.” In February 2021, Vietnam’s leaders set out an agenda to make Vietnam a high-income developed country with a GDP per capita of $18,000 (versus US$3,500 today) by 2045. It is a hugely ambitious goal that will require Vietnam to grow its GDP by an average of 7% a year—half a percentage point higher than the fast pace it has managed over the past decade—for the next 25 years. To sustain that pace Vietnam will need to move up the manufacturing value chain, trading its existing growth model based on cheap labor to one based on high productivity and advanced manufacturing capabilities and technology, all of which can only be accomplished through significant additional investments in infrastructure and education. In recent years, Vietnam has
| Portfolio Positioning (% Weight) at October 31, 2022 | ||||
| Sector | Portfolio | Benchmark1 | ||
| Comm Services |
5.4 |
8.6 | ||
| Cons Discretionary |
7.6 |
1.4 | ||
| Cons Staples |
13.5 |
8.1 | ||
| Energy |
1.1 |
5.1 | ||
| Financials |
38.1 |
37.0 | ||
| Health Care |
5.9 |
3.2 | ||
| Industrials |
5.6 |
12.7 | ||
| Info Technology |
9.0 |
– | ||
| Materials |
2.2 |
8.1 | ||
| Real Estate |
7.7 |
12.1 | ||
| Utilities |
0.0 |
3.7 | ||
| Cash |
3.9 |
– | ||
| Geography | Portfolio | Benchmark1 | ||
| Africa |
15.1 |
15.3 | ||
| Asia |
38.7 |
48.8 | ||
| Europe |
13.4 |
15.2 | ||
| Gulf States |
9.3 |
2.5 | ||
| Latin America |
7.5 |
17.5 | ||
| Middle East |
0.0 |
0.7 | ||
| Developed Markets Listed2 |
12.1 |
– | ||
| Cash |
3.9 |
– | ||
1MSCI Frontier Emerging Markets Index; 2Includes frontier or small emerging markets companies listed in developed markets.
| 22 |
Table of Contents
beaten the UK and US in Organization for Economic Cooperation and Development (OECD) rankings of the quality of its math and science education. Infrastructure spending has been running at 6% of GDP, more than twice the average for other Southeast Asian countries, and it plans to expand the national highway system from 1,290 kilometers to 5,000 by 2030 and the number of airports from 22 to 30. Other major investments are underway in electrical infrastructure, especially renewable energy, to keep pace with manufacturing growth.
On the day before Ojo and Hosseini departed, they were at their hotel room catching up on meeting notes when Reuters reported that Foxconn, the Taiwan-headquartered company that is world’s largest manufacturer of Apple products, would be investing US$300 million to expand its production facilities in northern Vietnam. The new facility, which will take Foxconn’s total investment in the country to US$1.5 billion, is just an hour’s drive from Hanoi Airport, where SCS is in the process of acquiring the lead cargo handling franchise.
Portfolio Highlights
A characteristic of our Frontier Emerging Markets Portfolio is that, while adhering to our quality and growth standards (which often come only at a premium price), it is diversified by valuation. The Portfolio happens to have a similar-sized overweight to the most and least expensive quintiles of the market. Diversification by value factor has helped the Portfolio track steady in different growth and value factor-led market regimes in the past. It reflects our conscious efforts to offset our exposure to more expensive shares in industries like IT services and consumer retailing by taking advantage of periods of market dislocation to buy high-quality growth companies across industries at attractive valuations. Pandemic lockdowns have provided us ample opportunity to snap up bargains. In no sector were the bargains as plentiful as in Financials.
As fear gripped markets over the impact of the shutdowns on entire industries, bank stocks came under selling pressure on concerns about the ripple effects of bankruptcies and defaults on bank earnings and balance sheets. The significant interest rate cuts by central banks to stimulate their economies also led to contraction in net interest margins, squeezing banks’ revenues. When the sell-off ensued, we purchased some of the banks at a discount to their book value, a level that priced in a credit scenario we believed was too pessimistic for their level of management quality and conservative underwriting. As it becomes clearer that these banks are not going to collapse and their asset quality improves as their economies re-open and interest rates rise, we believe there is an opportunity for rewards.
Toward the end of the period, we followed our valuation discipline in adding to a handful of existing holdings whose share prices have yet to fairly reflect what we see as a strong recovery happening in the underlying business. One of these is Sabeco (Saigon Beer Alcoholic Beverage Corp.), the leading beer
Ten Largest Holdings by Weight at October 31, 2022
| Company | Sector | Market | % | |||||
| Kaspi Bank |
Financials |
Kazakhstan | 4.4 | |||||
| Emaar Properties |
Real Estate |
United Arab Emirates | 4.3 | |||||
| Credicorp |
Financials |
Peru | 4.1 | |||||
| Vietcombank |
Financials |
Vietnam | 3.9 | |||||
| Globant |
Info Technology |
US | 3.4 | |||||
| SM Prime Holdings |
Real Estate |
Philippines | 3.3 | |||||
| Wilcon Depot |
Cons Discretionary |
Philippines | 3.3 | |||||
| Commercial International Bank |
Financials |
Egypt | 3.3 | |||||
| Vietnam Dairy Products |
Cons Staples |
Vietnam | 3.1 | |||||
| Banca Transilvania |
Financials |
Romania | 3.0 | |||||
company in Vietnam. Throughout the pandemic, the company displayed a remarkable ability to gain market share, as it enhanced its e-commerce channel and used its nationwide footprint to work around lockdown disruptions by moving products into rural areas. It has relaunched one product (Saigon Chill, whose debut in October 2020 was marred by last year’s shutdowns) and repositioned another (Saigon Special) to both target the higher-margin mass-premium segment that is seeing demand recover now that the clubs are filling again with locals and tourists. Most impressively, the company has demonstrated strong pricing power by raising prices without sacrificing market share. Granted, they are measured against a low base, but 2Q year-over-year revenues and profits grew 25% and 67%, respectively. These results bode well for its longer-term prospects in a country where disposable incomes should be growing at a healthy clip through the middle of this century.
We established a new position in Airtel Africa. The company is a leading telecom operator in Sub-Saharan Africa offering a broad range of services including consumer and enterprise-level voice, data, and cloud services to 128 million subscribers across 14 countries. It also offers mobile wallets that support everything from money transfers and merchant payments to loans and savings. Sub-Saharan Africa is among the fastest growing mobile markets in the world, driven by its low penetration of mobile and banking services and high population growth. Airtel Africa has a strong balance sheet, what we feel is best-in-class management, and has consistently generated cash flow return on investment ahead of its global telecom peers. The company’s stock is listed on both the Nigerian and London stock exchanges. We own the USD-denominated global depositary receipts (GDR) in London, whose fungibility with the locally listed shares gives us some flexibility in managing Nigerian currency exposure amid ongoing US dollar scarcity in Nigeria.
Please read the separate disclosures page for important information, including the risks of investing in the Portfolio.
| 23 |
Table of Contents
Global Equity Research Portfolio
Institutional Investors: HLRGX
Portfolio Management Team

Edmund Bellord
Portfolio Manager
Moon Surana, CFA
Portfolio Manager
Performance Summary
For the Global Equity Research Portfolio, the Institutional Class fell 25.96% (net of fees and expenses) in the twelve-month period ended October 31, 2022. The Portfolio’s benchmark, the MSCI All Country World Index, fell 19.96% (net of source taxes).
Market Review
Global stock markets are down significantly for the trailing twelve months, a period marked by persistent inflation and ongoing economic consequences of the Russia-Ukraine conflict. Every region and nearly every sector finished in the red.
Early in the period, amid worldwide supply chain issues, the emergence of the COVID-19 Omicron variant dealt a hiccup to investor confidence; markets were still processing the economic impact of the outbreak and governments’ responses to it when Russia invaded Ukraine in late February. The US and other Western governments imposed crippling economic sanctions on Russia; prices of commodities for which Russia is a key exporter rose sharply, furthering inflation and prompting central banks to tighten monetary policy.
Amidst rising prices, the US Federal Reserve, following pledges to increase rates until inflation is under control, boosted its benchmark interest rate three times between April and October. Other central banks, including the Bank of England, the European Central Bank, and the Central Bank of Australia, raised their rates as well. A notable exception was the Bank of Japan, which remained committed to its ultra-accommodative monetary policy in the period. In June, the World Bank
| Fund Facts at October 31, 2022 | ||
| Total Net Assets |
$7.2M | |
| Sales Charge |
None | |
| Number of Holdings |
310 | |
| Turnover (5 Yr. Avg.) |
41% | |
| Dividend Policy |
Annual | |
| Institutional Investors | ||
| Ticker |
HLRGX | |
| CUSIP |
412295792 | |
| Inception Date |
12/19/2016 | |
| Minimum Investment1 |
$100,000 | |
| Net Expense Ratio2 |
0.80%3 | |
| Gross Expense Ratio2 |
1.73% | |
1Lower minimums available through certain brokerage firms; 2The Gross and Net Expense Ratios are as of the most recent Prospectus and have been restated to reflect current fees; 3The Net Expense Ratio is shown net of Harding Loevner’s contractual agreement through February 28, 2023. Harding Loevner’s contractual agreement caps the net expense ratio at 0.80%. The Net Expense Ratio is applicable to investors.
forecasted economic growth slowing to 2.9% for 2022, a drop from the 4.1% growth it forecasted at the start of the calendar year. In July, markets took a brief reprise from declining, with improving US core inflation measures raising the possibility of an earlier-than-expected end to the Federal Reserve’s monetary tightening. But the brightening of sentiment proved fleeting. While headline inflation continued to moderate due to oil and gas prices coming down off their previous highs, underlying measures indicated that price increases could become entrenched, and rising expectations of future inflation introduced the specter of a wage-price spiral; global stock markets resumed their retreat by late August.
On a sector basis, Energy was the only sector to rise; commodity prices soared in 2022 due to supply shocks from war and sanctions. Communication Services and Consumer Discretionary performed the worst. Communication Services companies—largely comprised of highly priced growth stocks—were impacted by central bank efforts to tame inflation and faced slowing advertising spending while Consumer Discretionary companies, generally more sensitive to business and consumer confidence, were impacted by persistent inflation.
All regions fell, though Emerging Markets (EMs), anchored by China, and eurozone markets suffered the most. The eurozone continued to grapple with the impacts of sanctions against Russia, while China fell sharply in the final months of the period due to dimming economic prospects stemming from its severe property slowdown and strict COVID-19 lockdowns. Non-eurozone European countries fell the least despite the
| 24 |
Table of Contents
Performance (% Total Return)
| For periods ended September 30, 2022 | For periods ended October 31, 2022 | |||||||||||||||||||||||||||||||
| 1 Year | 3 Years | 5 Years | Since Inception* | 1 Year | 3 Years | 5 Years | Since Inception* | |||||||||||||||||||||||||
| Global Equity Research Portfolio – Inst. Class |
-26.26 | 1.24 | 4.02 | 6.68 | -25.96 | 1.92 | 4.46 | 7.41 | ||||||||||||||||||||||||
| MSCI All Country World Index |
-20.66 | 3.75 | 4.44 | 6.70 | -19.96 | 4.85 | 5.24 | 7.67 | ||||||||||||||||||||||||
Returns are annualized for periods greater than 1 year. *Inception date: December 19, 2016.
Performance data quoted represents past performance; past performance does not guarantee future results. The investment return and principal value of an investment will fluctuate so that an investor’s shares, when redeemed, may be worth more or less than their original cost. Current performance of the Portfolio may be lower or higher than the performance quoted. Performance data current to the most recent month end may be obtained by calling (877) 435-8105 or visiting hardingloevnerfunds.com.
UK’s economic calamities, which involved its bonds tumbling and the pound falling to a record low against the US dollar after then-PM Liz Truss’s announcement of aggressive tax cuts and greater borrowing. The Bank of England, caught unaware, hastily announced it would buy bonds “on whatever scale necessary” to stabilize markets, effectively abandoning its earlier commitment to begin reducing the size of its balance sheet.
Performance Attribution
By sector, weak Health Care and Industrials stocks detracted from relative performance the most. In Health Care, Chinese biologics services provider WuXi Biologics was placed on a US “Unverified List” of export destinations in December 2021 due to COVID-19 lockdowns preventing officials from inspecting its facilities; WuXi saw more share price pressure the following year from investor concerns over a September 2022 executive order by the Biden administration intended to accelerate development of the domestic biotech industry, which could impede the company’s access to the US market. In Industrials, Japanese electric power tools maker Makita faced higher material and shipping costs as well as currency headwinds.
Regionally, weak stocks in Japan and Europe outside the eurozone (United Kingdom) hurt returns the most. In Japan, furniture company NITORI dealt with inflation and rising logistics costs, as well as a weakening yen. In the UK, shares of Grafton, the parent of the Woodie’s chain of retail home improvement stores and construction materials distributors, fell despite underlying resilience as the outlook for the European economy deteriorated. Weak US stocks and the Portfolio’s overweight to EMs also hurt. Strong Canadian stocks helped.
Perspective and Outlook
Within a few months in the summer and fall of 2022, markets lurched from a consensus that the fight against inflation will soon be won toward a despairing view that slaying inflation would require sustained punishment by high interest rates. As practiced observers of both markets and policymakers, we have not put much belief in either narrative or tried to predict which outcome will ultimately drive the markets.
Total Return Based on a $100,000 Investment Institutional Class
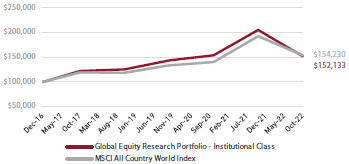
The chart above illustrates the hypothetical return of an investment made in the corresponding share class. Investment return reflects voluntary fee waivers in effect. Absent such waivers, total return would be reduced. The performance provided in the table and chart above do not reflect the deduction of taxes that a shareholder would pay on Portfolio distributions or the redemption of Portfolio shares.
Instead, we have intensified our efforts to reconfirm the long-term business prospects of the companies we own and those qualified by our analysts for investment. We aim to build a portfolio of companies that is resilient to changes in the economic environment, knowing full well that we can’t predict which environment they will face tomorrow. We are continuously questioning whether they have as defensible a competitive position, as resilient a business model, and as robust a balance sheet as we had previously thought. We seek to uncover unseen vulnerabilities to worsening or new threats. Such threats could be economic in nature, such as a reversion to persistent inflation following two generations of disinflation. They could be financial, such as a shift from negative to positive real interest rates. Or they could be geopolitical, including risks of widening military conflicts with potentially cataclysmic effects on the global economy.
This last one is no longer simply academic. The global economy has already been dramatically affected by the Ukrainian conflict, including by the still-unfolding energy crisis in Europe. Nancy Pelosi’s August visit to Taiwan, coming as it did in the wake of the West’s strikingly unified response to Russia’s invasion of Ukraine, and China’s military exercises launched in response offered stark reminders of the risk that Taiwan could be the fuse to ignite an armed conflict pitting the US and its allies against a confident China. The concept
| 25 |
Table of Contents
of “de-globalization” comes into sharper focus when we imagine entire markets being lost to some of the world’s most successful companies, the severing of supply chains, or the destruction of financial or physical assets.
We have viewed that risk as both low and distant in time, and still view it as low. Several factors (such as China’s unsettled domestic economic situation and the unified Western response to and military debacle encountered by Russia in Ukraine) substantially reduce the likelihood of imminent invasion. Nevertheless, there is good reason we don’t presume to be experts in US-Sino relations. And even a low probability risk must be considered when the event can have catastrophic consequences if preparations aren’t made.
Beyond geopolitical risks, the threat from inflation remains at the fore. Few securities analysts working today are experienced in examining companies’ resilience to persistent inflation, since for the last 40 years the trend in developed economies has been toward disinflation. We have a leg up since many of our analysts have covered companies in developing countries where inflation has been a persistent concern. Moreover, for at least the past 15 years our valuation models have explicitly incorporated inflation assumptions for every company we cover.
A further complication of analysis under inflationary conditions is that the growth of intangible assets has made it hard to parse the effects of today’s inflation on sustainability of profits. In prior inflationary periods, what distinguished winners from losers was pricing power—that is, whether a company could pass higher input costs through to its customers without affecting its unit sales. Today, the value of intellectual property (IP), such as embedded research and development costs, plays a far larger role in fostering the profits of the most rapidly growing companies, and this secondary effect is more difficult to quantify, since there is too little visibility into the accounting inputs to those intangible costs. Also, compared with the ability to renew physical plant and equipment, the ability to renew IP is more vulnerable to the high employment mobility of younger, more educated digital workers. These contemporary twists mean that pricing power may no longer be the paramount measure of a company’s inflation resilience; instead, its bargaining power over its IP suppliers (including its employees) has in some cases become more critical.
If 40 years have passed since analysts needed to worry about inflation, it’s only been a decade since analysts and portfolio managers last operated in an environment where they needed to take account of positive real interest rates. Although short-term rates are still far below headline inflation in most countries, in the developed world real yields on long sovereign bonds have tipped into positive territory. After a period during which there were almost no limits to the demand for borrowing for just about any purpose, however productive or not, positive real long-term interest rates should at least lead to a more efficient allocation of capital.
The journey to sustained higher interest rates, if indeed that is where we are headed, is bound to be bumpy. The most concerning vulnerability exposed (so far) has been the weaknesses hidden in some underfunded UK corporate pension plans that had built up opaque and contorted derivative and collateral structures predicated on well-behaved long-term interest rates. Their struggles to meet ensuant margin calls were the catalyst for the intervention by the Bank of England in its domestic bond market. Might similar vulnerabilities exist elsewhere waiting to be exposed? As always, our preference for transparency and insistence on financial strength at our companies is designed to keep our portfolios relatively sheltered from this kind of distress.
Portfolio Highlights
The Global Equity Research Portfolio’s holdings follow analysts’ recommendations from Harding Loevner’s collection of researched companies. We ended the period with 310 holdings. By sector, the Portfolio’s exposure in Energy declined the most due to analyst recommendations, and its exposure in Financials increased the most due to analyst recommendations and
Portfolio Positioning (% Weight) at October 31, 2022
| Sector | Portfolio | Benchmark1 | ||||||
| Comm Services |
6.2 | 6.9 | ||||||
| Cons Discretionary |
11.7 | 10.8 | ||||||
| Cons Staples |
6.1 | 7.6 | ||||||
| Energy |
0.7 | 5.8 | ||||||
| Financials |
15.8 | 14.8 | ||||||
| Health Care |
18.5 | 13.3 | ||||||
| Industrials |
14.1 | 9.8 | ||||||
| Info Technology |
19.0 | 20.9 | ||||||
| Materials |
5.0 | 4.6 | ||||||
| Real Estate |
0.6 | 2.5 | ||||||
| Utilities |
0.9 | 3.0 | ||||||
| Cash |
1.4 | – | ||||||
| Geography | Portfolio | Benchmark1 | ||||||
| Canada |
1.8 | 3.2 | ||||||
| Emerging Markets |
19.9 | 10.2 | ||||||
| Europe EMU |
14.6 | 7.5 | ||||||
| Europe ex-EMU |
9.7 | 7.8 | ||||||
| Frontier Markets2 |
1.0 | – | ||||||
| Japan |
7.5 | 5.2 | ||||||
| Middle East |
0.5 | 0.2 | ||||||
| Pacific ex-Japan |
3.4 | 2.9 | ||||||
| United States |
40.2 | 63.0 | ||||||
| Cash |
1.4 | – | ||||||
1MSCI All Country World Index; 2Includes countries with less-developed markets outside the Index.
| 26 |
Table of Contents
market movements. We also increased our exposure in Health Care due largely to market movements and Communication Services due to analyst recommendations. By region, analyst recommendations led to purchases for the Portfolio being the largest in Emerging Markets and Japan. Our exposure in the eurozone increased the most, due to analyst recommendations.
In Energy, we sold several of our holdings. We sold Brazilian vehicle fuel and liquid petroleum gas distributer Ultrapar following an analyst downgrade. Increased competition has eroded the company’s advantages in pricing and distribution. Further, recent attempts by Ultrapar’s management to grow revenue—through mergers and acquisitions (M&A) as well as a plan to add drug stores to gas stations—have been largely unsuccessful. We also sold Colombian oil and gas company Ecopetrol following an analyst downgrade on fears that potential Colombian tax reforms in the wake of the election of left-wing president Gustavo Petro could negatively impact the company. Australian petroleum exploration and production company Woodside Petroleum—whose shares we received after it was spun off from BHP Group—was also sold.
In Communication Services, we purchased US-based video streaming platform Netflix. Management of the company is global-minded and data-focused and has consistently demonstrated an ability to deliver content that resonates with a wide variety of audiences worldwide. Streaming penetration rates remain low outside the US and are set to increase meaningfully over time. We believe Netflix is well-positioned to benefit from this growth long-term due to its financial self-sufficiency, vast content library, and focus on international audiences. In Financials, we rated Canadian insurance company Manulife. The company offers a full suite of life insurance products as well as retirement and wealth management services. While the wealth management and retirement products appeal to the aging populations of the Western world, long-term life insurance products address the needs of the growing number of middle-class families in places like China and southeast Asia.
In Europe outside the eurozone, several sales reduced our exposure. We sold UK-based provider of subscription-based home repair memberships HomeServe and UK-listed Coca-Cola bottler Coca-Cola HBC after analyst downgrades. Additionally, we sold UK-based assurance, inspection, product testing, and certification company Intertek Group after it was unrated following an analyst’s departure.
In the eurozone, we purchased several German companies, including architecture, engineering, and construction (AEC) software developer Nemetschek, whose products are utilized throughout the lifecycle of a building: from the initial design and visualization stages, through the physical construction, to the management of the completed asset. As a leader in the AEC software industry, Nemetschek benefits from economies of scale with its software development spend and can more efficiently
Ten Largest Holdings by Weight at October 31, 2022
| Company | Sector | Market | % | |||||
| AbbVie |
Health Care | US | 1.3 | |||||
| Netflix |
Comm Services | US | 1.2 | |||||
| Bristol-Myers Squibb |
Health Care | US | 1.2 | |||||
| Broadcom |
Info Technology | US | 1.0 | |||||
| Vertex Pharmaceuticals |
Health Care | US | 1.0 | |||||
| Danaher |
Health Care | US | 1.0 | |||||
| Gartner |
Info Technology | US | 1.0 | |||||
| Merck |
Health Care | US | 1.0 | |||||
| JPMorgan Chase |
Financials | US | 1.0 | |||||
| John Deere |
Industrials | US | 1.0 | |||||
distribute its product, accessing the thousands of architects, contractors, engineers, and asset operators. The company is also benefitting from the increasing penetration of digital tools in the AEC industry.
Please read the separate disclosures page for important information, including the risks of investing in the Portfolio.
| 27 |
Table of Contents
International Equity Research Portfolio
Institutional Investors: HLIRX
Portfolio Management Team

Edmund Bellord
Portfolio Manager
Moon Surana, CFA
Portfolio Manager
Performance Summary
For the International Equity Research Portfolio, the Institutional Class declined 29.83% in the twelve-month period ended October 31, 2022. The Portfolio’s benchmark, the MSCI All Country World ex-US Index, declined 24.73% (net of source taxes).
Market Review
International equity markets fell sharply in the period amid aggressive central bank rate hikes intended to cool inflation, commodity supply shocks emanating from the war in Ukraine, and overall weakness in China.
The period began with consumer prices in the US climbing at the fastest pace since 1982, leading the US Federal Reserve (Fed) to signal several interest rate increases and an imminent end to its bond-buying program. So far, the Fed has hiked interest rates six times, taking rates from between 0% and 0.25% at the start of the period to between 3.75% and 4% by November 2. Other central bankers across developed and emerging markets continued to raise their own borrowing rates, with Bank of Japan the notable exception as it remained committed to an ultra-accommodative monetary policy.
Russia’s invasion of Ukraine in the closing days of February prompted a swift and emphatic response by Western governments, which nevertheless sought to strike a balance between punishing Russian aggression and avoiding an escalating military conflict. The US and its allies enacted crippling economic sanctions, including freezing a significant
| Fund Facts at October 31, 2022 | ||
| Total Net Assets |
$10.3M | |
| Sales Charge |
None | |
| Number of Holdings |
220 | |
| Turnover (5 Yr. Avg.) |
42% | |
| Dividend Policy |
Annual | |
| Institutional Investors | ||
| Ticker |
HLIRX | |
| CUSIP |
412295826 | |
| Inception Date |
12/17/2015 | |
| Minimum Investment1 |
$100,000 | |
| Net Expense Ratio2 |
0.75%3 | |
| Gross Expense Ratio2 |
1.43% | |
1Lower minimums available through certain brokerage firms; 2The Gross and Net Expense Ratios are as of the most recent Prospectus and have been restated to reflect current fees; 3The Net Expense Ratio is shown net of Harding Loevner’s contractual agreement through February 28, 2023. Harding Loevner’s contractual agreement caps the net expense ratio at 0.75%. The Net Expense Ratio is applicable to investors.
share of Russian central bank reserve assets, cutting off many of the country’s banks from SWIFT (Society for Worldwide Interbank Financial Telecommunications), and outlawing the export of a variety of industrial and luxury goods to Russia. The revulsion over Russia’s actions also provoked an exodus of Western companies from Russian markets. With foreign investors effectively unable to trade, major market index providers expunged all Russian securities from their indices.
The war’s contribution to inflation was twofold. In September, Russia retaliated against European sanctions by cutting off the flow of natural gas to the continent, sending energy prices soaring as countries scrambled to find other sources. In emerging markets (EMs), the pressures were largely felt in ballooning food prices. Prior to the war, Ukraine was one of the world’s largest suppliers of grains and vegetable oils, and EM countries have been hard-pressed to find alternatives.
China grappled with its own set of challenges. The government’s sweeping lockdown measures in response to waves of COVID-19 cases in major Chinese cities hurt businesses in various industries and caused investors to lose their appetite for Chinese stocks. In the Real Estate sector, regulators’ efforts to prick the country’s residential real estate bubble caused severe strain, as even less-leveraged developers faced resistance to rolling over their debt or issuing new bonds. In Health Care, shares of Chinese biological pharmaceutical companies came under pressure after US President Joe Biden issued an executive order advancing a “secure American bioeconomy,” fueling fears that these businesses may get shut out from the lucrative US market.
| 28 |
Table of Contents
Performance (% Total Return)
| For periods ended September 30, 2022 | For periods ended October 31, 2022 | |||||||||||||||||||||||||||||||
| 1 Year | 3 Years | 5 Years | Since Inception* | 1 Year | 3 Years | 5 Years | Since Inception* | |||||||||||||||||||||||||
| Intl. Equity Research Portfolio – Inst. Class |
-30.95 | -3.47 | -1.20 | 3.33 | -29.83 | -3.28 | -0.89 | 3.86 | ||||||||||||||||||||||||
| MSCI All Country World ex-US Index |
-25.17 | -1.52 | -0.81 | 3.02 | -24.73 | -1.68 | -0.60 | 3.42 | ||||||||||||||||||||||||
Returns are annualized for periods greater than 1 year. *Inception date: December 17, 2015.
Performance data quoted represents past performance; past performance does not guarantee future results. The investment return and principal value of an investment will fluctuate so that an investor’s shares, when redeemed, may be worth more or less than their original cost. Current performance of the Portfolio may be lower or higher than the performance quoted. Performance data current to the most recent month end may be obtained by calling (877) 435-8105 or visiting hardingloevnerfunds.com.
On a sector basis, only Energy was able to eke out modest gains during the period, as supply shocks from the war produced a meteoric rise in commodities prices. Consumer Discretionary and Information Technology (IT) performed the worst; the former was impacted by slumping consumer confidence in the face of surging prices, while central bank efforts to tame inflation hurt IT’s high-priced growth stocks.
All major regions declined. EMs performed the worst, largely due to Russia and China. The eurozone also performed poorly as the sharp rise in energy prices compounded the difficulties of countries already grappling with mounting inflation.
Style factors played a significant role. The most expensive stocks suffered from the regulatory mauling of many Chinese growth leaders and from a reassessment of discount rates in the face of rising inflation. Shares of the fastest-growing companies significantly underperformed their slowest-growing peers, while the highest-quality stocks failed to offer any protection, slightly underperforming their lowest-quality peers.
Performance Attribution
The Portfolio underperformed as style headwinds sustained throughout the period contributed to a negative stock-selection effect across most regions and sectors.
By sector, poor performers in Industrials and Health Cate detracted the most from relative performance. In Industrials, returns were dragged down by Japanese power tools manufacturer Makita. Shares fell as the company faced higher material and shipping costs as well as currency headwinds. In Health Care, Dechra, a UK-based manufacturer of animal pharmaceuticals, declined in the face of cost inflation and increased competition from generics. The company also completed two acquisitions that will be dilutive to earnings this year and next. However, the drug pipelines in both deals look promising for Dechra’s growth outlook, which is underpinned by rising demand in the US for pet medicines. Strong stocks in Financials, including Singapore-based bank DBS Group, helped our relative performance. DBS continued to show strong business momentum—supported by the financial strength that it has demonstrated throughout the pandemic—and has also benefited
Total Return Based on a $100,000 Investment Institutional Class
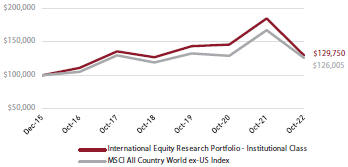
The chart above illustrates the hypothetical return of an investment made in the corresponding share class. Investment return reflects voluntary fee waivers in effect. Absent such waivers, total return would be reduced. The performance provided in the table and chart above do not reflect the deduction of taxes that a shareholder would pay on Portfolio distributions or the redemption of Portfolio shares.
from the Singapore central bank’s monetary tightening (net interest margins tend to rise alongside interest rates).
On a regional basis, weak stocks in Japan and Europe—both in the eurozone (Germany) and outside it (UK)—were the biggest detractors from relative performance. Germany-based provider of information technology services and related hardware Bechtle detracted as higher wages, as well as increases in travel and energy costs, impacted margins and offset good revenue growth. In the UK, shares of Grafton, the parent of the Woodie’s chain of retail home improvement stores and construction materials distributors, fell despite underlying resilience as the outlook for the European economy deteriorated. Strong stocks in EMs were helpful, particularly Brazilian rental car business Localiza, which reported strong quarterly results throughout 2022, including strong profit and margin growth, as supply-chain challenges eased and allowed the company to obtain new vehicles. Localiza also finalized its merger with Unidas in July.
Perspective and Outlook
Within the span of a few months in the summer and fall of 2022, markets lurched from a consensus that the fight against
| 29 |
Table of Contents
inflation would soon be won toward a despairing view that slaying inflation would require sustained punishment by high interest rates. As practiced observers of both markets and policymakers, we have not put much belief in either narrative or tried to predict which outcome will ultimately drive the markets. Instead, we intensified our efforts to reaffirm the long-term prospects of the companies we own and those qualified for purchase by our analysts. We aim to build a portfolio of companies that is resilient to many different economic environments, knowing that we can’t predict which environment they will face tomorrow.
The global economy has been dramatically affected by Russia’s invasion of Ukraine and the still-unfolding energy crisis in Europe. Looking ahead, the risk that Taiwan could be the epicenter of a conflict between the US and China is one that we must push higher up the list of risks that our portfolio must be built to withstand. We have long viewed this risk as both low and distant; it is no longer distant. Nevertheless, we don’t pretend to be experts in US-China relations or try to forecast geopolitical events. Our strict adherence to our portfolio guidelines, including the requirement of ample geographic diversification, is one way we protect against the most catastrophic consequences.
Beyond geopolitical risks, the threat of inflation remains at the fore. Analyzing businesses’ resilience to persistent inflation is an area where we think we have a small leg up because many of our analysts have covered companies in developing countries where inflation has been an enduring concern. Moreover, for the last 15 years, our fair value estimates have explicitly incorporated inflation assumptions for every company we cover.
Yet another factor we must consider is an environment of positive real rates, which is exposing vulnerabilities built up over decades of easy money. The most concerning thus far have been the weaknesses hidden in some UK pension plans, whose structures were predicated on well-behaved interest rates. Their struggle to meet margin calls was the catalyst for the “whatever scale necessary” intervention by the Bank or England in its domestic bond market in September. Though similar vulnerabilities likely exist elsewhere, our longstanding preference for transparency and insistence on financial strength at the companies we hold is designed to keep our portfolios relatively sheltered from this kind of distress.
Portfolio Highlights
The International Equity Research Portfolio’s holdings follow analysts’ recommendations from Harding Loevner’s collection of researched companies. We ended the period with 220 holdings. By sector, the Portfolio’s exposure in Energy declined the most, due to analyst recommendations, and its exposure in Financials increased the most, due to market movements. We also increased our exposure in IT, due largely to analyst recommendations. By region, our exposure in Europe outside the eurozone declined the most, due to both analyst
recommendations and market movements. Our exposure in the eurozone increased the most, due to analyst recommendations.
In Energy, we sold six companies during the period. Three were due to new ratings following analyst departures: Canadian integrated oil and gas company Imperial Oil, Netherlands-based liquid bulk storage provider Vopak, and UK-listed oil and gas company Royal Dutch Shell. We also sold Brazilian vehicle fuel and liquid petroleum gas distributer Ultrapar following an analyst downgrade. Increased competition has eroded the company’s advantages in pricing and distribution. Further, recent attempts by Ultrapar’s management to grow revenue—through M&A as well as a plan to add drug stores to gas stations—have been largely unsuccessful. We also sold Colombian oil and gas company Ecopetrol following an analyst downgrade on fears that potential Colombian tax reforms in the wake of the election of left-wing president Gustavo Petro could negatively impact the company. Australian petroleum exploration and production company Woodside—whose shares we received after it was spun off from BHP—was also sold.
In IT, we purchased LONGi, the world’s largest and most vertically integrated supplier of solar power equipment, with market-leading technology and one of the lowest costs of
| Portfolio Positioning (%) at October 31, 2022 |
|
|||||||
| Sector | Portfolio | Benchmark1 | ||||||
| Comm Services |
5.4 | 5.7 | ||||||
| Cons Discretionary |
12.0 | 10.7 | ||||||
| Cons Staples |
9.0 | 9.1 | ||||||
| Energy |
0.3 | 6.6 | ||||||
| Financials |
18.8 | 20.9 | ||||||
| Health Care |
12.7 | 10.0 | ||||||
| Industrials |
18.8 | 12.5 | ||||||
| Info Technology |
13.4 | 10.9 | ||||||
| Materials |
5.6 | 8.1 | ||||||
| Real Estate |
1.2 | 2.2 | ||||||
| Utilities |
0.9 | 3.3 | ||||||
| Cash |
1.9 | – | ||||||
| Geography | Portfolio | Benchmark1 | ||||||
| Canada |
2.1 | 8.5 | ||||||
| Emerging Markets |
30.5 | 27.5 | ||||||
| Europe EMU |
24.7 | 20.3 | ||||||
| Europe ex-EMU |
19.8 | 21.2 | ||||||
| Frontier Markets2 |
1.5 | – | ||||||
| Japan |
13.5 | 14.1 | ||||||
| Middle East |
0.6 | 0.6 | ||||||
| Pacific ex-Japan |
5.4 | 7.8 | ||||||
| Cash |
1.9 | – | ||||||
1MSCI All Country World ex-US Index; 2Includes countries with less-developed markets outside the Index.
| 30 | ||
Table of Contents
production. The company is well positioned to benefit from the accelerated adoption of solar power necessary to meet emission reduction targets over the coming decades. We also purchased StarPower, the largest Chinese maker of power modules for managing energy distribution in industrial robots, home appliances, and, increasingly, electric vehicles. It is a frontrunner in silicon carbide technology, a more energy-efficient future replacement of the insulated-gate bipolar transistors (IGBTs) which have long been the core output-switch technology used in high-voltage high-current applications. Our analyst expects the company to gain share from its developed market competitors by offering lower prices in combination with customized service provided by its China-based engineering staff.
In Europe outside the eurozone, several sales reduced our exposure. We sold UK-based provider of subscription-based home repair memberships HomeServe and UK-listed Coca-Cola bottler Coca-Cola HBC after analyst downgrades. Additionally, we sold UK-based assurance, inspection, product testing, and certification company Intertek Group after it was unrated following analyst Shali Zhu’s departure.
In the eurozone, we purchased several German companies, including our holding in Bechtle, a company that to our mind exhibits the holy trinity of quality, growth, and value. Bechtle provides information technology services and sells related hardware, ranging from virtual-meeting headsets to computing servers. The company has continued to see strong demand even as the pandemic recedes and business investment in work-from-home solutions subsides. While management expects wage inflation in 2023, the company’s prospects remain bright as it gains market share, adds to its suite of services, and expands into new geographies. We also purchased architecture, engineering, and construction (AEC) software developer Nemetschek, whose products are utilized throughout the lifecycle of a building: from the initial design and visualization stages, through the physical construction, to the management of the completed asset. As a leader in the AEC software industry, Nemetschek benefits from economies of scale with its software development spend and can more efficiently distribute its product, accessing the thousands of architects, contractors, engineers, and asset operators. The company is also benefitting from the increasing penetration of digital tools in the AEC industry.
| Ten Largest Holdings by Weight at October 31, 2022 | ||||||||
| Company | Sector | Market | % | |||||
| DBS Group |
Financials | Singapore | 1.2 | |||||
| Royal Dutch Shell |
Energy | United Kingdom | 1.1 | |||||
| BHP |
Materials | Australia | 1.1 | |||||
| ASM Pacific Technology |
Info Technology | Hong Kong | 1.0 | |||||
| Rio Tinto |
Materials | United Kingdom | 1.0 | |||||
| Alcon |
Health Care | Switzerland | 1.0 | |||||
| Chugai Pharmaceutical |
Health Care | Japan | 1.0 | |||||
| Air Liquide |
Materials | France | 1.0 | |||||
| Couche-Tard |
Cons Staples | Canada | 1.0 | |||||
| OCBC Bank |
Financials | Singapore | 1.0 | |||||
Please read the separate disclosures page for important information, including the risks of investing in the Portfolio.
| 31 |
Table of Contents
Emerging Markets Research Portfolio
Institutional Investors: HLREX
| Portfolio Management Team
| ||

|
||
| Edmund Bellord | ||
| Portfolio Manager | ||
| Moon Surana, CFA | ||
| Portfolio Manager | ||
Performance Summary
The Emerging Markets Research Portfolio Institutional Class fell 30.09% (net of fees and expenses) in the fiscal year ended October 31, 2022. The benchmark, the MSCI Emerging + Frontier Markets Index, fell 31.03% (net of source taxes).
Market Review
Emerging markets (EMs) were burdened by a series of adverse macroeconomic and geopolitical events this fiscal year. The period began with heightened concerns about inflation and a slowdown in China’s economic growth, and fears of a global recession intensified over the course of the 12 months. In February came Russia’s appalling attack on Ukraine, which led the US and its allies to enact severe sanctions against Russia and caused spikes in energy and commodities prices. The US Federal Reserve’s hawkish monetary policy to combat inflation—including four 75-basis-point interest rate hikes from June to November 2022—also stoked a surge in the value of the US dollar. In February came Russia’s appalling attack on Ukraine, which led the US and its allies to enact severe sanctions against Russia and caused spikes in energy and commodity prices.
While the strength of the dollar weighed on dollar-denominated EM returns, the currencies of many developing countries held up better against the greenback than those of developed countries. In Latin America, central banks, including Brazil’s, were ahead of the Fed in lifting rates, bringing these nations closer to the peaks of their tightening cycles. By contrast, Asian countries, including India and Indonesia, resisted pressure to match the Fed’s hikes. China’s monetary policy remained loose, in keeping with the government’s imperative to stimulate a slowing economy.
| Fund Facts at October 31, 2022 | ||
| Total Net Assets |
$6.2M | |
| Sales Charge |
None | |
| Number of Holdings |
128 | |
| Turnover (5 Yr. Avg.) |
54% | |
| Dividend Policy |
Annual | |
| Institutional Investors | ||
| Ticker |
HLREX | |
| CUSIP |
412295776 | |
| Inception Date |
12/19/2016 | |
| Minimum Investment1 |
$100,000 | |
| Net Expense Ratio2 |
1.15%3 | |
| Gross Expense Ratio2 |
2.28% | |
1Lower minimums available through certain brokerage firms; 2The Gross and Net Expense Ratios are as of the most recent Prospectus and have been restated to reflect current fees; 3The Net Expense Ratio is shown net of Harding Loevner’s contractual agreement through February 28, 2023. Harding Loevner’s contractual agreement caps the net expense ratio at 1.15%. The Net Expense Ratio is applicable to investors.
Markets in the Middle East and Latin America were among the strongest, buoyed in part by the rising (albeit volatile) price of oil. Brazil was boosted by returns from energy giant Petrobras along with an uptick in consumer spending and a recovery in the job market. Signs that the country’s inflation had crested also provided a lift to growth stocks.
After Russia, China was the second-worst performing EM. Its woes were reflected in the sharp declines in the Consumer Discretionary, Real Estate, and Communication Services sectors. The country’s “zero-COVID” policy disrupted normal life and consumer-spending patterns for much of the year. Regulators’ efforts to prick China’s residential real estate bubble also caused home prices to decline, prompting regulators to offer more credit support to help developers complete unfinished projects. Advertising spending, a key source of revenue for Communication Services companies such as Tencent and Baidu, also saw a pullback.
Utilities was the most resilient sector. Financials also outperformed thanks to Brazilian, Indian, and Indonesian banks, which enjoyed robust growth in retail lending and expanding net interest margins amid rising interest rates.
Performance Attribution
The Portfolio fell less than the Index primarily due to good stocks in the Consumer Discretionary and Health Care sectors as well as favorable sector allocations; our overweight in Financials and Industrials and underweight in the lagging Communication
| 32 | ||
Table of Contents
| Performance (% Total Return) | ||||||||||||||||||||||||||||||||
| For periods ended September 30, 2022 | For periods ended October 31, 2022 | |||||||||||||||||||||||||||||||
| 1 Year | 3 Years | 5 Years | Since Inception* | 1 Year | 3 Years | 5 Years | Since Inception* | |||||||||||||||||||||||||
| Emerging Markets Research Portfolio – Inst. Class |
-29.44 | -4.18 | -2.22 | 2.40 | -30.09 | -5.22 | -2.54 | 2.32 | ||||||||||||||||||||||||
| MSCI Emerging + Frontier Markets Index |
-28.08 | -2.09 | -1.82 | 2.95 | -31.03 | -4.43 | -3.10 | 2.35 | ||||||||||||||||||||||||
Returns are annualized for periods greater than 1 year. *Inception date: December 19, 2016.
Performance data quoted represents past performance; past performance does not guarantee future results. The investment return and principal value of an investment will fluctuate so that an investor’s shares, when redeemed, may be worth more or less than their original cost. Current performance of the Portfolio may be lower or higher than the performance quoted. Performance data current to the most recent month end may be obtained by calling (877) 435-8105 or visiting hardingloevnerfunds.com.
Services sector were especially helpful. We had poor performers in Energy and Communication Services.
Consumer Discretionary holdings Hero Motocorp, a leading provider of motorcycles in India, and Astra International, which distributes Toyota vehicles in Indonesia, benefited from the resurgence in the sale of physical goods due to the recovery from COVID-19. Our limited exposure to expensive Chinese e-commerce stocks in this sector was also helpful. In Health Care, shares of China’s CSPC Pharmaceutical outperformed as the company’s phase 1 trial for its mRNA COVID-19 vaccine showed results comparable to those of the mRNA vaccine produced by BioNTech and marketed by Pfizer.
Poor returns in Energy and Communication Services were largely due to our Russian holdings in these sectors: oil giant Lukoil, gas producer Novatek, and internet-search provider Yandex. Soon after Russia’s invasion of Ukraine, the US- and UK-listed shares we hold became untradeable because of Western sanctions and actions taken by stock exchanges and brokers. On March 7, we marked down the value of these Russian holdings to effectively zero. Shares of South Korean search engine and e-commerce company Naver also performed poorly amid concerns about slowing spending by advertisers and consumers.
On a regional basis, we benefited from positive stock selection in China (particularly Health Care businesses CSPC and Sino Biopharmaceutical) and our underweight in the country. Relative returns were further boosted by the Portfolio’s overweight in Latin America (especially Brazil, Mexico, and Peru). We also selected good stocks in Mexico, where commercial bank GF Banorte enjoyed an acceleration in lending growth and a boost in margins from higher interest rates. We had poor returns in Europe due to Russian holdings.
Perspective and Outlook
In a world at odds with itself, as leading nations fight acute economic challenges and look to mold a new order that preserves or advances their global standing, investors flocked this fiscal year to the relative safety of the US dollar. It is widely accepted that, in the face of a strengthening dollar, emerging-market equities will struggle to generate competitive (dollar-based) returns. Indeed, through much of the past 25
Total Return Based on a $100,000 Investment Institutional Class
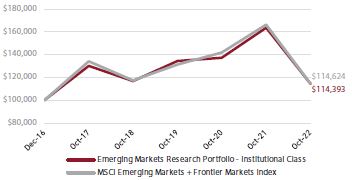
The chart above illustrates the hypothetical return of an investment made in the corresponding share class. Investment return reflects voluntary fee waivers in effect. Absent such waivers, total return would be reduced. The performance provided in the table and chart above do not reflect the deduction of taxes that a shareholder would pay on Portfolio distributions or the redemption of Portfolio shares.
years, the dollar-based returns of the MSCI EM Index relative to the developed-market MSCI World Index have been negatively correlated with the strength of the greenback.
One explanation for this relationship is that many EM countries and companies issue dollar-denominated debt, often without a matched source of hard-currency income; a strong dollar makes the debt more costly to pay off. The so-called fragile countries—those burdened with persistent reliance on external financing, such as Brazil, Turkey, Indonesia, and South Africa—are perceived to suffer most in strong-dollar environments.
Macroeconomic predictions don’t direct our investment process. If they did, and if we had correctly foreseen that fiscal 2022 would witness extreme dollar appreciation, the conventional portfolio-construction action would have been to reduce exposure to the stock markets of the most fragile countries. But even though our dollar forecast would have been spot-on, thus far our portfolio reallocations would not have reaped the expected reward—not when countries such as Brazil, Indonesia, and Turkey have produced some of the best returns year to date. This is a good illustration of the futility of basing investment decisions on macroeconomic forecasts.
| 33 |
Table of Contents
We wonder whether the recent pattern of returns across EMs and the high dispersion among them partly reflect something new and enduring: the early stages of profound shifts in global supply chains. Various industrialized countries, most notably the US, have been adjusting their industrial policies in reaction to the supply shocks emanating from the pandemic. Geopolitical priorities and strategies are also changing as the world transitions to a multipolar power structure, accelerated by Russia’s invasion of Ukraine. The industrial policy changes are designed to alter companies’ long-term operational decisions and investment plans. The “lowest-cost” strategy that companies pursued for more than a generation, and which led to a high concentration of global manufacturing in China, is giving way to strategies that place greater emphasis on the security of supply chains and control over technology.
The Portfolio holds several EM companies that should be aided by this change in emphasis, including LONGi, China’s largest manufacturer of solar components and a critical player in global solar power generation. The long-term pivot toward renewable energy has been given extra impetus by the crisis surrounding fossil fuel production and distribution since Russia invaded Ukraine. Another example is Aspeed, a Taiwanese fabless chip designer that commands a roughly 70% share of the niche market for baseboard management controllers (BMC), which facilitate data centers by rebooting a problematic component when a server freezes. As data centers become increasingly complex, BMCs provide the ability to manage server components and their security remotely on a more granular level. Aspeed is also expanding into new products, including the first 360-degree image-processing solution that could be used for security surveillance and videoconferencing.
The US government’s new industrial policy initiatives appear relevant to both companies’ competitive markets. In August, Congress passed two significant pieces of legislation intended to alter the competitive dynamics and global structure of certain industries: the CHIPS and Science Act (CSA), which aims to secure an advantage for the US in accessing the supply of semiconductors; and the Inflation Reduction Act (IRA), which features an unprecedented US$391 billion directed at climate change and energy transition.
Critically, the incentive packages in the CSA restrict participating companies from making additional investments in countries that present a threat to the US—namely China. If the primary objective is to attract the leading chip technology to the US, it would require the participation of Taiwan’s TSMC and South Korea’s Samsung Electronics, both of which have manufacturing capabilities in China that they are unlikely to give up. This leads us to suspect the CSA’s investment restrictions will be negotiable. It makes sense for these companies to diversify their capacity and gain greater proximity to some of their most important customers by expanding capacity in the US. That said, the cost of manufacturing in the US will likely remain materially higher than in Asia until the US-based supply chain reaches sufficient scale. There is fear that these increased costs
will come at a time when the financial wherewithal to spend on technology is constrained by a recession. The risk of a structural deceleration in growth has increased, but we continue to think that rapidly expanding applications for semiconductors still support long-term growth prospects for the industry.
Turning from chips to solar, higher tax credits earmarked for solar projects in the IRA, the other major piece of industrial legislation, should both improve solar’s cost relative to other energy sources and incentivize equipment makers to invest in US manufacturing capacity. The US happens to have a rich supply of quartz, which is used to build solar panels, and the world’s highest-purity quartz is found in North Carolina. In an unusual turn of the tables, US quartz has partially filled the needs of LONGi’s wafer plants in China. Fortunately for LONGi, the IRA doesn’t exclude participants based on their country of origin. Securing enduring access to the US market may provide LONGi with a significant growth opportunity at attractive economics.
| Portfolio Positioning (% Weight) at October 31, 2022 |
| |||||||
| Sector | Portfolio | Benchmark1 | ||||||
| Comm Services |
5.5 | 8.7 | ||||||
| Cons Discretionary |
12.3 | 12.1 | ||||||
| Cons Staples |
12.0 | 6.6 | ||||||
| Energy |
1.1 | 5.6 | ||||||
| Financials |
29.0 | 23.8 | ||||||
| Health Care |
6.5 | 4.2 | ||||||
| Industrials |
10.8 | 6.1 | ||||||
| Info Technology |
14.6 | 18.8 | ||||||
| Materials |
3.4 | 9.1 | ||||||
| Real Estate |
2.2 | 1.8 | ||||||
| Utilities |
0.7 | 3.2 | ||||||
| Cash |
1.9 | – | ||||||
| Geography | Portfolio | Benchmark1 | ||||||
| Brazil |
10.4 | 6.4 | ||||||
| China + Hong Kong2 |
25.8 | 26.6 | ||||||
| India |
6.7 | 16.0 | ||||||
| Mexico |
5.2 | 2.6 | ||||||
| Russia |
0.0 | – | ||||||
| South Africa |
1.4 | 3.6 | ||||||
| South Korea |
7.5 | 11.8 | ||||||
| Taiwan |
10.8 | 13.3 | ||||||
| Small Emerging Markets3 |
23.9 | 18.5 | ||||||
| Frontier Markets4 |
6.4 | 1.2 | ||||||
| Cash |
1.9 | – | ||||||
1MSCI Emerging + Frontier Markets Index; 2The Emerging Markets Research Portfolio’s end weight in China at at October 31, 2022 is 25.8% and Hong Kong is 0.0%. The Benchmark does not include Hong Kong; 3Includes the remaining emerging markets which, individually, comprise less than 5% of the Index; 4Includes countries with less-developed markets outside the Index.
| 34 |
Table of Contents
As nations jostle to enhance the security of their supply chains, it behooves us to analyze the security of operations and revenue opportunities for individual companies and look for those that stand to benefit from the changes afoot. Though it is impossible to predict with confidence the detail of policy changes and their ramifications, financially strong businesses with a competitive edge hold the advantage. It is intriguing that, in this bear market, stocks of the highest-quality companies have been less resilient than in previous market sell-offs, shrinking their valuation premiums. This improves the prospects for strong relative returns from shares of high-quality, growing companies and bolsters the case for holding them.
Portfolio Highlights
The holdings in the Portfolio are directly determined from the universe of companies that are our analysts have rated “buy.” We ended the period with 128 holdings. Over the twelve-month period, the Portfolio’s profile did not change significantly, with the notable exception of two sectors. Our Energy weight declined sharply, largely due to the markdown of our two Russian holdings in the sector. Outside of Russia, valuation was, as usual, a key cause of portfolio adjustments. Our transactions increased the Portfolio’s weight in Financials, reflecting analysts’ favorable recommendations for high-quality banks whose share prices had fallen to an attractive level. Meanwhile, analysts’ concerns about excessively high valuations in Consumer Discretionary led us to reduce our sector exposure.
In Financials, we repurchased a number of companies in the second half of the year that we had sold in the first half due to valuation concerns. Shares of Mexico’s GF Banorte, for example, had surged in response to the COVID-19 recovery and appeared expensive when we sold in April; the share price later fell on concerns about Mexico’s slowing economy and fears that the company may overpay to acquire Citigroup’s franchise in Mexico, known as Banamex. The analyst viewed the decline as overdone given the bank’s positive outlook for lending growth and management’s ultimate decision not to bid for Banamex. Our other purchases of high-quality banks included Chile’s Banco Santander, Peru’s Credicorp, and Saudi Arabia’s Al Rajhi Bank.
We made several purchases in Information Technology, including Aspeed and LONGi, both mentioned in the previous section, and Taiwan’s Delta Electronics, a dominant global provider of power-supply equipment. The analyst determined that the company enjoys significant long-term growth opportunities serving a variety of industries where power management is crucial, including industrial automation and electric vehicles.
Our Consumer Discretionary weight declined in part due to a series of trims to our strong-performing holding Hero Motocorp. Governance concerns were the key reason for the sale of another holding in the sector, Gree Electric Appliance, China’s leading air conditioner manufacturer. We first became concerned when the company announced in August 2021 that it was acquiring
| Top Ten Holdings by Weight at October 31, 2022 | ||||||||
| Company | Sector | Market | % | |||||
| GF Banorte |
Financials | Mexico | 2.2 | |||||
| Localiza |
Industrials | Brazil | 2.2 | |||||
| FEMSA |
Cons Staples | Mexico | 2.2 | |||||
| Credicorp |
Financials | Peru | 2.1 | |||||
| HDFC Bank |
Financials | India | 2.1 | |||||
| B3 |
Financials | Brazil | 2.1 | |||||
| Bank Rakyat |
Financials | Indonesia | 2.0 | |||||
| Banco Santander Chile |
Financials | Chile | 2.0 | |||||
| Hon Hai Precision |
Info Technology | Taiwan | 2.0 | |||||
| Delta Electronics |
Info Technology | Taiwan | 1.9 | |||||
a small, lossmaking EV company in which Gree’s chairwoman owned an 18% stake. We did not see any synergies or other competitive benefit from the acquisition. Later, the analyst flagged Gree’s new and poorly designed stock-incentive plan, with its low performance hurdles and outsized allocation to the same chairwoman. We shared our concerns on these issues with management, but proposals relating to both the acquisition and the incentive plan passed at the general meeting. Subsequently, the analyst removed the stock from our universe of companies qualified for the Portfolio.
Please read the separate disclosures page for important information, including the risks of investing in the Portfolio.
| 35 |
Table of Contents
Institutional Investors: HLMCX
Portfolio Management Team

Pradipta Chakrabortty
Co-Lead Portfolio Manager
Wenting Shen, CFA
Co-Lead Portfolio Manager
Jingyi Li
Portfolio Manager
Performance Summary
The Chinese Equity Portfolio Institutional Class fell 46.20% (net of fees and expenses) in the twelve-month period ended October 31, 2022. The Portfolio’s benchmark, the MSCI China All Shares Index, fell 42.58% (net of source taxes).
Market Review
The MSCI China All Shares Index suffered a sharp decline as property market woes, weakening currency, geopolitical tensions, and continued COVID-19 restrictions dampened the outlook for China’s economic growth.
Chinese economic data was generally grim this year. The World Bank revised down estimates for 2022 China GDP growth to 2.8% from 5.0% in April, putting China’s expected growth below that of Asia overall for the first time since 1990. The Caixin Manufacturing Purchasing Managers’ Index (PMI) fell to 48.1 in September, worse than expected and below the 50 reading that indicates the economy is in contraction. And despite a rebound in activity in the second quarter as COVID-19 lockdowns eased, the National Bureau of Statistics reported that year to date through August, industrial profits worsened to a 2.1% year-over-year decline, from a 1.1% decline through July.
China’s zero-COVID policy continued to be a headwind to growth. Morgan Stanley estimated that as of early October, cities comprising about 5% of Chinese GDP remained restricted in some way. However, the most-recent lockdowns were at least shorter, less severe, and less disruptive to businesses than the total citywide shutdowns that occurred earlier in the fiscal year.
| Fund Facts at October 31, 2022 | ||
| Total Net Assets |
$2.6M | |
| Sales Charge |
None | |
| Number of Holdings |
52 | |
| Turnover (5 Yr. Avg.) |
– | |
| Dividend Policy |
Annual | |
| Institutional Investors | ||
| Ticker |
HLMCX | |
| CUSIP |
412295685 | |
| Inception Date |
12/16/2020 | |
| Minimum Investment1 |
$100,000 | |
| Net Expense Ratio2 |
1.15%3 | |
| Gross Expense Ratio2 |
6.98% | |
1Lower minimums available through certain brokerage firms; 2The Gross and Net Expense Ratios are as of the most recent Prospectus and have been restated to reflect current fees; 3The Net Expense Ratio is shown net of Harding Loevner’s contractual agreement through February 28, 2023. Harding Loevner’s contractual agreement caps the net expense ratio at 1.15%. The Net Expense Ratio is applicable to investors.
The slump in China’s property market worsened during the year. Top developers reported that September sales fell 30% from the same time last year (following a 31% drop in August). One problem has been deteriorating confidence in developers’ ability to complete their projects. The problem has been self-reinforcing, with some homebuyers ceasing to make obligatory escrow payments for homes they are buying before completion, which are part of the funding that developers count on to finish the work.
In 2021, when China’s policymakers escalated their fight against a growing property bubble by limiting credit for the country’s most indebted developers, they seemed to accept (or even welcome) that some of those developers could be pushed into insolvency. Now that the failure of Evergrande and a handful of others to meet their bond obligations has shaken confidence in less-leveraged developers, policymakers have turned their focus to keeping the damage from spreading. In August 2022, the government eased fears of systemic meltdown when it began guaranteeing the bonds of a handful of better-capitalized but still embattled private developers (a similar playbook to the US Treasury Department’s Troubled Assets Relief Program during the global financial crisis). Shortly after period end, the government issued a “16-point plan” that eased restrictions on financing and M&A deals within the sector and broadened support for home buyers, further lifting the market’s dour sentiment.
Currency depreciation has sapped the effectiveness of monetary policies intended to reduce threats to growth. In 2022, the US Federal Reserve has led many of the world’s central banks in
| 36 |
Table of Contents
| Performance (% Total Return) |
| For periods ended September 30, 2022 | For periods ended October 31, 2022 | |||||||||||||||
| 1 Year | Since Inception* | 1 Year | Since Inception* | |||||||||||||
| Chinese Equity Portfolio – Inst. Class |
-38.68 | -27.12 | -46.20 | -30.65 | ||||||||||||
| MSCI China All Shares Index |
-31.75 | -22.80 | -42.58 | -27.72 | ||||||||||||
Returns are annualized for periods greater than 1 year. *Inception date: December 16, 2020.
Performance data quoted represents past performance; past performance does not guarantee future results. The investment return and principal value of an investment will fluctuate so that an investor’s shares, when redeemed, may be worth more or less than their original cost. Current performance of the Portfolio may be lower or higher than the performance quoted. Performance data current to the most recent month end may be obtained by calling (877) 435-8105 or visiting hardingloevnerfunds.com.
raising interest rates to combat inflation, pushing the US dollar to record highs against other major currencies. The People’s Bank of China, on the other hand, continued to ease rates. This divergence in policies has hurt the renminbi (RMB), which fell 9% in the trailing 12 months, raising the cost of imports, including vital inputs like crude oil and iron ore. RMB depreciation should help Chinese exporters. However, after significant growth in Chinese consumer spending over the past half-dozen years, as of 2021 exports account for only 20% of the Chinese economy. That is a higher percentage than for the US (11%) but less than half that of the European Union (50%), and not high enough to offset the drag on the economy from the higher cost of imported goods.
US industrial policies had a more direct effect on Chinese shares. The Biden administration announced new policies designed to encourage the reshoring of critical supply chains and to support US competitiveness in strategically important fields such as fusion energy and artificial intelligence. While the immediate impact of the policies on supply chains could be limited, shares of Chinese electric vehicle (EV), solar, and biotech manufacturing companies were among the period’s weakest recent performers. In October, the administration issued another set of policies that further limit China’s access to advanced semiconductors and chip-making equipment. The measures, designed to hamstring China’s defense and surveillance industries, could have far-ranging implications throughout the global chip supply chain.
Performance Attribution
The Portfolio underperformed the benchmark primarily due to poor stocks in Information Technology (IT) and Real Estate. Our underweights to the outperforming Financials and Energy sectors—both areas where we struggle to find companies meeting our high-quality, durable-growth criteria—also weighed on relative returns. We outperformed in Consumer Discretionary and benefitted from having double the weight versus the benchmark in the relatively resilient Industrials sector.
Our poor returns in IT and Real Estate were caused primarily by one stock in each. The culprit in IT was Taiwanese power management integrated-circuits manufacturer Silergy. Management lowered guidance for the second half of the
Total Return Based on a $100,000 Investment Institutional Class
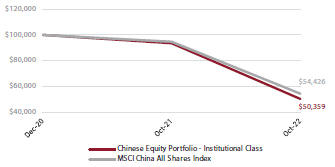
The chart above illustrates the hypothetical return of an investment made in the corresponding share class. Investment return reflects voluntary fee waivers in effect. Absent such waivers, total return would be reduced. The performance provided in the table and chart above do not reflect the deduction of taxes that a shareholder would pay on Portfolio distributions or the redemption of Portfolio shares.
year, citing weakening demand in PC and consumer markets. The stock was also caught in the trend of growth-stock underperformance occurring in the first half of 2022. In Real Estate, Country Garden Services (CG Services) was a significant detractor. Amid the ongoing turmoil in the property sector, CG Services’ sister company (and China’s largest developer), Country Garden Holdings (CG Holdings), was among the real estate companies to face concerns about its financial strength and warrant government backstopping of its bonds during the quarter. Any material change in the growth prospects for CG Holdings would impact the ability of CG Services to increase the number of communities to which it provides property management services, most of which historically have been developed by CG Holdings.
We outperformed in the Consumer Discretionary sector by avoiding lossmaking, early-stage companies such as EV maker XPeng in favor of companies with superior industry structures and bargaining power. One of these is Shuanghuan Driveline, a leading producer of high-precision gears for Tesla and most of the Chinese market. Online travel agency Trip.com Group was also a relatively good stock; the company reported better than expected results thanks to a strong recovery in its business outside China, which offset ongoing weakness in its home base. Trip.com has been
| 37 |
Table of Contents
broadening its international footprint through its subsidiary Skyscanner, a UK platform, and a partnership with TripAdvisor of the US.
Perspective and Outlook
Chinese citizens have generally enjoyed rising incomes for the past four decades. Investments by the government in infrastructure, education, and the seeding of domestic industries and supply chains enabled large-scale urbanization and, eventually, a skilled labor force that could command higher incomes, leading to better living standards. Based on one measure1 the middle class in China has gone from 3% of the population in 2000 to more than 50% (700 million) today. With higher income comes more disposable income to spend on cars, better housing and appliances, electronics, and fashion accessories as well as food and drink.
Western luxury brands were early beneficiaries of this trend, as their recognition in China became a form of cachet. Still, for millions of Chinese, there is a long-standing, homegrown signifier of taste and class. Kweichow Moutai (Moutai) is the market leader in baijiu, a colorless spirit made by fermenting red sorghum and wheat. The company is partially owned by the local government in central China’s Guizhou province and has been operating in some form since the Han dynasty, circa 135 CE. Though its products are an acquired taste, Moutai is such a status symbol that it is used to elevate everything from state banquets2 and high-flying business dinners to a first meeting with prospective in-laws. One of our China specialists recalls that her grandfather stored his prized bottles of Moutai baijiu under the bed with the other family treasures.
Moutai has a 50% market share of the ultra-premium baijiu segment, and its products are priced accordingly: Half-liter bottles of “Flying Fairy3,” its finest version, cost over US$400. The exorbitant price tag and conspicuous association with luxury have turned it into a kind of currency, implicated in incidents of bribery involving Communist party officials, and periodically targeted as part of government anti-corruption reforms. Together with the government’s recent “common prosperity” agenda to reduce income disparities, this has raised the specter of a political or even social backlash. However, even if Chinese demand for luxury goods were to slacken broadly, sales of Moutai may not follow suit for the simple reason that supply is extremely limited—circumscribed by a lengthy (five-year) production cycle and a highly manual quality control process, which relies on proprietary techniques and the acuity of the master blender’s sense of taste.
1From the “ChinaPower Project,” The Center for Strategic and International Studies (December 2021), which defines the bounds of “middle class” as individuals spending between $10 and $50 per day.
2In 1974, US Secretary of State Henry Kissinger told Deng Xiaoping, “I think if we drink enough Moutai we can solve anything.”
3Or feitian in Chinese—probably more accurately translated as an apsara, a Hindu and Buddhist spirit.
Perhaps so as not to trigger government ire, the factory price of Moutai is kept far below what the consumer will pay, equating to a huge retail markup on the product that the company never sees. To capture more of that revenue, in May Moutai launched a proprietary e-commerce app called iMoutai, which cuts out the middlemen, allowing the company to charge the manufacturer’s suggested retail price and keep the entire amount. Recent company results suggest the direct approach is working: First-half 2022 revenues rose 17%, and direct-to-consumer sales now account for 36% of total company sales, all without a politically sensitive retail price increase.
Although a US$2 bottle of soy sauce would seem to have little in common with a US$400 bottle of booze, Foshan Haitian is an example of how the rising levels of discernment of Chinese consumers influence even the most humble categories. The company is introducing new varieties that go beyond plain and low sodium to include flavors like extra savory, “no additions,” and a children’s version, as well as expanding into complementary products such as vinegar, cooking wine, and premixed hot pot bases.
Haitian’s leading market share in China has risen more than a third since 2017 but is still only around 20%. With the prices for China-based seasonings half those of leading brands in other countries, there’s room for margin expansion, especially now that Haitian has emerged as the price setter. Recently, the company raised prices by up to 7% to pass on higher costs for soybeans, packaging, and transport, and its rivals followed suit.
| Portfolio Positioning (% Weight) at October 31, 2022 |
| |||||||
| Sector | Portfolio | Benchmark1 | ||||||
| Comm Services |
6.7 | 9.3 | ||||||
| Cons Discretionary |
21.1 | 18.9 | ||||||
| Cons Staples |
6.9 | 9.7 | ||||||
| Energy |
0.0 | 3.1 | ||||||
| Financials |
5.6 | 16.6 | ||||||
| Health Care |
13.9 | 7.9 | ||||||
| Industrials |
22.5 | 11.0 | ||||||
| Info Technology |
17.3 | 10.2 | ||||||
| Materials |
1.2 | 7.7 | ||||||
| Real Estate |
0.2 | 2.5 | ||||||
| Utilities |
2.0 | 3.1 | ||||||
| Cash |
2.6 | – | ||||||
| Geography | Portfolio | Benchmark1 | ||||||
| Mainland China + Hong Kong |
90.9 | 100.0 | ||||||
| Other Emerging Markets |
6.5 | – | ||||||
| Cash |
2.6 | – | ||||||
| 1MSCI China All Shares Index. |
||||||||
| 38 | ||
Table of Contents
Even if it means paying slightly higher prices, Chinese consumers are increasingly seeking out more nutritious and high-quality food options. Yili is a company based in Inner Mongolia whose breakfast milk, yogurt, popsicles, and chocolate-covered ice cream bars became a favorite of northern Chinese schoolchildren in the 1990s before becoming more widely distributed throughout mainland China.
Yili has used its distribution prowess and brand equity as a springboard into other higher-value products. Once disdained in China, affluent Chinese parents are now using Yili’s single-serving cheese bars as a healthy snack food. The company has gained four points of overall dairy market share and is now the second-largest cheese maker in China, after Shanghai-based Milkground.
Snacks, of course, aren’t just for kids, especially not in China. The country’s indigenous snack industry produces a vast array of packaged foodstuffs—shrimp chips, dried beef mini bites, fried sweet-and-savory cat ear–shaped crackers, crunchy cookie morsels made to look like tiny pork buns, any number of biscuits, jerky, fruit rolls, and vegetable-flavored sticks. Structurally, the industry is a nightmare, fragmented among hundreds of regional players, each with its own small but devoted following.
Salted, fried sunflower seeds are so popular they are almost their own snack category. Traditionally, these seeds were most often sold unpackaged from large bins in mom-and-pop street stalls. However, in 2001, ChaCha invented an industrialized production method and a more healthful boiling preparation process, and quickly gobbled up market share. ChaCha now controls 45% of the Chinese retail sunflower seed market, and with 1,000 distributors and over 400,000 points of sale, its brightly colored packages have become some of the most-recognized food items in China. It has also used its brand recognition to gain China’s second-largest (15%) market share in packaged nuts, which have been gaining popularity as an even more nutritious snack.
Portfolio Highlights
China’s parcel delivery industry is enormous, directly benefiting from the rising share of China’s shopping that is moving online. This year we took advantage of market volatility to establish a new position in ZTO Express, China’s e-commerce delivery market leader, at an attractive price. In China, e-commerce has already reached around 30% of total retail sales and comprises 6% of GDP. While China’s express delivery market is already the largest in the world on an absolute basis, the market is still quite fragmented among a handful of top carriers. ZTO currently has about 23% market share in express delivery, the highest among the peer group. In addition to continued growth of the overall industry, the company expects it can achieve additional share gains thanks to better infrastructure and the ability to resume operations quickly following lockdowns.
| Ten Largest Holdings by Weight at October 31, 2022 | ||||||||
| Company | Sector | Market | % | |||||
| Tencent |
Comm Services | Mainland China | 4.0 | |||||
| AirTAC |
Industrials | Taiwan | 3.8 | |||||
| AIA Group |
Financials | Hong Kong | 3.8 | |||||
| WuXi AppTec |
Health Care | Mainland China | 3.4 | |||||
| Alibaba |
Cons Discretionary | Mainland China | 3.2 | |||||
| China Tourism Group Duty Free |
Cons Discretionary | Mainland China | 2.9 | |||||
| TravelSky |
Info Technology | Mainland China | 2.9 | |||||
| CSPC Pharmaceutical Group |
Health Care | Mainland China | 2.8 | |||||
| Inovance |
Industrials | Mainland China | 2.7 | |||||
| Techtronic Industries |
Industrials | Hong Kong | 2.7 | |||||
ZTO invested earlier than its peers to build an efficient logistics infrastructure. This led to an immense delivery network covering over 98% of China’s county-level cities that even now handles a daily parcel volume greater than UPS and FedEx combined. The company has been able to generate industry-leading profit margins by continually reducing its per-parcel costs through fleet upgrades and the successful consolidation and automation of its sorting centers. Unlike its peers, it, not third parties, owns and operates most of its sorting hubs, which means it can implement improvements more easily.
Please read the separate disclosures page for important information, including the risks of investing in the Portfolio.
| 39 | ||||
Table of Contents
Emerging Markets ex China Portfolio
Institutional Investors: HLXCX
Portfolio Management Team

Pradipta Chakrabortty
Portfolio Manager
Scott Crawshaw
Portfolio Manager
Richard Schmidt, CFA
Portfolio Manager
Performance Summary
The Emerging Markets ex China Portfolio was incepted on September 14, 2022. Since inception, the Institutional Class declined 2.30% (net of fees and expenses) in the period ended October 31, 2022. The Portfolios’ benchmark, the MSCI Emerging Markets ex China Index, fell 5.47% (net of source taxes).
Market Review
Emerging markets (EMs) were burdened by a series of adverse macroeconomic and geopolitical events this fiscal year. The period began with heightened concerns about inflation and a slowdown in China’s economic growth, and fears of a global recession intensified over the course of the 12 months. In February came Russia’s appalling attack on Ukraine, which led the US and its allies to enact severe sanctions against Russia and caused spikes in energy and commodities prices. The US Federal Reserve’s hawkish monetary policy to combat inflation—including four 75-basis-point interest rate hikes from June to November 2022—also stoked a surge in the value of the US dollar.
While the strength of the dollar weighed on dollar-denominated EM returns, the currencies of many developing countries held up better against the greenback than those of developed countries. In Latin America, central banks, including Brazil’s, were ahead of the Fed in lifting rates, bringing these nations closer to the peaks of their tightening cycles. By contrast, Asian countries, including India and Indonesia, resisted pressure to match the Fed’s hikes. China’s monetary policy remained loose, in keeping with the government’s imperative to stimulate a slowing economy.
| Fund Facts at October 31, 2022 | ||
| Total Net Assets |
$3.0M | |
| Sales Charge |
None | |
| Number of Holdings |
50 | |
| Turnover (5 Yr. Avg.) |
– | |
| Dividend Policy |
Annual | |
| Institutional Investors | ||
| Ticker |
HLXCX | |
| CUSIP |
29104D105 | |
| Inception Date |
09/14/2022 | |
| Minimum Investment1 |
$100,000 | |
| Net Expense Ratio2 |
1.10%3 | |
| Gross Expense Ratio2 |
4.84% | |
1Lower minimums available through certain brokerage firms; 2The Gross and Net Expense Ratios are as of the most recent Prospectus and have been restated to reflect current fees; 3The Net Expense Ratio is shown net of Harding Loevner’s contractual agreement through February 28, 2024. Harding Loevner’s contractual agreement caps the net expense ratio at 1.10%. The Net Expense Ratio is applicable to investors.
The strongest markets were in the Middle East and Latin America, buoyed in part by the rising (albeit volatile) price of oil. Brazil was boosted by returns from energy giant Petrobras along with an uptick in consumer spending and a recovery in the job market. Signs that the country’s inflation had crested also provided a lift to growth stocks.
Information Technology (IT) was one of the worst sectors, reflecting expectations of weaker global demand for consumer electronics. Taiwanese semiconductor companies TSMC and Silergy, were among the weak performers.
Utilities was the only sector to post a positive return. Financials also outperformed thanks to Brazilian, Indian, and Indonesian banks, which enjoyed robust growth in retail lending and expanding net interest margins amid rising interest rates. Industrials stocks in Latin America also posted strong returns.
Perspective and Outlook
In a world at odds with itself, as leading nations fight acute economic challenges and look to mold a new order that preserves or advances their global standing, investors flocked this fiscal year to the relative safety of the US dollar. It is widely accepted that, in the face of a strengthening dollar, emerging-market equities will struggle to generate competitive (dollar-based) returns. Indeed, through much of the past 25 years, the dollar-based returns of the MSCI EM Index relative to the developed-market MSCI World Index have been negatively correlated with the strength of the greenback.
| 40 |
Table of Contents
| Performance (% Total Return) | ||||||||
| For periods ended September 30, 2022 | For periods ended October 31, 2022 | |||||||||||||
| 1 Year | Since Inception* | 1 Year | Since Inception* | |||||||||||
| Emerging Markets ex China Portfolio – Institutional Class |
– | -8.00 | – | -2.30 | ||||||||||
| MSCI Emerging Markets ex China Index |
– | -8.39 | – | -5.47 | ||||||||||
*Inception date: September 14, 2022.
Performance data quoted represents past performance; past performance does not guarantee future results. The investment return and principal value of an investment will fluctuate so that an investor’s shares, when redeemed, may be worth more or less than their original cost. Current performance of the Portfolio may be lower or higher than the performance quoted. Performance data current to the most recent month end may be obtained by calling (877) 435-8105 or visiting hardingloevnerfunds.com.
One explanation for this relationship is that many EM countries and companies issue dollar-denominated debt, often without a matched source of hard-currency income; a strong dollar makes the debt more costly to pay off. The so-called fragile countries—those burdened with persistent reliance on external financing, such as Brazil, Turkey, Indonesia, and South Africa—are perceived to suffer most in strong-dollar environments.
Macroeconomic predictions don’t direct our investment process. If they did, and if we had correctly foreseen that fiscal 2022 would witness extreme dollar appreciation, the conventional portfolio-construction action would have been to reduce exposure to the stock markets of the most fragile countries. But even though our dollar forecast would have been spot-on, thus far our portfolio reallocations would not have reaped the expected reward—not when countries such as Brazil, Indonesia, and Turkey have produced some of the best returns year to date. This is a good illustration of the futility of basing investment decisions on macroeconomic forecasts.
We wonder whether the recent pattern of returns across EMs and the high dispersion among them partly reflect something new and enduring: the early stages of profound shifts in global supply chains. Various industrialized countries, most notably the US, have been adjusting their industrial policies in reaction to the supply shocks emanating from the pandemic. Geopolitical priorities and strategies are also changing as the world transitions to a multipolar power structure, accelerated by Russia’s invasion of Ukraine. The industrial policy changes are designed to alter companies’ long-term operational decisions and investment plans. The “lowest-cost” strategy that companies pursued for more than a generation, and which led to a high concentration of global manufacturing in China, is giving way to strategies that place greater emphasis on the security of supply chains and control over technology.
The Portfolio holds several EM companies that should be aided by this change in emphasis, including Aspeed, a Taiwanese fabless chip designer that commands a roughly 70% share of the niche market for baseboard management controllers (BMC), which facilitate data centers by rebooting a problematic component when a server freezes. As data centers become increasingly complex, BMCs provide the ability to manage server
components and their security remotely on a more granular level. Aspeed is also expanding into new products, including the first 360-degree image-processing solution that could be used for security surveillance and videoconferencing.
The US government’s new industrial policy initiatives, intended to alter the competitive dynamics and global structure of certain industries, appear relevant to some of our holdings’ markets. One of the significant pieces of legislation that Congress recently passed is the CHIPS and Science Act (CSA), which aims to secure an advantage for the US in accessing the supply of semiconductors.
Critically, the incentive packages in the CSA restrict participating companies from making additional investments in countries that present a threat to the US—namely China. If the primary objective is to attract the leading chip technology to the US, it would require the participation of Taiwan’s TSMC and South Korea’s Samsung Electronics, both of which have manufacturing capabilities in China that they are unlikely to give up. This leads us to suspect the CSA’s investment restrictions will be negotiable. It makes sense for these companies to diversify their capacity and gain greater proximity to some of their most important customers by expanding capacity in the US. That said, the cost of manufacturing in the US will likely remain materially higher than in Asia until the US-based supply chain reaches sufficient scale. There is fear that these increased costs will come at a time when the financial wherewithal to spend on technology is constrained by a recession. The risk of a structural deceleration in growth has increased, but we continue to think that rapidly expanding applications for semiconductors support long-term growth prospects for the industry.
As nations jostle to enhance the security of their supply chains, it behooves us to analyze the security of operations and revenue opportunities for individual companies and look for those that stand to benefit from the changes afoot. Though it is impossible to predict with confidence the detail of policy changes and their ramifications, financially strong businesses with a competitive edge hold the advantage. It is intriguing that, in this bear market, stocks of the highest-quality companies have been less resilient than in previous market sell-offs,
| 41 |
Table of Contents
shrinking their valuation premiums. This improves the prospects for strong relative returns from shares of high-quality, growing companies and bolsters the case for holding them.
Portfolio Highlights
This new Portfolio follows the same fundamental investment approach as our closely related Emerging Markets Portfolio—investing only in high-quality companies that we believe have the potential to grow faster and sustain that growth longer than the average EM company. We construct a diverse portfolio of select EM companies that meet our “quality growth” criteria by investing widely across the entire EM universe, apart from China.
We think our resolute quality discipline is particularly valuable in times of elevated macroeconomic uncertainty and financial market stress. Businesses that consistently generate high returns on capital and have the security of sound balance sheets need not quake when, amid tightening global liquidity, the price of money rises, and supply of risk capital becomes scarce. Businesses that generate healthy cash flow even in difficult circumstances can continue investing to sustain their growth without fear that a cyclical downturn will jeopardize their financial viability. Such resilience in the face of adversity supports sustained growth and economic value creation that compounds through time to produce long-term shareholder returns.
The Portfolio’s holdings include Asian Paints, a leading manufacturer in India of consumer-focused decorative paints and paints for industrial applications, such as automotive coatings, wood finishes, and waterproofing. The company’s key competitive advantage is its extensive distribution network, which spans 15 countries across South and Southeast Asia and the Middle East, including more than 145,000 retail outlets in India alone. It has delivered an average return on equity of 25% over the past five years and should benefit from rising income levels and increasing urbanization in key markets, as well as rising automobile ownership. With a net cash position, Asian Paints is poised to take share from financially weaker players in what is still a fragmented market.
In the Gulf Cooperation Council region, we hold Emaar Properties, a UAE real estate company whose flagship developments in Dubai include the Burj Khalifa (the tallest building in the world) and the Dubai Mall (among the largest in the world). The company’s large land bank—about 1.7 billion square feet mostly in prime locations in Dubai—is a significant competitive advantage, as is the UAE government’s large stake in Emaar, which provides the company privileged access to the most-promising development opportunities. We should see strong earnings growth for the company as improving economic activity in the UAE fuels consumer spending.
In Taiwan, Eclat Textile, a manufacturer of specialized sportswear fabrics, is a high-quality holding in the Consumer Discretionary sector. Eclat has been diversifying its production geographically, investing in Vietnam in 2005 and later Cambodia and Indonesia. Eclat’s competitive advantages include its high degree of vertical integration, from yarn production to weaving high-performance fabrics to finished garment production. It also uses contract manufacturers that can meet the demanding product specifications and delivery timelines of Eclat’s global customers, including Nike and Lululemon. The combination has helped Eclat achieve higher and more stable profit margins than peers in an industry that is exposed to consumer cycles.
Lastly, our diverse collection of Brazilian holdings includes XP, Brazil’s leading online platform for investment and financial services. The company provides access to high-quality investment products across equity, fixed income, and alternative investments, as well as life insurance, pension products, and real estate investment trusts. XP, which was spun off from our bank
| Portfolio Positioning (% Weight) at October 31, 2022 |
| |||||||
| Sector | Portfolio | Benchmark1 | ||||||
| Comm Services |
4.0 | 6.1 | ||||||
| Cons Discretionary |
11.0 | 6.0 | ||||||
| Cons Staples |
11.7 | 6.7 | ||||||
| Energy |
3.4 | 6.5 | ||||||
| Financials |
24.5 | 26.2 | ||||||
| Health Care |
3.1 | 3.2 | ||||||
| Industrials |
12.1 | 6.0 | ||||||
| Info Technology |
23.1 | 23.7 | ||||||
| Materials |
1.9 | 11.0 | ||||||
| Real Estate |
1.6 | 1.2 | ||||||
| Utilities |
0.0 | 3.4 | ||||||
| Cash |
3.6 | – | ||||||
| Geography | Portfolio | Benchmark1 | ||||||
| Brazil |
13.2 | 8.8 | ||||||
| India |
15.4 | 22.2 | ||||||
| Mexico |
11.9 | 3.6 | ||||||
| South Korea |
10.3 | 16.3 | ||||||
| South Africa |
3.7 | 5.0 | ||||||
| Taiwan |
13.0 | 18.5 | ||||||
| Small Emerging Markets2 |
16.3 | 25.6 | ||||||
| Frontier Markets3 |
2.1 | – | ||||||
| Developed Markets Listed4 |
10.5 | – | ||||||
| Cash |
3.6 | – | ||||||
1MSCI Emerging Markets ex China Index; 2Includes the remaining emerging markets which, individually, comprise less than 5% of the Index; 3Includes countries with less-developed markets outside the Index; 4Includes emerging markets or frontier markets companies listed in developed markets.
| 42 |
Table of Contents
| Ten Largest Holdings by Weight at October 31, 2022 | ||||||||
| Company | Sector | Market | % | |||||
| Samsung Electronics |
Info Technology | South Korea | 4.8 | |||||
| Tata Consultancy Services |
Info Technology | India | 4.1 | |||||
| EPAM |
Info Technology | US | 3.8 | |||||
| Walmart de México |
Cons Staples | Mexico | 3.7 | |||||
| TSMC |
Info Technology | Taiwan | 3.6 | |||||
| GF Banorte |
Financials | Mexico | 3.1 | |||||
| Localiza |
Industrials | Brazil | 2.9 | |||||
| WEG |
Industrials | Brazil | 2.9 | |||||
| FEMSA |
Cons Staples | Mexico | 2.7 | |||||
| HDFC Bank |
Financials | India | 2.6 | |||||
holding Itaú Unibanco, also offers financial advisory services through its Independent Financial Advisor (IFA) network to retail, high net-worth, and institutional clients. XP’s competitive advantage comes from the scale of its open platform (with by far the largest IFA distribution network in the country), leading technology, and a strong brand. XP’s revenues have increased an average of 40% in each of the past five years, and we expect the company to continue this trajectory by expanding its banking services, including lending, at the expense of the large legacy banks. The company’s deep knowledge of the financial and risk-taking profiles of its customers enables it to lend at a relatively low risk.
Please read the separate disclosures page for important information, including the risks of investing in the Portfolio.
| 43 |
Table of Contents
International Developed Markets Equity Portfolio
Institutional Investors: HLIDX
Portfolio Management Team

|
Ferrill Roll, CFA Co-Lead Portfolio Manager
Andrew West, CFA Co-Lead Portfolio Manager
Bryan Lloyd, CFA Portfolio Manager
Babatunde Ojo, CFA Portfolio Manager
Patrick Todd, CFA Portfolio Manager |
Performance Summary
The International Developed Markets Equity Portfolio was incepted on September 28, 2022. Since inception, the Institutional Class gained 3.40% (net of fees and expenses) in the period ended October 31, 2022. The Portfolio’s benchmark, the MSCI World ex-US Index, gained 5.94% (net of source taxes).
Market Review
International developed equity markets fell sharply in the period amid aggressive central bank rate hikes intended to cool inflation, commodity supply shocks emanating from the war in Ukraine, and overall weakness in China.
The period began with consumer prices in the US climbing at the fastest pace since 1982, leading the US Federal Reserve (Fed) to signal several interest rate increases and an imminent end to its bond-buying program. So far, the Fed has hiked interest rates six times, taking rates from between 0% and 0.25% at the start of the period to between 3.75% and 4% by November 2. Other central bankers across developed and emerging markets continued to raise their own borrowing rates, with Bank of Japan the notable exception as it remained committed to an ultra-accommodative monetary policy.
Russia’s invasion of Ukraine in the closing days of February prompted a swift and emphatic response by Western governments, which nevertheless sought to strike a balance between punishing Russian aggression and avoiding an escalating military conflict. The US and its allies enacted crippling economic sanctions, including freezing a significant share of Russian central bank reserve assets, cutting off many
| Fund Facts at October 31, 2022 | ||
| Total Net Assets |
$2.0M | |
| Sales Charge |
None | |
| Number of Holdings |
58 | |
| Turnover (5 Yr. Avg.) |
– | |
| Dividend Policy |
Annual | |
| Institutional Investors | ||
| Ticker |
HLIDX | |
| CUSIP |
412295669 | |
| Inception Date |
9/28/2022 | |
| Minimum Investment1 |
$100,000 | |
| Net Expense Ratio2 |
0.80%3 | |
| Gross Expense Ratio2 |
7.79% | |
1Lower minimums available through certain brokerage firms; 2The Gross and Net Expense Ratios are as of the most recent Prospectus and have been restated to reflect current fees; 3The Net Expense Ratio is shown net of Harding Loevner’s contractual agreement through February 28, 2024. Harding Loevner’s contractual agreement caps the net expense ratio at 0.80%. The Net Expense Ratio is applicable to investors.
of the country’s banks from SWIFT (Society for Worldwide Interbank Financial Telecommunications), and outlawing the export of a variety of industrial and luxury goods to Russia. The revulsion over Russia’s actions also provoked an exodus of Western companies from Russian markets. With foreign investors effectively unable to trade, major market index providers expunged all Russian securities from their indexes.
The war’s contribution to inflation was twofold. In September, Russia retaliated against European sanctions by cutting off the flow of natural gas to the continent, sending energy prices soaring as countries scrambled to find other sources. Ballooning food prices were another component. Prior to the war, Ukraine was one of the world’s largest suppliers of grains and vegetable oils, and many countries have been hard-pressed to find alternatives.
Energy was the only positive sector during the period, soaring nearly 17% as supply shocks from the war produced a meteoric rise in commodities prices. Information Technology (IT), Real Estate, and Consumer Discretionary all declined by more than 30%. Consumer Discretionary stocks were impacted by slumping consumer confidence in the face of surging prices, while central bank efforts to tame inflation hurt fast-growing stocks that comprise the IT sector.
All major regions declined. The eurozone performed the worst as the sharp rise in energy prices compounded the difficulties of countries already grappling with mounting inflation. Japan also performed poorly as the yen strongly depreciated against the US dollar. Canada was the best-performing region, aided by the rise in commodities prices.
| 44 | ||
Table of Contents
Performance (% Total Return)
| For periods ended September 30, 2022 | For periods ended October 31, 2022 | |||||||||||||||
| 1 Year | Since Inception* | 1 Year | Since Inception* | |||||||||||||
| International Developed Markets Equity Portfolio – Inst. Class |
– | – | – | 3.40 | ||||||||||||
| MSCI World ex US Index |
– | – | – | 5.94 | ||||||||||||
*Inception date: September 28, 2022.
Performance data quoted represents past performance; past performance does not guarantee future results. The investment return and principal value of an investment will fluctuate so that an investor’s shares, when redeemed, may be worth more or less than their original cost. Current performance of the Portfolio may be lower or higher than the performance quoted. Performance data current to the most recent month end may be obtained by calling (877) 435-8105 or visiting hardingloevnerfunds.com.
Style factors played a significant role as shares of the highest-quality companies, the fastest-growing companies, and the most-expensive companies all significantly underperformed.
Perspective and Outlook
Within the span of a few months in the summer and fall of 2022, markets lurched from a consensus that the fight against inflation would soon be won toward a despairing view that slaying inflation would require sustained punishment by high interest rates. As practiced observers of both markets and policymakers, we have not put much belief in either narrative or tried to predict which outcome will ultimately drive the markets. Instead, we intensified our efforts to reaffirm the long-term prospects of the companies we own and those qualified for purchase by our analysts. We aim to build a portfolio of companies that is resilient to many different economic environments, knowing that we can’t predict which environment they will face tomorrow.
The global economy has been dramatically affected by Russia’s invasion of Ukraine and the still-unfolding energy crisis in Europe. Looking ahead, the risk that Taiwan could be the epicenter of a conflict between the US and China is one that we must push higher up the list of risks that our portfolio must be built to withstand. We have long viewed this risk as both low and distant; it is no longer distant. Nevertheless, we don’t pretend to be experts in US-China relations or try to forecast geopolitical events. Our strict adherence to our portfolio guidelines, including the requirement of ample geographic diversification, is one way we protect against the most catastrophic consequences.
Beyond geopolitical risks, the threat of inflation remains at the fore. Analyzing businesses’ resilience to persistent inflation is an area where we think we have a small leg up because many of our analysts have covered companies in developing countries where inflation has been an enduring concern. Moreover, for the last 15 years, our fair value estimates have explicitly incorporated inflation assumptions for every company we cover.
Yet another factor we must consider is an environment of positive real rates, which is exposing vulnerabilities built up over decades of easy money. The most concerning thus far have been the weaknesses hidden in some UK pension plans, whose structures were predicated on well-behaved interest rates. Their struggle
to meet margin calls was the catalyst for the “whatever scale necessary” intervention by the Bank or England in its domestic bond market in September. Though similar vulnerabilities likely exist elsewhere, our longstanding preference for transparency and insistence on financial strength at the companies we hold is designed to keep our portfolios relatively sheltered from this kind of distress.
Portfolio Highlights
While heightened risk aversion fed by the war in Ukraine, dramatic currency movements, and interest rate hikes has roiled stock markets, we see far more underlying business resiliency than what is reflected in share prices. For example, in Japan many companies with global revenues are benefiting from the yen’s weakness.
Overall, a weak yen is likely to be a modest net positive for our Japanese companies’ earnings by boosting their global competitiveness. These companies typically have leading global positions in their industries and generate much of their revenue outside their domestic market; in the short run, this results in a large translation gain for their yen-denominated earnings. Offsetting higher foreign revenues are rising imported costs for inputs such as energy and other raw materials along with semiconductors. Producer prices in Japan, which are heavily reliant on imported inputs, have risen more sharply on a year-over-year basis than Japanese consumer prices. In contrast, Japanese labor costs have risen only modestly over the year, and in foreign-currency terms they have fallen sharply, potentially giving our Japanese companies an enduring edge over their global competitors if they can, through cultural affinity, continue to retain talent without ballooning costs.
Our four Japanese Industrials holdings generate on average more than two-thirds of their sales outside of Japan and, based on latest estimates, appear to be on track to deliver positive 2022 earnings growth. Our biggest concern for these companies is that weaker global growth may erode the demand for capital goods.
Our most recent Japanese investment, Shimano, the world’s leading manufacturer of bicycle components with roughly a 70% global share of the high-end drivetrain and braking system market, has an even higher share of foreign sales, almost
| 45 |
Table of Contents
90%. More than half of its sales come from Europe and North America, where customers pay a premium for its products. Sales are receiving a boost from the growing market for electric bikes, where Shimano components also dominate the top end. Yen weakness has provided an additional fillip, resulting in year-over-year sales and profit growth of 15% and 22%, respectively, in the first half of this year. The weaker exchange rate is making Shimano and the four industrial companies much more potent in competing against European and US manufacturers, so long as they can contain their domestic costs.
Japanese drugmakers Chugai Pharmaceutical and Shionogi are also enjoying an earnings boost from the weaker yen, as they generate on average a majority of their sales abroad, mainly in the form of royalties. Hematology testing systems maker Sysmex anticipates growth in 2023, helped by a large share of foreign revenues (84%) despite Chinese volumes being suppressed by that country’s lingering lockdowns. Despite producing 69% of its sales abroad, cosmetics maker Shiseido has not been so lucky due to its high direct exposure to the Chinese market (a third of revenues) and indirect exposure through domestic sales to Chinese tourists. To the extent that China’s consumer slowdown is a consequence of the lockdowns,
| Portfolio Positioning (% Weight) at October 31, 2022 |
| |||||||
| Sector | Portfolio | Benchmark1 | ||||||
| Comm Services |
1.3 | 4.5 | ||||||
| Cons Discretionary |
4.3 | 10.1 | ||||||
| Cons Staples |
11.5 | 10.0 | ||||||
| Energy |
3.5 | 7.0 | ||||||
| Financials |
19.5 | 19.9 | ||||||
| Health Care |
14.5 | 12.3 | ||||||
| Industrials |
16.3 | 14.9 | ||||||
| Info Technology |
12.5 | 7.8 | ||||||
| Materials |
11.0 | 7.7 | ||||||
| Real Estate |
0.0 | 2.4 | ||||||
| Utilities |
0.4 | 3.4 | ||||||
| Cash |
5.2 | – | ||||||
| Geography | Portfolio | Benchmark1 | ||||||
| Canada |
4.8 | 11.7 | ||||||
| Emerging Markets |
7.3 | – | ||||||
| Europe EMU |
25.2 | 28.0 | ||||||
| Europe ex-EMU |
29.0 | 29.3 | ||||||
| Frontier Markets2 |
0.0 | – | ||||||
| Japan |
16.4 | 19.5 | ||||||
| Middle East |
0.0 | 0.8 | ||||||
| Pacific ex-Japan |
10.3 | 10.7 | ||||||
| Other3 |
1.8 | – | ||||||
| Cash |
5.2 | – | ||||||
1MSCI World ex US Index; 2Includes countries with less-developed markets outside the Index. 3Includes companies classified in countries outside the Index.
| Ten Largest Holdings by Weight at October 31, 2022 | ||||||||
| Company | Sector | Market | % | |||||
| Roche |
Health Care | Switzerland | 4.0 | |||||
| DBS Group |
Financials | Singapore | 3.9 | |||||
| L’Oréal |
Cons Staples | France | 3.8 | |||||
| Atlas Copco |
Industrials | Sweden | 3.7 | |||||
| Schneider Electric |
Industrials | France | 3.2 | |||||
| Infineon Technologies |
Info Technology | Germany | 3.1 | |||||
| BHP |
Materials | Australia | 3.0 | |||||
| Royal Dutch Shell |
Energy | United Kingdom | 2.9 | |||||
| Allianz |
Financials | Germany | 2.9 | |||||
| AIA Group |
Financials | Hong Kong | 2.9 | |||||
and assuming travel restrictions eventually lift, we expect Shiseido’s revenues to recover in time.
NITORI, a furniture and home-accessories retailer, is our only Japanese holding where yen weakness is an unmitigated negative given that the company sells goods to domestic consumers that it primarily makes in China or Vietnam. The cost in yen to produce its merchandise is therefore rising, pressuring Nitori’s margins. In the first half of 2022, Nitori held the line on retail prices while investing in ways to cut its operating costs, which at least has been easier than for peers given its vertical integration across manufacturing, distribution, and online and brick-and-mortar points of sale. Recently, management indicated it will hike prices on selected products by as much as 20%, having seen competitors do the same and noting Japanese shoppers’ reluctant acceptance of increases across consumer categories.
Within the Financials sector, banks and life insurance companies are among businesses that should benefit most from higher interest rates. Rising rates tend to increase net interest margins for banks, and they augment the returns from new fixed income investments for life insurance companies while reducing the capital they need to set aside today to meet future claims.
But, while higher interest rates are positive for business, extreme volatility in bond markets is not, given banks’ and insurers’ roles as counterparties to complex derivative contracts and holders of collateral against leveraged positions of more prosaic instruments. In balancing sentiment in the short term, fear of as yet unseen exposures can outweigh the greed of longer-term benefits of higher yields. The insurance sector fell victim recently to extreme volatility in the gilts market. While shares of our own insurance holdings such as AIA Group, Ping An Insurance, and Allianz likely have been dented by negative marks in their investment portfolios, we view this and their pandemic-related disruptions (in the case of AIA Group and Ping An Insurance) and regulatory compliance lapses (Allianz) to be transitory. We value their low leverage and the low sensitivity of their product sales to the economic cycle.
Please read the separate disclosures page for important information, including the risks of investing in the Portfolio.
| 46 |
Table of Contents
This page intentionally left blank.
| 47 |
Table of Contents
Disclosures
The Portfolios invest in foreign securities, which will involve greater volatility and political, economic, and currency risks and differences in accounting methods. They also invest in emerging markets, which involve unique risks, such as exposure to economies less diverse and mature than the US or other more established foreign markets. Economic and political instability may cause larger price changes in emerging markets securities than other foreign securities.
Investments in small- and mid-cap companies involve additional risks such as limited liquidity and greater volatility.
Diversification does not guarantee a profit or prevent a loss in a declining market.
Long-term earnings growth and earnings per share growth are not a forecast of the Portfolios’ future performance.
The value of securities may fluctuate in response to various factors including, but not limited to, public health risks; these may be magnified if conditions and events adversely impact the global economy.
Companies held in the Portfolios at the end of the fiscal year appear in bold type; only the first reference to a particular holding appears in bold. The Portfolios are actively managed; therefore holdings shown may not be current. Portfolio holdings and top ten holdings should not be considered recommendations to buy or sell any security. Please refer to the Portfolios of Investments in this report for complete Portfolio holdings. Current and future Portfolio holdings are subject to risk.
While the Portfolios have no sales charge, management fees and other expenses still apply. Please see the Prospectus for further details.
Sector and Geographic Positioning data is sourced from: Northern Trust, Harding Loevner Funds Portfolios, and MSCI Barra.
Expense Ratios: Differences may exist between the commentary data and similar information reported in the financial statements due to timing differences. Unless otherwise stated, the expense ratios presented are shown as of the most recent Prospectus date, February 28, 2022.
Five year average turnover data is calculated using a simple average of annual turnover figures for the past five fiscal years. These annual turnover figures utilize purchase, sales, and market value data which is not reflective of adjustments required pursuant to Generally Accepted Accounting Principles (GAAP). Accordingly, differences may exist between this data and similar information reported in the financial statements.
Quasar Distributors, LLC, Distributor.
Index Definitions
The MSCI All Country World Index is a free float-adjusted market capitalization index that is designed to measure equity market performance in the global developed and emerging markets. The Index consists of 47 developed and emerging market countries. Net dividends reinvested.
The MSCI All Country World ex-US Index is a free float-adjusted market capitalization index that is designed to measure equity market performance in the global developed and emerging markets, excluding the US. The Index consists of 46 developed and emerging market countries. Net dividends reinvested.
The MSCI All Country World ex-US Small Cap Index is a free-float market capitalization index that is designed to measure small cap developed and emerging market equity performance. The Index consists of 48 developed and emerging market countries, and is comprised of companies that fall within a market capitalization range of USD 17-8,751 million (as of September 30, 2022).
The MSCI Emerging Markets Index is a free float-adjusted market capitalization index that is designed to measure equity market performance in the global emerging markets. The Index consists of 24 emerging market countries. Net dividends reinvested.
The MSCI China All Shares Index is a free float-adjusted market capitalization index that is designed to reflect an opportunity set capturing large and mid-cap China share classes listed in Hong Kong, Shanghai, Shenzhen, and outside of China.
The MSCI Emerging + Frontier Markets Index is a free float-adjusted market capitalization index that is designed to measure equity market performance in the global emerging markets and frontier markets. The Index consists of 25 emerging markets countries and 28 frontier markets countries. Net dividends reinvested.
The MSCI Frontier Emerging Markets index is a free float-adjusted market capitalization index designed to measure equity market performance in all countries from the MSCI Frontier Markets Index and the lower size spectrum of the MSCI Emerging Markets Index. The Index consists of 28 frontier markets and 4 emerging markets. Net dividends reinvested.
The MSCI World ex US Index is a free float-adjusted market capitalization index that is designed to measure equity market performance in the global developed markets, excluding the US. The index consists of 22 developed market countries.
The MSCI Emerging Markets ex China Index is a free float-adjusted market capitalization index that is designed to measure equity market performance in the global emerging markets excluding China. The index consists of 23 emerging market countries. Net dividends reinvested.
The S&P 500 Index is an unmanaged index commonly used to measure performance of US stocks.
You cannot invest directly in these indexes.
Term Definitions
Basis Points are a common measurement used chiefly for interest rates and other percentages in finance. A basis point is one hundredth of one percent.
Economies of Scale is the cost advantage that arises with increased output of a product.
Gross Domestic Product (GDP) is the monetary value of all finished goods and services produced within a country’s borders in a specific time period (usually calculated on an annual basis).
Market Capitalization is the total dollar market value of all of a company’s outstanding shares.
Turnover is calculated by dividing the lesser of Purchases or Sales by Average Capital.
| 48 |
Table of Contents
This page intentionally left blank.
Table of Contents
This page intentionally left blank.
Table of Contents
|
|
|
Global Equity Portfolio
International Equity Portfolio
International Small Companies Portfolio
Institutional Emerging Markets Portfolio
Emerging Markets Portfolio
Frontier Emerging Markets Portfolio
Global Equity Research Portfolio
International Equity Research Portfolio
Emerging Markets Research Portfolio
Chinese Equity Portfolio
Emerging Markets ex China Portfolio
International Developed Markets Equity Portfolio |
Table of Contents
This page intentionally left blank.
Table of Contents
Harding, Loevner Funds, Inc.
| 2 | ||||
| 4 | ||||
| 4 | ||||
| 7 | ||||
| 10 | ||||
| 13 | ||||
| 17 | ||||
| 20 | ||||
| 23 | ||||
| 31 | ||||
| 38 | ||||
| 42 | ||||
| 44 | ||||
| 47 | ||||
| 50 | ||||
| 53 | ||||
| 55 | ||||
| 59 | ||||
| 79 | ||||
| 93 | ||||
| 95 | ||||
| 96 | ||||
| 105 | ||||
| 106 | ||||
| 111 | ||||
For use only when preceded or accompanied by a prospectus. Read the prospectus carefully before you invest or send money.
Table of Contents
Harding, Loevner Funds, Inc.
October 31, 2022 (unaudited)
As a shareholder of a Harding Loevner Portfolio, you incur ongoing costs, including management fees; to the extent applicable, distribution (12b-1) fees and/or shareholder services fees; and other fund expenses. The following examples are intended to help you understand your ongoing costs (in dollars and cents) of investing in a Portfolio and to compare these costs with the ongoing costs of investing in other mutual funds.
The examples are based on an investment of $1,000 invested at the beginning of a six month period and held through the period ended October 31, 2022.
Actual Expenses
The first line under each Portfolio in the table below provides information about actual account values and actual expenses. You may use the information in this line, together with the amount you invested, to estimate the expenses that you paid over the period. Simply divide your account value by $1,000 (for example, an $8,600 account value divided by $1,000 = 8.6), then multiply the result by the number in the first line for your Portfolio under the heading entitled “Expenses Paid During Period” to estimate the expenses you paid on your account during this period.
Hypothetical Example for Comparison Purposes
The second line under each Portfolio in the table below provides information about hypothetical account values and hypothetical expenses based on the Portfolio’s actual expense ratio and an assumed rate of return of 5% per year before expenses, which is not the Portfolio’s actual return. The hypothetical account values and expenses may not be used to estimate the actual ending account balance or expenses you paid for the period. You may use this information to compare the ongoing costs of investing in your Portfolio and other funds. To do so, compare this 5% hypothetical example with the 5% hypothetical examples that appear in the shareholder reports of the other funds. Please note that the expenses shown in the table are meant to highlight your ongoing costs only. Therefore, the second line under each Portfolio in the table is useful in comparing ongoing costs only, and will not help you determine the relative total costs of owning different funds.
| Portfolio |
Beginning Account Value May 1, 2022 |
Ending Account Value October 31, 2022 |
Annualized Expense Ratio |
Expenses Paid During Period* (May 1, 2022 to October 31, 2022) |
||||||||||||
| Global Equity Portfolio — Institutional Class |
||||||||||||||||
| Actual |
$ | 1,000.00 | $ | 876.40 | 0.86 | % | $ | 4.07 | ||||||||
| Hypothetical (5% annual return before expenses) |
1,000.00 | 1,020.87 | 0.86 | 4.38 | ||||||||||||
| Global Equity Portfolio — Institutional Class Z |
||||||||||||||||
| Actual |
1,000.00 | 876.80 | 0.80 | 3.78 | ||||||||||||
| Hypothetical (5% annual return before expenses) |
1,000.00 | 1,021.17 | 0.80 | 4.08 | ||||||||||||
| Global Equity Portfolio — Advisor Class |
||||||||||||||||
| Actual |
1,000.00 | 875.40 | 1.06 | 5.01 | ||||||||||||
| Hypothetical (5% annual return before expenses) |
1,000.00 | 1,019.86 | 1.06 | 5.40 | ||||||||||||
| International Equity Portfolio — Institutional Class |
||||||||||||||||
| Actual |
1,000.00 | 867.20 | 0.80 | 3.77 | ||||||||||||
| Hypothetical (5% annual return before expenses) |
1,000.00 | 1,021.17 | 0.80 | 4.08 | ||||||||||||
| International Equity Portfolio — Institutional Class Z |
||||||||||||||||
| Actual |
1,000.00 | 867.60 | 0.72 | 3.39 | ||||||||||||
| Hypothetical (5% annual return before expenses) |
1,000.00 | 1,021.58 | 0.72 | 3.67 | ||||||||||||
| International Equity Portfolio — Investor Class |
||||||||||||||||
| Actual |
1,000.00 | 865.90 | 1.12 | 5.27 | ||||||||||||
| Hypothetical (5% annual return before expenses) |
1,000.00 | 1,019.56 | 1.12 | 5.70 | ||||||||||||
| International Small Companies Portfolio — Institutional Class |
||||||||||||||||
| Actual |
1,000.00 | 877.10 | 1.12 | 5.30 | ||||||||||||
| Hypothetical (5% annual return before expenses) |
1,000.00 | 1,019.56 | 1.12 | 5.70 | ||||||||||||
| International Small Companies Portfolio — Investor Class |
||||||||||||||||
| Actual |
1,000.00 | 876.20 | 1.33 | 6.29 | ||||||||||||
| Hypothetical (5% annual return before expenses) |
1,000.00 | 1,018.50 | 1.33 | 6.77 | ||||||||||||
2
Table of Contents
Harding, Loevner Funds, Inc.
Expense Example (continued)
October 31, 2022 (unaudited)
| Portfolio |
Beginning Account Value May 1, 2022 |
Ending Account Value October 31, 2022 |
Annualized Expense Ratio |
Expenses Paid During Period* (May 1, 2022 to October 31, 2022) |
||||||||||||
| Institutional Emerging Markets Portfolio — Institutional Class |
||||||||||||||||
| Actual |
$ | 1,000.00 | $ | 860.40 | 1.10 | % | $ | 5.16 | ||||||||
| Hypothetical (5% annual return before expenses) |
1,000.00 | 1,019.66 | 1.10 | 5.60 | ||||||||||||
| Institutional Emerging Markets Portfolio — Institutional Class Z |
||||||||||||||||
| Actual |
1,000.00 | 860.80 | 1.00 | 4.69 | ||||||||||||
| Hypothetical (5% annual return before expenses) |
1,000.00 | 1,020.16 | 1.00 | 5.09 | ||||||||||||
| Emerging Markets Portfolio — Advisor Class |
||||||||||||||||
| Actual |
1,000.00 | 860.20 | 1.21 | 5.67 | ||||||||||||
| Hypothetical (5% annual return before expenses) |
1,000.00 | 1,019.11 | 1.21 | 6.16 | ||||||||||||
| Frontier Emerging Markets Portfolio — Institutional Class I |
||||||||||||||||
| Actual |
1,000.00 | 874.00 | 1.58 | 7.46 | ||||||||||||
| Hypothetical (5% annual return before expenses) |
1,000.00 | 1,017.24 | 1.58 | 8.03 | ||||||||||||
| Frontier Emerging Markets Portfolio — Institutional Class II |
||||||||||||||||
| Actual |
1,000.00 | 874.80 | 1.35 | 6.38 | ||||||||||||
| Hypothetical (5% annual return before expenses) |
1,000.00 | 1,018.40 | 1.35 | 6.87 | ||||||||||||
| Frontier Emerging Markets Portfolio — Investor Class |
||||||||||||||||
| Actual |
1,000.00 | 872.30 | 2.00 | 9.44 | ||||||||||||
| Hypothetical (5% annual return before expenses) |
1,000.00 | 1,015.12 | 2.00 | 10.16 | ||||||||||||
| Global Equity Research Portfolio — Institutional Class |
||||||||||||||||
| Actual |
1,000.00 | 895.20 | 0.80 | 3.82 | ||||||||||||
| Hypothetical (5% annual return before expenses) |
1,000.00 | 1,021.17 | 0.80 | 4.08 | ||||||||||||
| International Equity Research Portfolio — Institutional Class |
||||||||||||||||
| Actual |
1,000.00 | 862.70 | 0.75 | 3.52 | ||||||||||||
| Hypothetical (5% annual return before expenses) |
1,000.00 | 1,021.42 | 0.75 | 3.82 | ||||||||||||
| Emerging Markets Research Portfolio — Institutional Class |
||||||||||||||||
| Actual |
1,000.00 | 864.10 | 1.15 | 5.40 | ||||||||||||
| Hypothetical (5% annual return before expenses) |
1,000.00 | 1,019.41 | 1.15 | 5.85 | ||||||||||||
| Chinese Equity Portfolio — Institutional Class |
||||||||||||||||
| Actual |
1,000.00 | 767.60 | 1.15 | 5.12 | ||||||||||||
| Hypothetical (5% annual return before expenses) |
1,000.00 | 1,019.41 | 1.15 | 5.85 | ||||||||||||
| Emerging Markets ex China Portfolio — Institutional Class** |
||||||||||||||||
| Actual |
1,000.00 | 977.00 | 1.10 | 1.40 | ||||||||||||
| Hypothetical (5% annual return before expenses) |
1,000.00 | 1,005.02 | 1.10 | 1.42 | ||||||||||||
| International Developed Markets Equity Portfolio — Institutional Class*** | ||||||||||||||||
| Actual |
1,000.00 | 1,034.00 | 0.80 | 0.74 | ||||||||||||
| Hypothetical (5% annual return before expenses) |
1,000.00 | 1,003.80 | 0.80 | 0.72 | ||||||||||||
* Expenses are calculated using each Portfolio’s annualized expense ratio (as disclosed in the table), multiplied by the average account value for the period, multiplied by the number of days in the period (184 days), and divided by the number of days in the year (365 days).
** Emerging Markets ex China Portfolio — Institutional Class commenced operations on September 14, 2022 and the Actual example reflects the period from September 14, 2022 to October 31, 2022 (47 days). However, for purposes of comparability, the Hypothetical example assumes that the class was operational for the full six month period.
*** International Developed Markets Equity Portfolio — Institutional Class commenced operations on September 28,2022 and the Actual example reflects the period from September 28, 2022 to October 31, 2022 (33 days). However, for purposes of comparability, the Hypothetical example assumes that the class was operational for the full six month period.
3
Table of Contents
Harding, Loevner Funds, Inc.
October 31, 2022
| Shares | Value | |||||||
| COMMON STOCKS - 96.7% |
||||||||
| Brazil -1.2% |
||||||||
| B3 SA - Brasil Bolsa Balcao (Diversified Financials) |
4,266,000 | $12,420,993 | ||||||
| China - 1.9% |
||||||||
| Country Garden Services Holdings Co., Ltd. (Real Estate)† |
3,433,000 | 3,002,048 | ||||||
| Tencent Holdings Ltd. (Media & Entertainment)† |
256,200 | 6,722,628 | ||||||
| WuXi AppTec Co., Ltd., Class A (Pharmaceuticals, Biotechnology & Life Sciences)† |
951,701 | 9,915,937 | ||||||
| 19,640,613 | ||||||||
| Denmark - 1.1% |
||||||||
| Genmab A/S (Pharmaceuticals, Biotechnology & Life Sciences)*† |
29,669 | 11,442,159 | ||||||
| France - 6.1% |
||||||||
| Kering SA (Consumer Durables & Apparel)† |
20,702 | 9,476,051 | ||||||
| L’Oreal SA (Household & Personal Products)† |
66,854 | 20,989,751 | ||||||
| Schneider Electric SE (Capital Goods)† |
249,592 | 31,587,105 | ||||||
| 62,052,907 | ||||||||
| Germany - 1.5% |
||||||||
| HelloFresh SE (Food & Staples Retailing)*† |
156,275 | 3,129,039 | ||||||
| SAP SE - Sponsored ADR (Software & Services) |
128,092 | 12,304,517 | ||||||
| 15,433,556 | ||||||||
| Hong Kong - 1.0% |
||||||||
| AIA Group Ltd. (Insurance)† |
1,295,405 | 9,782,508 | ||||||
| India - 2.1% |
||||||||
| HDFC Bank Ltd. - ADR (Banks) |
345,277 | 21,514,210 | ||||||
| Indonesia - 1.8% |
||||||||
| Bank Central Asia Tbk PT (Banks)† |
33,069,370 | 18,634,184 | ||||||
| Japan - 2.5% |
||||||||
| Chugai Pharmaceutical Co., Ltd. (Pharmaceuticals, Biotechnology & Life Sciences)† |
381,000 | 8,834,294 | ||||||
| Keyence Corp. (Technology Hardware & Equipment)† |
26,700 | 10,062,621 | ||||||
| MISUMI Group Inc. (Capital Goods)† |
290,300 | 6,173,792 | ||||||
| 25,070,707 | ||||||||
| Netherlands - 2.7% |
||||||||
| Adyen NV (Software & Services)*^† |
9,555 | 13,687,703 | ||||||
| Shares | Value | |||||||
| COMMON STOCKS - 96.7% (continued) |
| |||||||
| Netherlands - 2.7% (continued) |
||||||||
| ASML Holding NV, Reg S (Semiconductors & Semiconductor Equipment) |
28,105 | $13,277,364 | ||||||
| 26,965,067 | ||||||||
| Poland - 0.8% |
||||||||
| CD Projekt SA (Media & Entertainment)† |
294,235 | 7,823,519 | ||||||
| Sweden - 3.8% |
||||||||
| Atlas Copco AB, Class A (Capital Goods)† |
937,910 | 10,013,464 | ||||||
| Epiroc AB, Class A (Capital Goods)† |
650,380 | 9,944,438 | ||||||
| Hexagon AB, Class B (Technology Hardware & Equipment)† |
1,897,695 | 18,743,283 | ||||||
| 38,701,185 | ||||||||
| Switzerland - 3.0% |
||||||||
| Alcon Inc. (Health Care Equipment & Services) |
210,926 | 12,798,990 | ||||||
| Roche Holding AG, Genusschein (Pharmaceuticals, Biotechnology & Life Sciences)† |
31,262 | 10,389,959 | ||||||
| VAT Group AG (Capital Goods)^† |
29,837 | 6,803,615 | ||||||
| 29,992,564 | ||||||||
| Taiwan - 0.8% |
||||||||
| Taiwan Semiconductor Manufacturing Co., Ltd. - Sponsored ADR (Semiconductors & Semiconductor Equipment) |
135,161 | 8,319,160 | ||||||
| United Kingdom - 2.4% |
||||||||
| Abcam plc (Pharmaceuticals, Biotechnology & Life Sciences)*† |
906,481 | 14,042,951 | ||||||
| Spirax-Sarco Engineering plc (Capital Goods)† |
81,297 | 10,011,181 | ||||||
| 24,054,132 | ||||||||
| United States - 64.0% |
||||||||
| Accenture plc, Class A (Software & Services) |
70,318 | 19,963,280 | ||||||
| Adobe Inc. (Software & Services)* |
36,849 | 11,736,406 | ||||||
| Align Technology Inc. (Health Care Equipment & Services)* |
40,816 | 7,930,549 | ||||||
| Alphabet Inc., Class A (Media & Entertainment)* |
361,508 | 34,166,121 | ||||||
| Amazon.com Inc. (Retailing)* |
215,117 | 22,036,585 | ||||||
| AMETEK Inc. (Capital Goods) |
152,063 | 19,716,489 | ||||||
| Apple Inc. (Technology Hardware & Equipment) |
107,950 | 16,553,053 | ||||||
See Notes to Financial Statements
4
Table of Contents
Harding, Loevner Funds, Inc.
Global Equity Portfolio
Portfolio of Investments (continued)
October 31, 2022
| Shares | Value | |||||||
| COMMON STOCKS - 96.7% (continued) |
||||||||
| United States - 64.0% (continued) |
||||||||
| Applied Materials Inc. (Semiconductors & Semiconductor Equipment) |
133,233 | $11,763,142 | ||||||
| Broadcom Inc. (Semiconductors & Semiconductor Equipment) |
24,361 | 11,452,594 | ||||||
| CME Group Inc. (Diversified Financials) |
74,173 | 12,854,181 | ||||||
| CoStar Group Inc. (Commercial & Professional Services)* |
171,703 | 14,203,272 | ||||||
| Costco Wholesale Corp. (Food & Staples Retailing) |
6,077 | 3,047,615 | ||||||
| Danaher Corp. (Pharmaceuticals, Biotechnology & Life Sciences) |
55,707 | 14,019,781 | ||||||
| Deere & Co. (Capital Goods) |
85,684 | 33,915,441 | ||||||
| Edwards Lifesciences Corp. (Health Care Equipment & Services)* |
146,280 | 10,595,060 | ||||||
| Etsy Inc. (Retailing)* |
74,593 | 7,005,029 | ||||||
| First Republic Bank (Banks) |
232,941 | 27,976,214 | ||||||
| Illumina Inc. (Pharmaceuticals, Biotechnology & Life Sciences)* |
78,448 | 17,950,471 | ||||||
| Intuitive Surgical Inc. (Health Care Equipment & Services)* |
47,689 | 11,753,908 | ||||||
| IQVIA Holdings Inc. (Pharmaceuticals, Biotechnology & Life Sciences)* |
54,701 | 11,469,159 | ||||||
| Lululemon Athletica Inc. (Consumer Durables & Apparel)* |
39,671 | 13,053,346 | ||||||
| MercadoLibre Inc. (Retailing)* |
13,242 | 11,939,252 | ||||||
| Meta Platforms Inc., Class A (Media & Entertainment)* |
130,132 | 12,123,097 | ||||||
| Microsoft Corp. (Software & Services) |
112,922 | 26,212,584 | ||||||
| Netflix Inc. (Media & Entertainment)* |
27,546 | 8,040,126 | ||||||
| NIKE Inc., Class B (Consumer Durables & Apparel) |
165,765 | 15,363,100 | ||||||
| NVIDIA Corp. (Semiconductors & Semiconductor Equipment) |
50,231 | 6,779,678 | ||||||
| PayPal Holdings Inc. (Software & Services)* |
151,224 | 12,639,302 | ||||||
| Pinterest Inc., Class A (Media & Entertainment)* |
507,201 | 12,477,145 | ||||||
| Rockwell Automation Inc. (Capital Goods) |
66,742 | 17,039,233 | ||||||
| Salesforce Inc. (Software & Services)* |
93,227 | 15,157,778 | ||||||
| Schlumberger NV (Energy) |
364,218 | 18,950,262 | ||||||
| SVB Financial Group (Banks)* |
85,656 | 19,783,110 | ||||||
| Shares | Value | |||||||
| COMMON STOCKS - 96.7% (continued) |
| |||||||
| United States - 64.0% (continued) |
||||||||
| Synopsys Inc. (Software & Services)* |
66,938 | $19,582,712 | ||||||
| Thermo Fisher Scientific Inc. (Pharmaceuticals, Biotechnology & Life Sciences) |
38,274 | 19,671,688 | ||||||
| Trade Desk Inc., Class A (Media & Entertainment)* |
192,488 | 10,248,061 | ||||||
| Tradeweb Markets Inc., Class A (Diversified Financials) |
195,729 | 10,780,753 | ||||||
| UnitedHealth Group Inc. (Health Care Equipment & Services) |
51,013 | 28,319,867 | ||||||
| Verisk Analytics Inc. (Commercial & Professional Services) |
60,037 | 10,976,565 | ||||||
| Vertex Pharmaceuticals Inc. (Pharmaceuticals, Biotechnology & Life Sciences)* |
131,501 | 41,028,312 | ||||||
| 650,274,321 | ||||||||
| Total Common Stocks (Cost $909,198,516) |
|
$982,121,785 | ||||||
| SHORT TERM INVESTMENTS - 2.7% |
||||||||
| Northern Institutional Funds - Treasury Portfolio (Premier Shares), 2.48% (Money Market Funds) |
27,278,526 | 27,278,526 | ||||||
| Total Short Term Investments (Cost $27,278,526) |
|
$27,278,526 | ||||||
| Total Investments — 99.4% |
||||||||
| (Cost $936,477,042) |
$1,009,400,311 | |||||||
| Other Assets Less Liabilities - 0.6% |
5,814,041 | |||||||
| Net Assets — 100.0% |
$1,015,214,352 | |||||||
Summary of Abbreviations
| ADR | American Depositary Receipt | |
| Reg S | Security sold outside United States without registration under the Securities Act of 1933. | |
| † | Investment categorized as level 2 security as disclosed in Note 2 of the Notes to Financial Statements. | |
| * | Non-income producing security. | |
| ^ | Security exempt from registration pursuant to Rule 144A of the Securities Act of 1933. These securities, which represent 2.0% of net assets as of October 31, 2022, are considered liquid and may be resold in transactions exempt from registration, normally to qualified buyers. | |
See Notes to Financial Statements
5
Table of Contents
Harding, Loevner Funds, Inc.
Global Equity Portfolio
Portfolio of Investments (continued)
October 31, 2022
| Industry | Percentage of Net Assets |
|||
| Banks |
8.5 | % | ||
| Capital Goods |
14.3 | |||
| Commercial & Professional Services |
2.5 | |||
| Consumer Durables & Apparel |
3.7 | |||
| Diversified Financials |
3.6 | |||
| Energy |
1.9 | |||
| Food & Staples Retailing |
0.6 | |||
| Health Care Equipment & Services |
7.1 | |||
| Household & Personal Products |
2.1 | |||
| Insurance |
1.0 | |||
| Media & Entertainment |
9.0 | |||
| Pharmaceuticals, Biotechnology & Life Sciences |
15.6 | |||
| Real Estate |
0.3 | |||
| Retailing |
4.1 | |||
| Semiconductors & Semiconductor Equipment |
5.1 | |||
| Software & Services |
12.9 | |||
| Technology Hardware & Equipment |
4.4 | |||
| Money Market Fund |
2.7 | |||
| Total Investments |
99.4 | |||
| Other Assets Less Liabilities |
0.6 | |||
| Net Assets |
100.0 | % | ||
See Notes to Financial Statements
6
Table of Contents
Harding, Loevner Funds, Inc.
International Equity Portfolio
Portfolio of Investments
October 31, 2022
| Shares | Value | |||||||
| COMMON STOCKS - 96.5% |
||||||||
| Australia - 3.1% |
||||||||
| BHP Group Ltd. - Sponsored ADR (Materials) |
7,643,854 | $365,529,098 | ||||||
| Woodside Energy Group Ltd. - ADR (Energy) |
2,762,423 | 64,005,341 | ||||||
| 429,534,439 | ||||||||
| Brazil - 2.4% |
||||||||
| Ambev SA - ADR (Food Beverage & Tobacco) |
69,410,343 | 211,007,443 | ||||||
| XP Inc., Class A (Diversified Financials)* |
6,660,536 | 122,087,625 | ||||||
| 333,095,068 | ||||||||
| Canada - 4.3% |
||||||||
| Alimentation Couche-Tard Inc. (Food & Staples Retailing) |
5,185,600 | 232,188,204 | ||||||
| Canadian National Railway Co. (Transportation) |
1,666,213 | 197,346,268 | ||||||
| Manulife Financial Corp. (Insurance) |
10,795,500 | 178,927,875 | ||||||
| 608,462,347 | ||||||||
| China - 6.8% |
||||||||
| CSPC Pharmaceutical Group Ltd. (Pharmaceuticals, Biotechnology & Life Sciences)† |
218,440,000 | 224,654,316 | ||||||
| ENN Energy Holdings Ltd. (Utilities)† |
16,316,700 | 161,853,564 | ||||||
| Haier Smart Home Co., Ltd., Class A (Consumer Durables & Apparel)† |
67,179,088 | 190,524,170 | ||||||
| Ping An Insurance Group Co. of China Ltd., Class H (Insurance)† |
35,572,000 | 142,352,400 | ||||||
| Tencent Holdings Ltd. (Media & Entertainment)† |
5,047,500 | 132,445,206 | ||||||
| Zhejiang Sanhua Intelligent Controls Co., Ltd., Class A (Capital Goods)† |
37,198,337 | 107,577,122 | ||||||
| 959,406,778 | ||||||||
| Denmark - 1.0% |
||||||||
| Novozymes A/S, Class B (Materials)† |
2,586,610 | 135,694,212 | ||||||
| France - 9.6% |
||||||||
| Air Liquide SA (Materials)† |
1,157,898 | 151,243,228 | ||||||
| Dassault Systemes SE (Software & Services)† |
5,326,825 | 178,344,029 | ||||||
| Kering SA (Consumer Durables & Apparel)† |
350,392 | 160,387,030 | ||||||
| L’Oreal SA (Household & Personal Products)† |
1,488,550 | 467,351,156 | ||||||
| Schneider Electric SE (Capital Goods)† |
3,050,509 | 386,057,036 | ||||||
| 1,343,382,479 | ||||||||
| Germany - 7.7% |
||||||||
| Allianz SE, Reg S (Insurance)† |
1,834,007 | 330,189,124 | ||||||
| Shares | Value | |||||||
| COMMON STOCKS - 96.5% (continued) |
| |||||||
| Germany - 7.7% (continued) |
||||||||
| Infineon Technologies AG (Semiconductors & Semiconductor Equipment)† |
14,403,709 | $350,686,022 | ||||||
| SAP SE - Sponsored ADR (Software & Services) |
1,998,099 | 191,937,390 | ||||||
| Symrise AG (Materials)† |
2,064,723 | 210,884,964 | ||||||
| 1,083,697,500 | ||||||||
| Hong Kong - 2.5% |
||||||||
| AIA Group Ltd. (Insurance)† |
47,188,774 | 356,355,390 | ||||||
| India - 4.1% |
||||||||
| HDFC Bank Ltd. - ADR (Banks) |
3,305,284 | 205,952,246 | ||||||
| ICICI Bank Ltd. - Sponsored ADR (Banks) |
16,681,258 | 367,654,926 | ||||||
| 573,607,172 | ||||||||
| Indonesia - 1.7% |
||||||||
| Telkom Indonesia Persero Tbk PT (Telecommunication Services)† |
861,606,900 | 242,991,799 | ||||||
| Japan - 13.5% |
||||||||
| Chugai Pharmaceutical Co., Ltd. (Pharmaceuticals, Biotechnology & Life Sciences)† |
7,417,500 | 171,990,485 | ||||||
| Daifuku Co., Ltd. (Capital Goods)† |
2,745,100 | 125,794,879 | ||||||
| FANUC Corp. (Capital Goods)† |
748,300 | 98,348,656 | ||||||
| Keyence Corp. (Technology Hardware & Equipment)† |
487,934 | 183,891,188 | ||||||
| Komatsu Ltd. (Capital Goods)† |
9,104,600 | 174,269,092 | ||||||
| Kubota Corp. (Capital Goods)† |
14,351,300 | 200,207,802 | ||||||
| Nitori Holdings Co., Ltd. (Retailing)† |
1,446,600 | 130,970,815 | ||||||
| Shimano Inc. (Consumer Durables & Apparel)† |
930,900 | 144,349,453 | ||||||
| Shionogi & Co., Ltd. (Pharmaceuticals, Biotechnology & Life Sciences)† |
4,312,000 | 199,750,470 | ||||||
| Shiseido Co., Ltd. (Household & Personal Products)† |
3,824,700 | 132,515,420 | ||||||
| Sysmex Corp. (Health Care Equipment & Services)† |
2,627,907 | 141,762,887 | ||||||
| Unicharm Corp. (Household & Personal Products)† |
6,323,100 | 192,640,336 | ||||||
| 1,896,491,483 | ||||||||
| Mexico - 2.0% |
||||||||
| Fomento Economico Mexicano SAB de CV - Sponsored ADR (Food Beverage & Tobacco) |
3,840,125 | 275,029,753 | ||||||
| Netherlands - 1.9% |
||||||||
| Adyen NV (Software & Services)*^† |
185,683 | 265,994,117 | ||||||
See Notes to Financial Statements
7
Table of Contents
Harding, Loevner Funds, Inc.
International Equity Portfolio
Portfolio of Investments (continued)
October 31, 2022
| Shares | Value | |||||||
| COMMON STOCKS - 96.5% (continued) |
| |||||||
| Russia - 0.0%^^ |
||||||||
| LUKOIL PJSC (Energy)‡ |
4,279,605 | $— | ||||||
| Yandex NV, Class A (Media & Entertainment)*‡ |
2,609,766 | — | ||||||
| — | ||||||||
| Singapore - 3.5% |
||||||||
| DBS Group Holdings Ltd. (Banks)† |
20,072,280 | 484,658,623 | ||||||
| South Korea - 3.4% |
||||||||
| Samsung Electronics Co., Ltd. - GDR, Reg S (Technology Hardware & Equipment)† |
468,218 | 483,190,030 | ||||||
| Spain - 1.6% |
||||||||
| Banco Bilbao Vizcaya Argentaria SA (Banks)† |
43,464,667 | 223,357,396 | ||||||
| Sweden - 8.9% |
||||||||
| Alfa Laval AB (Capital Goods)† |
8,315,645 | 204,454,793 | ||||||
| Atlas Copco AB, Class A (Capital Goods)† |
44,018,632 | 469,958,737 | ||||||
| Epiroc AB, Class A (Capital Goods)† |
12,775,126 | 195,334,190 | ||||||
| Skandinaviska Enskilda Banken AB, Class A (Banks)† |
35,185,419 | 370,899,764 | ||||||
| 1,240,647,484 | ||||||||
| Switzerland - 9.6% |
||||||||
| Alcon Inc. (Health Care Equipment & Services) |
3,631,000 | 220,329,080 | ||||||
| Lonza Group AG, Reg S (Pharmaceuticals, Biotechnology & Life Sciences)† |
582,342 | 299,375,343 | ||||||
| Nestle SA - Sponsored ADR (Food Beverage & Tobacco) |
1,862,384 | 202,459,765 | ||||||
| Roche Holding AG, Genusschein (Pharmaceuticals, Biotechnology & Life Sciences)† |
1,434,264 | 476,679,177 | ||||||
| Sonova Holding AG, Reg S (Health Care Equipment & Services)† |
630,459 | 148,888,370 | ||||||
| 1,347,731,735 | ||||||||
| Taiwan - 1.9% |
||||||||
| Taiwan Semiconductor Manufacturing Co., Ltd. - Sponsored ADR (Semiconductors & Semiconductor Equipment) |
4,309,577 | 265,254,464 | ||||||
| United Kingdom - 5.5% |
||||||||
| Rio Tinto plc (Materials) |
5,082,537 | 264,446,015 | ||||||
| Shell plc (Energy)† |
11,729,501 | 325,119,614 | ||||||
| Standard Chartered plc (Banks) |
31,034,382 | 185,140,379 | ||||||
| 774,706,008 | ||||||||
| Shares | Value | |||||||
| COMMON STOCKS - 96.5% (continued) |
| |||||||
| United States - 1.5% |
||||||||
| Linde plc (Materials)† |
682,895 | $204,309,549 | ||||||
| Total Common Stocks (Cost $12,020,419,614) |
|
$13,527,597,826 | ||||||
| SHORT TERM INVESTMENTS - 3.3% |
| |||||||
| Northern Institutional Funds - Treasury Portfolio (Premier Shares), 2.48% (Money Market Funds) |
469,312,346 | 469,312,346 | ||||||
| Total Short Term Investments (Cost $469,312,346) |
$469,312,346 | |||||||
| Total Investments — 99.8% |
||||||||
| (Cost $12,489,731,960) |
$13,996,910,172 | |||||||
| Other Assets Less Liabilities - 0.2% |
|
28,539,354 | ||||||
| Net Assets — 100.0% |
$14,025,449,526 | |||||||
Summary of Abbreviations
| ADR | American Depositary Receipt |
| GDR | Global Depositary Receipt |
| Reg S | Security sold outside United States without registration under the Securities Act of 1933. |
| * | Non-income producing security. |
| † | Investment categorized as level 2 security as disclosed in Note 2 of the Notes to Financial Statements. |
| ^ | Security exempt from registration pursuant to Rule 144A of the Securities Act of 1933. These securities, which represent 1.9% of net assets as of October 31, 2022, are considered liquid and may be resold in transactions exempt from registration, normally to qualified buyers. |
| ‡ | Investments categorized as level 3 security that is effectively valued at zero. See Note 2 of the Notes to the Financial Statements. |
| ^^ | Amount is less than 0.005%. |
See Notes to Financial Statements
8
Table of Contents
Harding, Loevner Funds, Inc.
International Equity Portfolio
Portfolio of Investments (continued)
October 31, 2022
| Industry | Percentage of Net Assets |
|||
| Banks |
13.1 | % | ||
| Capital Goods |
14.2 | |||
| Consumer Durables & Apparel |
3.5 | |||
| Diversified Financials |
0.9 | |||
| Energy |
2.8 | |||
| Food & Staples Retailing |
1.6 | |||
| Food Beverage & Tobacco |
4.9 | |||
| Health Care Equipment & Services |
3.7 | |||
| Household & Personal Products |
5.7 | |||
| Insurance |
7.1 | |||
| Materials |
9.6 | |||
| Media & Entertainment |
0.9 | |||
| Pharmaceuticals, Biotechnology & Life Sciences |
9.7 | |||
| Retailing |
0.9 | |||
| Semiconductors & Semiconductor Equipment |
4.4 | |||
| Software & Services |
4.6 | |||
| Technology Hardware & Equipment |
4.7 | |||
| Telecommunication Services |
1.7 | |||
| Transportation |
1.4 | |||
| Utilities |
1.1 | |||
| Money Market Fund |
3.3 | |||
| Total Investments |
99.8 | |||
| Other Assets Less Liabilities |
0.2 | |||
| Net Assets |
100.0 | % | ||
See Notes to Financial Statements
9
Table of Contents
Harding, Loevner Funds, Inc.
International Small Companies Portfolio
Portfolio of Investments
October 31, 2022
| Shares | Value | |||||||
| COMMON STOCKS - 96.0% |
||||||||
| Bangladesh - 1.2% |
||||||||
| Square Pharmaceuticals Ltd. (Pharmaceuticals, Biotechnology & Life Sciences)† |
2,738,283 | $5,671,136 | ||||||
| Brazil -1.9% |
||||||||
| Localiza Rent a Car SA (Transportation) |
678,800 | 9,269,684 | ||||||
| Canada - 2.1% |
||||||||
| Kinaxis Inc. (Software & Services)* |
93,600 | 9,990,367 | ||||||
| China - 3.9% |
||||||||
| Haitian International Holdings Ltd. (Capital Goods)† |
3,673,000 | 7,344,579 | ||||||
| Hefei Meiya Optoelectronic Technology Inc., Class A (Capital Goods)† |
1,504,681 | 4,876,975 | ||||||
| TravelSky Technology Ltd., Class H (Software & Services)† |
2,500,000 | 3,632,010 | ||||||
| Yantai China Pet Foods Co., Ltd., Class A (Food Beverage & Tobacco)† |
1,210,599 | 3,246,670 | ||||||
| 19,100,234 | ||||||||
| Denmark - 2.0% |
||||||||
| Chr Hansen Holding A/S (Materials)† |
143,289 | 7,947,294 | ||||||
| SimCorp A/S (Software & Services)† |
33,917 | 2,023,310 | ||||||
| 9,970,604 | ||||||||
| Egypt - 0.9% |
||||||||
| Edita Food Industries SAE (Food Beverage & Tobacco)† |
3,380,762 | 1,419,337 | ||||||
| Integrated Diagnostics Holdings plc (Health Care Equipment & Services)^† |
3,852,109 | 2,965,970 | ||||||
| 4,385,307 | ||||||||
| Finland - 1.7% |
||||||||
| Vaisala OYJ, Class A (Technology Hardware & Equipment) |
217,582 | 8,461,250 | ||||||
| France - 4.2% |
||||||||
| Alten SA (Software & Services)† |
85,402 | 9,970,787 | ||||||
| Rubis SCA (Utilities)† |
464,485 | 10,548,358 | ||||||
| 20,519,145 | ||||||||
| Germany - 8.6% |
||||||||
| Bechtle AG (Software & Services)† |
207,281 | 7,169,655 | ||||||
| Evotec SE (Pharmaceuticals, Biotechnology & Life Sciences)*† |
101,178 | 1,932,388 | ||||||
| FUCHS PETROLUB SE (Materials)† |
308,617 | 7,444,974 | ||||||
| Shares | Value | |||||||
| COMMON STOCKS - 96.0% (continued) |
| |||||||
| Germany - 8.6% (continued) |
||||||||
| KWS Saat SE & Co. KGaA (Food Beverage & Tobacco) |
104,600 | $6,078,212 | ||||||
| Pfeiffer Vacuum Technology AG (Capital Goods)† |
27,142 | 3,835,751 | ||||||
| Scout24 SE (Media & Entertainment)^† |
53,880 | 2,762,519 | ||||||
| STRATEC SE (Health Care Equipment & Services)† |
98,156 | 8,235,979 | ||||||
| TeamViewer AG (Software & Services)*^† |
445,123 | 4,281,942 | ||||||
| 41,741,420 | ||||||||
| Hong Kong - 0.3% |
||||||||
| ASMPT Ltd. (Semiconductors & Semiconductor Equipment)† |
302,700 | 1,660,089 | ||||||
| India - 2.1% |
||||||||
| Max Financial Services Ltd. (Insurance)*† |
778,660 | 6,666,695 | ||||||
| SH Kelkar & Co., Ltd. (Materials)^† |
2,295,720 | 3,799,447 | ||||||
| 10,466,142 | ||||||||
| Indonesia - 2.9% |
||||||||
| Prodia Widyahusada Tbk PT (Health Care Equipment & Services)† |
8,563,100 | 2,909,707 | ||||||
| Sarana Menara Nusantara Tbk PT (Telecommunication Services)† |
129,086,500 | 9,566,516 | ||||||
| Tower Bersama Infrastructure Tbk PT (Telecommunication Services)† |
9,192,500 | 1,449,950 | ||||||
| 13,926,173 | ||||||||
| Israel - 2.2% |
||||||||
| CyberArk Software Ltd. (Software & Services)* |
68,841 | 10,801,841 | ||||||
| Italy - 2.2% |
||||||||
| Reply SpA (Software & Services)† |
98,740 | 10,744,246 | ||||||
| Japan - 11.9% |
||||||||
| Ariake Japan Co., Ltd. (Food Beverage & Tobacco)† |
173,600 | 5,995,404 | ||||||
| BML Inc. (Health Care Equipment & Services)† |
144,000 | 3,256,858 | ||||||
| Cosmos Pharmaceutical Corp. (Food & Staples Retailing)† |
56,100 | 5,422,402 | ||||||
| Infomart Corp. (Software & Services)† |
1,825,700 | 5,896,231 | ||||||
| JCU Corp. (Materials)† |
264,800 | 4,992,535 | ||||||
| MISUMI Group Inc. (Capital Goods)† |
86,100 | 1,831,083 | ||||||
| Pigeon Corp. (Household & Personal Products)† |
264,200 | 3,458,843 | ||||||
| Rinnai Corp. (Consumer Durables & Apparel)† |
43,900 | 2,992,161 | ||||||
See Notes to Financial Statements
10
Table of Contents
Harding, Loevner Funds, Inc.
International Small Companies Portfolio
Portfolio of Investments (continued)
October 31, 2022
| Shares | Value | |||||||
| COMMON STOCKS - 96.0% (continued) |
| |||||||
| Japan - 11.9% (continued) |
||||||||
| Santen Pharmaceutical Co., Ltd. (Pharmaceuticals, Biotechnology & Life Sciences)† |
375,500 | $2,570,844 | ||||||
| SMS Co., Ltd. (Commercial & Professional Services)† |
359,900 | 8,270,369 | ||||||
| Solasto Corp. (Health Care Equipment & Services)† |
853,100 | 5,123,106 | ||||||
| Stanley Electric Co., Ltd. (Automobiles & Components)† |
489,900 | 8,322,280 | ||||||
| 58,132,116 | ||||||||
| Kuwait - 0.6% |
||||||||
| Mabanee Co. KPSC (Real Estate)† |
1,091,155 | 3,069,368 | ||||||
| Lithuania - 1.7% |
||||||||
| Siauliu Bankas AB (Banks)† |
14,203,478 | 8,032,870 | ||||||
| Malaysia - 1.8% |
||||||||
| Dialog Group Bhd. (Energy)† |
10,996,740 | 4,789,195 | ||||||
| TIME dotCom Bhd. (Telecommunication Services)† |
3,943,900 | 3,795,253 | ||||||
| 8,584,448 | ||||||||
| Mexico - 2.8% |
||||||||
| Grupo Herdez SAB de CV (Food Beverage & Tobacco) |
2,215,138 | 4,469,854 | ||||||
| Megacable Holdings SAB de CV (Media & Entertainment) |
4,416,700 | 9,275,672 | ||||||
| 13,745,526 | ||||||||
| Norway - 1.0% |
||||||||
| TOMRA Systems ASA (Commercial & Professional Services)† |
310,369 | 4,980,503 | ||||||
| Philippines - 0.4% |
||||||||
| Robinsons Retail Holdings Inc. (Food & Staples Retailing)† |
2,139,230 | 1,985,652 | ||||||
| Romania - 0.5% |
||||||||
| Societatea Nationala de Gaze Naturale ROMGAZ SA (Energy)† |
292,020 | 2,253,064 | ||||||
| Saudi Arabia - 1.1% |
||||||||
| Jarir Marketing Co. (Retailing)† |
124,304 | 5,421,828 | ||||||
| South Africa - 0.7% |
||||||||
| Clicks Group Ltd. (Food & Staples Retailing)† |
109,651 | 1,858,372 | ||||||
| Discovery Ltd. (Insurance)*† |
254,110 | 1,664,288 | ||||||
| 3,522,660 | ||||||||
| South Korea - 2.2% |
||||||||
| Cheil Worldwide Inc. (Media & Entertainment)† |
479,397 | 8,214,779 | ||||||
| Shares | Value | |||||||
| COMMON STOCKS - 96.0% (continued) |
| |||||||
| South Korea - 2.2% (continued) |
||||||||
| NCSoft Corp. (Media & Entertainment)† |
9,802 | $2,676,252 | ||||||
| 10,891,031 | ||||||||
| Spain - 1.9% |
||||||||
| Bankinter SA (Banks) |
796,566 | 4,814,554 | ||||||
| Linea Directa Aseguradora SA Cia de Seguros y Reaseguros (Insurance) |
4,664,625 | 4,372,410 | ||||||
| 9,186,964 | ||||||||
| Sweden - 2.7% |
||||||||
| Intrum AB (Commercial & Professional Services)† |
261,119 | 3,285,621 | ||||||
| Paradox Interactive AB (Media & Entertainment) |
465,848 | 8,041,755 | ||||||
| Thule Group AB (Consumer Durables & Apparel)^† |
82,594 | 1,625,637 | ||||||
| 12,953,013 | ||||||||
| Switzerland - 4.9% |
||||||||
| Bossard Holding AG, Class A, Reg S (Capital Goods)† |
35,571 | 7,048,761 | ||||||
| LEM Holding SA, Reg S (Technology Hardware & Equipment)† |
5,202 | 8,664,198 | ||||||
| Tecan Group AG, Reg S (Pharmaceuticals, Biotechnology & Life Sciences)† |
22,545 | 8,290,585 | ||||||
| 24,003,544 | ||||||||
| Taiwan - 1.7% |
||||||||
| Advantech Co., Ltd. (Technology Hardware & Equipment)† |
282,645 | 2,558,265 | ||||||
| Chipbond Technology Corp. (Semiconductors & Semiconductor Equipment)† |
1,933,700 | 3,256,472 | ||||||
| Eclat Textile Co., Ltd. (Consumer Durables & Apparel)† |
186,909 | 2,451,143 | ||||||
| 8,265,880 | ||||||||
| United Kingdom - 20.0% |
||||||||
| Abcam plc (Pharmaceuticals, Biotechnology & Life Sciences)*† |
679,169 | 10,521,497 | ||||||
| Airtel Africa plc (Telecommunication Services)^† |
2,388,338 | 3,097,705 | ||||||
| Baltic Classifieds Group plc (Media & Entertainment)† |
2,091,752 | 3,338,752 | ||||||
| Bank of Georgia Group plc (Banks) |
419,008 | 10,211,016 | ||||||
| Clarkson plc (Transportation) |
180,094 | 5,710,604 | ||||||
| Cranswick plc (Food Beverage & Tobacco) |
209,618 | 7,149,197 | ||||||
See Notes to Financial Statements
11
Table of Contents
Harding, Loevner Funds, Inc.
International Small Companies Portfolio
Portfolio of Investments (continued)
October 31, 2022
| Shares | Value | |||||||
| COMMON STOCKS - 96.0% (continued) |
| |||||||
| United Kingdom - 20.0% (continued) |
||||||||
| Dechra Pharmaceuticals plc (Pharmaceuticals, Biotechnology & Life Sciences)† |
256,992 | $7,719,283 | ||||||
| Diploma plc (Capital Goods)† |
328,151 | 9,347,190 | ||||||
| Grafton Group plc (Capital Goods) |
664,891 | 5,261,230 | ||||||
| Keywords Studios plc (Software & Services)† |
352,783 | 9,732,878 | ||||||
| Network International Holdings plc (Software & Services)*^† |
1,692,178 | 6,317,342 | ||||||
| Rathbones Group plc (Diversified Financials)† |
118,614 | 2,548,018 | ||||||
| Rightmove plc (Media & Entertainment)† |
269,486 | 1,518,149 | ||||||
| Senior plc (Capital Goods)† |
6,991,831 | 10,395,287 | ||||||
| YouGov plc (Media & Entertainment)† |
488,172 | 4,924,534 | ||||||
| 97,792,682 | ||||||||
| United States - 2.1% |
||||||||
| Core Laboratories NV (Energy) |
123,222 | 2,397,900 | ||||||
| Globant SA (Software & Services)* |
26,873 | 5,070,397 | ||||||
| Sensata Technologies Holding plc (Capital Goods) |
72,527 | 2,916,311 | ||||||
| 10,384,608 | ||||||||
| Vietnam - 1.8% |
||||||||
| Hoa Phat Group JSC (Materials)† |
13,895,954 | 8,730,792 | ||||||
| Total Common Stocks (Cost $486,706,668) |
|
$468,644,187 | ||||||
| SHORT TERM INVESTMENTS - 3.1% |
||||||||
| Northern Institutional Funds - Treasury Portfolio (Premier Shares), 2.48% (Money Market Funds) |
15,013,108 | 15,013,108 | ||||||
| Total Short Term Investments (Cost $15,013,108) |
|
$15,013,108 | ||||||
| Total Investments — 99.1% |
||||||||
| (Cost $501,719,776) |
$483,657,295 | |||||||
| Other Assets Less Liabilities - 0.9% |
4,327,820 | |||||||
| Net Assets — 100.0% |
$487,985,115 | |||||||
Summary of Abbreviations
| Reg S | Security sold outside United States without registration under the Securities Act of 1933. |
| † | Investment categorized as level 2 security as disclosed in Note 2 of the Notes to Financial Statements. |
| * | Non-income producing security. |
| ^ | Security exempt from registration pursuant to Rule 144A of the Securities Act of 1933. These securities, which represent 5.1% of net assets as of October 31, 2022, are considered liquid and may be resold in transactions exempt from registration, normally to qualified buyers. |
| Industry | Percentage of Net Assets |
|||
| Automobiles & Components |
1.7 | % | ||
| Banks |
4.8 | |||
| Capital Goods |
10.8 | |||
| Commercial & Professional Services |
3.4 | |||
| Consumer Durables & Apparel |
1.4 | |||
| Diversified Financials |
0.5 | |||
| Energy |
2.0 | |||
| Food & Staples Retailing |
1.9 | |||
| Food Beverage & Tobacco |
5.8 | |||
| Health Care Equipment & Services |
4.7 | |||
| Household & Personal Products |
0.7 | |||
| Insurance |
2.5 | |||
| Materials |
6.7 | |||
| Media & Entertainment |
8.4 | |||
| Pharmaceuticals, Biotechnology & Life Sciences |
7.5 | |||
| Real Estate |
0.6 | |||
| Retailing |
1.1 | |||
| Semiconductors & Semiconductor Equipment |
1.0 | |||
| Software & Services |
17.5 | |||
| Technology Hardware & Equipment |
4.0 | |||
| Telecommunication Services |
3.7 | |||
| Transportation |
3.1 | |||
| Utilities |
2.2 | |||
| Money Market Fund |
3.1 | |||
| Total Investments |
99.1 | |||
| Other Assets Less Liabilities |
0.9 | |||
| Net Assets |
100.0 | % | ||
See Notes to Financial Statements
12
Table of Contents
Harding, Loevner Funds, Inc.
Institutional Emerging Markets Portfolio
Portfolio of Investments
October 31, 2022
| Shares | Value | |||||||
| COMMON STOCKS - 94.9% |
||||||||
| Brazil - 8.2% |
||||||||
| B3 SA - Brasil Bolsa Balcao (Diversified Financials) |
8,220,500 | $23,935,015 | ||||||
| Localiza Rent a Car SA (Transportation) |
4,733,970 | 64,647,032 | ||||||
| Lojas Renner SA (Retailing)* |
6,634,670 | 39,688,569 | ||||||
| Magazine Luiza SA (Retailing)* |
34,316,200 | 29,695,754 | ||||||
| WEG SA (Capital Goods) |
4,891,292 | 38,141,756 | ||||||
| XP Inc., Class A (Diversified Financials)* |
1,184,661 | 21,714,836 | ||||||
| 217,822,962 | ||||||||
| China - 22.0% |
||||||||
| Alibaba Group Holding Ltd. (Retailing)*† |
4,429,116 | 35,262,285 | ||||||
| Alibaba Group Holding Ltd. - Sponsored ADR (Retailing)* |
105,667 | 6,718,308 | ||||||
| Baidu Inc., Class A (Media & Entertainment)*† |
888,358 | 8,524,053 | ||||||
| China Tourism Group Duty Free Corp., Ltd., Class A (Retailing)† |
1,589,500 | 34,691,786 | ||||||
| Contemporary Amperex Technology Co., Ltd., Class A (Capital Goods)† |
550,000 | 27,903,281 | ||||||
| Country Garden Services Holdings Co., Ltd. (Real Estate)† |
4,015,504 | 3,511,429 | ||||||
| CSPC Pharmaceutical Group Ltd. (Pharmaceuticals, Biotechnology & Life Sciences)† |
29,594,080 | 30,435,991 | ||||||
| ENN Energy Holdings Ltd. (Utilities)† |
2,585,317 | 25,645,061 | ||||||
| Fuyao Glass Industry Group Co., Ltd., Class H (Automobiles & Components)^† |
3,879,800 | 13,889,408 | ||||||
| Hefei Meiya Optoelectronic Technology Inc., Class A (Capital Goods)† |
7,176,550 | 23,260,650 | ||||||
| JD.com Inc., Class A (Retailing)† |
1,105,638 | 20,645,459 | ||||||
| Li Ning Co., Ltd. (Consumer Durables & Apparel)† |
4,310,500 | 22,307,967 | ||||||
| LONGi Green Energy Technology Co., Ltd., Class A (Semiconductors & Semiconductor Equipment)† |
5,226,109 | 34,197,694 | ||||||
| Midea Group Co., Ltd., Class A (Consumer Durables & Apparel)† |
5,219,064 | 28,557,633 | ||||||
| Ping An Insurance Group Co. of China Ltd., Class H (Insurance)† |
6,006,000 | 24,034,873 | ||||||
| Shenzhen Inovance Technology Co., Ltd., Class A (Capital Goods)† |
2,455,000 | 22,325,439 | ||||||
| Shares | Value | |||||||
| COMMON STOCKS - 94.9% (continued) |
| |||||||
| China - 22.0% (continued) |
||||||||
| Shenzhou International Group Holdings Ltd. (Consumer Durables & Apparel)† |
2,764,000 | $19,077,045 | ||||||
| Sunny Optical Technology Group Co., Ltd. (Technology Hardware & Equipment)† |
2,087,300 | 18,107,205 | ||||||
| Tencent Holdings Ltd. (Media & Entertainment)† |
2,172,100 | 56,995,390 | ||||||
| Trip.com Group Ltd. (Consumer Services)*† |
553,800 | 12,539,189 | ||||||
| WuXi AppTec Co., Ltd., Class A (Pharmaceuticals, Biotechnology & Life Sciences)† |
1,582,700 | 16,490,425 | ||||||
| WuXi AppTec Co., Ltd., Class H (Pharmaceuticals, Biotechnology & Life Sciences)^† |
3,078,200 | 24,699,458 | ||||||
| Wuxi Biologics Cayman Inc. (Pharmaceuticals, Biotechnology & Life Sciences)*^† |
3,580,500 | 16,198,200 | ||||||
| Zhejiang Sanhua Intelligent Controls Co., Ltd., Class A (Capital Goods)† |
12,954,236 | 37,463,488 | ||||||
| ZTO Express Cayman Inc. - ADR (Transportation) |
1,312,169 | 22,162,534 | ||||||
| 585,644,251 | ||||||||
| Czech Republic - 0.7% |
||||||||
| Komercni banka AS (Banks)† |
625,412 | 17,924,086 | ||||||
| Egypt - 0.6% |
||||||||
| Commercial International Bank Egypt SAE - GDR, Reg S (Banks) |
13,120,403 | 16,662,912 | ||||||
| Hong Kong - 4.5% |
||||||||
| AIA Group Ltd. (Insurance)† |
7,838,815 | 59,196,367 | ||||||
| ASMPT Ltd. (Semiconductors & Semiconductor Equipment)† |
1,770,969 | 9,712,477 | ||||||
| Techtronic Industries Co., Ltd. (Capital Goods)† |
5,524,301 | 52,110,948 | ||||||
| 121,019,792 | ||||||||
| India - 14.5% |
||||||||
| Asian Paints Ltd. (Materials)† |
728,911 | 27,408,030 | ||||||
| HDFC Bank Ltd. - ADR (Banks) |
1,255,481 | 78,229,021 | ||||||
| Housing Development Finance Corp., Ltd. (Diversified Financials)† |
1,986,641 | 59,227,688 | ||||||
| Kotak Mahindra Bank Ltd. (Banks)† |
2,512,648 | 57,792,575 | ||||||
| Maruti Suzuki India Ltd. (Automobiles & Components)† |
510,431 | 58,792,939 | ||||||
| Tata Consultancy Services Ltd. (Software & Services)† |
2,709,851 | 104,446,209 | ||||||
| 385,896,462 | ||||||||
See Notes to Financial Statements
13
Table of Contents
Harding, Loevner Funds, Inc.
Institutional Emerging Markets Portfolio
Portfolio of Investments (continued)
October 31, 2022
| Shares | Value | |||||||
| COMMON STOCKS - 94.9% (continued) |
| |||||||
| Indonesia - 5.0% |
||||||||
| Astra International Tbk PT (Automobiles & Components)† |
101,614,000 | $43,231,495 | ||||||
| Bank Central Asia Tbk PT (Banks)† |
88,702,765 | 49,982,920 | ||||||
| Bank Rakyat Indonesia Persero Tbk PT (Banks)† |
137,621,300 | 40,954,171 | ||||||
| 134,168,586 | ||||||||
| Italy - 1.9% |
||||||||
| Tenaris SA - ADR (Energy) |
1,642,339 | 51,602,291 | ||||||
| Kenya - 1.0% |
||||||||
| Safaricom plc (Telecommunication Services)† |
127,676,727 | 26,415,141 | ||||||
| Mexico - 7.2% |
||||||||
| Fomento Economico Mexicano SAB de CV - Sponsored ADR (Food Beverage & Tobacco) |
471,327 | 33,756,440 | ||||||
| Grupo Aeroportuario del Sureste SAB de CV - ADR (Transportation) |
72,024 | 16,811,842 | ||||||
| Grupo Financiero Banorte SAB de CV, Series O (Banks) |
8,337,300 | 67,769,756 | ||||||
| Wal-Mart de Mexico SAB de CV (Food & Staples Retailing) |
19,082,400 | 73,707,973 | ||||||
| 192,046,011 | ||||||||
| Panama - 0.7% |
||||||||
| Copa Holdings SA, Class A (Transportation)* |
236,788 | 17,813,561 | ||||||
| Poland - 0.4% |
||||||||
| CD Projekt SA (Media & Entertainment)† |
371,522 | 9,878,530 | ||||||
| Russia - 0.0%^^ |
||||||||
| LUKOIL PJSC (Energy)‡ |
1,601,095 | — | ||||||
| Novatek PJSC - Sponsored GDR, Reg S (Energy)*‡ |
602,214 | — | ||||||
| Sberbank of Russia PJSC (Banks)*‡ |
880,800 | — | ||||||
| Sberbank of Russia PJSC (Banks)*‡ |
35,707,448 | — | ||||||
| Yandex NV, Class A (Media & Entertainment)*‡ |
1,693,430 | — | ||||||
| — | ||||||||
| South Africa - 1.8% |
||||||||
| Discovery Ltd. (Insurance)*† |
2,309,102 | 15,123,412 | ||||||
| Standard Bank Group Ltd. (Banks)† |
3,511,268 | 32,837,678 | ||||||
| 47,961,090 | ||||||||
| South Korea - 8.1% |
||||||||
| Coway Co., Ltd. (Consumer Durables & Apparel)† |
411,910 | 15,942,669 | ||||||
| Shares | Value | |||||||
| COMMON STOCKS - 94.9% (continued) |
| |||||||
| South Korea - 8.1% (continued) |
||||||||
| LG H&H Co., Ltd. (Household & Personal Products)† |
85,995 | $30,709,483 | ||||||
| NAVER Corp. (Media & Entertainment)† |
231,408 | 27,432,658 | ||||||
| NCSoft Corp. (Media & Entertainment)† |
65,440 | 17,867,163 | ||||||
| Samsung Electronics Co., Ltd. - GDR, Reg S (Technology Hardware & Equipment)† |
119,157 | 122,967,238 | ||||||
| 214,919,211 | ||||||||
| Taiwan - 10.2% |
||||||||
| Airtac International Group (Capital Goods)† |
2,306,633 | 52,981,357 | ||||||
| ASPEED Technology Inc. (Semiconductors & Semiconductor Equipment)† |
318,018 | 16,442,077 | ||||||
| Eclat Textile Co., Ltd. (Consumer Durables & Apparel)† |
3,550,031 | 46,555,446 | ||||||
| Hon Hai Precision Industry Co., Ltd. (Technology Hardware & Equipment)† |
6,126,545 | 19,442,317 | ||||||
| Silergy Corp. (Semiconductors & Semiconductor Equipment)† |
1,888,488 | 21,719,874 | ||||||
| Taiwan Semiconductor Manufacturing Co., Ltd. (Semiconductors & Semiconductor Equipment)† |
9,523,277 | 114,604,074 | ||||||
| 271,745,145 | ||||||||
| Thailand - 0.6% |
||||||||
| SCB X pcl, Reg S (Banks)† |
5,380,870 | 14,986,133 | ||||||
| United Arab Emirates - 1.6% |
||||||||
| Emaar Properties PJSC (Real Estate)† |
26,453,506 | 43,679,818 | ||||||
| United Kingdom - 3.5% |
||||||||
| Bank of Georgia Group plc (Banks) |
452,940 | 11,037,922 | ||||||
| Coca-Cola HBC AG - CDI (Food Beverage & Tobacco)*† |
2,212,589 | 48,245,161 | ||||||
| Network International Holdings plc (Software & Services)*^† |
9,253,994 | 34,547,575 | ||||||
| 93,830,658 | ||||||||
| United States - 2.4% |
||||||||
| EPAM Systems Inc. (Software & Services)* |
186,443 | 65,255,050 | ||||||
| Total Common Stocks (Cost $2,572,241,938) |
|
$2,529,271,690 | ||||||
| PREFERRED STOCKS - 3.5% |
||||||||
| Brazil - 2.6% |
||||||||
| Banco Bradesco SA - ADR, 0.92% (Banks)+ |
4,265,873 | 16,167,659 | ||||||
See Notes to Financial Statements
14
Table of Contents
Harding, Loevner Funds, Inc.
Institutional Emerging Markets Portfolio
Portfolio of Investments (continued)
October 31, 2022
| Shares | Value | |||||||
| PREFERRED STOCKS - 3.5% (continued) |
| |||||||
| Brazil - 2.6% (continued) |
||||||||
| Itau Unibanco Holding SA - Sponsored ADR (Banks)* |
9,295,666 | $54,100,776 | ||||||
| 70,268,435 | ||||||||
| Colombia - 0.6% |
||||||||
| Bancolombia SA - Sponsored ADR, 9.79% (Banks)+ |
578,199 | 14,668,908 | ||||||
| South Korea - 0.3% |
||||||||
| Samsung Electronics Co., Ltd. - GDR, |
9,394 | 8,792,784 | ||||||
| Total Preferred Stocks (Cost $64,604,108) |
|
$93,730,127 | ||||||
| SHORT TERM INVESTMENTS - 1.8% |
| |||||||
| Northern Institutional Funds - Treasury Portfolio (Premier Shares), 2.48% (Money Market Funds) |
47,286,911 | 47,286,911 | ||||||
| Total Short Term Investments (Cost $47,286,911) |
|
$47,286,911 | ||||||
| Total Investments — 100.2% |
||||||||
| (Cost $2,684,132,957) |
$2,670,288,728 | |||||||
| Liabilities Less Other Assets - (0.2)% |
(5,875,902 | ) | ||||||
| Net Assets — 100.0% |
$2,664,412,826 | |||||||
Summary of Abbreviations
| ADR | American Depositary Receipt |
| CDI | Chess Depositary Interest |
| GDR | Global Depositary Receipt |
| Reg S | Security sold outside United States without registration under the Securities Act of 1933. |
| * | Non-income producing security. |
| † | Investment categorized as level 2 security as disclosed in Note 2 of the Notes to Financial Statements. |
| ^ | Security exempt from registration pursuant to Rule 144A of the Securities Act of 1933. These securities, which represent 3.4% of net assets as of October 31, 2022, are considered liquid and may be resold in transactions exempt from registration, normally to qualified buyers. |
| ‡ | Investments categorized as level 3 security that is effectively valued at zero. See Note 2 of the Notes to the Financial Statements. |
| + | Current yield is disclosed. Dividends are calculated based on a percentage of the issuer’s net income. |
| ^^ | Amount is less than 0.005%. |
See Notes to Financial Statements
15
Table of Contents
Harding, Loevner Funds, Inc.
Institutional Emerging Markets Portfolio
Portfolio of Investments (continued)
October 31, 2022
| Industry | Percentage of Net Assets |
|||
| Automobiles & Components |
4.3 | % | ||
| Banks |
17.8 | |||
| Capital Goods |
9.6 | |||
| Consumer Durables & Apparel |
5.0 | |||
| Consumer Services |
0.5 | |||
| Diversified Financials |
3.9 | |||
| Energy |
1.9 | |||
| Food & Staples Retailing |
2.8 | |||
| Food Beverage & Tobacco |
3.1 | |||
| Household & Personal Products |
1.2 | |||
| Insurance |
3.7 | |||
| Materials |
1.0 | |||
| Media & Entertainment |
4.5 | |||
| Pharmaceuticals, Biotechnology & Life Sciences |
3.3 | |||
| Real Estate |
1.7 | |||
| Retailing |
6.3 | |||
| Semiconductors & Semiconductor Equipment |
7.4 | |||
| Software & Services |
7.6 | |||
| Technology Hardware & Equipment |
6.3 | |||
| Telecommunication Services |
1.0 | |||
| Transportation |
4.5 | |||
| Utilities |
1.0 | |||
| Money Market Fund |
1.8 | |||
| Total Investments |
100.2 | |||
| Liabilities Less Other Assets |
(0.2 | ) | ||
| Net Assets |
100.0 | % | ||
See Notes to Financial Statements
16
Table of Contents
Harding, Loevner Funds, Inc.
Portfolio of Investments
October 31, 2022
| Shares | Value | |||||||
| COMMON STOCKS - 94.9% |
||||||||
| Brazil - 8.2% |
||||||||
| B3 SA - Brasil Bolsa Balcao (Diversified Financials) |
4,312,209 | $12,555,536 | ||||||
| Localiza Rent a Car SA (Transportation) |
2,483,290 | 33,911,776 | ||||||
| Lojas Renner SA (Retailing)* |
3,480,288 | 20,819,069 | ||||||
| Magazine Luiza SA (Retailing)* |
18,000,968 | 15,577,258 | ||||||
| WEG SA (Capital Goods) |
2,565,748 | 20,007,420 | ||||||
| XP Inc., Class A (Diversified Financials)* |
621,426 | 11,390,739 | ||||||
| 114,261,798 | ||||||||
| China - 22.0% |
||||||||
| Alibaba Group Holding Ltd. (Retailing)*† |
2,323,300 | 18,496,889 | ||||||
| Alibaba Group Holding Ltd. - Sponsored ADR (Retailing)* |
55,429 | 3,524,176 | ||||||
| Baidu Inc., Class A (Media & Entertainment)*† |
466,014 | 4,471,539 | ||||||
| China Tourism Group Duty Free Corp., Ltd., Class A (Retailing)† |
833,807 | 18,198,335 | ||||||
| Contemporary Amperex Technology Co., Ltd., Class A (Capital Goods)† |
288,500 | 14,636,539 | ||||||
| Country Garden Services Holdings Co., Ltd. (Real Estate)† |
2,106,930 | 1,842,443 | ||||||
| CSPC Pharmaceutical Group Ltd. (Pharmaceuticals, Biotechnology & Life Sciences)† |
15,524,680 | 15,966,336 | ||||||
| ENN Energy Holdings Ltd. (Utilities)† |
1,356,113 | 13,451,968 | ||||||
| Fuyao Glass Industry Group Co., Ltd., Class H (Automobiles & Components)^† |
2,035,096 | 7,285,499 | ||||||
| Hefei Meiya Optoelectronic Technology Inc., Class A (Capital Goods)† |
3,764,534 | 12,201,616 | ||||||
| JD.com Inc., Class A (Retailing)† |
579,964 | 10,829,605 | ||||||
| Li Ning Co., Ltd. (Consumer Durables & Apparel)† |
2,261,000 | 11,701,267 | ||||||
| LONGi Green Energy Technology Co., Ltd., Class A (Semiconductors & Semiconductor Equipment)† |
2,741,400 | 17,938,692 | ||||||
| Midea Group Co., Ltd., Class A (Consumer Durables & Apparel)† |
2,737,715 | 14,980,207 | ||||||
| Ping An Insurance Group Co. of China Ltd., Class H (Insurance)† |
3,150,500 | 12,607,704 | ||||||
| Shenzhen Inovance Technology Co., Ltd., Class A (Capital Goods)† |
1,287,800 | 11,711,080 | ||||||
| Shares | Value | |||||||
| COMMON STOCKS - 94.9% (continued) |
| |||||||
| China - 22.0% (continued) |
||||||||
| Shenzhou International Group Holdings Ltd. (Consumer Durables & Apparel)† |
1,449,710 | $10,005,855 | ||||||
| Sunny Optical Technology Group Co., Ltd. (Technology Hardware & Equipment)† |
1,094,944 | 9,498,575 | ||||||
| Tencent Holdings Ltd. (Media & Entertainment)† |
1,139,400 | 29,897,586 | ||||||
| Trip.com Group Ltd. (Consumer Services)*† |
290,500 | 6,577,527 | ||||||
| WuXi AppTec Co., Ltd., Class A (Pharmaceuticals, Biotechnology & Life Sciences)† |
830,200 | 8,649,997 | ||||||
| WuXi AppTec Co., Ltd., Class H (Pharmaceuticals, Biotechnology & Life Sciences)^† |
1,614,700 | 12,956,343 | ||||||
| Wuxi Biologics Cayman Inc. (Pharmaceuticals, Biotechnology & Life Sciences)*^† |
1,878,250 | 8,497,213 | ||||||
| Zhejiang Sanhua Intelligent Controls Co., Ltd., Class A (Capital Goods)† |
6,795,299 | 19,651,919 | ||||||
| ZTO Express Cayman Inc. - ADR (Transportation) |
688,311 | 11,625,573 | ||||||
| 307,204,483 | ||||||||
| Czech Republic - 0.7% |
||||||||
| Komercni banka AS (Banks)† |
328,066 | 9,402,255 | ||||||
| Egypt - 0.6% |
||||||||
| Commercial International Bank Egypt SAE - GDR, Reg S (Banks) |
6,882,441 | 8,740,700 | ||||||
| Hong Kong - 4.5% |
||||||||
| AIA Group Ltd. (Insurance)† |
4,111,871 | 31,051,610 | ||||||
| ASMPT Ltd. (Semiconductors & Semiconductor Equipment)† |
928,945 | 5,094,588 | ||||||
| Techtronic Industries Co., Ltd. (Capital Goods)† |
2,897,860 | 27,335,627 | ||||||
| 63,481,825 | ||||||||
| India - 14.5% |
||||||||
| Asian Paints Ltd. (Materials)† |
382,358 | 14,377,173 | ||||||
| HDFC Bank Ltd. - ADR (Banks) |
658,575 | 41,035,808 | ||||||
| Housing Development Finance Corp., Ltd. (Diversified Financials)† |
1,042,112 | 31,068,464 | ||||||
| Kotak Mahindra Bank Ltd. (Banks)† |
1,318,035 | 30,315,681 | ||||||
| Maruti Suzuki India Ltd. (Automobiles & Components)† |
267,752 | 30,840,461 | ||||||
| Tata Consultancy Services Ltd. (Software & Services)† |
1,421,480 | 54,788,325 | ||||||
| 202,425,912 | ||||||||
See Notes to Financial Statements
17
Table of Contents
Harding, Loevner Funds, Inc.
Emerging Markets Portfolio
Portfolio of Investments (continued)
October 31, 2022
| Shares | Value | |||||||
| COMMON STOCKS - 94.9% (continued) |
| |||||||
| Indonesia - 5.0% |
||||||||
| Astra International Tbk PT (Automobiles & Components)† |
53,302,607 | $22,677,499 | ||||||
| Bank Central Asia Tbk PT (Banks)† |
46,529,964 | 26,219,064 | ||||||
| Bank Rakyat Indonesia Persero Tbk PT (Banks)† |
72,190,636 | 21,482,922 | ||||||
| 70,379,485 | ||||||||
| Italy - 1.9% |
||||||||
| Tenaris SA - ADR (Energy) |
861,505 | 27,068,487 | ||||||
| Kenya - 1.0% |
||||||||
| Safaricom plc (Telecommunication Services)† |
66,974,073 | 13,856,320 | ||||||
| Mexico - 7.2% |
||||||||
| Fomento Economico Mexicano SAB de CV - Sponsored ADR (Food Beverage & Tobacco) |
247,240 | 17,707,329 | ||||||
| Grupo Aeroportuario del Sureste SAB de CV - ADR (Transportation) |
37,781 | 8,818,841 | ||||||
| Grupo Financiero Banorte SAB de CV, Series O (Banks) |
4,373,374 | 35,548,977 | ||||||
| Wal-Mart de Mexico SAB de CV (Food & Staples Retailing) |
10,009,915 | 38,664,452 | ||||||
| 100,739,599 | ||||||||
| Panama - 0.7% |
||||||||
| Copa Holdings SA, Class A (Transportation)* |
124,209 | 9,344,243 | ||||||
| Poland - 0.4% |
||||||||
| CD Projekt SA (Media & Entertainment)† |
194,885 | 5,181,866 | ||||||
| Russia - 0.0%^^ |
||||||||
| LUKOIL PJSC (Energy)‡ |
910,483 | — | ||||||
| Novatek PJSC - Sponsored GDR, Reg S (Energy)*‡ |
342,744 | — | ||||||
| Sberbank of Russia PJSC (Banks)*‡ |
20,812,636 | — | ||||||
| Yandex NV, Class A (Media & Entertainment)*‡ |
968,763 | — | ||||||
| — | ||||||||
| South Africa - 1.8% |
||||||||
| Discovery Ltd. (Insurance)*† |
1,211,263 | 7,933,140 | ||||||
| Standard Bank Group Ltd. (Banks)† |
1,841,871 | 17,225,335 | ||||||
| 25,158,475 | ||||||||
| South Korea - 8.1% |
||||||||
| Coway Co., Ltd. (Consumer Durables & Apparel)† |
216,071 | 8,362,867 | ||||||
| LG H&H Co., Ltd. (Household & Personal Products)† |
45,110 | 16,109,131 | ||||||
| Shares | Value | |||||||
| COMMON STOCKS - 94.9% (continued) |
| |||||||
| South Korea - 8.1% (continued) |
||||||||
| NAVER Corp. (Media & Entertainment)† |
121,387 | $14,390,030 | ||||||
| NCSoft Corp. (Media & Entertainment)† |
34,327 | 9,372,342 | ||||||
| Samsung Electronics Co., Ltd. - GDR, Reg S (Technology Hardware & Equipment)† |
62,505 | 64,503,699 | ||||||
| 112,738,069 | ||||||||
| Taiwan - 10.2% |
||||||||
| Airtac International Group (Capital Goods)† |
1,209,823 | 27,788,584 | ||||||
| ASPEED Technology Inc. (Semiconductors & Semiconductor Equipment)† |
167,109 | 8,639,822 | ||||||
| Eclat Textile Co., Ltd. (Consumer Durables & Apparel)† |
1,861,846 | 24,416,427 | ||||||
| Hon Hai Precision Industry Co., Ltd. (Technology Hardware & Equipment)† |
3,213,146 | 10,196,775 | ||||||
| Silergy Corp. (Semiconductors & Semiconductor Equipment)† |
990,200 | 11,388,486 | ||||||
| Taiwan Semiconductor Manufacturing Co., Ltd. (Semiconductors & Semiconductor Equipment)† |
4,995,147 | 60,112,102 | ||||||
| 142,542,196 | ||||||||
| Thailand - 0.6% |
||||||||
| SCB X pcl, Reg S (Banks)† |
2,822,591 | 7,861,131 | ||||||
| United Arab Emirates - 1.6% |
||||||||
| Emaar Properties PJSC (Real Estate)† |
13,876,455 | 22,912,692 | ||||||
| United Kingdom - 3.5% |
||||||||
| Bank of Georgia Group plc (Banks) |
237,594 | 5,790,047 | ||||||
| Coca-Cola HBC AG - CDI (Food Beverage & Tobacco)*† |
1,160,636 | 25,307,489 | ||||||
| Network International Holdings plc (Software & Services)*^† |
4,854,276 | 18,122,279 | ||||||
| 49,219,815 | ||||||||
| United States - 2.4% |
||||||||
| EPAM Systems Inc. (Software & Services)* |
97,801 | 34,230,350 | ||||||
| Total Common Stocks (Cost $1,199,707,799) |
|
$1,326,749,701 | ||||||
| PREFERRED STOCKS - 3.5% |
||||||||
| Brazil - 2.6% |
||||||||
| Banco Bradesco SA - ADR, 0.92% (Banks)+ |
2,237,707 | 8,480,910 | ||||||
| Itau Unibanco Holding SA - Sponsored ADR (Banks)* |
4,876,136 | 28,379,111 | ||||||
| 36,860,021 | ||||||||
See Notes to Financial Statements
18
Table of Contents
Harding, Loevner Funds, Inc.
Emerging Markets Portfolio
Portfolio of Investments (continued)
October 31, 2022
| Shares | Value | |||||||
| PREFERRED STOCKS - 3.5% (continued) |
| |||||||
| Colombia - 0.6% |
||||||||
| Bancolombia SA - Sponsored ADR, 9.79% (Banks)+ |
303,300 | $7,694,721 | ||||||
| South Korea - 0.3% |
||||||||
| Samsung Electronics Co., Ltd. - GDR, |
4,928 | 4,612,608 | ||||||
| Total Preferred Stocks (Cost $32,373,130) |
$49,167,350 | |||||||
| SHORT TERM INVESTMENTS - 1.7% |
|
|||||||
| Northern Institutional Funds - Treasury Portfolio (Premier Shares), 2.48% (Money Market Funds) |
23,869,801 | 23,869,801 | ||||||
| Total Short Term Investments (Cost $23,869,801) |
|
$23,869,801 | ||||||
| Total Investments — 100.1% |
||||||||
| (Cost $1,255,950,730) |
$1,399,786,852 | |||||||
| Liabilities Less Other Assets - (0.1)% |
(2,025,837 | ) | ||||||
| Net Assets — 100.0% |
$1,397,761,015 | |||||||
Summary of Abbreviations
| ADR | American Depositary Receipt |
| CDI | Chess Depositary Interest |
| GDR | Global Depositary Receipt |
| Reg S | Security sold outside United States without registration under the Securities Act of 1933. |
| * | Non-income producing security. |
| † | Investment categorized as level 2 security as disclosed in Note 2 of the Notes to Financial Statements. |
| ^ | Security exempt from registration pursuant to Rule 144A of the Securities Act of 1933. These securities, which represent 3.4% of net assets as of October 31, 2022, are considered liquid and may be resold in transactions exempt from registration, normally to qualified buyers. |
| ‡ | Investments categorized as level 3 security that is effectively valued at zero. See Note 2 of the Notes to the Financial Statements. |
| + | Current yield is disclosed. Dividends are calculated based on a percentage of the issuer’s net income. |
| ^^ | Amount is less than 0.005%. |
| Industry | Percentage of Net Assets |
|||
| Automobiles & Components |
4.3 | % | ||
| Banks |
17.8 | |||
| Capital Goods |
9.6 | |||
| Consumer Durables & Apparel |
5.0 | |||
| Consumer Services |
0.5 | |||
| Diversified Financials |
3.9 | |||
| Energy |
1.9 | |||
| Food & Staples Retailing |
2.8 | |||
| Food Beverage & Tobacco |
3.1 | |||
| Household & Personal Products |
1.2 | |||
| Insurance |
3.7 | |||
| Materials |
1.0 | |||
| Media & Entertainment |
4.5 | |||
| Pharmaceuticals, Biotechnology & Life Sciences |
3.3 | |||
| Real Estate |
1.7 | |||
| Retailing |
6.3 | |||
| Semiconductors & Semiconductor Equipment |
7.4 | |||
| Software & Services |
7.6 | |||
| Technology Hardware & Equipment |
6.3 | |||
| Telecommunication Services |
1.0 | |||
| Transportation |
4.5 | |||
| Utilities |
1.0 | |||
| Money Market Fund |
1.7 | |||
| Total Investments |
100.1 | |||
| Liabilities Less Other Assets |
(0.1 | ) | ||
| Net Assets |
100.0 | % | ||
See Notes to Financial Statements
19
Table of Contents
Harding, Loevner Funds, Inc.
Frontier Emerging Markets Portfolio
Portfolio of Investments
October 31, 2022
| Shares | Value | |||||||
| COMMON STOCKS - 93.8% |
||||||||
| Bangladesh - 2.4% |
||||||||
| GrameenPhone Ltd. (Telecommunication Services)† |
147,326 | $416,813 | ||||||
| Square Pharmaceuticals Ltd. (Pharmaceuticals, Biotechnology & Life Sciences)† |
1,831,842 | 3,793,846 | ||||||
| 4,210,659 | ||||||||
| Colombia - 0.3% |
||||||||
| Cementos Argos SA - Sponsored ADR (Materials)#† |
137,381 | 463,152 | ||||||
| Croatia - 0.2% |
||||||||
| Ericsson Nikola Tesla (Technology Hardware & Equipment)† |
1,700 | 352,131 | ||||||
| Egypt - 4.4% |
||||||||
| Commercial International Bank Egypt SAE - GDR, Reg S (Banks) |
4,453,410 | 5,655,831 | ||||||
| Edita Food Industries SAE (Food Beverage & Tobacco)† |
699,760 | 293,777 | ||||||
| Integrated Diagnostics Holdings plc (Health Care Equipment & Services)^† |
2,148,810 | 1,654,498 | ||||||
| 7,604,106 | ||||||||
| Iceland - 0.8% |
||||||||
| Marel HF (Capital Goods)^† |
363,387 | 1,303,777 | ||||||
| Indonesia - 2.8% |
||||||||
| Bank Central Asia Tbk PT (Banks)† |
8,695,800 | 4,899,977 | ||||||
| Kazakhstan - 7.2% |
||||||||
| Halyk Savings Bank of Kazakhstan JSC - GDR, Reg S (Banks)† |
481,513 | 4,860,276 | ||||||
| Kaspi.KZ JSC - GDR, Reg S (Diversified Financials)† |
115,657 | 7,569,344 | ||||||
| 12,429,620 | ||||||||
| Kenya - 4.9% |
||||||||
| East African Breweries plc (Food Beverage & Tobacco)† |
620,700 | 855,885 | ||||||
| Equity Group Holdings plc (Banks)† |
7,704,500 | 2,967,597 | ||||||
| Safaricom plc (Telecommunication Services)† |
22,347,550 | 4,623,503 | ||||||
| 8,446,985 | ||||||||
| Morocco - 2.2% |
||||||||
| Itissalat Al-Maghrib (Telecommunication Services)† |
163,006 | 1,519,869 | ||||||
| Societe d’Exploitation des Ports (Transportation)† |
110,025 | 2,219,700 | ||||||
| 3,739,569 | ||||||||
| Shares | Value | |||||||
| COMMON STOCKS - 93.8% (continued) |
| |||||||
| Nigeria - 3.6% |
||||||||
| Guaranty Trust Holding Co., plc (Banks) |
39,535,544 | $1,578,731 | ||||||
| Nestle Nigeria plc (Food Beverage & Tobacco) |
1,062,053 | 2,927,724 | ||||||
| Zenith Bank plc (Banks)† |
35,353,009 | 1,604,212 | ||||||
| 6,110,667 | ||||||||
| Pakistan - 0.5% |
||||||||
| MCB Bank Ltd. (Banks)† |
1,169,700 | 645,203 | ||||||
| Oil & Gas Development Co., Ltd. (Energy)† |
515,000 | 163,738 | ||||||
| 808,941 | ||||||||
| Peru - 4.9% |
||||||||
| Alicorp SAA (Food Beverage & Tobacco) |
750,417 | 1,186,996 | ||||||
| Cementos Pacasmayo SAA (Materials)* |
222,899 | 237,290 | ||||||
| Credicorp Ltd. (Banks) |
48,200 | 7,054,552 | ||||||
| 8,478,838 | ||||||||
| Philippines - 19.1% |
||||||||
| Bank of the Philippine Islands (Banks)† |
2,618,924 | 4,348,442 | ||||||
| BDO Unibank Inc. (Banks)† |
1,257,588 | 2,779,535 | ||||||
| International Container Terminal Services Inc. (Transportation)† |
1,151,370 | 3,447,723 | ||||||
| Jollibee Foods Corp. (Consumer Services)† |
1,104,770 | 4,434,720 | ||||||
| Robinsons Retail Holdings Inc. (Food & Staples Retailing)† |
1,447,190 | 1,343,294 | ||||||
| Security Bank Corp. (Banks)† |
896,340 | 1,342,588 | ||||||
| SM Prime Holdings Inc. (Real Estate)† |
10,494,300 | 5,735,126 | ||||||
| Universal Robina Corp. (Food Beverage & Tobacco)† |
1,760,900 | 3,717,619 | ||||||
| Wilcon Depot Inc. (Retailing)† |
11,200,700 | 5,699,987 | ||||||
| 32,849,034 | ||||||||
| Poland - 0.2% |
||||||||
| Allegro.eu SA (Retailing)*^† |
61,608 | 299,118 | ||||||
| Romania - 4.1% |
||||||||
| Banca Transilvania SA (Banks)† |
1,523,516 | 5,210,066 | ||||||
| Societatea Nationala de Gaze Naturale ROMGAZ SA (Energy)† |
230,266 | 1,776,605 | ||||||
| 6,986,671 | ||||||||
| Saudi Arabia - 3.4% |
||||||||
| Bupa Arabia for Cooperative Insurance Co. (Insurance)† |
20,267 | 1,041,120 | ||||||
| Jarir Marketing Co. (Retailing)† |
37,555 | 1,638,055 | ||||||
| Mouwasat Medical Services Co. (Health Care Equipment & Services)† |
53,445 | 3,115,452 | ||||||
| 5,794,627 | ||||||||
See Notes to Financial Statements
20
Table of Contents
Harding, Loevner Funds, Inc.
Frontier Emerging Markets Portfolio
Portfolio of Investments (continued)
October 31, 2022
| Shares | Value | |||||||
| COMMON STOCKS - 93.8% (continued) |
| |||||||
| Slovenia - 0.9% |
||||||||
| Krka dd Novo mesto (Pharmaceuticals, Biotechnology & Life Sciences)† |
18,539 | $1,643,339 | ||||||
| Thailand - 0.6% |
||||||||
| Home Product Center pcl, Reg S (Retailing) |
2,620,494 | 1,005,234 | ||||||
| United Arab Emirates - 5.9% |
||||||||
| Agthia Group PJSC (Food Beverage & Tobacco)† |
2,204,484 | 2,682,199 | ||||||
| Emaar Properties PJSC (Real Estate)† |
4,523,202 | 7,468,675 | ||||||
| 10,150,874 | ||||||||
| United Kingdom - 5.9% |
||||||||
| Airtel Africa plc (Telecommunication Services)^† |
687,380 | 891,540 | ||||||
| Baltic Classifieds Group plc (Media & Entertainment)† |
1,123,938 | 1,793,975 | ||||||
| Bank of Georgia Group plc (Banks) |
74,584 | 1,817,575 | ||||||
| Network International Holdings plc (Software & Services)*^† |
1,155,422 | 4,313,492 | ||||||
| TBC Bank Group plc (Banks) |
59,642 | 1,288,608 | ||||||
| 10,105,190 | ||||||||
| United States - 6.3% |
||||||||
| EPAM Systems Inc. (Software & Services)* |
14,058 | 4,920,300 | ||||||
| Globant SA (Software & Services)* |
30,916 | 5,833,231 | ||||||
| 10,753,531 | ||||||||
| Vietnam - 13.2% |
||||||||
| Bank for Foreign Trade of Vietnam JSC (Banks)† |
2,283,095 | 6,778,072 | ||||||
| Hoa Phat Group JSC (Materials)† |
4,904,790 | 3,081,667 | ||||||
| Sai Gon Cargo Service Corp. (Transportation)† |
882,394 | 2,550,459 | ||||||
| Saigon Beer Alcohol Beverage Corp. (Food Beverage & Tobacco)† |
653,610 | 4,871,329 | ||||||
| Vietnam Dairy Products JSC (Food Beverage & Tobacco)† |
1,683,794 | 5,312,490 | ||||||
| 22,594,017 | ||||||||
| Total Common Stocks (Cost $152,105,015) |
|
$161,030,057 | ||||||
| Shares | Value | |||||||
| PREFERRED STOCKS - 2.3% |
||||||||
| Colombia - 2.3% |
||||||||
| Bancolombia SA - Sponsored ADR, 9.79% (Banks)+ |
156,602 | $3,972,993 | ||||||
| Total Preferred Stocks (Cost $4,312,555) |
|
$3,972,993 | ||||||
| SHORT TERM INVESTMENTS - 1.7% |
||||||||
| Northern Institutional Funds - Treasury Portfolio (Premier Shares), 2.48% (Money Market Funds) |
2,879,760 | 2,879,760 | ||||||
| Total Short Term Investments (Cost $2,879,760) |
|
$2,879,760 | ||||||
| Total Investments — 97.8% |
||||||||
| (Cost $159,297,330) |
$167,882,810 | |||||||
| Other Assets Less Liabilities - 2.2% |
3,801,366 | |||||||
| Net Assets — 100.0% |
$171,684,176 | |||||||
Summary of Abbreviations
| ADR | American Depositary Receipt |
| GDR | Global Depositary Receipt |
| Reg S | Security sold outside United States without registration under the Securities Act of 1933. |
| † | Investment categorized as level 2 security as disclosed in Note 2 of the Notes to Financial Statements. |
| # | Security valued at fair value as determined in good faith under policies and procedures established by and under the supervision of the Portfolio’s Board of Directors as disclosed in Note 2 of the Notes to Financial Statements. |
| ^ | Security exempt from registration pursuant to Rule 144A of the Securities Act of 1933. These securities, which represent 4.9% of net assets as of October 31, 2022, are considered liquid and may be resold in transactions exempt from registration, normally to qualified buyers. |
| * | Non-income producing security. |
| + | Current yield is disclosed. Dividends are calculated based on a percentage of the issuer’s net income. |
See Notes to Financial Statements
21
Table of Contents
Harding, Loevner Funds, Inc.
Frontier Emerging Markets Portfolio
Portfolio of Investments (continued)
October 31, 2022
| Industry | Percentage of Net Assets |
|||
| Banks |
33.1 | % | ||
| Capital Goods |
0.8 | |||
| Consumer Services |
2.6 | |||
| Diversified Financials |
4.4 | |||
| Energy |
1.2 | |||
| Food & Staples Retailing |
0.8 | |||
| Food Beverage & Tobacco |
12.8 | |||
| Health Care Equipment & Services |
2.7 | |||
| Insurance |
0.6 | |||
| Materials |
2.2 | |||
| Media & Entertainment |
1.0 | |||
| Pharmaceuticals, Biotechnology & Life Sciences |
3.1 | |||
| Real Estate |
7.6 | |||
| Retailing |
5.1 | |||
| Software & Services |
8.8 | |||
| Technology Hardware & Equipment |
0.2 | |||
| Telecommunication Services |
4.3 | |||
| Transportation |
4.8 | |||
| Money Market Fund |
1.7 | |||
| Total Investments |
97.8 | |||
| Other Assets Less Liabilities |
2.2 | |||
| Net Assets |
100.0 | % | ||
See Notes to Financial Statements
22
Table of Contents
Harding, Loevner Funds, Inc.
Global Equity Research Portfolio
Portfolio of Investments
October 31, 2022
| Shares | Value | |||||||
| COMMON STOCKS - 97.5% |
||||||||
| Australia - 0.7% |
||||||||
| BHP Group Ltd. (Materials)† |
1,980 | $47,409 | ||||||
| Brazil - 2.0% |
||||||||
| Ambev SA - ADR (Food Beverage & Tobacco) |
7,484 | 22,751 | ||||||
| B3 SA - Brasil Bolsa Balcao (Diversified Financials) |
7,000 | 20,381 | ||||||
| Localiza Rent a Car SA (Transportation) |
2,300 | 31,409 | ||||||
| Magazine Luiza SA (Retailing)* |
29,600 | 25,615 | ||||||
| Raia Drogasil SA (Food & Staples Retailing) |
2,500 | 12,733 | ||||||
| WEG SA (Capital Goods) |
3,500 | 27,293 | ||||||
| XP Inc., Class A (Diversified Financials)* |
393 | 7,204 | ||||||
| 147,386 | ||||||||
| Canada - 1.8% |
||||||||
| Alimentation Couche-Tard Inc. (Food & Staples Retailing) |
1,400 | 62,686 | ||||||
| Manulife Financial Corp. (Insurance) |
4,000 | 66,297 | ||||||
| 128,983 | ||||||||
| Chile - 0.1% |
||||||||
| Banco Santander Chile - ADR (Banks) |
716 | 10,332 | ||||||
| China - 6.8% |
||||||||
| ANTA Sports Products Ltd. (Consumer Durables & Apparel)† |
1,000 | 8,795 | ||||||
| Baidu Inc., Class A (Media & Entertainment)*† |
1,200 | 11,514 | ||||||
| China Tower Corp., Ltd., Class H (Telecommunication Services)^† |
92,000 | 8,323 | ||||||
| Contemporary Amperex Technology Co., Ltd., Class A (Capital Goods)† |
100 | 5,073 | ||||||
| CSPC Pharmaceutical Group Ltd. (Pharmaceuticals, Biotechnology & Life Sciences)† |
15,360 | 15,797 | ||||||
| ENN Energy Holdings Ltd. (Utilities)† |
3,700 | 36,702 | ||||||
| Foshan Haitian Flavouring & Food Co., Ltd., Class A (Food Beverage & Tobacco)† |
820 | 6,665 | ||||||
| Fuyao Glass Industry Group Co., Ltd., Class H (Automobiles & Components)^† |
3,600 | 12,888 | ||||||
| Glodon Co., Ltd., Class A (Software & Services)† |
2,000 | 13,470 | ||||||
| Guangzhou Tinci Materials Technology Co., Ltd., Class A (Materials)† |
7,900 | 45,588 | ||||||
| Shares | Value | |||||||
| COMMON STOCKS - 97.5% (continued) |
||||||||
| China - 6.8% (continued) |
||||||||
| Haier Smart Home Co., Ltd., Class H (Consumer Durables & Apparel)† |
4,000 | $10,013 | ||||||
| Haitian International Holdings Ltd. (Capital Goods)† |
5,000 | 9,998 | ||||||
| Hangzhou Tigermed Consulting Co., Ltd., Class H (Pharmaceuticals, Biotechnology & Life Sciences)^† |
1,500 | 10,199 | ||||||
| Hongfa Technology Co., Ltd., Class A (Capital Goods)† |
3,780 | 17,651 | ||||||
| Inner Mongolia Yili Industrial Group Co., Ltd., Class A (Food Beverage & Tobacco)† |
2,600 | 8,941 | ||||||
| JD.com Inc., Class A (Retailing)† |
414 | 7,731 | ||||||
| Jiangsu Hengrui Medicine Co., Ltd., Class A (Pharmaceuticals, Biotechnology & Life Sciences)† |
2,408 | 13,198 | ||||||
| Jiangsu Yanghe Brewery Joint-Stock Co., Ltd., Class A (Food Beverage & Tobacco)† |
600 | 10,687 | ||||||
| Kweichow Moutai Co., Ltd., Class A (Food Beverage & Tobacco)† |
100 | 18,416 | ||||||
| Li Ning Co., Ltd. (Consumer Durables & Apparel)† |
1,500 | 7,763 | ||||||
| LONGi Green Energy Technology Co., Ltd., Class A (Semiconductors & Semiconductor Equipment)† |
1,540 | 10,077 | ||||||
| Meituan, Class B (Retailing)*^† |
600 | 9,544 | ||||||
| Midea Group Co., Ltd., Class A (Consumer Durables & Apparel)† |
1,200 | 6,566 | ||||||
| NetEase Inc. - ADR (Media & Entertainment) |
205 | 11,402 | ||||||
| Ping An Insurance Group Co. of China Ltd., Class H (Insurance)† |
2,000 | 8,004 | ||||||
| SF Holding Co., Ltd., Class A (Transportation)† |
1,900 | 12,502 | ||||||
| Shandong Sinocera Functional Material Co., Ltd., Class A (Materials)† |
2,000 | 6,287 | ||||||
| Shenzhen Inovance Technology Co., Ltd., Class A (Capital Goods)† |
1,350 | 12,277 | ||||||
| Shenzhou International Group Holdings Ltd. (Consumer Durables & Apparel)† |
1,000 | 6,902 | ||||||
| Songcheng Performance Development Co., Ltd., Class A (Consumer Services)† |
4,200 | 6,596 | ||||||
See Notes to Financial Statements
23
Table of Contents
Harding, Loevner Funds, Inc.
Global Equity Research Portfolio
Portfolio of Investments (continued)
October 31, 2022
| Shares | Value | |||||||
| COMMON STOCKS - 97.5% (continued) |
||||||||
| China - 6.8% (continued) |
||||||||
| StarPower Semiconductor Ltd., Class A (Semiconductors & Semiconductor Equipment)† |
300 | $15,234 | ||||||
| Sunny Optical Technology Group Co., Ltd. (Technology Hardware & Equipment)† |
1,100 | 9,542 | ||||||
| TravelSky Technology Ltd., Class H (Software & Services)† |
11,000 | 15,981 | ||||||
| Trip.com Group Ltd. (Consumer Services)*† |
514 | 11,638 | ||||||
| Wuliangye Yibin Co., Ltd., Class A (Food Beverage & Tobacco)† |
500 | 9,106 | ||||||
| WuXi AppTec Co., Ltd., Class A (Pharmaceuticals, Biotechnology & Life Sciences)† |
1,286 | 13,399 | ||||||
| Wuxi Biologics Cayman Inc. (Pharmaceuticals, Biotechnology & Life Sciences)*^† |
2,500 | 11,310 | ||||||
| Yonyou Network Technology Co., Ltd., Class A (Software & Services)† |
3,500 | 11,662 | ||||||
| Zhejiang Sanhua Intelligent Controls Co., Ltd., Class A (Capital Goods)† |
4,400 | 12,725 | ||||||
| ZTO Express Cayman Inc. - ADR (Transportation) |
463 | 7,820 | ||||||
| 487,986 | ||||||||
| Colombia - 0.1% |
||||||||
| Cementos Argos SA (Materials) |
9,486 | 6,396 | ||||||
| Czech Republic - 0.3% |
||||||||
| Komercni banka AS (Banks)† |
493 | 14,129 | ||||||
| Moneta Money Bank AS (Banks)^† |
3,231 | 9,432 | ||||||
| 23,561 | ||||||||
| Denmark - 1.0% |
||||||||
| Ambu A/S, Class B (Health Care Equipment & Services)† |
852 | 9,533 | ||||||
| Chr Hansen Holding A/S (Materials)† |
249 | 13,810 | ||||||
| Coloplast A/S, Class B (Health Care Equipment & Services)† |
193 | 21,505 | ||||||
| Genmab A/S (Pharmaceuticals, Biotechnology & Life Sciences)*† |
39 | 15,041 | ||||||
| Novozymes A/S, Class B (Materials)† |
254 | 13,325 | ||||||
| 73,214 | ||||||||
| Egypt - 0.2% |
||||||||
| Commercial International Bank Egypt SAE - GDR, Reg S (Banks) |
9,154 | 11,626 | ||||||
| Shares | Value | |||||||
| COMMON STOCKS - 97.5% (continued) |
||||||||
| Finland - 0.4% |
||||||||
| Kone OYJ, Class B (Capital Goods)† |
404 | $16,534 | ||||||
| Neste OYJ (Energy)† |
314 | 13,746 | ||||||
| 30,280 | ||||||||
| France - 4.5% |
||||||||
| Air Liquide SA (Materials)† |
363 | 47,415 | ||||||
| Alten SA (Software & Services)† |
286 | 33,391 | ||||||
| Dassault Systemes SE (Software & Services)† |
650 | 21,762 | ||||||
| IPSOS (Media & Entertainment)† |
1,082 | 52,352 | ||||||
| Kering SA (Consumer Durables & Apparel)† |
60 | 27,464 | ||||||
| LISI (Capital Goods) |
1,514 | 29,894 | ||||||
| L’Oreal SA (Household & Personal Products)† |
49 | 15,384 | ||||||
| Rubis SCA (Utilities)† |
1,135 | 25,776 | ||||||
| Safran SA (Capital Goods)† |
327 | 36,357 | ||||||
| Sartorius Stedim Biotech (Pharmaceuticals, Biotechnology & Life Sciences)† |
41 | 13,009 | ||||||
| Schneider Electric SE (Capital Goods)† |
159 | 20,122 | ||||||
| 322,926 | ||||||||
| Germany - 5.3% |
||||||||
| adidas AG (Consumer Durables & Apparel)† |
60 | 5,869 | ||||||
| Allianz SE, Reg S (Insurance)† |
230 | 41,408 | ||||||
| Bayerische Motoren Werke AG (Automobiles & Components)† |
715 | 56,189 | ||||||
| Bechtle AG (Software & Services)† |
415 | 14,354 | ||||||
| BioNTech SE - ADR (Pharmaceuticals, Biotechnology & Life Sciences) |
434 | 59,736 | ||||||
| Brenntag SE (Capital Goods)† |
257 | 15,601 | ||||||
| Carl Zeiss Meditec AG (Bearer) (Health Care Equipment & Services)† |
134 | 16,230 | ||||||
| FUCHS PETROLUB SE (Materials)† |
685 | 16,525 | ||||||
| HelloFresh SE (Food & Staples Retailing)*† |
415 | 8,309 | ||||||
| Infineon Technologies AG (Semiconductors & Semiconductor Equipment)† |
2,060 | 50,155 | ||||||
| KWS Saat SE & Co. KGaA (Food Beverage & Tobacco) |
263 | 15,283 | ||||||
| Nemetschek SE (Software & Services)† |
198 | 9,461 | ||||||
| Rational AG (Capital Goods)† |
28 | 15,804 | ||||||
See Notes to Financial Statements
24
Table of Contents
Harding, Loevner Funds, Inc.
Global Equity Research Portfolio
Portfolio of Investments (continued)
October 31, 2022
| Shares | Value | |||||||
| COMMON STOCKS - 97.5% (continued) |
||||||||
| Germany - 5.3% (continued) |
||||||||
| SAP SE - Sponsored ADR (Software & Services) |
201 | $19,308 | ||||||
| Scout24 SE (Media & Entertainment)^† |
235 | 12,049 | ||||||
| Symrise AG (Materials)† |
160 | 16,342 | ||||||
| TeamViewer AG (Software & Services)*^† |
1,400 | 13,468 | ||||||
| 386,091 | ||||||||
| Hong Kong - 1.1% |
||||||||
| AIA Group Ltd. (Insurance)† |
1,600 | 12,083 | ||||||
| ASMPT Ltd. (Semiconductors & Semiconductor Equipment)† |
7,100 | 38,938 | ||||||
| Budweiser Brewing Co. APAC Ltd. (Food Beverage & Tobacco)^† |
6,300 | 13,264 | ||||||
| Techtronic Industries Co., Ltd. (Capital Goods)† |
2,000 | 18,866 | ||||||
| 83,151 | ||||||||
| Iceland - 0.1% |
||||||||
| Marel HF (Capital Goods)^† |
2,669 | 9,576 | ||||||
| India - 1.3% |
||||||||
| Asian Paints Ltd. (Materials)† |
460 | 17,297 | ||||||
| HDFC Bank Ltd. - ADR (Banks) |
204 | 12,711 | ||||||
| Hero MotoCorp Ltd. (Automobiles & Components)† |
419 | 13,560 | ||||||
| ICICI Bank Ltd. - Sponsored ADR (Banks) |
1,034 | 22,789 | ||||||
| Kotak Mahindra Bank Ltd. (Banks)† |
608 | 13,984 | ||||||
| Tata Consultancy Services Ltd. (Software & Services)† |
327 | 12,604 | ||||||
| 92,945 | ||||||||
| Indonesia - 0.4% |
||||||||
| Astra International Tbk PT (Automobiles & Components)† |
33,400 | 14,210 | ||||||
| Bank Rakyat Indonesia Persero Tbk PT (Banks)† |
53,600 | 15,951 | ||||||
| 30,161 | ||||||||
| Ireland - 0.2% |
||||||||
| Ryanair Holdings plc - Sponsored ADR (Transportation)* |
196 | 13,502 | ||||||
| Israel - 0.5% |
||||||||
| CyberArk Software Ltd. (Software & Services)* |
140 | 21,967 | ||||||
| Nice Ltd. - Sponsored ADR (Software & Services)* |
76 | 14,432 | ||||||
| 36,399 | ||||||||
| Italy - 0.7% |
||||||||
| DiaSorin SpA (Health Care Equipment & Services)† |
148 | 19,359 | ||||||
| Shares | Value | |||||||
| COMMON STOCKS - 97.5% (continued) |
||||||||
| Italy - 0.7% (continued) |
||||||||
| FinecoBank Banca Fineco SpA (Banks)† |
1,194 | $16,125 | ||||||
| Reply SpA (Software & Services)† |
131 | 14,254 | ||||||
| 49,738 | ||||||||
| Japan - 7.5% |
||||||||
| BML Inc. (Health Care Equipment & Services)† |
1,100 | 24,879 | ||||||
| Chugai Pharmaceutical Co., Ltd. (Pharmaceuticals, Biotechnology & Life Sciences)† |
2,400 | 55,649 | ||||||
| Daifuku Co., Ltd. (Capital Goods)† |
200 | 9,165 | ||||||
| GMO Payment Gateway Inc. (Software & Services)† |
200 | 14,352 | ||||||
| Hakuhodo DY Holdings Inc. (Media & Entertainment)† |
3,100 | 26,164 | ||||||
| Kakaku.com Inc. (Media & Entertainment)† |
1,000 | 16,889 | ||||||
| Keyence Corp. (Technology Hardware & Equipment)† |
40 | 15,075 | ||||||
| Komatsu Ltd. (Capital Goods)† |
2,500 | 47,852 | ||||||
| M3 Inc. (Health Care Equipment & Services)† |
400 | 11,947 | ||||||
| Makita Corp. (Capital Goods)† |
1,200 | 21,933 | ||||||
| MISUMI Group Inc. (Capital Goods)† |
700 | 14,887 | ||||||
| Nitori Holdings Co., Ltd. (Retailing)† |
400 | 36,215 | ||||||
| Recruit Holdings Co., Ltd. (Commercial & Professional Services)† |
300 | 9,208 | ||||||
| Rinnai Corp. (Consumer Durables & Apparel)† |
540 | 36,806 | ||||||
| Shimano Inc. (Consumer Durables & Apparel)† |
300 | 46,519 | ||||||
| Shionogi & Co., Ltd. (Pharmaceuticals, Biotechnology & Life Sciences)† |
900 | 41,692 | ||||||
| Shiseido Co., Ltd. (Household & Personal Products)† |
300 | 10,394 | ||||||
| SMC Corp. (Capital Goods)† |
40 | 16,101 | ||||||
| Stanley Electric Co., Ltd. (Automobiles & Components)† |
2,600 | 44,168 | ||||||
| Sugi Holdings Co., Ltd. (Food & Staples Retailing)† |
400 | 16,048 | ||||||
| Sysmex Corp. (Health Care Equipment & Services)† |
200 | 10,789 | ||||||
| UT Group Co., Ltd. (Commercial & Professional Services)† |
1,100 | 17,903 | ||||||
| 544,635 | ||||||||
See Notes to Financial Statements
25
Table of Contents
Harding, Loevner Funds, Inc.
Global Equity Research Portfolio
Portfolio of Investments (continued)
October 31, 2022
| Shares | Value | |||||||
| COMMON STOCKS - 97.5% (continued) |
||||||||
| Kazakhstan - 0.5% |
||||||||
| Halyk Savings Bank of Kazakhstan JSC - GDR, Reg S (Banks)† |
1,120 | $11,305 | ||||||
| Kaspi.KZ JSC - GDR, Reg S (Diversified Financials)† |
343 | 22,448 | ||||||
| 33,753 | ||||||||
| Mexico - 0.8% |
||||||||
| Fomento Economico Mexicano SAB de CV - Sponsored ADR (Food Beverage & Tobacco) |
192 | 13,751 | ||||||
| Grupo Financiero Banorte SAB de CV, Series O (Banks) |
2,000 | 16,257 | ||||||
| Wal-Mart de Mexico SAB de CV (Food & Staples Retailing) |
6,800 | 26,266 | ||||||
| 56,274 | ||||||||
| Netherlands - 0.9% |
||||||||
| Adyen NV (Software & Services)*^† |
8 | 11,460 | ||||||
| ASM International NV (Semiconductors & Semiconductor Equipment)† |
37 | 8,195 | ||||||
| ASML Holding NV, Reg S (Semiconductors & Semiconductor Equipment) |
90 | 42,518 | ||||||
| 62,173 | ||||||||
| Norway - 0.2% |
||||||||
| Adevinta ASA (Media & Entertainment)*† |
1,658 | 11,328 | ||||||
| Panama - 0.2% |
||||||||
| Copa Holdings SA, Class A (Transportation)* |
216 | 16,250 | ||||||
| Peru - 0.2% |
||||||||
| Credicorp Ltd. (Banks) |
126 | 18,441 | ||||||
| Philippines - 1.8% |
||||||||
| Bank of the Philippine Islands (Banks)† |
12,490 | 20,738 | ||||||
| BDO Unibank Inc. (Banks)† |
10,070 | 22,257 | ||||||
| International Container Terminal Services Inc. (Transportation)† |
4,970 | 14,882 | ||||||
| Jollibee Foods Corp. (Consumer Services)† |
4,720 | 18,947 | ||||||
| Robinsons Retail Holdings Inc. (Food & Staples Retailing)† |
10,510 | 9,756 | ||||||
| Security Bank Corp. (Banks)† |
8,660 | 12,971 | ||||||
| SM Prime Holdings Inc. (Real Estate)† |
27,500 | 15,029 | ||||||
| Universal Robina Corp. (Food Beverage & Tobacco)† |
6,400 | 13,512 | ||||||
| 128,092 | ||||||||
| Poland - 0.4% |
||||||||
| Allegro.eu SA (Retailing)*^† |
3,048 | 14,799 | ||||||
| Shares | Value | |||||||
| COMMON STOCKS - 97.5% (continued) |
||||||||
| Poland - 0.4% (continued) |
||||||||
| ING Bank Slaski SA (Banks)† |
426 | $14,839 | ||||||
| 29,638 | ||||||||
| Russia - 0.0%^^ |
||||||||
| LUKOIL PJSC (Energy)‡ |
278 | — | ||||||
| Novatek PJSC - Sponsored GDR, Reg S (Energy)*‡ |
89 | — | ||||||
| Sberbank of Russia PJSC (Banks)*‡ |
5,112 | — | ||||||
| Yandex NV, Class A (Media & Entertainment)*‡ |
383 | — | ||||||
| — | ||||||||
| Saudi Arabia - 1.0% |
||||||||
| Al Rajhi Bank (Banks)*† |
468 | 10,603 | ||||||
| Bupa Arabia for Cooperative Insurance Co. (Insurance)† |
401 | 20,599 | ||||||
| Jarir Marketing Co. (Retailing)† |
252 | 10,992 | ||||||
| Mouwasat Medical Services Co. (Health Care Equipment & Services)† |
252 | 14,690 | ||||||
| Saudi National Bank (Banks)† |
1,118 | 17,663 | ||||||
| 74,547 | ||||||||
| Singapore - 1.6% |
||||||||
| DBS Group Holdings Ltd. (Banks)† |
2,418 | 58,384 | ||||||
| Oversea-Chinese Banking Corp., Ltd. (Banks)† |
6,824 | 58,439 | ||||||
| 116,823 | ||||||||
| Slovenia - 0.2% |
||||||||
| Krka dd Novo mesto (Pharmaceuticals, Biotechnology & Life Sciences)† |
152 | 13,821 | ||||||
| South Africa - 0.2% |
||||||||
| Discovery Ltd. (Insurance)*† |
1,831 | 11,992 | ||||||
| South Korea - 0.9% |
||||||||
| Amorepacific Corp. (Household & Personal Products)† |
155 | 10,060 | ||||||
| Cheil Worldwide Inc. (Media & Entertainment)† |
1,001 | 17,153 | ||||||
| Coway Co., Ltd. (Consumer Durables & Apparel)† |
184 | 7,121 | ||||||
| LG H&H Co., Ltd. (Household & Personal Products)† |
19 | 6,785 | ||||||
| NAVER Corp. (Media & Entertainment)† |
88 | 10,432 | ||||||
| NCSoft Corp. (Media & Entertainment)† |
38 | 10,375 | ||||||
| 61,926 | ||||||||
| Spain - 2.4% |
||||||||
| Amadeus IT Group SA (Software & Services)*† |
248 | 12,910 | ||||||
| Banco Bilbao Vizcaya Argentaria SA (Banks)† |
13,818 | 71,008 | ||||||
See Notes to Financial Statements
26
Table of Contents
Harding, Loevner Funds, Inc.
Global Equity Research Portfolio
Portfolio of Investments (continued)
October 31, 2022
| Shares | Value | |||||||
| COMMON STOCKS - 97.5% (continued) |
| |||||||
| Spain - 2.4% (continued) |
||||||||
| Banco Santander SA - Sponsored ADR (Banks) |
14,529 | $37,921 | ||||||
| Bankinter SA (Banks) |
8,132 | 49,151 | ||||||
| 170,990 | ||||||||
| Sweden - 2.1% |
||||||||
| Alfa Laval AB (Capital Goods)† |
887 | 21,808 | ||||||
| Assa Abloy AB, Class B (Capital Goods)† |
664 | 13,398 | ||||||
| Atlas Copco AB, Class A (Capital Goods)† |
2,176 | 23,232 | ||||||
| Epiroc AB, Class A (Capital Goods)† |
1,467 | 22,431 | ||||||
| Evolution AB (Consumer Services)^† |
112 | 10,468 | ||||||
| Hexagon AB, Class B (Technology Hardware & Equipment)† |
1,890 | 18,667 | ||||||
| Intrum AB (Commercial & Professional Services)† |
1,097 | 13,803 | ||||||
| Skandinaviska Enskilda Banken AB, Class A (Banks)† |
1,670 | 17,604 | ||||||
| Thule Group AB (Consumer Durables & Apparel)^† |
390 | 7,676 | ||||||
| 149,087 | ||||||||
| Switzerland - 2.6% |
||||||||
| Alcon Inc. (Health Care Equipment & Services) |
661 | 40,109 | ||||||
| Cie Financiere Richemont SA, Class A, Reg S (Consumer Durables & Apparel) |
244 | 23,865 | ||||||
| Lonza Group AG, Reg S (Pharmaceuticals, Biotechnology & Life Sciences)† |
60 | 30,845 | ||||||
| SGS SA, Reg S (Commercial & Professional Services)† |
8 | 17,633 | ||||||
| Sonova Holding AG, Reg S (Health Care Equipment & Services)† |
68 | 16,059 | ||||||
| Straumann Holding AG, Reg S (Health Care Equipment & Services)† |
150 | 14,261 | ||||||
| Tecan Group AG, Reg S (Pharmaceuticals, Biotechnology & Life Sciences)† |
32 | 11,768 | ||||||
| Temenos AG, Reg S (Software & Services)† |
174 | 10,358 | ||||||
| VAT Group AG (Capital Goods)^† |
96 | 21,890 | ||||||
| 186,788 | ||||||||
| Taiwan - 1.4% |
||||||||
| Advantech Co., Ltd. (Technology Hardware & Equipment)† |
999 | 9,042 | ||||||
| Airtac International Group (Capital Goods)† |
418 | 9,601 | ||||||
| Shares | Value | |||||||
| COMMON STOCKS - 97.5% (continued) |
| |||||||
| Taiwan - 1.4% (continued) |
||||||||
| Chipbond Technology Corp. (Semiconductors & Semiconductor Equipment)† |
14,000 | $23,577 | ||||||
| Delta Electronics Inc. (Technology Hardware & Equipment)† |
1,000 | 7,970 | ||||||
| Eclat Textile Co., Ltd. (Consumer Durables & Apparel)† |
600 | 7,868 | ||||||
| Hon Hai Precision Industry Co., Ltd. (Technology Hardware & Equipment)† |
4,000 | 12,694 | ||||||
| Silergy Corp. (Semiconductors & Semiconductor Equipment)† |
800 | 9,201 | ||||||
| Taiwan Semiconductor Manufacturing Co., Ltd. (Semiconductors & Semiconductor Equipment)† |
2,000 | 24,068 | ||||||
| 104,021 | ||||||||
| Thailand - 0.2% |
||||||||
| SCB X pcl, Reg S (Banks)† |
6,200 | 17,267 | ||||||
| Turkey - 0.3% |
||||||||
| BIM Birlesik Magazalar AS (Food & Staples Retailing)† |
2,570 | 18,558 | ||||||
| United Arab Emirates - 0.6% |
||||||||
| Agthia Group PJSC (Food Beverage & Tobacco)† |
8,681 | 10,562 | ||||||
| Emaar Properties PJSC (Real Estate)† |
18,834 | 31,099 | ||||||
| 41,661 | ||||||||
| United Kingdom - 3.8% |
||||||||
| Abcam plc (Pharmaceuticals, Biotechnology & Life Sciences)*† |
872 | 13,509 | ||||||
| Coca-Cola HBC AG - CDI (Food Beverage & Tobacco)*† |
576 | 12,560 | ||||||
| Compass Group plc (Consumer Services) |
967 | 20,366 | ||||||
| Dechra Pharmaceuticals plc (Pharmaceuticals, Biotechnology & Life Sciences)† |
435 | 13,066 | ||||||
| Diploma plc (Capital Goods)† |
1,655 | 47,142 | ||||||
| Grafton Group plc (Capital Goods) |
2,919 | 23,098 | ||||||
| Rathbones Group plc (Diversified Financials)† |
1,554 | 33,382 | ||||||
| Reckitt Benckiser Group plc (Household & Personal Products)† |
152 | 10,070 | ||||||
| Rightmove plc (Media & Entertainment)† |
2,075 | 11,689 | ||||||
| Rio Tinto plc (Materials) |
994 | 51,718 | ||||||
| Spirax-Sarco Engineering plc (Capital Goods)† |
154 | 18,964 | ||||||
See Notes to Financial Statements
27
Table of Contents
Harding, Loevner Funds, Inc.
Global Equity Research Portfolio
Portfolio of Investments (continued)
October 31, 2022
| Shares | Value | |||||||
| COMMON STOCKS - 97.5% (continued) |
| |||||||
| United Kingdom - 3.8% (continued) |
||||||||
| Standard Chartered plc (Banks) |
3,634 | $21,679 | ||||||
| 277,243 | ||||||||
| United States - 40.2% |
||||||||
| Abbott Laboratories (Health Care Equipment & Services) |
390 | 38,587 | ||||||
| AbbVie Inc. (Pharmaceuticals, Biotechnology & Life Sciences) |
637 | 93,257 | ||||||
| ABIOMED Inc. (Health Care Equipment & Services)* |
55 | 13,864 | ||||||
| Accenture plc, Class A (Software & Services) |
70 | 19,873 | ||||||
| Adobe Inc. (Software & Services)* |
90 | 28,665 | ||||||
| Air Products and Chemicals Inc. (Materials) |
66 | 16,526 | ||||||
| Align Technology Inc. (Health Care Equipment & Services)* |
60 | 11,658 | ||||||
| Allegion plc (Capital Goods) |
136 | 14,249 | ||||||
| Alphabet Inc., Class A (Media & Entertainment)* |
680 | 64,267 | ||||||
| Altair Engineering Inc., Class A (Software & Services)* |
277 | 13,587 | ||||||
| Amazon.com Inc. (Retailing)* |
280 | 28,683 | ||||||
| AMETEK Inc. (Capital Goods) |
147 | 19,060 | ||||||
| Amphenol Corp., Class A (Technology Hardware & Equipment) |
288 | 21,839 | ||||||
| ANSYS Inc. (Software & Services)* |
78 | 17,251 | ||||||
| Apple Inc. (Technology Hardware & Equipment) |
260 | 39,868 | ||||||
| Applied Materials Inc. (Semiconductors & Semiconductor Equipment) |
615 | 54,298 | ||||||
| Atlassian Corp., Class A (Software & Services)* |
46 | 9,326 | ||||||
| Automatic Data Processing Inc. (Software & Services) |
92 | 22,236 | ||||||
| Booking Holdings Inc. (Consumer Services)* |
8 | 14,956 | ||||||
| BorgWarner Inc. (Automobiles & Components) |
1,850 | 69,431 | ||||||
| Bristol-Myers Squibb Co. (Pharmaceuticals, Biotechnology & Life Sciences) |
1,086 | 84,132 | ||||||
| Broadcom Inc. (Semiconductors & Semiconductor Equipment) |
161 | 75,689 | ||||||
| Church & Dwight Co., Inc. (Household & Personal Products) |
198 | 14,678 | ||||||
| Cisco Systems Inc. (Technology Hardware & Equipment) |
907 | 41,205 | ||||||
| Shares | Value | |||||||
| COMMON STOCKS - 97.5% (continued) |
| |||||||
| United States - 40.2% (continued) |
||||||||
| Cognex Corp. (Technology Hardware & Equipment) |
230 | $10,633 | ||||||
| Copart Inc. (Commercial & Professional Services)* |
542 | 62,341 | ||||||
| CoStar Group Inc. (Commercial & Professional Services)* |
225 | 18,612 | ||||||
| Costco Wholesale Corp. (Food & Staples Retailing) |
35 | 17,553 | ||||||
| Danaher Corp. (Pharmaceuticals, Biotechnology & Life Sciences) |
298 | 74,998 | ||||||
| Deere & Co. (Capital Goods) |
180 | 71,248 | ||||||
| Domino’s Pizza Inc. (Consumer Services) |
44 | 14,619 | ||||||
| eBay Inc. (Retailing) |
259 | 10,319 | ||||||
| Ecolab Inc. (Materials) |
84 | 13,194 | ||||||
| Edwards Lifesciences Corp. (Health Care Equipment & Services)* |
212 | 15,355 | ||||||
| Elanco Animal Health Inc. (Pharmaceuticals, Biotechnology & Life Sciences)* |
3,065 | 40,427 | ||||||
| Electronic Arts Inc. (Media & Entertainment) |
143 | 18,012 | ||||||
| Emerson Electric Co. (Capital Goods) |
188 | 16,281 | ||||||
| EnerSys (Capital Goods) |
200 | 13,258 | ||||||
| EPAM Systems Inc. (Software & Services)* |
31 | 10,850 | ||||||
| Equifax Inc. (Commercial & Professional Services) |
78 | 13,224 | ||||||
| Estee Lauder Cos., Inc., Class A (Household & Personal Products) |
58 | 11,628 | ||||||
| Etsy Inc. (Retailing)* |
131 | 12,302 | ||||||
| First Republic Bank (Banks) |
384 | 46,118 | ||||||
| Gartner Inc. (Software & Services)* |
248 | 74,876 | ||||||
| Guidewire Software Inc. (Software & Services)* |
152 | 9,030 | ||||||
| HEICO Corp. (Capital Goods) |
290 | 47,166 | ||||||
| IDEXX Laboratories Inc. (Health Care Equipment & Services)* |
70 | 25,178 | ||||||
| Illumina Inc. (Pharmaceuticals, Biotechnology & Life Sciences)* |
60 | 13,729 | ||||||
| Intuitive Surgical Inc. (Health Care Equipment & Services)* |
63 | 15,528 | ||||||
| IPG Photonics Corp. (Technology Hardware & Equipment)* |
179 | 15,333 | ||||||
See Notes to Financial Statements
28
Table of Contents
Harding, Loevner Funds, Inc.
Global Equity Research Portfolio
Portfolio of Investments (continued)
October 31, 2022
| Shares | Value | |||||||
| COMMON STOCKS - 97.5% (continued) |
| |||||||
| United States - 40.2% (continued) |
||||||||
| Johnson & Johnson (Pharmaceuticals, Biotechnology & Life Sciences) |
70 | $12,178 | ||||||
| JPMorgan Chase & Co. (Banks) |
589 | 74,143 | ||||||
| Linde plc (Materials)† |
169 | 50,562 | ||||||
| Malibu Boats Inc., Class A (Consumer Durables & Apparel)* |
517 | 27,349 | ||||||
| Mastercard Inc., Class A (Software & Services) |
52 | 17,065 | ||||||
| McDonald’s Corp. (Consumer Services) |
85 | 23,176 | ||||||
| MercadoLibre Inc. (Retailing)* |
15 | 13,524 | ||||||
| Merck & Co., Inc. (Pharmaceuticals, Biotechnology & Life Sciences) |
734 | 74,281 | ||||||
| Meta Platforms Inc., Class A (Media & Entertainment)* |
471 | 43,878 | ||||||
| Microsoft Corp. (Software & Services) |
290 | 67,318 | ||||||
| Monster Beverage Corp. (Food Beverage & Tobacco)* |
204 | 19,119 | ||||||
| Netflix Inc. (Media & Entertainment)* |
298 | 86,980 | ||||||
| Neurocrine Biosciences Inc. (Pharmaceuticals, Biotechnology & Life Sciences)* |
445 | 51,228 | ||||||
| NIKE Inc., Class B (Consumer Durables & Apparel) |
156 | 14,458 | ||||||
| Palo Alto Networks Inc. (Software & Services)* |
156 | 26,768 | ||||||
| PayPal Holdings Inc. (Software & Services)* |
161 | 13,456 | ||||||
| Pinterest Inc., Class A (Media & Entertainment)* |
566 | 13,924 | ||||||
| Pool Corp. (Retailing) |
103 | 31,336 | ||||||
| Procter & Gamble Co. (Household & Personal Products) |
137 | 18,450 | ||||||
| Reinsurance Group of America Inc. (Insurance) |
430 | 63,283 | ||||||
| Repligen Corp. (Pharmaceuticals, Biotechnology & Life Sciences)* |
97 | 17,702 | ||||||
| ResMed Inc. (Health Care Equipment & Services) |
81 | 18,119 | ||||||
| Rockwell Automation Inc. (Capital Goods) |
55 | 14,042 | ||||||
| Roper Technologies Inc. (Software & Services) |
47 | 19,483 | ||||||
| Salesforce Inc. (Software & Services)* |
130 | 21,137 | ||||||
| Schlumberger NV (Energy) |
698 | 36,317 | ||||||
| Shares | Value | |||||||
| COMMON STOCKS - 97.5% (continued) |
| |||||||
| United States - 40.2% (continued) |
||||||||
| Sensata Technologies Holding plc (Capital Goods) |
328 | $13,189 | ||||||
| ServiceNow Inc. (Software & Services)* |
54 | 22,720 | ||||||
| Signature Bank (Banks) |
408 | 64,680 | ||||||
| Starbucks Corp. (Consumer Services) |
578 | 50,049 | ||||||
| SVB Financial Group (Banks)* |
144 | 33,258 | ||||||
| Teradyne Inc. (Semiconductors & Semiconductor Equipment) |
618 | 50,274 | ||||||
| Texas Instruments Inc. (Semiconductors & Semiconductor Equipment) |
115 | 18,472 | ||||||
| Thermo Fisher Scientific Inc. (Pharmaceuticals, Biotechnology & Life Sciences) |
136 | 69,900 | ||||||
| TJX Cos., Inc. (Retailing) |
274 | 19,755 | ||||||
| Vertex Pharmaceuticals Inc. (Pharmaceuticals, Biotechnology & Life Sciences)* |
242 | 75,504 | ||||||
| Visa Inc., Class A (Software & Services) |
76 | 15,744 | ||||||
| Walt Disney Co. (Media & Entertainment)* |
221 | 23,545 | ||||||
| Workday Inc., Class A (Software & Services)* |
140 | 21,815 | ||||||
| Zoetis Inc. (Pharmaceuticals, Biotechnology & Life Sciences) |
261 | 39,354 | ||||||
| 2,906,532 | ||||||||
| Total Common Stocks (Cost $7,282,291) |
$7,043,502 | |||||||
| PREFERRED STOCKS - 1.1% |
||||||||
| Colombia - 0.1% |
||||||||
| Bancolombia SA - Sponsored ADR, 9.79% (Banks)+ |
360 | 9,133 | ||||||
| Germany - 0.3% |
||||||||
| Sartorius AG, 0.35% (Pharmaceuticals, Biotechnology & Life Sciences)+† |
55 | 19,412 | ||||||
| South Korea - 0.7% |
||||||||
| Samsung Electronics Co., Ltd. - GDR, Reg S, 2.94% (Technology Hardware & Equipment)+ |
56 | 52,416 | ||||||
| Total Preferred Stocks (Cost $102,083) |
$80,961 | |||||||
See Notes to Financial Statements
29
Table of Contents
Harding, Loevner Funds, Inc.
Global Equity Research Portfolio
Portfolio of Investments (continued)
October 31, 2022
| Shares | Value | |||||||
| SHORT TERM INVESTMENTS - 1.7% |
| |||||||
| Northern Institutional Funds - Treasury Portfolio (Premier Shares), 2.48% (Money Market Funds) |
119,103 | $119,103 | ||||||
| Total Short Term Investments (Cost $119,103) |
|
$119,103 | ||||||
| Total Investments — 100.3% |
||||||||
| (Cost $7,503,477) |
$7,243,566 | |||||||
| Liabilities Less Other Assets - (0.3)% |
(21,572 | ) | ||||||
| Net Assets — 100.0% |
$7,221,994 | |||||||
Summary of Abbreviations
| ADR | American Depositary Receipt |
| CDI | Chess Depositary Interest |
| GDR | Global Depositary Receipt |
| Reg S | Security sold outside United States without registration under the Securities Act of 1933. |
| † | Investment categorized as level 2 security as disclosed in Note 2 of the Notes to Financial Statements. |
| * | Non-income producing security. |
| ^ | Security exempt from registration pursuant to Rule 144A of the Securities Act of 1933. These securities, which represent 2.4% of net assets as of October 31, 2022, are considered liquid and may be resold in transactions exempt from registration, normally to qualified buyers. |
| ‡ | Investments categorized as level 3 security that is effectively valued at zero. See Note 2 of the Notes to the Financial Statements. |
| + | Current yield is disclosed. Dividends are calculated based on a percentage of the issuer’s net income. |
| ^^ | Amount is less than 0.005%. |
| Industry | Percentage of Net Assets |
|||
| Automobiles & Components |
3.0 | % | ||
| Banks |
11.2 | |||
| Capital Goods |
10.5 | |||
| Commercial & Professional Services |
2.3 | |||
| Consumer Durables & Apparel |
3.3 | |||
| Consumer Services |
2.5 | |||
| Diversified Financials |
1.2 | |||
| Energy |
0.7 | |||
| Food & Staples Retailing |
2.4 | |||
| Food Beverage & Tobacco |
2.6 | |||
| Health Care Equipment & Services |
4.6 | |||
| Household & Personal Products |
1.3 | |||
| Insurance |
3.2 | |||
| Materials |
4.9 | |||
| Media & Entertainment |
6.2 | |||
| Pharmaceuticals, Biotechnology & Life Sciences |
13.9 | |||
| Real Estate |
0.6 | |||
| Retailing |
3.0 | |||
| Semiconductors & Semiconductor Equipment |
5.8 | |||
| Software & Services |
9.6 | |||
| Technology Hardware & Equipment |
3.5 | |||
| Telecommunication Services |
0.1 | |||
| Transportation |
1.3 | |||
| Utilities |
0.9 | |||
| Money Market Fund |
1.7 | |||
| Total Investments |
100.3 | |||
| Liabilities Less Other Assets |
(0.3 | ) | ||
| Net Assets |
100.0 | % | ||
See Notes to Financial Statements
30
Table of Contents
International Equity Research Portfolio
Portfolio of Investments
October 31, 2022
|
Shares |
Value |
|||||||
| COMMON STOCKS - 96.3% |
||||||||
| Australia - 0.9% |
||||||||
| BHP Group Ltd. (Materials)† |
3,859 | $92,399 | ||||||
| Brazil - 2.7% |
||||||||
| Ambev SA - ADR (Food Beverage & Tobacco) |
12,347 | 37,535 | ||||||
| B3 SA - Brasil Bolsa Balcao (Diversified Financials) |
14,500 | 42,219 | ||||||
| Localiza Rent a Car SA (Transportation) |
4,800 | 65,549 | ||||||
| Magazine Luiza SA (Retailing)* |
24,000 | 20,768 | ||||||
| Raia Drogasil SA (Food & Staples Retailing) |
9,400 | 47,878 | ||||||
| WEG SA (Capital Goods) |
6,200 | 48,347 | ||||||
| XP Inc., Class A (Diversified Financials)* |
1,028 | 18,843 | ||||||
| 281,139 | ||||||||
| Canada - 2.1% |
||||||||
| Alimentation Couche-Tard Inc. (Food & Staples Retailing) |
2,700 | 120,894 | ||||||
| Manulife Financial Corp. (Insurance) |
6,100 | 101,103 | ||||||
| 221,997 | ||||||||
| Chile - 0.2% |
||||||||
| Banco Santander Chile - ADR (Banks) |
1,728 | 24,935 | ||||||
| China - 9.9% |
||||||||
| ANTA Sports Products Ltd. (Consumer Durables & Apparel)† |
2,000 | 17,590 | ||||||
| Baidu Inc., Class A (Media & Entertainment)*† |
2,250 | 21,589 | ||||||
| China Tower Corp., Ltd., Class H (Telecommunication Services)^† |
222,000 | 20,084 | ||||||
| Contemporary Amperex Technology Co., Ltd., Class A (Capital Goods)† |
300 | 15,220 | ||||||
| CSPC Pharmaceutical Group Ltd. (Pharmaceuticals, Biotechnology & Life Sciences)† |
37,600 | 38,670 | ||||||
| ENN Energy Holdings Ltd. (Utilities)† |
2,200 | 21,823 | ||||||
| Foshan Haitian Flavouring & Food Co., Ltd., Class A (Food Beverage & Tobacco)† |
2,289 | 18,604 | ||||||
| Fuyao Glass Industry Group Co., Ltd., Class H (Automobiles & Components)^† |
6,800 | 24,344 | ||||||
| Glodon Co., Ltd., Class A (Software & Services)† |
3,480 | 23,438 | ||||||
| Guangzhou Tinci Materials Technology Co., Ltd., Class A (Materials)† |
11,600 | 66,939 | ||||||
|
Shares |
Value |
|||||||
| COMMON STOCKS - 96.3% (continued) |
| |||||||
| China - 9.9% (continued) |
||||||||
| Haier Smart Home Co., Ltd., Class H (Consumer Durables & Apparel)† |
10,800 | $ | 27,035 | |||||
| Haitian International Holdings Ltd. (Capital Goods)† |
15,000 | 29,994 | ||||||
| Hangzhou Tigermed Consulting Co., Ltd., Class H (Pharmaceuticals, Biotechnology & Life Sciences)^† |
3,300 | 22,438 | ||||||
| Hongfa Technology Co., Ltd., Class A (Capital Goods)† |
6,160 | 28,765 | ||||||
| Inner Mongolia Yili Industrial Group Co., Ltd., Class A (Food Beverage & Tobacco)† |
5,200 | 17,883 | ||||||
| JD.com Inc., Class A (Retailing)† |
1,176 | 21,959 | ||||||
| Jiangsu Hengrui Medicine Co., Ltd., Class A (Pharmaceuticals, Biotechnology & Life Sciences)† |
5,564 | 30,497 | ||||||
| Jiangsu Yanghe Brewery Joint-Stock Co., Ltd., Class A (Food Beverage & Tobacco)† |
1,100 | 19,592 | ||||||
| Kweichow Moutai Co., Ltd., Class A (Food Beverage & Tobacco)† |
100 | 18,416 | ||||||
| Li Ning Co., Ltd. (Consumer Durables & Apparel)† |
3,500 | 18,113 | ||||||
| LONGi Green Energy Technology Co., Ltd., Class A (Semiconductors & Semiconductor Equipment)† |
5,600 | 36,644 | ||||||
| Meituan, Class B (Retailing)*^† |
1,800 | 28,633 | ||||||
| Midea Group Co., Ltd., Class A (Consumer Durables & Apparel)† |
3,400 | 18,604 | ||||||
| NetEase Inc. - ADR (Media & Entertainment) |
571 | 31,759 | ||||||
| Ping An Insurance Group Co. of China Ltd., Class H (Insurance)† |
6,000 | 24,011 | ||||||
| SF Holding Co., Ltd., Class A (Transportation)† |
3,800 | 25,005 | ||||||
| Shandong Sinocera Functional Material Co., Ltd., Class A (Materials)† |
5,300 | 16,661 | ||||||
| Shenzhen Inovance Technology Co., Ltd., Class A (Capital Goods)† |
4,050 | 36,830 | ||||||
| Shenzhou International Group Holdings Ltd. (Consumer Durables & Apparel)† |
2,000 | 13,804 | ||||||
| Songcheng Performance Development Co., Ltd., Class A (Consumer Services)† |
11,800 | 18,531 | ||||||
See Notes to Financial Statements
31
Table of Contents
Harding, Loevner Funds, Inc.
International Equity Research Portfolio
Portfolio of Investments (continued)
October 31, 2022
|
Shares |
Value |
|||||||
| COMMON STOCKS - 96.3% (continued) |
||||||||
| China - 9.9% (continued) |
||||||||
| StarPower Semiconductor Ltd., Class A (Semiconductors & Semiconductor Equipment)† |
700 | $35,547 | ||||||
| Sunny Optical Technology Group Co., Ltd. (Technology Hardware & Equipment)† |
4,700 | 40,772 | ||||||
| TravelSky Technology Ltd., Class H (Software & Services)† |
21,000 | 30,509 | ||||||
| Trip.com Group Ltd. (Consumer Services)*† |
1,101 | 24,929 | ||||||
| Wuliangye Yibin Co., Ltd., Class A (Food Beverage & Tobacco)† |
1,300 | 23,674 | ||||||
| WuXi AppTec Co., Ltd., Class A (Pharmaceuticals, Biotechnology & Life Sciences)† |
1,790 | 18,650 | ||||||
| Wuxi Biologics Cayman Inc. (Pharmaceuticals, Biotechnology & Life Sciences)*^† |
4,500 | 20,358 | ||||||
| Yonyou Network Technology Co., Ltd., Class A (Software & Services)† |
7,700 | 25,656 | ||||||
| Zhejiang Sanhua Intelligent Controls Co., Ltd., Class A (Capital Goods)† |
11,900 | 34,415 | ||||||
| ZTO Express Cayman Inc. - ADR (Transportation) |
1,185 | 20,015 | ||||||
| 1,028,000 | ||||||||
| Colombia - 0.2% |
||||||||
| Cementos Argos SA (Materials) |
26,196 | 17,663 | ||||||
| Czech Republic - 0.6% |
||||||||
| Komercni banka AS (Banks)† |
1,233 | 35,337 | ||||||
| Moneta Money Bank AS (Banks)^† |
8,045 | 23,484 | ||||||
| 58,821 | ||||||||
| Denmark - 2.6% |
||||||||
| Ambu A/S, Class B (Health Care Equipment & Services)† |
2,770 | 30,992 | ||||||
| Chr Hansen Holding A/S (Materials)† |
702 | 38,935 | ||||||
| Coloplast A/S, Class B (Health Care Equipment & Services)† |
377 | 42,008 | ||||||
| Genmab A/S (Pharmaceuticals, Biotechnology & Life Sciences)*† |
328 | 126,497 | ||||||
| Novozymes A/S, Class B (Materials)† |
535 | 28,066 | ||||||
| 266,498 | ||||||||
| Egypt - 0.6% |
||||||||
| Commercial International Bank Egypt SAE - GDR, Reg S (Banks) |
46,323 | 58,830 | ||||||
|
Shares |
Value |
|||||||
| COMMON STOCKS - 96.3% (continued) |
||||||||
| Finland - 0.5% |
||||||||
| Kone OYJ, Class B (Capital Goods)† |
601 | $24,596 | ||||||
| Neste OYJ (Energy)† |
588 | 25,741 | ||||||
| 50,337 | ||||||||
| France - 7.6% |
||||||||
| Air Liquide SA (Materials)† |
795 | 103,842 | ||||||
| Alten SA (Software & Services)† |
918 | 107,178 | ||||||
| Dassault Systemes SE (Software & Services)† |
887 | 29,697 | ||||||
| IPSOS (Media & Entertainment)† |
2,051 | 99,236 | ||||||
| Kering SA (Consumer Durables & Apparel)† |
217 | 99,329 | ||||||
| LISI (Capital Goods) |
3,059 | 60,401 | ||||||
| L’Oreal SA (Household & Personal Products)† |
100 | 31,396 | ||||||
| Rubis SCA (Utilities)† |
3,120 | 70,855 | ||||||
| Safran SA (Capital Goods)† |
558 | 62,041 | ||||||
| Sartorius Stedim Biotech (Pharmaceuticals, Biotechnology & Life Sciences)† |
103 | 32,680 | ||||||
| Schneider Electric SE (Capital Goods)† |
691 | 87,449 | ||||||
| 784,104 | ||||||||
| Germany - 9.3% |
||||||||
| adidas AG (Consumer Durables & Apparel)† |
222 | 21,715 | ||||||
| Allianz SE, Reg S (Insurance)† |
507 | 91,279 | ||||||
| Bayerische Motoren Werke AG (Automobiles & Components)† |
1,419 | 111,513 | ||||||
| Bechtle AG (Software & Services)† |
2,341 | 80,973 | ||||||
| BioNTech SE - ADR (Pharmaceuticals, Biotechnology & Life Sciences) |
768 | 105,708 | ||||||
| Brenntag SE (Capital Goods)† |
1,433 | 86,992 | ||||||
| Carl Zeiss Meditec AG (Bearer) (Health Care Equipment & Services)† |
225 | 27,252 | ||||||
| FUCHS PETROLUB SE (Materials)† |
2,480 | 59,827 | ||||||
| HelloFresh SE (Food & Staples Retailing)*† |
1,697 | 33,978 | ||||||
| Infineon Technologies AG (Semiconductors & Semiconductor Equipment)† |
3,128 | 76,157 | ||||||
| KWS Saat SE & Co. KGaA (Food Beverage & Tobacco) |
863 | 50,148 | ||||||
| Nemetschek SE (Software & Services)† |
911 | 43,532 | ||||||
| Rational AG (Capital Goods)† |
50 | 28,221 | ||||||
See Notes to Financial Statements
32
Table of Contents
Harding, Loevner Funds, Inc.
International Equity Research Portfolio
Portfolio of Investments (continued)
October 31, 2022
|
Shares |
Value |
|||||||
| COMMON STOCKS - 96.3% (continued) |
||||||||
| Germany - 9.3% (continued) |
||||||||
| SAP SE - Sponsored ADR (Software & Services) |
717 | $68,875 | ||||||
| Scout24 SE (Media & Entertainment)^† |
486 | 24,918 | ||||||
| Symrise AG (Materials)† |
253 | 25,841 | ||||||
| TeamViewer AG (Software & Services)*^† |
2,653 | 25,521 | ||||||
| 962,450 | ||||||||
| Hong Kong - 2.2% |
||||||||
| AIA Group Ltd. (Insurance)† |
8,600 | 64,944 | ||||||
| ASMPT Ltd. (Semiconductors & Semiconductor Equipment)† |
12,600 | 69,102 | ||||||
| Budweiser Brewing Co. APAC Ltd. (Food Beverage & Tobacco)^† |
11,900 | 25,054 | ||||||
| Techtronic Industries Co., Ltd. (Capital Goods)† |
7,500 | 70,748 | ||||||
| 229,848 | ||||||||
| Iceland - 0.2% |
||||||||
| Marel HF (Capital Goods)^† |
5,278 | 18,937 | ||||||
| India - 2.0% |
||||||||
| Asian Paints Ltd. (Materials)† |
885 | 33,277 | ||||||
| HDFC Bank Ltd. - ADR (Banks) |
541 | 33,710 | ||||||
| Hero MotoCorp Ltd. (Automobiles & Components)† |
1,078 | 34,887 | ||||||
| ICICI Bank Ltd. - Sponsored ADR (Banks) |
1,648 | 36,322 | ||||||
| Kotak Mahindra Bank Ltd. (Banks)† |
1,501 | 34,524 | ||||||
| Tata Consultancy Services Ltd. (Software & Services)† |
892 | 34,380 | ||||||
| 207,100 | ||||||||
| Indonesia - 0.9% |
||||||||
| Astra International Tbk PT (Automobiles & Components)† |
111,500 | 47,438 | ||||||
| Bank Rakyat Indonesia Persero Tbk PT (Banks)† |
141,200 | 42,019 | ||||||
| 89,457 | ||||||||
| Ireland - 0.6% |
||||||||
| Ryanair Holdings plc - Sponsored ADR (Transportation)* |
947 | 65,239 | ||||||
| Israel - 0.6% |
||||||||
| CyberArk Software Ltd. (Software & Services)* |
241 | 37,815 | ||||||
| Nice Ltd. - Sponsored ADR (Software & Services)* |
137 | 26,015 | ||||||
| 63,830 | ||||||||
| Italy - 1.4% |
||||||||
| DiaSorin SpA (Health Care Equipment & Services)† |
246 | 32,177 | ||||||
|
Shares |
Value |
|||||||
| COMMON STOCKS - 96.3% (continued) |
||||||||
| Italy - 1.4% (continued) |
||||||||
| FinecoBank Banca Fineco SpA (Banks)† |
2,153 | $29,077 | ||||||
| Reply SpA (Software & Services)† |
729 | 79,325 | ||||||
| 140,579 | ||||||||
| Japan - 13.5% |
||||||||
| BML Inc. (Health Care Equipment & Services)† |
2,100 | 47,496 | ||||||
| Chugai Pharmaceutical Co., Ltd. (Pharmaceuticals, Biotechnology & Life Sciences)† |
4,200 | 97,386 | ||||||
| Daifuku Co., Ltd. (Capital Goods)† |
1,800 | 82,485 | ||||||
| GMO Payment Gateway Inc. (Software & Services)† |
300 | 21,527 | ||||||
| Hakuhodo DY Holdings Inc. (Media & Entertainment)† |
9,090 | 76,720 | ||||||
| Kakaku.com Inc. (Media & Entertainment)† |
2,700 | 45,600 | ||||||
| Keyence Corp. (Technology Hardware & Equipment)† |
60 | 22,613 | ||||||
| Komatsu Ltd. (Capital Goods)† |
4,740 | 90,727 | ||||||
| M3 Inc. (Health Care Equipment & Services)† |
1,200 | 35,841 | ||||||
| Makita Corp. (Capital Goods)† |
3,900 | 71,284 | ||||||
| MISUMI Group Inc. (Capital Goods)† |
4,500 | 95,701 | ||||||
| Nitori Holdings Co., Ltd. (Retailing)† |
1,200 | 108,644 | ||||||
| Recruit Holdings Co., Ltd. (Commercial & Professional Services)† |
2,800 | 85,938 | ||||||
| Rinnai Corp. (Consumer Durables & Apparel)† |
1,100 | 74,974 | ||||||
| Shimano Inc. (Consumer Durables & Apparel)† |
600 | 93,039 | ||||||
| Shionogi & Co., Ltd. (Pharmaceuticals, Biotechnology & Life Sciences)† |
1,600 | 74,119 | ||||||
| Shiseido Co., Ltd. (Household & Personal Products)† |
800 | 27,718 | ||||||
| SMC Corp. (Capital Goods)† |
160 | 64,406 | ||||||
| Stanley Electric Co., Ltd. (Automobiles & Components)† |
4,415 | 75,001 | ||||||
| Sugi Holdings Co., Ltd. (Food & Staples Retailing)† |
1,555 | 62,385 | ||||||
| Sysmex Corp. (Health Care Equipment & Services)† |
500 | 26,973 | ||||||
| UT Group Co., Ltd. (Commercial & Professional Services)† |
1,000 | 16,276 | ||||||
| 1,396,853 | ||||||||
See Notes to Financial Statements
33
Table of Contents
Harding, Loevner Funds, Inc.
International Equity Research Portfolio
Portfolio of Investments (continued)
October 31, 2022
|
Shares |
Value |
|||||||
| COMMON STOCKS - 96.3% (continued) |
||||||||
| Kazakhstan - 0.7% |
||||||||
| Halyk Savings Bank of Kazakhstan JSC - GDR, Reg S (Banks)† |
3,384 | $34,157 | ||||||
| Kaspi.KZ JSC - GDR, Reg S |
657 | 42,999 | ||||||
| 77,156 | ||||||||
| Mexico - 1.2% |
||||||||
| Fomento Economico Mexicano |
||||||||
| SAB de CV - Sponsored |
||||||||
| ADR (Food Beverage & |
||||||||
| Tobacco) |
655 | 46,911 | ||||||
| Grupo Financiero Banorte SAB |
5,000 | 40,643 | ||||||
| Wal-Mart de Mexico SAB de CV (Food & Staples Retailing) |
10,100 | 39,012 | ||||||
| 126,566 | ||||||||
| Netherlands - 1.5% |
||||||||
| Adyen NV (Software & Services)*^† |
16 | 22,920 | ||||||
| ASM International NV (Semiconductors & Semiconductor Equipment)† |
172 | 38,094 | ||||||
| ASML Holding NV, Reg S (Semiconductors & Semiconductor Equipment) |
192 | 90,705 | ||||||
| 151,719 | ||||||||
| Norway - 1.1% |
||||||||
| Adevinta ASA (Media & Entertainment)*† |
16,158 | 110,398 | ||||||
| Panama - 0.3% |
||||||||
| Copa Holdings SA, Class A (Transportation)* |
404 | 30,393 | ||||||
| Peru - 0.5% |
||||||||
| Credicorp Ltd. (Banks) |
323 | 47,274 | ||||||
| Philippines - 2.7% |
||||||||
| Bank of the Philippine Islands (Banks)† |
24,270 | 40,298 | ||||||
| BDO Unibank Inc. (Banks)† |
16,700 | 36,910 | ||||||
| International Container Terminal Services Inc. (Transportation)† |
12,650 | 37,880 | ||||||
| Jollibee Foods Corp. (Consumer Services)† |
8,190 | 32,876 | ||||||
| Robinsons Retail Holdings Inc. (Food & Staples Retailing)† |
35,230 | 32,701 | ||||||
| Security Bank Corp. (Banks)† |
19,210 | 28,774 | ||||||
| SM Prime Holdings Inc. (Real Estate)† |
74,900 | 40,933 | ||||||
| Universal Robina Corp. (Food Beverage & Tobacco)† |
14,560 | 30,739 | ||||||
| 281,111 | ||||||||
| Poland - 0.5% |
||||||||
| Allegro.eu SA (Retailing)*^† |
4,376 | 21,246 | ||||||
|
Shares |
Value |
|||||||
| COMMON STOCKS - 96.3% (continued) |
||||||||
| Poland - 0.5% (continued) |
||||||||
| ING Bank Slaski SA (Banks)† |
878 | $30,584 | ||||||
| 51,830 | ||||||||
| Russia - 0.0%^^ |
||||||||
| LUKOIL PJSC (Energy)‡ |
603 | — | ||||||
| Novatek PJSC - Sponsored GDR, Reg S (Energy)*‡ |
190 | — | ||||||
| Sberbank of Russia PJSC (Banks)*‡ |
13,556 | — | ||||||
| Yandex NV, Class A (Media & Entertainment)*‡ |
541 | — | ||||||
| — | ||||||||
| Saudi Arabia - 1.7% |
||||||||
| Al Rajhi Bank (Banks)*† |
1,129 | 25,579 | ||||||
| Bupa Arabia for Cooperative Insurance Co. (Insurance)† |
1,021 | 52,449 | ||||||
| Jarir Marketing Co. (Retailing)† |
641 | 27,959 | ||||||
| Mouwasat Medical Services Co. (Health Care Equipment & Services)† |
648 | 37,774 | ||||||
| Saudi National Bank (Banks)† |
2,214 | 34,978 | ||||||
| 178,739 | ||||||||
| Singapore - 2.3% |
||||||||
| DBS Group Holdings Ltd. (Banks)† |
4,814 | 116,237 | ||||||
| Oversea-Chinese Banking Corp., Ltd. (Banks)† |
14,038 | 120,218 | ||||||
| 236,455 | ||||||||
| Slovenia - 0.3% |
||||||||
| Krka dd Novo mesto (Pharmaceuticals, Biotechnology & Life Sciences)† |
303 | 27,551 | ||||||
| South Africa - 0.3% |
||||||||
| Discovery Ltd. (Insurance)*† |
4,148 | 27,167 | ||||||
| South Korea - 1.2% |
||||||||
| Amorepacific Corp. (Household & Personal Products)† |
231 | 14,992 | ||||||
| Cheil Worldwide Inc. (Media & Entertainment)† |
2,148 | 36,807 | ||||||
| Coway Co., Ltd. (Consumer Durables & Apparel)† |
524 | 20,281 | ||||||
| LG H&H Co., Ltd. (Household & Personal Products)† |
43 | 15,356 | ||||||
| NAVER Corp. (Media & Entertainment)† |
111 | 13,159 | ||||||
| NCSoft Corp. (Media & Entertainment)† |
105 | 28,668 | ||||||
| 129,263 | ||||||||
| Spain - 3.3% |
||||||||
| Amadeus IT Group SA (Software & Services)*† |
464 | 24,154 | ||||||
| Banco Bilbao Vizcaya Argentaria SA (Banks)† |
24,608 | 126,456 | ||||||
See Notes to Financial Statements
34
Table of Contents
Harding, Loevner Funds, Inc.
International Equity Research Portfolio
Portfolio of Investments (continued)
October 31, 2022
|
Shares |
Value |
|||||||
| COMMON STOCKS - 96.3% (continued) |
||||||||
| Spain - 3.3% (continued) |
||||||||
| Banco Santander SA - Sponsored ADR (Banks) |
34,683 | $90,523 | ||||||
| Bankinter SA (Banks) |
15,831 | 95,685 | ||||||
| 336,818 | ||||||||
| Sweden - 5.3% |
||||||||
| Alfa Laval AB (Capital Goods)† |
2,478 | 60,926 | ||||||
| Assa Abloy AB, Class B (Capital Goods)† |
4,623 | 93,280 | ||||||
| Atlas Copco AB, Class A (Capital Goods)† |
3,548 | 37,880 | ||||||
| Epiroc AB, Class A (Capital Goods)† |
5,084 | 77,735 | ||||||
| Evolution AB (Consumer Services)^† |
1,144 | 106,923 | ||||||
| Hexagon AB, Class B (Technology Hardware & Equipment)† |
2,300 | 22,717 | ||||||
| Intrum AB (Commercial & Professional Services)† |
2,169 | 27,292 | ||||||
| Skandinaviska Enskilda Banken AB, Class A (Banks)† |
9,177 | 96,737 | ||||||
| Thule Group AB (Consumer Durables & Apparel)^† |
1,256 | 24,721 | ||||||
| 548,211 | ||||||||
| Switzerland - 4.0% |
||||||||
| Alcon Inc. (Health Care Equipment & Services) |
1,575 | 95,571 | ||||||
| Cie Financiere Richemont SA, Class A, Reg S (Consumer Durables & Apparel) |
470 | 45,970 | ||||||
| Lonza Group AG, Reg S (Pharmaceuticals, Biotechnology & Life Sciences)† |
117 | 60,148 | ||||||
| SGS SA, Reg S (Commercial & Professional Services)† |
11 | 24,245 | ||||||
| Sonova Holding AG, Reg S (Health Care Equipment & Services)† |
124 | 29,284 | ||||||
| Straumann Holding AG, Reg S (Health Care Equipment & Services)† |
290 | 27,571 | ||||||
| Tecan Group AG, Reg S (Pharmaceuticals, Biotechnology & Life Sciences)† |
194 | 71,341 | ||||||
| Temenos AG, Reg S (Software & Services)† |
306 | 18,215 | ||||||
| VAT Group AG (Capital Goods)^† |
187 | 42,641 | ||||||
| 414,986 | ||||||||
| Taiwan - 2.1% |
||||||||
| Advantech Co., Ltd. (Technology Hardware & Equipment)† |
2,998 | 27,135 | ||||||
| Airtac International Group (Capital Goods)† |
1,046 | 24,026 | ||||||
|
Shares |
Value |
|||||||
| COMMON STOCKS - 96.3% (continued) |
||||||||
| Taiwan - 2.1% (continued) |
||||||||
| Chipbond Technology Corp. (Semiconductors & Semiconductor Equipment)† |
19,000 | $31,997 | ||||||
| Delta Electronics Inc. (Technology Hardware & Equipment)† |
3,000 | 23,909 | ||||||
| Eclat Textile Co., Ltd. (Consumer Durables & Apparel)† |
2,000 | 26,228 | ||||||
| Hon Hai Precision Industry Co., Ltd. (Technology Hardware & Equipment)† |
9,000 | 28,561 | ||||||
| Silergy Corp. (Semiconductors & Semiconductor Equipment)† |
1,000 | 11,501 | ||||||
| Taiwan Semiconductor Manufacturing Co., Ltd. (Semiconductors & Semiconductor Equipment)† |
4,000 | 48,137 | ||||||
| 221,494 | ||||||||
| Thailand - 0.4% |
||||||||
| SCB X pcl, Reg S (Banks)† |
14,400 | 40,105 | ||||||
| Turkey - 0.5% |
||||||||
| BIM Birlesik Magazalar AS (Food & Staples Retailing)† |
7,548 | 54,503 | ||||||
| United Arab Emirates - 1.0% |
||||||||
| Agthia Group PJSC (Food Beverage & Tobacco)† |
23,110 | 28,118 | ||||||
| Emaar Properties PJSC (Real Estate)† |
47,766 | 78,871 | ||||||
| 106,989 | ||||||||
| United Kingdom - 6.8% |
||||||||
| Abcam plc (Pharmaceuticals, Biotechnology & Life Sciences)*† |
4,498 | 69,682 | ||||||
| Coca-Cola HBC AG - CDI (Food Beverage & Tobacco)*† |
1,463 | 31,901 | ||||||
| Compass Group plc (Consumer Services) |
1,711 | 36,035 | ||||||
| Dechra Pharmaceuticals plc (Pharmaceuticals, Biotechnology & Life Sciences)† |
869 | 26,102 | ||||||
| Diploma plc (Capital Goods)† |
3,481 | 99,154 | ||||||
| Grafton Group plc (Capital Goods) |
5,899 | 46,678 | ||||||
| Rathbones Group plc (Diversified Financials)† |
2,788 | 59,891 | ||||||
| Reckitt Benckiser Group plc (Household & Personal Products)† |
1,503 | 99,576 | ||||||
| Rightmove plc (Media & Entertainment)† |
8,008 | 45,113 | ||||||
| Rio Tinto plc (Materials) |
1,782 | 92,718 | ||||||
| Spirax-Sarco Engineering plc (Capital Goods)† |
248 | 30,540 | ||||||
See Notes to Financial Statements
35
Table of Contents
Harding, Loevner Funds, Inc.
International Equity Research Portfolio
Portfolio of Investments (continued)
October 31, 2022
|
Shares |
Value |
|||||||
| COMMON STOCKS - 96.3% (continued) |
||||||||
| United Kingdom - 6.8% (continued) |
||||||||
| Standard Chartered plc (Banks) |
11,266 | $67,209 | ||||||
| 704,599 | ||||||||
| Total Common Stocks (Cost $11,474,092) |
$9,962,343 | |||||||
|
|
||||||||
| PREFERRED STOCKS - 1.8% |
||||||||
| Colombia - 0.3% |
||||||||
| Bancolombia SA - Sponsored ADR, 9.79% (Banks)+ |
1,364 | 34,605 | ||||||
| Germany - 0.6% |
||||||||
| Sartorius AG, 0.35% (Pharmaceuticals, Biotechnology & Life Sciences)+† |
182 | 64,234 | ||||||
| South Korea - 0.9% |
||||||||
| Samsung Electronics Co., Ltd. - GDR, Reg S, 2.94% (Technology Hardware & Equipment)+ |
94 | 87,984 | ||||||
| Total Preferred Stocks (Cost $221,920) |
$186,823 | |||||||
|
|
||||||||
| SHORT TERM INVESTMENTS - 2.2% |
||||||||
| Northern Institutional Funds - Treasury Portfolio (Premier Shares), 2.48% (Money Market Funds) |
231,828 | 231,828 | ||||||
| Total Short Term Investments (Cost $231,828) |
|
$231,828 | ||||||
|
|
|
|||||||
| Total Investments — 100.3% |
||||||||
| (Cost $11,927,840) |
$10,380,994 | |||||||
| Liabilities Less Other Assets - (0.3)% |
(34,292 | ) | ||||||
| Net Assets — 100.0% |
$10,346,702 | |||||||
|
Summary of Abbreviations | ||
| ADR | American Depositary Receipt | |
| CDI | Chess Depositary Interest | |
| GDR | Global Depositary Receipt | |
| Reg S | Security sold outside United States without registration under the Securities Act of 1933. | |
| † | Investment categorized as level 2 security as disclosed in Note 2 of the Notes to Financial Statements. | |
| * | Non-income producing security. | |
| ^ | Security exempt from registration pursuant to Rule 144A of the Securities Act of 1933. These securities, which represent 4.4% of net assets as of October 31, 2022, are considered liquid and may be resold in transactions exempt from registration, normally to qualified buyers. | |
| ‡ | Investments categorized as level 3 security that is effectively valued at zero. See Note 2 of the Notes to the Financial Statements. | |
| + | Current yield is disclosed. Dividends are calculated based on a percentage of the issuer’s net income. | |
| ^^ | Amount is less than 0.005%. | |
See Notes to Financial Statements
36
Table of Contents
Harding, Loevner Funds, Inc.
International Equity Research Portfolio
Portfolio of Investments (continued)
October 31, 2022
| Industry | Percentage of Net Assets |
|||
| Automobiles & Components |
2.9 | % | ||
| Banks |
13.6 | |||
| Capital Goods |
15.0 | |||
| Commercial & Professional Services |
1.5 | |||
| Consumer Durables & Apparel |
4.8 | |||
| Consumer Services |
2.0 | |||
| Diversified Financials |
1.6 | |||
| Energy |
0.3 | |||
| Food & Staples Retailing |
3.6 | |||
| Food Beverage & Tobacco |
3.4 | |||
| Health Care Equipment & Services |
4.4 | |||
| Household & Personal Products |
1.8 | |||
| Insurance |
3.5 | |||
| Materials |
5.7 | |||
| Media & Entertainment |
5.1 | |||
| Pharmaceuticals, Biotechnology & Life Sciences |
8.6 | |||
| Real Estate |
1.1 | |||
| Retailing |
2.3 | |||
| Semiconductors & Semiconductor Equipment |
4.3 | |||
| Software & Services |
6.7 | |||
| Technology Hardware & Equipment |
2.5 | |||
| Telecommunication Services |
0.2 | |||
| Transportation |
2.3 | |||
| Utilities |
0.9 | |||
| Money Market Fund |
2.2 | |||
| Total Investments |
100.3 | |||
| Liabilities Less Other Assets |
(0.3 | ) | ||
| Net Assets |
100.0 | % | ||
See Notes to Financial Statements
37
Table of Contents
Emerging Markets Research Portfolio
Portfolio of Investments
October 31, 2022
| Shares | Value | |||||||
| COMMON STOCKS - 95.8% |
| |||||||
| Bangladesh - 0.4% |
||||||||
| Square Pharmaceuticals Ltd. (Pharmaceuticals, Biotechnology & Life Sciences)† |
10,847 | $22,465 | ||||||
| Brazil - 10.4% |
||||||||
| Ambev SA - ADR (Food Beverage & Tobacco) |
20,505 | 62,335 | ||||||
| B3 SA - Brasil Bolsa Balcao (Diversified Financials) |
45,400 | 132,188 | ||||||
| Localiza Rent a Car SA (Transportation) |
9,900 | 135,194 | ||||||
| Magazine Luiza SA (Retailing)* |
68,100 | 58,931 | ||||||
| Raia Drogasil SA (Food & Staples Retailing) |
14,100 | 71,817 | ||||||
| WEG SA (Capital Goods) |
9,700 | 75,639 | ||||||
| XP Inc., Class A (Diversified Financials)* |
6,130 | 112,363 | ||||||
| 648,467 | ||||||||
| Chile - 2.0% |
||||||||
| Banco Santander Chile - ADR (Banks) |
8,721 | 125,844 | ||||||
| China - 25.8% |
||||||||
| ANTA Sports Products Ltd. (Consumer Durables & Apparel)† |
3,000 | 26,384 | ||||||
| Baidu Inc., Class A (Media & Entertainment)*† |
2,650 | 25,427 | ||||||
| China Tower Corp., Ltd., Class H (Telecommunication Services)^† |
136,000 | 12,304 | ||||||
| Contemporary Amperex Technology Co., Ltd., Class A (Capital Goods)† |
600 | 30,440 | ||||||
| CSPC Pharmaceutical Group Ltd. (Pharmaceuticals, Biotechnology & Life Sciences)† |
108,080 | 111,155 | ||||||
| ENN Energy Holdings Ltd. (Utilities)† |
4,400 | 43,646 | ||||||
| Foshan Haitian Flavouring & Food Co., Ltd., Class A (Food Beverage & Tobacco)† |
2,739 | 22,261 | ||||||
| Fuyao Glass Industry Group Co., Ltd., Class H (Automobiles & Components)^† |
8,400 | 30,071 | ||||||
| Glodon Co., Ltd., Class A (Software & Services)† |
3,400 | 22,899 | ||||||
| Guangzhou Tinci Materials Technology Co., Ltd., Class A (Materials)† |
15,400 | 88,867 | ||||||
| Haier Smart Home Co., Ltd., Class H (Consumer Durables & Apparel)† |
30,400 | 76,098 | ||||||
| Haitian International Holdings Ltd. (Capital Goods)† |
15,000 | 29,994 | ||||||
| Shares | Value | |||||||
| COMMON STOCKS - 95.8% (continued) |
| |||||||
| China - 25.8% (continued) |
| |||||||
| Hangzhou Tigermed Consulting Co., Ltd., Class H (Pharmaceuticals, Biotechnology & Life Sciences)^† |
3,900 | $26,518 | ||||||
| Hefei Meiya Optoelectronic Technology Inc., Class A (Capital Goods)† |
4,810 | 15,590 | ||||||
| Hongfa Technology Co., Ltd., Class A (Capital Goods)† |
7,420 | 34,649 | ||||||
| Inner Mongolia Yili Industrial Group Co., Ltd., Class A (Food Beverage & Tobacco)† |
11,300 | 38,861 | ||||||
| JD.com Inc., Class A (Retailing)† |
3,252 | 60,724 | ||||||
| Jiangsu Hengrui Medicine Co., Ltd., Class A (Pharmaceuticals, Biotechnology & Life Sciences)† |
6,480 | 35,517 | ||||||
| Jiangsu Yanghe Brewery Joint-Stock Co., Ltd., Class A (Food Beverage & Tobacco)† |
2,200 | 39,184 | ||||||
| Kweichow Moutai Co., Ltd., Class A (Food Beverage & Tobacco)† |
100 | 18,416 | ||||||
| Li Ning Co., Ltd. (Consumer Durables & Apparel)† |
4,000 | 20,701 | ||||||
| LONGi Green Energy Technology Co., Ltd., Class A (Semiconductors & Semiconductor Equipment)† |
4,760 | 31,148 | ||||||
| Meituan, Class B (Retailing)*^† |
1,600 | 25,452 | ||||||
| Midea Group Co., Ltd., Class A (Consumer Durables & Apparel)† |
14,300 | 78,247 | ||||||
| NetEase Inc. - ADR (Media & Entertainment) |
648 | 36,042 | ||||||
| Ping An Insurance Group Co. of China Ltd., Class H (Insurance)† |
20,000 | 80,036 | ||||||
| Qingdao Haier Biomedical Co., Ltd., Class A (Health Care Equipment & Services)† |
2,900 | 30,501 | ||||||
| SF Holding Co., Ltd., Class A (Transportation)† |
5,900 | 38,823 | ||||||
| Shandong Sinocera Functional Material Co., Ltd., Class A (Materials)† |
6,300 | 19,805 | ||||||
| Shanghai Friendess Electronic Technology Corp., Ltd., Class A (Technology Hardware & Equipment)† |
1,187 | 33,245 | ||||||
| Shenzhen Inovance Technology Co., Ltd., Class A (Capital Goods)† |
4,800 | 43,651 | ||||||
| Shenzhou International Group Holdings Ltd. (Consumer Durables & Apparel)† |
3,000 | 20,706 | ||||||
See Notes to Financial Statements
38
Table of Contents
Harding, Loevner Funds, Inc.
Emerging Markets Research Portfolio
Portfolio of Investments (continued)
October 31, 2022
| Shares | Value | |||||||
| COMMON STOCKS - 95.8% (continued) |
| |||||||
| China - 25.8% (continued) |
||||||||
| Songcheng Performance Development Co., Ltd., Class A (Consumer Services)† |
19,100 | $29,994 | ||||||
| StarPower Semiconductor Ltd., Class A (Semiconductors & Semiconductor Equipment)† |
600 | 30,469 | ||||||
| Sunny Optical Technology Group Co., Ltd. (Technology Hardware & Equipment)† |
2,700 | 23,422 | ||||||
| TravelSky Technology Ltd., Class H (Software & Services)† |
23,000 | 33,414 | ||||||
| Trip.com Group Ltd. (Consumer Services)*† |
2,161 | 48,930 | ||||||
| Wuliangye Yibin Co., Ltd., Class A (Food Beverage & Tobacco)† |
1,400 | 25,496 | ||||||
| WuXi AppTec Co., Ltd., Class A (Pharmaceuticals, Biotechnology & Life Sciences)† |
3,727 | 38,832 | ||||||
| Wuxi Biologics Cayman Inc. (Pharmaceuticals, Biotechnology & Life Sciences)*^† |
6,000 | 27,144 | ||||||
| Yonyou Network Technology Co., Ltd., Class A (Software & Services)† |
9,600 | 31,987 | ||||||
| Zhejiang Sanhua Intelligent Controls Co., Ltd., Class A (Capital Goods)† |
14,200 | 41,066 | ||||||
| ZTO Express Cayman Inc. - ADR (Transportation) |
1,449 | 24,474 | ||||||
| 1,602,590 | ||||||||
| Colombia - 0.2% |
||||||||
| Cementos Argos SA (Materials) |
15,277 | 10,301 | ||||||
| Czech Republic - 0.5% |
||||||||
| Komercni banka AS (Banks)† |
706 | 20,234 | ||||||
| Moneta Money Bank AS (Banks)^† |
4,818 | 14,064 | ||||||
| 34,298 | ||||||||
| Egypt - 0.5% |
||||||||
| Commercial International Bank Egypt SAE - GDR, Reg S (Banks) |
23,473 | 29,811 | ||||||
| Iceland - 0.2% |
||||||||
| Marel HF (Capital Goods)^† |
3,210 | 11,517 | ||||||
| India - 6.7% |
||||||||
| Asian Paints Ltd. (Materials)† |
1,186 | 44,595 | ||||||
| HDFC Bank Ltd. - ADR (Banks) |
2,128 | 132,596 | ||||||
| Hero MotoCorp Ltd. (Automobiles & Components)† |
1,026 | 33,204 | ||||||
| Shares | Value | |||||||
| COMMON STOCKS - 95.8% (continued) |
| |||||||
| India - 6.7% (continued) |
||||||||
| ICICI Bank Ltd. - Sponsored ADR (Banks) |
4,058 | $89,438 | ||||||
| Kotak Mahindra Bank Ltd. (Banks)† |
1,950 | 44,851 | ||||||
| Max Financial Services Ltd. (Insurance)*† |
1,683 | 14,410 | ||||||
| Tata Consultancy Services Ltd. (Software & Services)† |
1,502 | 57,892 | ||||||
| 416,986 | ||||||||
| Indonesia - 2.8% |
||||||||
| Astra International Tbk PT (Automobiles & Components)† |
116,400 | 49,522 | ||||||
| Bank Rakyat Indonesia Persero Tbk PT (Banks)† |
424,000 | 126,177 | ||||||
| 175,699 | ||||||||
| Kazakhstan - 0.7% |
||||||||
| Halyk Savings Bank of Kazakhstan JSC - GDR, Reg S (Banks)† |
1,819 | 18,361 | ||||||
| Kaspi.KZ JSC - GDR, Reg S (Diversified Financials)† |
386 | 25,262 | ||||||
| 43,623 | ||||||||
| Kenya - 0.2% |
||||||||
| Safaricom plc (Telecommunication Services)† |
62,300 | 12,889 | ||||||
| Malaysia - 0.4% |
||||||||
| Dialog Group Bhd. (Energy)† |
63,800 | 27,786 | ||||||
| Mexico - 5.2% |
||||||||
| Fomento Economico Mexicano SAB de CV - Sponsored ADR (Food Beverage & Tobacco) |
1,864 | 133,500 | ||||||
| Grupo Financiero Banorte SAB de CV, Series O (Banks) |
17,000 | 138,184 | ||||||
| Wal-Mart de Mexico SAB de CV (Food & Staples Retailing) |
13,300 | 51,373 | ||||||
| 323,057 | ||||||||
| Morocco - 0.5% |
||||||||
| Attijariwafa Bank (Banks)† |
430 | 15,110 | ||||||
| Itissalat Al-Maghrib (Telecommunication Services)† |
1,491 | 13,902 | ||||||
| 29,012 | ||||||||
| Pakistan - 0.2% |
||||||||
| Oil & Gas Development Co., Ltd. (Energy)† |
41,800 | 13,290 | ||||||
| Panama - 0.7% |
||||||||
| Copa Holdings SA, Class A (Transportation)* |
607 | 45,665 | ||||||
See Notes to Financial Statements
39
Table of Contents
Harding, Loevner Funds, Inc.
Emerging Markets Research Portfolio
Portfolio of Investments (continued)
October 31, 2022
| Shares | Value | |||||||
| COMMON STOCKS - 95.8% (continued) |
| |||||||
| Peru - 2.1% |
||||||||
| Credicorp Ltd. (Banks) |
907 | $132,748 | ||||||
| Philippines - 4.2% |
||||||||
| Bank of the Philippine Islands (Banks)† |
13,720 | 22,780 | ||||||
| BDO Unibank Inc. (Banks)† |
26,400 | 58,349 | ||||||
| International Container Terminal Services Inc. (Transportation)† |
18,410 | 55,128 | ||||||
| Jollibee Foods Corp. (Consumer Services)† |
6,330 | 25,410 | ||||||
| Robinsons Retail Holdings Inc. (Food & Staples Retailing)† |
16,410 | 15,232 | ||||||
| Security Bank Corp. (Banks)† |
10,700 | 16,027 | ||||||
| SM Prime Holdings Inc. (Real Estate)† |
88,800 | 48,529 | ||||||
| Universal Robina Corp. (Food Beverage & Tobacco)† |
8,270 | 17,460 | ||||||
| 258,915 | ||||||||
| Poland - 0.7% |
||||||||
| Allegro.eu SA (Retailing)*^† |
5,182 | 25,159 | ||||||
| ING Bank Slaski SA (Banks)† |
505 | 17,591 | ||||||
| 42,750 | ||||||||
| Romania - 0.7% |
||||||||
| Banca Transilvania SA (Banks)† |
4,342 | 14,849 | ||||||
| Societatea Nationala de Gaze Naturale ROMGAZ SA (Energy)† |
3,372 | 26,016 | ||||||
| 40,865 | ||||||||
| Russia - 0.0%^^ |
||||||||
| LUKOIL PJSC (Energy)‡ |
1,738 | — | ||||||
| Novatek PJSC - Sponsored GDR, Reg S (Energy)*‡ |
531 | — | ||||||
| Sberbank of Russia PJSC (Banks)*‡ |
34,876 | — | ||||||
| Yandex NV, Class A (Media & Entertainment)*‡ |
941 | — | ||||||
| — | ||||||||
| Saudi Arabia - 4.5% |
||||||||
| Al Rajhi Bank (Banks)*† |
2,371 | 53,719 | ||||||
| Bupa Arabia for Cooperative Insurance Co. (Insurance)† |
621 | 31,901 | ||||||
| Jarir Marketing Co. (Retailing)† |
1,292 | 56,354 | ||||||
| Mouwasat Medical Services Co. (Health Care Equipment & Services)† |
471 | 27,456 | ||||||
| Saudi National Bank (Banks)† |
7,042 | 111,252 | ||||||
| 280,682 | ||||||||
| Slovenia - 0.3% |
||||||||
| Krka dd Novo mesto (Pharmaceuticals, Biotechnology & Life Sciences)† |
179 | 16,276 | ||||||
| Shares | Value | |||||||
| COMMON STOCKS - 95.8% (continued) |
| |||||||
| South Africa - 1.4% |
||||||||
| Clicks Group Ltd. (Food & Staples Retailing)† |
2,121 | $35,947 | ||||||
| Discovery Ltd. (Insurance)*† |
7,600 | 49,776 | ||||||
| 85,723 | ||||||||
| South Korea - 5.6% |
||||||||
| Amorepacific Corp. (Household & Personal Products)† |
279 | 18,108 | ||||||
| Cheil Worldwide Inc. (Media & Entertainment)† |
3,865 | 66,229 | ||||||
| Coway Co., Ltd. (Consumer Durables & Apparel)† |
1,180 | 45,671 | ||||||
| LG H&H Co., Ltd. (Household & Personal Products)† |
116 | 41,424 | ||||||
| NAVER Corp. (Media & Entertainment)† |
567 | 67,216 | ||||||
| NCSoft Corp. (Media & Entertainment)† |
405 | 110,578 | ||||||
| 349,226 | ||||||||
| Taiwan - 10.8% |
||||||||
| Advantech Co., Ltd. (Technology Hardware & Equipment)† |
5,499 | 49,772 | ||||||
| Airtac International Group (Capital Goods)† |
3,800 | 87,283 | ||||||
| ASPEED Technology Inc. (Semiconductors & Semiconductor Equipment)† |
605 | 31,280 | ||||||
| Chipbond Technology Corp. (Semiconductors & Semiconductor Equipment)† |
31,000 | 52,206 | ||||||
| Delta Electronics Inc. (Technology Hardware & Equipment)† |
15,000 | 119,544 | ||||||
| Eclat Textile Co., Ltd. (Consumer Durables & Apparel)† |
4,000 | 52,456 | ||||||
| Hon Hai Precision Industry Co., Ltd. (Technology Hardware & Equipment)† |
39,000 | 123,765 | ||||||
| Silergy Corp. (Semiconductors & Semiconductor Equipment)† |
5,400 | 62,106 | ||||||
| Taiwan Semiconductor Manufacturing Co., Ltd. (Semiconductors & Semiconductor Equipment)† |
7,500 | 90,256 | ||||||
| 668,668 | ||||||||
| Thailand - 2.5% |
||||||||
| Bumrungrad Hospital pcl, Reg S (Health Care Equipment & Services)† |
11,200 | 66,800 | ||||||
| SCB X pcl, Reg S (Banks)† |
32,000 | 89,122 | ||||||
| 155,922 | ||||||||
| Turkey - 1.3% |
||||||||
| BIM Birlesik Magazalar AS (Food & Staples Retailing)† |
11,148 | 80,498 | ||||||
See Notes to Financial Statements
40
Table of Contents
Harding, Loevner Funds, Inc.
Emerging Markets Research Portfolio
Portfolio of Investments (continued)
October 31, 2022
| Shares | Value | |||||||
| COMMON STOCKS - 95.8% (continued) |
| |||||||
| United Arab Emirates - 1.7% |
||||||||
| Agthia Group PJSC (Food Beverage & Tobacco)† |
13,882 | $16,890 | ||||||
| Emaar Properties PJSC (Real Estate)† |
53,031 | 87,565 | ||||||
| 104,455 | ||||||||
| Vietnam - 2.6% |
||||||||
| Bank for Foreign Trade of Vietnam JSC (Banks)† |
19,446 | 57,732 | ||||||
| Hoa Phat Group JSC (Materials)† |
81,855 | 51,429 | ||||||
| Saigon Beer Alcohol Beverage Corp. (Food Beverage & Tobacco)† |
2,320 | 17,291 | ||||||
| Vietnam Dairy Products JSC (Food Beverage & Tobacco)† |
11,810 | 37,261 | ||||||
|
|
163,713 | |||||||
| Total Common Stocks (Cost $7,337,379) |
|
$5,953,741 | ||||||
| PREFERRED STOCKS - 2.3% |
||||||||
| Colombia - 0.5% |
||||||||
| Bancolombia SA - Sponsored ADR, 9.79% (Banks)+ |
1,139 | 28,897 | ||||||
| South Korea - 1.8% |
||||||||
| Samsung Electronics Co., Ltd. - GDR, Reg S, 2.94% (Technology Hardware & Equipment)+ |
122 | 114,192 | ||||||
| Total Preferred Stocks (Cost $154,675) |
$143,089 | |||||||
|
|
||||||||
| SHORT TERM INVESTMENTS - 1.3% |
| |||||||
| Northern Institutional Funds - Treasury Portfolio (Premier Shares), 2.48% (Money Market Funds) |
78,235 | 78,235 | ||||||
|
|
||||||||
| Total Short Term Investments (Cost $78,235) |
|
$78,235 | ||||||
|
|
||||||||
| Total Investments — 99.4% |
||||||||
| (Cost $7,570,289) |
$6,175,065 | |||||||
| Other Assets Less Liabilities - 0.6% |
38,737 | |||||||
| Net Assets — 100.0% |
$6,213,802 | |||||||
Summary of Abbreviations
| ADR | American Depositary Receipt |
| GDR | Global Depositary Receipt |
| Reg | S Security sold outside United States without registration under the Securities Act of 1933. |
| † | Investment categorized as level 2 security as disclosed in Note 2 of the Notes to Financial Statements. |
| * | Non-income producing security. |
| ^ | Security exempt from registration pursuant to Rule 144A of the Securities Act of 1933. These securities, which represent 2.8% of net assets as of October 31, 2022, are considered liquid and may be resold in transactions exempt from registration, normally to qualified buyers. |
| ‡ | Investments categorized as level 3 security that is effectively valued at zero. See Note 2 of the Notes to the Financial Statements. |
| + | Current yield is disclosed. Dividends are calculated based on a percentage of the issuer’s net income. |
| ^^ | Amount is less than 0.005%. |
| Industry | Percentage of Net Assets |
|||
| Automobiles & Components |
1.9 | % | ||
| Banks |
21.9 | |||
| Capital Goods |
6.1 | |||
| Consumer Durables & Apparel |
5.1 | |||
| Consumer Services |
1.7 | |||
| Diversified Financials |
4.3 | |||
| Energy |
1.0 | |||
| Food & Staples Retailing |
4.1 | |||
| Food Beverage & Tobacco |
7.0 | |||
| Health Care Equipment & Services |
2.0 | |||
| Household & Personal Products |
1.0 | |||
| Insurance |
2.8 | |||
| Materials |
3.4 | |||
| Media & Entertainment |
4.9 | |||
| Pharmaceuticals, Biotechnology & Life Sciences |
4.5 | |||
| Real Estate |
2.2 | |||
| Retailing |
3.6 | |||
| Semiconductors & Semiconductor Equipment |
4.8 | |||
| Software & Services |
2.3 | |||
| Technology Hardware & Equipment |
7.4 | |||
| Telecommunication Services |
0.6 | |||
| Transportation |
4.8 | |||
| Utilities |
0.7 | |||
| Money Market Fund |
1.3 | |||
| Total Investments |
99.4 | |||
| Other Assets Less Liabilities |
0.6 | |||
| Net Assets |
100.0 | % | ||
See Notes to Financial Statements
41
Table of Contents
Chinese Equity Portfolio
Portfolio of Investments
October 31, 2022
| Shares | Value | |||||||
| COMMON STOCKS - 97.4% |
| |||||||
| China - 80.7% |
||||||||
| Alibaba Group Holding Ltd. (Retailing)*† |
10,500 | $83,595 | ||||||
| ANTA Sports Products Ltd. (Consumer Durables & Apparel)† |
5,500 | 48,371 | ||||||
| Baidu Inc., Class A (Media & Entertainment)*† |
2,358 | 22,626 | ||||||
| Chacha Food Co., Ltd., Class A (Food Beverage & Tobacco)† |
4,602 | 27,689 | ||||||
| China Tourism Group Duty Free Corp., Ltd., Class A (Retailing)† |
3,400 | 74,207 | ||||||
| Contemporary Amperex Technology Co., Ltd., Class A (Capital Goods)† |
1,300 | 65,953 | ||||||
| Country Garden Services Holdings Co., Ltd. (Real Estate)† |
6,000 | 5,247 | ||||||
| CSPC Pharmaceutical Group Ltd. (Pharmaceuticals, Biotechnology & Life Sciences)† |
72,000 | 74,048 | ||||||
| ENN Energy Holdings Ltd. (Utilities)† |
5,100 | 50,589 | ||||||
| Foshan Haitian Flavouring & Food Co., Ltd., Class A (Food Beverage & Tobacco)† |
2,999 | 24,375 | ||||||
| Fuyao Glass Industry Group Co., Ltd., Class A (Automobiles & Components)† |
2,900 | 13,216 | ||||||
| Fuyao Glass Industry Group Co., Ltd., Class H (Automobiles & Components)^† |
9,200 | 32,935 | ||||||
| Haier Smart Home Co., Ltd., Class H (Consumer Durables & Apparel)† |
11,600 | 29,037 | ||||||
| Haitian International Holdings Ltd. (Capital Goods)† |
26,020 | 52,030 | ||||||
| Hangzhou Tigermed Consulting Co., Ltd., Class H (Pharmaceuticals, Biotechnology & Life Sciences)^† |
6,800 | 46,236 | ||||||
| Hefei Meiya Optoelectronic Technology Inc., Class A (Capital Goods)† |
17,880 | 57,953 | ||||||
| Hongfa Technology Co., Ltd., Class A (Capital Goods)† |
5,880 | 27,457 | ||||||
| Inner Mongolia Yili Industrial Group Co., Ltd., Class A (Food Beverage & Tobacco)† |
20,500 | 70,500 | ||||||
| JD.com Inc., Class A (Retailing)† |
2,971 | 55,477 | ||||||
| Jiangsu Hengrui Medicine Co., Ltd., Class A (Pharmaceuticals, Biotechnology & Life Sciences)† |
8,540 | 46,809 | ||||||
| Shares | Value | |||||||
| COMMON STOCKS - 97.4% (continued) |
| |||||||
| China - 80.7% (continued) |
||||||||
| Kweichow Moutai Co., Ltd., Class A (Food Beverage & Tobacco)† |
100 | $18,416 | ||||||
| Li Ning Co., Ltd. (Consumer Durables & Apparel)† |
4,000 | 20,701 | ||||||
| LONGi Green Energy Technology Co., Ltd., Class A (Semiconductors & Semiconductor Equipment)† |
10,560 | 69,101 | ||||||
| Midea Group Co., Ltd., Class A (Consumer Durables & Apparel)† |
11,300 | 61,831 | ||||||
| NetEase Inc. (Media & Entertainment)† |
4,100 | 45,618 | ||||||
| Qingdao Haier Biomedical Co., Ltd., Class A (Health Care Equipment & Services)† |
4,000 | 42,071 | ||||||
| Sangfor Technologies Inc., Class A (Software & Services)† |
1,529 | 26,253 | ||||||
| SF Holding Co., Ltd., Class A (Transportation)† |
7,600 | 50,009 | ||||||
| Shandong Sinocera Functional Material Co., Ltd., Class A (Materials)† |
9,800 | 30,808 | ||||||
| Shanghai Friendess Electronic Technology Corp., Ltd., Class A (Technology Hardware & Equipment)† |
1,030 | 28,848 | ||||||
| Shenzhen Inovance Technology Co., Ltd., Class A (Capital Goods)† |
7,800 | 70,932 | ||||||
| Shenzhou International Group Holdings Ltd. (Consumer Durables & Apparel)† |
7,000 | 48,314 | ||||||
| StarPower Semiconductor Ltd., Class A (Semiconductors & Semiconductor Equipment)† |
1,200 | 60,938 | ||||||
| Sunny Optical Technology Group Co., Ltd. (Technology Hardware & Equipment)† |
4,800 | 41,640 | ||||||
| Tencent Holdings Ltd. (Media & Entertainment)† |
4,000 | 104,959 | ||||||
| TravelSky Technology Ltd., Class H (Software & Services)† |
51,000 | 74,093 | ||||||
| Trip.com Group Ltd. (Consumer Services)*† |
1,996 | 45,194 | ||||||
| Wuliangye Yibin Co., Ltd., Class A (Food Beverage & Tobacco)† |
700 | 12,748 | ||||||
| WuXi AppTec Co., Ltd., Class A (Pharmaceuticals, Biotechnology & Life Sciences)† |
8,360 | 87,104 | ||||||
| Wuxi Biologics Cayman Inc. (Pharmaceuticals, Biotechnology & Life Sciences)*^† |
14,500 | 65,598 | ||||||
See Notes to Financial Statements
42
Table of Contents
Harding, Loevner Funds, Inc.
Chinese Equity Portfolio
Portfolio of Investments (continued)
October 31, 2022
| Shares | Value | |||||||
| COMMON STOCKS - 97.4% (continued) |
| |||||||
| China - 80.7% (continued) |
||||||||
| Yonyou Network Technology Co., Ltd., Class A (Software & Services)† |
17,300 | $57,642 | ||||||
| Zhejiang Sanhua Intelligent Controls Co., Ltd., Class A (Capital Goods)† |
23,800 | 68,829 | ||||||
| Zhejiang Shuanghuan Driveline Co., Ltd., Class A (Automobiles & Components)† |
9,200 | 35,690 | ||||||
| ZTO Express Cayman Inc. (Transportation)† |
1,350 | 22,885 | ||||||
| 2,098,572 | ||||||||
| Hong Kong - 10.2% |
||||||||
| AIA Group Ltd. (Insurance)† |
13,000 | 98,172 | ||||||
| ASMPT Ltd. (Semiconductors & Semiconductor Equipment)† |
4,100 | 22,485 | ||||||
| Budweiser Brewing Co. APAC Ltd. (Food Beverage & Tobacco)^† |
12,400 | 26,107 | ||||||
| Hong Kong Exchanges & Clearing Ltd. (Diversified Financials)† |
1,800 | 47,789 | ||||||
| Techtronic Industries Co., Ltd. (Capital Goods)† |
7,500 | 70,748 | ||||||
| 265,301 | ||||||||
| Taiwan - 6.5% |
||||||||
| Airtac International Group (Capital Goods)† |
4,300 | 98,767 | ||||||
| Delta Electronics Inc. (Technology Hardware & Equipment)† |
3,000 | 23,909 | ||||||
| Silergy Corp. (Semiconductors & Semiconductor Equipment)† |
4,000 | 46,005 | ||||||
| 168,681 | ||||||||
| Total Common Stocks (Cost $4,340,161) |
|
$2,532,554 | ||||||
|
|
||||||||
| SHORT TERM INVESTMENTS - 2.8% |
| |||||||
| Northern Institutional Funds - Treasury Portfolio (Premier Shares), 2.48% (Money Market Funds) |
72,238 | 72,238 | ||||||
| Total Short Term Investments (Cost $72,238) |
|
$72,238 | ||||||
|
|
||||||||
| Total Investments — 100.2% |
||||||||
| (Cost $4,412,399) |
$2,604,792 | |||||||
| Liabilities Less Other Assets - (0.2)% |
(4,456 | ) | ||||||
| Net Assets — 100.0% |
$2,600,336 | |||||||
| * | Non-income producing security. |
| † | Investment categorized as level 2 security as disclosed in Note 2 of the Notes to Financial Statements. |
| ^ | Security exempt from registration pursuant to Rule 144A of the Securities Act of 1933. These securities, which represent 6.6% of net assets as of October 31, 2022, are considered liquid and may be resold in transactions exempt from registration, normally to qualified buyers. |
| Industry | Percentage of Net Assets |
|||
| Automobiles & Components |
3.2 | % | ||
| Capital Goods |
19.6 | |||
| Consumer Durables & Apparel |
8.1 | |||
| Consumer Services |
1.7 | |||
| Diversified Financials |
1.8 | |||
| Food Beverage & Tobacco |
6.9 | |||
| Health Care Equipment & Services |
1.6 | |||
| Insurance |
3.8 | |||
| Materials |
1.2 | |||
| Media & Entertainment |
6.7 | |||
| Pharmaceuticals, Biotechnology & Life Sciences |
12.3 | |||
| Real Estate |
0.2 | |||
| Retailing |
8.2 | |||
| Semiconductors & Semiconductor Equipment |
7.7 | |||
| Software & Services |
6.1 | |||
| Technology Hardware & Equipment |
3.6 | |||
| Transportation |
2.8 | |||
| Utilities |
1.9 | |||
| Money Market Fund |
2.8 | |||
| Total Investments |
100.2 | |||
| Liabilities Less Other Assets |
(0.2 | ) | ||
| Net Assets |
100.0 | % | ||
See Notes to Financial Statements
43
Table of Contents
Emerging Markets ex China Portfolio
Portfolio of Investments
October 31, 2022
| Shares | Value | |||||||
| COMMON STOCKS - 93.7% |
| |||||||
| Brazil - 11.3% |
||||||||
| B3 SA - Brasil Bolsa Balcao (Diversified Financials) |
12,400 | $36,104 | ||||||
| Localiza Rent a Car SA (Transportation) |
6,518 | 89,010 | ||||||
| Lojas Renner SA (Retailing)* |
11,000 | 65,802 | ||||||
| Magazine Luiza SA (Retailing)* |
49,300 | 42,662 | ||||||
| WEG SA (Capital Goods) |
11,400 | 88,896 | ||||||
| XP Inc., Class A (Diversified Financials)* |
1,209 | 22,161 | ||||||
| 344,635 | ||||||||
| Colombia - 1.3% |
||||||||
| Ecopetrol SA - Sponsored ADR (Energy) |
3,995 | 39,391 | ||||||
| Czech Republic - 1.0% |
||||||||
| Komercni banka AS (Banks)† |
1,107 | 31,726 | ||||||
| Egypt - 0.5% |
||||||||
| Commercial International Bank Egypt SAE - GDR, Reg S (Banks) |
12,477 | 15,846 | ||||||
| India - 15.4% |
||||||||
| Asian Paints Ltd. (Materials)† |
1,531 | 57,567 | ||||||
| HDFC Bank Ltd. (Banks)† |
4,299 | 77,670 | ||||||
| Housing Development Finance Corp., Ltd. (Diversified Financials)† |
2,556 | 76,202 | ||||||
| Kotak Mahindra Bank Ltd. (Banks)† |
2,775 | 63,827 | ||||||
| Maruti Suzuki India Ltd. (Automobiles & Components)† |
604 | 69,570 | ||||||
| Tata Consultancy Services Ltd. (Software & Services)† |
3,227 | 124,379 | ||||||
| 469,215 | ||||||||
| Indonesia - 6.4% |
||||||||
| Astra International Tbk PT (Automobiles & Components)† |
132,800 | 56,500 | ||||||
| Bank Central Asia Tbk PT (Banks)† |
72,700 | 40,966 | ||||||
| Bank Rakyat Indonesia Persero Tbk PT (Banks)† |
205,400 | 61,124 | ||||||
| Telkom Indonesia Persero Tbk PT (Telecommunication Services)† |
129,800 | 36,606 | ||||||
| 195,196 | ||||||||
| Italy - 2.1% |
||||||||
| Tenaris SA - ADR (Energy) |
2,011 | 63,186 | ||||||
| Mexico - 11.9% |
||||||||
| Fomento Economico Mexicano SAB de CV - Sponsored ADR (Food Beverage & Tobacco) |
1,155 | 82,721 | ||||||
| Shares | Value | |||||||
| COMMON STOCKS - 93.7% (continued) |
| |||||||
| Mexico - 11.9% (continued) |
||||||||
| Grupo Aeroportuario del Sureste SAB de CV - ADR (Transportation) |
297 | $69,326 | ||||||
| Grupo Financiero Banorte SAB de CV, Series O (Banks) |
11,700 | 95,103 | ||||||
| Wal-Mart de Mexico SAB de CV (Food & Staples Retailing) |
29,300 | 113,175 | ||||||
| 360,325 | ||||||||
| Panama - 2.1% |
||||||||
| Copa Holdings SA, Class A (Transportation)* |
860 | 64,698 | ||||||
| Saudi Arabia - 1.5% |
||||||||
| Mouwasat Medical Services Co. (Health Care Equipment & Services)† |
757 | 44,128 | ||||||
| South Africa - 3.7% |
||||||||
| Clicks Group Ltd. (Food & Staples Retailing)† |
2,474 | 41,929 | ||||||
| Discovery Ltd. (Insurance)*† |
4,720 | 30,914 | ||||||
| Standard Bank Group Ltd. (Banks)† |
4,119 | 38,521 | ||||||
| 111,364 | ||||||||
| South Korea - 10.3% |
||||||||
| Coway Co., Ltd. (Consumer Durables & Apparel)† |
861 | 33,324 | ||||||
| LG H&H Co., Ltd. (Household & Personal Products)† |
134 | 47,852 | ||||||
| NAVER Corp. (Media & Entertainment)† |
285 | 33,786 | ||||||
| NCSoft Corp. (Media & Entertainment)† |
193 | 52,695 | ||||||
| Samsung Electronics Co., Ltd. - GDR, Reg S (Technology Hardware & Equipment)† |
142 | 146,541 | ||||||
| 314,198 | ||||||||
| Taiwan - 13.0% |
||||||||
| Advantech Co., Ltd. (Technology Hardware & Equipment)† |
4,000 | 36,205 | ||||||
| Airtac International Group (Capital Goods)† |
2,400 | 55,126 | ||||||
| ASPEED Technology Inc. (Semiconductors & Semiconductor Equipment)† |
800 | 41,361 | ||||||
| Eclat Textile Co., Ltd. (Consumer Durables & Apparel)† |
5,000 | 65,570 | ||||||
| Hon Hai Precision Industry Co., Ltd. (Technology Hardware & Equipment)† |
19,000 | 60,296 | ||||||
| Silergy Corp. (Semiconductors & Semiconductor Equipment)† |
2,500 | 28,753 | ||||||
See Notes to Financial Statements
44
Table of Contents
Harding, Loevner Funds, Inc.
Emerging Markets ex China Portfolio
Portfolio of Investments (continued)
October 31, 2022
| Shares | Value | |||||||
| COMMON STOCKS - 93.7% (continued) |
| |||||||
| Taiwan - 13.0% (continued) |
||||||||
| Taiwan Semiconductor Manufacturing Co., Ltd. (Semiconductors & Semiconductor Equipment)† |
9,000 | $108,307 | ||||||
| 395,618 | ||||||||
| Thailand - 3.0% |
||||||||
| Bangkok Dusit Medical Services pcl, Class F, Reg S (Health Care Equipment & Services)† |
64,700 | 50,148 | ||||||
| SCB X pcl, Reg S (Banks)† |
14,500 | 40,384 | ||||||
| 90,532 | ||||||||
| United Arab Emirates - 1.7% |
||||||||
| Emaar Properties PJSC (Real Estate)† |
30,726 | 50,734 | ||||||
| United Kingdom - 4.7% |
||||||||
| Bank of Georgia Group plc (Banks) |
1,285 | 31,315 | ||||||
| Coca-Cola HBC AG - CDI (Food Beverage & Tobacco)*† |
3,176 | 69,252 | ||||||
| Network International Holdings plc (Software & Services)*^† |
11,020 | 41,140 | ||||||
| 141,707 | ||||||||
| United States - 3.8% |
||||||||
| EPAM Systems Inc. (Software & Services)* |
326 | 114,100 | ||||||
| Total Common Stocks (Cost $2,925,929) |
|
$2,846,599 | ||||||
|
|
||||||||
| PREFERRED STOCKS - 2.7% |
||||||||
| Brazil - 1.8% |
||||||||
| Itau Unibanco Holding SA - Sponsored ADR (Banks)* |
9,713 | 56,530 | ||||||
| Colombia - 0.9% |
||||||||
| Bancolombia SA - Sponsored ADR, 9.79% (Banks)+ |
1,033 | 26,207 | ||||||
| Total Preferred Stocks (Cost $79,429) |
|
$82,737 | ||||||
|
|
||||||||
| SHORT TERM INVESTMENTS - 2.0% |
| |||||||
| Northern Institutional Funds - Treasury Portfolio (Premier Shares), 2.48% (Money Market Funds) |
60,933 | 60,933 | ||||||
| Shares | Value | |||||||
| SHORT TERM INVESTMENTS - 2.0% (continued) |
| |||||||
| Total Short Term Investments (Cost $60,933) |
|
$60,933 | ||||||
|
|
||||||||
| Total Investments — 98.4% |
||||||||
| (Cost $3,066,291) |
$2,990,269 | |||||||
| Other Assets Less Liabilities - 1.6% |
48,564 | |||||||
| Net Assets — 100.0% |
$3,038,833 | |||||||
Summary of Abbreviations
| ADR | American Depositary Receipt |
| CDI | Chess Depositary Interest |
| GDR | Global Depositary Receipt |
| Reg | S Security sold outside United States without registration under the Securities Act of 1933. |
| * | Non-income producing security. |
| † | Investment categorized as level 2 security as disclosed in Note 2 of the Notes to Financial Statements. |
| ^ | Security exempt from registration pursuant to Rule 144A of the Securities Act of 1933. These securities, which represent 1.4% of net assets as of October 31, 2022, are considered liquid and may be resold in transactions exempt from registration, normally to qualified buyers. |
| + | Current yield is disclosed. Dividends are calculated based on a percentage of the issuer’s net income. |
See Notes to Financial Statements
45
Table of Contents
Harding, Loevner Funds, Inc.
Emerging Markets ex China Portfolio
Portfolio of Investments (continued)
October 31, 2022
| Industry | Percentage of Net Assets |
|||
| Automobiles & Components |
4.2 | % | ||
| Banks |
18.9 | |||
| Capital Goods |
4.7 | |||
| Consumer Durables & Apparel |
3.2 | |||
| Diversified Financials |
4.4 | |||
| Energy |
3.4 | |||
| Food & Staples Retailing |
5.1 | |||
| Food Beverage & Tobacco |
5.0 | |||
| Health Care Equipment & Services |
3.2 | |||
| Household & Personal Products |
1.6 | |||
| Insurance |
1.0 | |||
| Materials |
1.9 | |||
| Media & Entertainment |
2.8 | |||
| Real Estate |
1.7 | |||
| Retailing |
3.6 | |||
| Semiconductors & Semiconductor Equipment |
5.9 | |||
| Software & Services |
9.3 | |||
| Technology Hardware & Equipment |
8.0 | |||
| Telecommunication Services |
1.2 | |||
| Transportation |
7.3 | |||
| Money Market Fund |
2.0 | |||
| Total Investments |
98.4 | |||
| Other Assets Less Liabilities |
1.6 | |||
| Net Assets |
100.0 | % | ||
See Notes to Financial Statements
46
Table of Contents
International Developed Markets Equity Portfolio
Portfolio of Investments
October 31, 2022
| Shares | Value | |||||||
| COMMON STOCKS - 94.8% |
| |||||||
| Australia - 3.5% |
||||||||
| BHP Group Ltd. - Sponsored ADR (Materials) |
1,231 | $58,866 | ||||||
| Woodside Energy Group Ltd. - ADR (Energy) |
463 | 10,728 | ||||||
| 69,594 | ||||||||
| Brazil - 0.7% |
||||||||
| Ambev SA - ADR (Food Beverage & Tobacco) |
2,729 | 8,296 | ||||||
| XP Inc., Class A (Diversified Financials)* |
287 | 5,261 | ||||||
| 13,557 | ||||||||
| Canada - 4.8% |
||||||||
| Alimentation Couche-Tard Inc. (Food & Staples Retailing) |
800 | 35,820 | ||||||
| Canadian National Railway Co. (Transportation) |
224 | 26,531 | ||||||
| Manulife Financial Corp. (Insurance) |
2,000 | 33,149 | ||||||
| 95,500 | ||||||||
| China - 2.4% |
||||||||
| CSPC Pharmaceutical Group Ltd. (Pharmaceuticals, Biotechnology & Life Sciences)† |
10,000 | 10,284 | ||||||
| ENN Energy Holdings Ltd. (Utilities)† |
700 | 6,944 | ||||||
| Haier Smart Home Co., Ltd., Class A (Consumer Durables & Apparel)† |
2,800 | 7,941 | ||||||
| Ping An Insurance Group Co. of China Ltd., Class H (Insurance)† |
1,000 | 4,002 | ||||||
| Tencent Holdings Ltd. (Media & Entertainment)† |
600 | 15,744 | ||||||
| Zhejiang Sanhua Intelligent Controls Co., Ltd., Class A (Capital Goods)† |
1,200 | 3,470 | ||||||
| 48,385 | ||||||||
| Denmark - 1.1% |
||||||||
| Novozymes A/S, Class B (Materials)† |
409 | 21,456 | ||||||
| France - 11.4% |
||||||||
| Air Liquide SA (Materials)† |
206 | 26,908 | ||||||
| Dassault Systemes SE (Software & Services)† |
912 | 30,534 | ||||||
| Kering SA (Consumer Durables & Apparel)† |
64 | 29,295 | ||||||
| L’Oreal SA (Household & Personal Products)† |
243 | 76,293 | ||||||
| Schneider Electric SE (Capital Goods)† |
504 | 63,784 | ||||||
| 226,814 | ||||||||
| Germany - 9.3% |
||||||||
| Allianz SE, Reg S (Insurance)† |
320 | 57,612 | ||||||
| Shares | Value | |||||||
| COMMON STOCKS - 94.8% (continued) |
| |||||||
| Germany - 9.3% (continued) |
||||||||
| Infineon Technologies AG (Semiconductors & Semiconductor Equipment)† |
2,507 | $61,037 | ||||||
| SAP SE - Sponsored ADR (Software & Services) |
348 | 33,429 | ||||||
| Symrise AG (Materials)† |
313 | 31,969 | ||||||
| 184,047 | ||||||||
| Hong Kong - 2.9% |
||||||||
| AIA Group Ltd. (Insurance)† |
7,600 | 57,393 | ||||||
| India - 1.2% |
||||||||
| HDFC Bank Ltd. - ADR (Banks) |
149 | 9,284 | ||||||
| ICICI Bank Ltd. - Sponsored ADR (Banks) |
704 | 15,516 | ||||||
| 24,800 | ||||||||
| Indonesia - 0.5% |
||||||||
| Telkom Indonesia Persero Tbk PT (Telecommunication Services)† |
36,500 | 10,294 | ||||||
| Japan - 16.4% |
||||||||
| Chugai Pharmaceutical Co., Ltd. (Pharmaceuticals, Biotechnology & Life Sciences)† |
1,200 | 27,825 | ||||||
| Daifuku Co., Ltd. (Capital Goods)† |
500 | 22,913 | ||||||
| FANUC Corp. (Capital Goods)† |
100 | 13,143 | ||||||
| Keyence Corp. (Technology Hardware & Equipment)† |
100 | 37,688 | ||||||
| Komatsu Ltd. (Capital Goods)† |
1,500 | 28,711 | ||||||
| Kubota Corp. (Capital Goods)† |
2,200 | 30,691 | ||||||
| Nitori Holdings Co., Ltd. (Retailing)† |
200 | 18,107 | ||||||
| Shimano Inc. (Consumer Durables & Apparel)† |
200 | 31,013 | ||||||
| Shionogi & Co., Ltd. (Pharmaceuticals, Biotechnology & Life Sciences)† |
700 | 32,427 | ||||||
| Shiseido Co., Ltd. (Household & Personal Products)† |
700 | 24,253 | ||||||
| Sysmex Corp. (Health Care Equipment & Services)† |
400 | 21,578 | ||||||
| Unicharm Corp. (Household & Personal Products)† |
1,200 | 36,559 | ||||||
| 324,908 | ||||||||
| Mexico - 0.6% |
||||||||
| Fomento Economico Mexicano |
||||||||
| SAB de CV - Sponsored |
||||||||
| ADR (Food Beverage & Tobacco) |
163 | 11,674 | ||||||
| Netherlands - 2.4% |
||||||||
| Adyen NV (Software & Services)*^† |
34 | 48,706 | ||||||
See Notes to Financial Statements
47
Table of Contents
Harding, Loevner Funds, Inc.
International Developed Markets Equity Portfolio
Portfolio of Investments (continued)
October 31, 2022
| Shares | Value | |||||||
| COMMON STOCKS - 94.8% (continued) |
| |||||||
| Singapore - 3.9% |
||||||||
| DBS Group Holdings Ltd. (Banks)† |
3,200 | $77,266 | ||||||
| South Korea - 1.2% |
||||||||
| Samsung Electronics Co., Ltd. - GDR, Reg S (Technology Hardware & Equipment)† |
23 | 23,735 | ||||||
| Spain - 2.0% |
||||||||
| Banco Bilbao Vizcaya Argentaria SA (Banks)† |
7,925 | 40,725 | ||||||
| Sweden - 9.4% |
||||||||
| Alfa Laval AB (Capital Goods)† |
1,292 | 31,766 | ||||||
| Atlas Copco AB, Class A (Capital Goods)† |
6,900 | 73,667 | ||||||
| Epiroc AB, Class A (Capital Goods)† |
1,936 | 29,602 | ||||||
| Skandinaviska Enskilda Banken AB, Class A (Banks)† |
4,822 | 50,830 | ||||||
| 185,865 | ||||||||
| Switzerland - 11.7% |
||||||||
| Alcon Inc. (Health Care Equipment & Services) |
616 | 37,379 | ||||||
| Lonza Group AG, Reg S (Pharmaceuticals, Biotechnology & Life Sciences)† |
99 | 50,895 | ||||||
| Nestle SA, Reg S (Food Beverage & Tobacco)† |
334 | 36,353 | ||||||
| Roche Holding AG, Genusschein (Pharmaceuticals, Biotechnology & Life Sciences)† |
242 | 80,429 | ||||||
| Sonova Holding AG, Reg S (Health Care Equipment & Services)† |
113 | 26,686 | ||||||
| 231,742 | ||||||||
| Taiwan - 0.7% |
||||||||
| Taiwan Semiconductor Manufacturing Co., Ltd. - Sponsored ADR (Semiconductors & Semiconductor Equipment) |
215 | 13,233 | ||||||
| United Kingdom - 6.9% |
||||||||
| Rio Tinto plc (Materials) |
842 | 43,810 | ||||||
| Shell plc (Energy)† |
2,101 | 58,236 | ||||||
| Standard Chartered plc (Banks) |
5,990 | 35,734 | ||||||
| 137,780 | ||||||||
| United States - 1.8% |
||||||||
| Linde plc (Materials)† |
118 | 35,303 | ||||||
|
|
||||||||
| Total Common Stocks (Cost $1,821,738) |
|
$1,882,777 | ||||||
| Shares | Value | |||||||
| SHORT TERM INVESTMENTS - 0.0%^^ |
| |||||||
| Northern Institutional Funds - Treasury Portfolio (Premier Shares), 2.48% (Money Market Funds) |
949 | $949 | ||||||
|
|
||||||||
| Total Short Term Investments (Cost $949) |
|
$949 | ||||||
|
|
||||||||
| Total Investments — 94.8% |
||||||||
| (Cost $1,822,687) |
$1,883,726 | |||||||
| Other Assets Less Liabilities - 5.2% |
102,923 | |||||||
| Net Assets — 100.0% |
$1,986,649 | |||||||
Summary of Abbreviations
| ADR | American Depositary Receipt |
| GDR | Global Depositary Receipt |
| Reg | S Security sold outside United States without registration under the Securities Act of 1933. |
| * | Non-income producing security. |
| † | Investment categorized as level 2 security as disclosed in Note 2 of the Notes to Financial Statements. |
| ^ | Security exempt from registration pursuant to Rule 144A of the Securities Act of 1933. These securities, which represent 2.5% of net assets as of October 31, 2022, are considered liquid and may be resold in transactions exempt from registration, normally to qualified buyers. |
| ^^ | Amount is less than 0.005%. |
See Notes to Financial Statements
48
Table of Contents
Harding, Loevner Funds, Inc.
International Developed Markets Equity Portfolio
Portfolio of Investments (continued)
October 31, 2022
| Industry | Percentage of Net Assets |
|||
| Banks |
11.5 | % | ||
| Capital Goods |
15.1 | |||
| Consumer Durables & Apparel |
3.5 | |||
| Diversified Financials |
0.3 | |||
| Energy |
3.4 | |||
| Food & Staples Retailing |
1.8 | |||
| Food Beverage & Tobacco |
2.8 | |||
| Health Care Equipment & Services |
4.3 | |||
| Household & Personal Products |
6.8 | |||
| Insurance |
7.7 | |||
| Materials |
11.1 | |||
| Media & Entertainment |
0.8 | |||
| Pharmaceuticals, Biotechnology & Life Sciences |
10.2 | |||
| Retailing |
0.9 | |||
| Semiconductors & Semiconductor Equipment |
3.8 | |||
| Software & Services |
5.6 | |||
| Technology Hardware & Equipment |
3.1 | |||
| Telecommunication Services |
0.5 | |||
| Transportation |
1.3 | |||
| Utilities |
0.3 | |||
| Money Market Fund |
0.0 | ^^ | ||
| Total Investments |
94.8 | |||
| Other Assets Less Liabilities |
5.2 | |||
| Net Assets |
100.0 | % | ||
| ^^ | Amount is less than 0.005%. |
See Notes to Financial Statements
49
Table of Contents
Statements of Assets and Liabilities
October 31, 2022
| Global Equity Portfolio |
International Equity Portfolio |
International Small Companies Portfolio |
Institutional Emerging Markets Portfolio |
|||||||||||||
| ASSETS: |
||||||||||||||||
| Investments (cost $936,477,042, $12,489,731,960, $501,719,776 and $2,684,132,957, respectively) |
$1,009,400,311 | $13,996,910,172 | $483,657,295 | $2,670,288,728 | ||||||||||||
| Dividends and interest receivable |
391,731 | 11,546,496 | 497,972 | 1,568,385 | ||||||||||||
| Foreign currency (cost $—, $3,691,278, $159,729 and $7,343,218, respectively) |
— | 3,706,046 | 145,453 | 7,308,569 | ||||||||||||
| Receivable for investments sold |
4,913,711 | 47,055,835 | 3,503,546 | 989,615 | ||||||||||||
| Receivable for Fund shares sold |
6,361,277 | 15,588,889 | 1,544,927 | 2,453,540 | ||||||||||||
| Tax reclaims receivable |
669,545 | 29,949,131 | 521,014 | 94,337 | ||||||||||||
| Capital gain tax refund receivable |
— | — | — | 936 | ||||||||||||
| Prepaid expenses |
33,389 | 123,945 | 34,114 | 134,790 | ||||||||||||
| Total Assets: |
1,021,769,964 | 14,104,880,514 | 489,904,321 | 2,682,838,900 | ||||||||||||
| LIABILITIES: |
||||||||||||||||
| Payable to Investment Adviser |
(631,044 | ) | (8,054,435 | ) | (386,086 | ) | (2,292,844 | ) | ||||||||
| Payable for investments purchased |
(5,086,417 | ) | (38,763,766 | ) | (848,200 | ) | — | |||||||||
| Payable for Fund shares redeemed |
(497,153 | ) | (29,250,324 | ) | (438,421 | ) | (8,022,626 | ) | ||||||||
| Payable for directors’ fees and expenses |
(12,946 | ) | (187,846 | ) | (6,328 | ) | (38,358 | ) | ||||||||
| Payable for distribution fees |
— | (123,329 | ) | (24,003 | ) | — | ||||||||||
| Deferred capital gains tax |
— | — | (47,787 | ) | (7,102,781 | ) | ||||||||||
| Other liabilities |
(328,052 | ) | (3,051,288 | ) | (168,381 | ) | (969,465 | ) | ||||||||
| Total Liabilities |
(6,555,612 | ) | (79,430,988 | ) | (1,919,206 | ) | (18,426,074 | ) | ||||||||
| Net Assets |
$1,015,214,352 | $14,025,449,526 | $487,985,115 | $2,664,412,826 | ||||||||||||
| ANALYSIS OF NET ASSETS: |
||||||||||||||||
| Paid in capital |
$952,811,995 | $12,358,422,435 | $507,347,928 | $2,812,906,111 | ||||||||||||
| Distributable earnings |
62,402,357 | 1,667,027,091 | (19,362,813 | ) | (148,493,285 | ) | ||||||||||
| Net Assets |
$1,015,214,352 | $14,025,449,526 | $487,985,115 | $2,664,412,826 | ||||||||||||
| Net Assets: |
||||||||||||||||
| Institutional Class |
$753,479,881 | $11,113,757,358 | $457,624,235 | $2,301,999,668 | ||||||||||||
| Institutional Class Z |
234,800,111 | 2,715,026,456 | — | 362,413,158 | ||||||||||||
| Investor Class |
— | 196,665,712 | 30,360,880 | — | ||||||||||||
| Advisor Class |
26,934,360 | — | — | — | ||||||||||||
| Total Shares Outstanding: |
||||||||||||||||
| Institutional Class (500,000,000, 700,000,000, 500,000,000 and 500,000,000, respectively, $.001 par value shares authorized) |
24,424,997 | 518,859,877 | 30,101,605 | 144,168,868 | ||||||||||||
| Institutional Class Z (200,000,000, 300,000,000, — and 500,000,000,respectively, $.001 par value shares authorized) |
7,604,015 | 126,742,680 | — | 22,628,382 | ||||||||||||
| Investor Class (—, 100,000,000, 400,000,000 and —, respectively, $.001 par value shares authorized) |
— | 9,203,131 | 2,023,623 | — | ||||||||||||
| Advisor Class (400,000,000, —, — and —, respectively, $.001 par value shares authorized) |
877,209 | — | — | — | ||||||||||||
| Net Asset Value, Offering Price and Redemption Price Per Share: |
||||||||||||||||
| Institutional Class |
$30.85 | $21.42 | $15.20 | $15.97 | ||||||||||||
| Institutional Class Z |
30.88 | 21.42 | — | 16.02 | ||||||||||||
| Investor Class |
— | 21.37 | 15.00 | — | ||||||||||||
| Advisor Class |
30.70 | — | — | — | ||||||||||||
See Notes to Financial Statements
50
Table of Contents
Harding, Loevner Funds, Inc.
Statements of Assets and Liabilities (continued)
October 31, 2022
| Emerging Markets Portfolio |
Frontier Portfolio |
Global Equity |
International Research |
|||||||||||||
| ASSETS: |
||||||||||||||||
| Investments (cost $1,255,950,730, $159,297,330, $7,503,477 and $11,927,840, respectively) |
$1,399,786,852 | $167,882,810 | $7,243,566 | $10,380,994 | ||||||||||||
| Dividends and interest receivable |
820,951 | 529,378 | 9,249 | 15,774 | ||||||||||||
| Foreign currency (cost $6,639,034, $3,274,006, $151 and $535, respectively) |
6,548,292 | 3,145,800 | 151 | 535 | ||||||||||||
| Receivable for investments sold |
509,566 | 717,085 | — | — | ||||||||||||
| Receivable for Fund shares sold |
942,952 | 253,788 | — | — | ||||||||||||
| Tax reclaims receivable |
313,645 | 4,926 | 3,000 | 13,159 | ||||||||||||
| Prepaid expenses |
29,690 | 23,351 | 27,857 | 23,095 | ||||||||||||
| Total Assets: |
1,408,951,948 | 172,557,138 | 7,283,823 | 10,433,557 | ||||||||||||
| LIABILITIES: |
||||||||||||||||
| Payable to Investment Adviser |
(1,220,688 | ) | (198,872 | ) | (4,209 | ) | (6,068 | ) | ||||||||
| Payable for investments purchased |
— | — | (14,542 | ) | (26,215 | ) | ||||||||||
| Payable for Fund shares redeemed |
(5,338,461 | ) | (123,440 | ) | — | — | ||||||||||
| Payable for directors’ fees and expenses |
(20,126 | ) | (2,277 | ) | (92 | ) | (134 | ) | ||||||||
| Payable for distribution fees |
— | (15,948 | ) | — | — | |||||||||||
| Deferred capital gains tax |
(3,778,074 | ) | (418,698 | ) | (2,692 | ) | (5,693 | ) | ||||||||
| Other liabilities |
(833,584 | ) | (113,727 | ) | (40,294 | ) | (48,745 | ) | ||||||||
| Total Liabilities |
(11,190,933 | ) | (872,962 | ) | (61,829 | ) | (86,855 | ) | ||||||||
| Net Assets |
$1,397,761,015 | $171,684,176 | $7,221,994 | $10,346,702 | ||||||||||||
| ANALYSIS OF NET ASSETS: |
||||||||||||||||
| Paid in capital |
$1,198,303,848 | $273,029,506 | $7,068,048 | $11,567,504 | ||||||||||||
| Distributable earnings |
199,457,167 | (101,345,330 | ) | 153,946 | (1,220,802 | ) | ||||||||||
| Net Assets |
$1,397,761,015 | $171,684,176 | $7,221,994 | $10,346,702 | ||||||||||||
| Net Assets: |
||||||||||||||||
| Institutional Class |
$— | $— | $7,221,994 | $10,346,702 | ||||||||||||
| Institutional Class I |
— | 74,803,513 | — | — | ||||||||||||
| Institutional Class II |
— | 90,188,255 | — | — | ||||||||||||
| Investor Class |
— | 6,692,408 | — | — | ||||||||||||
| Advisor Class |
1,397,761,015 | — | — | — | ||||||||||||
| Total Shares Outstanding: |
||||||||||||||||
| Institutional Class (—, —, 400,000,000 and 400,000,000, respectively, $.001 par value shares authorized) |
— | — | 660,793 | 1,135,903 | ||||||||||||
| Institutional Class I (—, 400,000,000, — and —, respectively, $.001 par value shares authorized) |
— | 11,004,658 | — | — | ||||||||||||
| Institutional Class II (—, 200,000,000, — and —, respectively, $.001 par value shares authorized) |
— | 13,159,273 | — | — | ||||||||||||
| Investor Class (—, 400,000,000, — and —, respectively, $.001 par value shares authorized) |
— | 990,671 | — | — | ||||||||||||
| Advisor Class (500,000,000, —, — and —, respectively, $.001 par value shares authorized) |
36,124,297 | — | — | — | ||||||||||||
| Net Asset Value, Offering Price and Redemption Price Per Share: |
||||||||||||||||
| Institutional Class |
$— | $— | $10.93 | $9.11 | ||||||||||||
| Institutional Class I |
— | 6.80 | — | — | ||||||||||||
| Institutional Class II |
— | 6.85 | — | — | ||||||||||||
| Investor Class |
— | 6.76 | — | — | ||||||||||||
| Advisor Class |
38.69 | — | — | — | ||||||||||||
See Notes to Financial Statements
51
Table of Contents
Harding, Loevner Funds, Inc.
Statements of Assets and Liabilities (continued)
October 31, 2022
| Emerging Markets Research Portfolio |
Chinese Equity Portfolio |
Emerging Markets ex China Portfolio |
International Developed Markets Equity Portfolio |
|||||||||||||
| ASSETS: |
||||||||||||||||
| Investments (cost $7,570,289, $4,412,399, $3,066,291 and $1,822,687, respectively) |
$6,175,065 | $2,604,792 | $2,990,269 | $1,883,726 | ||||||||||||
| Dividends and interest receivable |
5,778 | 148 | 2,178 | 1,406 | ||||||||||||
| Foreign currency (cost $66,675, $—, $429 and $—, respectively) |
61,978 | — | 424 | — | ||||||||||||
| Receivable for investments sold |
— | 19,610 | — | 60,648 | ||||||||||||
| Tax reclaims receivable |
— | — | — | 76 | ||||||||||||
| Prepaid offering fees |
— | — | 30,641 | 12,692 | ||||||||||||
| Prepaid expenses |
25,353 | 23,661 | 49,855 | 62,884 | ||||||||||||
| Total Assets: |
6,268,174 | 2,648,211 | 3,073,367 | 2,021,432 | ||||||||||||
| LIABILITIES: |
||||||||||||||||
| Payable to Investment Adviser |
(5,333 | ) | (2,309 | ) | (2,493 | ) | (1,162 | ) | ||||||||
| Payable for investments purchased |
— | (13,165 | ) | — | — | |||||||||||
| Payable for directors’ fees and expenses |
(85 | ) | (40 | ) | (11 | ) | (10 | ) | ||||||||
| Deferred capital gains tax |
(6,471 | ) | — | — | — | |||||||||||
| Other liabilities |
(42,483 | ) | (32,361 | ) | (32,030 | ) | (33,611 | ) | ||||||||
| Total Liabilities |
(54,372 | ) | (47,875 | ) | (34,534 | ) | (34,783 | ) | ||||||||
| Net Assets |
$6,213,802 | $2,600,336 | $3,038,833 | $1,986,649 | ||||||||||||
| ANALYSIS OF NET ASSETS: |
||||||||||||||||
| Paid in capital |
$7,828,012 | $5,182,603 | $3,108,040 | $1,920,768 | ||||||||||||
| Distributable earnings |
(1,614,210 | ) | (2,582,267 | ) | (69,207 | ) | 65,881 | |||||||||
| Net Assets |
$6,213,802 | $2,600,336 | $3,038,833 | $1,986,649 | ||||||||||||
| Net Assets: |
||||||||||||||||
| Institutional Class |
$6,213,802 | $2,600,336 | $3,038,833 | $1,986,649 | ||||||||||||
| Total Shares Outstanding: |
||||||||||||||||
| Institutional Class (400,000,000, 500,000,000, 500,000,000 and 500,000,000, respectively, $.001 par value shares authorized) |
745,963 | 517,512 | 310,900 | 192,100 | ||||||||||||
| Net Asset Value, Offering Price and Redemption Price Per Share: |
||||||||||||||||
| Institutional Class |
$8.33 | $5.02 | $9.77 | $10.34 | ||||||||||||
See Notes to Financial Statements
52
Table of Contents
Statements of Operations
For the Fiscal Year Ended October 31, 2022
| Global Equity Portfolio |
International Portfolio |
International Small Companies Portfolio |
Institutional Markets Portfolio |
Emerging Markets |
Frontier Emerging Markets Portfolio |
|||||||||||||||||||
| INVESTMENT INCOME |
||||||||||||||||||||||||
| Dividends (net of foreign withholding taxes of $652,175, $25,568,158, $959,855, $9,890,958, $5,842,442 and $511,897, respectively) |
$9,291,005 | $432,407,443 | $10,244,833 | $83,352,515 | $49,462,267 | $6,639,717 | ||||||||||||||||||
| Non-cash dividends |
711,452 | — | — | 6,946,676 | 3,958,305 | — | ||||||||||||||||||
| Total investment income |
10,002,457 | 432,407,443 | 10,244,833 | 90,299,191 | 53,420,572 | 6,639,717 | ||||||||||||||||||
| EXPENSES |
||||||||||||||||||||||||
| Investment advisory fees (Note 3) |
9,948,340 | 121,105,718 | 5,003,321 | 43,417,591 | 25,463,098 | 2,587,984 | ||||||||||||||||||
| Administration fees (Note 3) |
191,736 | 2,488,886 | 82,140 | 618,053 | 360,815 | 36,244 | ||||||||||||||||||
| Distribution fees, Investor Class |
— | 800,183 | 97,790 | — | — | 19,826 | ||||||||||||||||||
| Custody and accounting fees (Note 3) |
154,464 | 2,317,848 | 179,414 | 1,602,828 | 957,257 | 189,047 | ||||||||||||||||||
| Directors’ fees and expenses |
50,435 | 698,590 | 20,617 | 169,000 | 97,124 | 7,537 | ||||||||||||||||||
| Transfer agent fees and expenses (Note 3) |
8,672 | 301,914 | 1,119 | 16,583 | — | 1,985 | ||||||||||||||||||
| Printing and postage fees |
9,910 | 457,272 | 32,572 | 121,543 | 169,230 | 3,276 | ||||||||||||||||||
| State registration filing fees |
68,609 | 174,306 | 51,525 | 67,989 | 64,564 | 53,807 | ||||||||||||||||||
| Professional fees |
71,242 | 489,854 | 54,640 | 185,286 | 137,087 | 50,287 | ||||||||||||||||||
| Shareholder servicing fees (Note 3) |
653,110 | 12,668,519 | 412,655 | 3,402,055 | 3,602,730 | 63,605 | ||||||||||||||||||
| Compliance officers’ fees and expenses (Note 3) |
3,588 | 49,694 | 1,443 | 12,141 | 6,651 | 536 | ||||||||||||||||||
| Other fees and expenses |
56,091 | 645,529 | 28,866 | 172,095 | 43,168 | 17,911 | ||||||||||||||||||
| Total Expenses |
11,216,197 | 142,198,313 | 5,966,102 | 49,785,164 | 30,901,724 | 3,032,045 | ||||||||||||||||||
| Less Waiver of investment advisory fee and/or reimbursement of other operating expenses (Note 3) |
— | — | (26,119 | ) | (923,440 | ) | — | (190,812 | ) | |||||||||||||||
| Net expenses |
11,216,197 | 142,198,313 | 5,939,983 | 48,861,724 | 30,901,724 | 2,841,233 | ||||||||||||||||||
| Net investment income (loss) |
(1,213,740 | ) | 290,209,130 | 4,304,850 | 41,437,467 | 22,518,848 | 3,798,484 | |||||||||||||||||
| REALIZED AND UNREALIZED GAIN (LOSS) |
||||||||||||||||||||||||
| Net realized gain (loss) Investment transactions |
(6,224,141 | ) | 58,483,045 | 700,531 | 16,994,175 | 141,028,914 | (2,466,349 | ) | ||||||||||||||||
| Foreign currency transactions |
(60,089 | ) | (4,845,785 | ) | (184,083 | ) | (2,760,171 | ) | (2,989,830 | ) | (226,731 | ) | ||||||||||||
| Net realized gain (loss) |
(6,284,230 | ) | 53,637,260 | 516,448 | 14,234,004 | 138,039,084 | (2,693,080 | ) | ||||||||||||||||
| Change in unrealized appreciation (depreciation) |
||||||||||||||||||||||||
| Investments (net of increase (decrease) in deferred foreign taxes of $—, $—, $401,260, $7,228,201, $5,190,958 and $24,698,respectively) |
(552,162,837 | ) | (6,429,849,650 | ) | (203,974,758 | ) | (2,209,553,600 | ) | (1,407,788,321 | ) | (53,026,222 | ) | ||||||||||||
| Translation of assets and liabilities denominated in foreign currencies |
(68,591 | ) | (2,656,623 | ) | (65,623 | ) | 937,281 | 434,339 | (9,508 | ) | ||||||||||||||
| Net change in unrealized depreciation |
(552,231,428 | ) | (6,432,506,273 | ) | (204,040,381 | ) | (2,208,616,319 | ) | (1,407,353,982 | ) | (53,035,730 | ) | ||||||||||||
| Net realized and unrealized loss |
(558,515,658 | ) | (6,378,869,013 | ) | (203,523,933 | ) | (2,194,382,315 | ) | (1,269,314,898 | ) | (55,728,810 | ) | ||||||||||||
| NET DECREASE IN NET ASSETS RESULTING FROM OPERATIONS |
$(559,729,398 | ) | $(6,088,659,883 | ) | $(199,219,083 | ) | $(2,152,944,848 | ) | $(1,246,796,050 | ) | $(51,930,326 | ) | ||||||||||||
See Notes to Financial Statements
53
Table of Contents
Harding, Loevner Funds, Inc.
Statements of Operations (continued)
For the Fiscal Year Ended October 31, 2022
| Global Equity |
International Equity Research Portfolio |
Emerging Markets Research Portfolio |
Chinese Equity Portfolio |
Emerging Markets ex China Portfolio(1) |
International Developed Markets Equity Portfolio(2) | |||||||||||||||||||
| INVESTMENT INCOME |
||||||||||||||||||||||||
| Dividends (net of foreign withholding taxes of $13,977, $29,657, $17,399, $1,998, $800 and $493, respectively) |
$160,173 | $279,188 | $158,489 | $46,373 | $7,945 | $3,173 | ||||||||||||||||||
| Non-cash dividends |
— | 15,121 | — | 6,238 | — | — | ||||||||||||||||||
| Total investment income |
160,173 | 294,309 | 158,489 | 52,611 | 7,945 | 3,173 | ||||||||||||||||||
| EXPENSES |
||||||||||||||||||||||||
| Investment advisory fees (Note 3) |
58,734 | 88,093 | 75,699 | 35,204 | 3,803 | 1,236 | ||||||||||||||||||
| Administration fees (Note 3) |
11,147 | 11,719 | 11,035 | 10,835 | 1,345 | 931 | ||||||||||||||||||
| Custody and accounting fees (Note 3) |
8,189 | 8,343 | 11,628 | 12,753 | 1,094 | 731 | ||||||||||||||||||
| Directors’ fees and expenses |
330 | 460 | 327 | 141 | 11 | 10 | ||||||||||||||||||
| Transfer agent fees and expenses (Note 3) |
475 | 530 | 513 | 742 | 98 | 69 | ||||||||||||||||||
| Printing and postage fees |
83 | 383 | 407 | 368 | 161 | 161 | ||||||||||||||||||
| State registration filing fees |
22,396 | 23,513 | 22,410 | 21,049 | 3,431 | 2,409 | ||||||||||||||||||
| Professional fees |
43,475 | 44,315 | 48,942 | 31,419 | 28,519 | 31,517 | ||||||||||||||||||
| Shareholder servicing fees (Note 3) |
— | 997 | 283 | 230 | — | — | ||||||||||||||||||
| Compliance officers’ fees and expenses (Note 3) |
23 | 34 | 23 | 9 | 1 | 1 | ||||||||||||||||||
| Organization fees |
— | — | — | — | 4,005 | — | ||||||||||||||||||
| Offering fees |
— | — | — | 31,929 | 8,224 | 4,243 | ||||||||||||||||||
| Other fees and expenses |
7,851 | 4,341 | 7,754 | 3,889 | 840 | 204 | ||||||||||||||||||
| Total Expenses |
152,703 | 182,728 | 179,021 | 148,568 | 51,532 | 41,512 | ||||||||||||||||||
| Less Waiver of investment advisory fee and/or reimbursement of other operating expenses (Note 3) |
(85,578 | ) | (88,343 | ) | (91,967 | ) | (105,952 | ) | (47,349 | ) | (40,100 | ) | ||||||||||||
| Net expenses |
67,125 | 94,385 | 87,054 | 42,616 | 4,183 | 1,412 | ||||||||||||||||||
| Net investment income |
93,048 | 199,924 | 71,435 | 9,995 | 3,762 | 1,761 | ||||||||||||||||||
| REALIZED AND UNREALIZED |
||||||||||||||||||||||||
| GAIN (LOSS) |
||||||||||||||||||||||||
| Investment transactions |
338,333 | 275,009 | (247,779 | ) | (595,486 | ) | (804 | ) | 2,696 | |||||||||||||||
| Foreign currency transactions |
(2,315 | ) | (5,764 | ) | (5,243 | ) | (322 | ) | 2,884 | 166 | ||||||||||||||
| Net realized gain (loss) |
336,018 | 269,245 | (253,022 | ) | (595,808 | ) | 2,080 | 2,862 | ||||||||||||||||
| Change in unrealized appreciation (depreciation) |
||||||||||||||||||||||||
| Investments (net of increase (decrease) in deferred foreign taxes of $2,036, $5,193, $7,845, $—, $— and $—, respectively) |
(2,960,552 | ) | (4,923,177 | ) | (2,486,073 | ) | (1,648,488 | ) | (76,022 | ) | 61,039 | |||||||||||||
| Translation of assets and liabilities denominated in foreign currencies |
(104 | ) | (1,132 | ) | (2,804 | ) | — | 13 | (13 | ) | ||||||||||||||
| Net change in unrealized appreciation (depreciation) |
(2,960,656 | ) | (4,924,309 | ) | (2,488,877 | ) | (1,648,488 | ) | (76,009 | ) | 61,026 | |||||||||||||
| Net realized and unrealized gain (loss) |
(2,624,638 | ) | (4,655,064 | ) | (2,741,899 | ) | (2,244,296 | ) | (73,929 | ) | 63,888 | |||||||||||||
| NET INCREASE (DECREASE) IN NET ASSETS RESULTING FROM OPERATIONS |
$(2,531,590 | ) | $(4,455,140 | ) | $(2,670,464 | ) | $(2,234,301 | ) | $(70,167 | ) | $65,649 | |||||||||||||
| (1) | For the period from September 14, 2022 (commencement of operations) through October 31, 2022. |
| (2) | For the period from September 28, 2022 (commencement of operations) through October 31, 2022. |
See Notes to Financial Statements
54
Table of Contents
Harding, Loevner Funds, Inc.
Statements of Changes in Net Assets
For the Fiscal Years Ended October 31
| Global Equity Portfolio |
International Equity Portfolio |
International Small Companies Portfolio |
||||||||||||||||||||||
| 2022 | 2021 | 2022 | 2021 | 2022 | 2021 | |||||||||||||||||||
| INCREASE (DECREASE) IN NET ASSETS FROM OPERATIONS |
||||||||||||||||||||||||
| Net investment income (loss) |
$(1,213,740 | ) | $(4,545,036 | ) | $290,209,130 | $241,579,583 | $4,304,850 | $1,338,454 | ||||||||||||||||
| Net realized gain (loss) on investments and foreign currency transactions |
(6,284,230 | ) | 250,426,555 | 53,637,260 | 792,159,294 | 516,448 | 20,518,770 | |||||||||||||||||
| Net change in unrealized appreciation (depreciation) on investments and translation of assets and liabilities denominated in foreign currencies |
(552,231,428 | ) | 230,188,057 | (6,432,506,273 | ) | 3,879,532,363 | (204,040,381 | ) | 111,531,955 | |||||||||||||||
| Net increase (decrease) in net assets resulting from operations |
(559,729,398 | ) | 476,069,576 | (6,088,659,883 | ) | 4,913,271,240 | (199,219,083 | ) | 133,389,179 | |||||||||||||||
| DISTRIBUTIONS TO SHAREHOLDERS: |
||||||||||||||||||||||||
| Institutional Class |
(185,635,345 | ) | (65,209,713 | ) | (444,803,839 | ) | (123,781,067 | ) | (16,184,086 | ) | (609,752 | ) | ||||||||||||
| Institutional Class Z |
(50,280,731 | ) | (17,916,242 | ) | (81,696,227 | ) | (21,728,233 | ) | — | — | ||||||||||||||
| Investor Class |
— | — | (8,326,346 | ) | (1,685,707 | ) | (1,329,708 | ) | (12,869 | ) | ||||||||||||||
| Advisor Class |
(7,355,601 | ) | (3,368,857 | ) | — | — | — | — | ||||||||||||||||
| Total distributions to shareholders |
(243,271,677 | ) | (86,494,812 | ) | (534,826,412 | ) | (147,195,007 | ) | (17,513,794 | ) | (622,621 | ) | ||||||||||||
| TRANSACTIONS IN SHARES OF COMMON STOCK |
||||||||||||||||||||||||
| Institutional Class |
6,716,245 | 18,309,218 | (1,732,956,194 | ) | 646,601,165 | 108,038,045 | 92,733,830 | |||||||||||||||||
| Institutional Class Z |
25,764,542 | 7,371,412 | 563,029,674 | 422,221,016 | — | — | ||||||||||||||||||
| Investor Class |
— | — | (93,927,348 | ) | (21,699,734 | ) | (2,972,265 | ) | (2,710,589 | ) | ||||||||||||||
| Advisor Class |
(2,447,612 | ) | (13,246,523 | ) | — | — | — | — | ||||||||||||||||
| Net Increase (Decrease) in net assets from portfolio share transactions |
30,033,175 | 12,434,107 | (1,263,853,868 | ) | 1,047,122,447 | 105,065,780 | 90,023,241 | |||||||||||||||||
| NET INCREASE (DECREASE) IN NET ASSETS |
(772,967,900 | ) | 402,008,871 | (7,887,340,163 | ) | 5,813,198,680 | (111,667,097 | ) | 222,789,799 | |||||||||||||||
| NET ASSETS |
||||||||||||||||||||||||
| At beginning of year |
1,788,182,252 | 1,386,173,381 | 21,912,789,689 | 16,099,591,009 | 599,652,212 | 376,862,413 | ||||||||||||||||||
| At end of year |
$1,015,214,352 | $1,788,182,252 | $14,025,449,526 | $21,912,789,689 | $487,985,115 | $599,652,212 | ||||||||||||||||||
See Notes to Financial Statements
55
Table of Contents
Harding, Loevner Funds, Inc.
Statements of Changes in Net Assets (continued)
For the Fiscal Years Ended October 31
| Institutional Emerging Markets Portfolio |
Emerging Markets Portfolio |
Frontier Emerging Markets Portfolio |
||||||||||||||||||||||
| 2022 | 2021 | 2022 | 2021 | 2022 | 2021 | |||||||||||||||||||
| INCREASE (DECREASE) IN NET ASSETS FROM OPERATIONS |
||||||||||||||||||||||||
| Net investment income |
$41,437,467 | $23,198,946 | $22,518,848 | $7,726,216 | $3,798,484 | $2,035,958 | ||||||||||||||||||
| Net realized gain (loss) on investments and foreign currency transactions |
14,234,004 | 130,998,582 | 138,039,084 | 320,983,925 | (2,693,080 | ) | 18,982,850 | |||||||||||||||||
| Net change in unrealized appreciation (depreciation) on investments and translation of assets and liabilities denominated in foreign currencies |
(2,208,616,319 | ) | 1,003,016,842 | (1,407,353,982 | ) | 482,938,965 | (53,035,730 | ) | 39,990,501 | |||||||||||||||
| Net increase (decrease) in net assets resulting from operations |
(2,152,944,848 | ) | 1,157,214,370 | (1,246,796,050 | ) | 811,649,106 | (51,930,326 | ) | 61,009,309 | |||||||||||||||
| DISTRIBUTIONS TO SHAREHOLDERS: |
||||||||||||||||||||||||
| Institutional Class |
(39,642,558 | ) | (23,061,824 | ) | — | — | — | — | ||||||||||||||||
| Institutional Class I |
— | — | — | — | (756,884 | ) | (1,305,371 | ) | ||||||||||||||||
| Institutional Class II |
— | — | — | — | (1,026,818 | ) | (2,278,483 | ) | ||||||||||||||||
| Institutional Class Z |
(5,159,015 | ) | (3,583,856 | ) | — | — | — | — | ||||||||||||||||
| Investor Class |
— | — | — | — | (44,023 | ) | (146,250 | ) | ||||||||||||||||
| Advisor Class |
— | — | (289,296,570 | ) | (14,604,731 | ) | — | — | ||||||||||||||||
| Total distributions to shareholders |
(44,801,573 | ) | (26,645,680 | ) | (289,296,570 | ) | (14,604,731 | ) | (1,827,725 | ) | (3,730,104 | ) | ||||||||||||
| TRANSACTIONS IN SHARES OF COMMON STOCK |
||||||||||||||||||||||||
| Institutional Class |
(1,539,297,876 | ) | (72,145,922 | ) | — | — | — | — | ||||||||||||||||
| Institutional Class I |
— | — | — | — | 882,276 | 1,089,776 | ||||||||||||||||||
| Institutional Class II |
— | — | — | — | 1,026,818 | (31,446,987 | ) | |||||||||||||||||
| Institutional Class Z |
(92,428,918 | ) | (38,875,745 | ) | — | — | — | — | ||||||||||||||||
| Investor Class |
— | — | — | — | (602,668 | ) | (3,400,547 | ) | ||||||||||||||||
| Advisor Class |
— | — | (879,477,212 | ) | (722,922,763 | ) | — | — | ||||||||||||||||
| Net Increase (Decrease) in net assets from portfolio share transactions |
(1,631,726,794 | ) | (111,021,667 | ) | (879,477,212 | ) | (722,922,763 | ) | 1,306,426 | (33,757,758 | ) | |||||||||||||
| NET INCREASE (DECREASE) IN NET ASSETS |
(3,829,473,215 | ) | 1,019,547,023 | (2,415,569,832 | ) | 74,121,612 | (52,451,625 | ) | 23,521,447 | |||||||||||||||
| NET ASSETS |
||||||||||||||||||||||||
| At beginning of year |
6,493,886,041 | 5,474,339,018 | 3,813,330,847 | 3,739,209,235 | 224,135,801 | 200,614,354 | ||||||||||||||||||
| At end of year |
$2,664,412,826 | $6,493,886,041 | $1,397,761,015 | $3,813,330,847 | $171,684,176 | $224,135,801 | ||||||||||||||||||
See Notes to Financial Statements
56
Table of Contents
Harding, Loevner Funds, Inc.
Statements of Changes in Net Assets (continued)
For the Fiscal Years Ended October 31
| Global Equity Research Portfolio |
International Equity Research Portfolio |
Emerging Markets Research Portfolio |
||||||||||||||||||||||
| 2022 | 2021 | 2022 | 2021 | 2022 | 2021 | |||||||||||||||||||
| INCREASE (DECREASE) IN NET ASSETS FROM OPERATIONS |
||||||||||||||||||||||||
| Net investment income |
$93,048 | $61,559 | $199,924 | $149,982 | $71,435 | $68,200 | ||||||||||||||||||
| Net realized gain (loss) on investments and foreign currency transactions |
336,018 | 993,321 | 269,245 | 1,549,600 | (253,022 | ) | 771,316 | |||||||||||||||||
| Net change in unrealized appreciation (depreciation) on investments and translation of assets and liabilities denominated in foreign currencies |
(2,960,656 | ) | 1,413,992 | (4,924,309 | ) | 1,625,603 | (2,488,877 | ) | 564,118 | |||||||||||||||
| Net increase (decrease) in net assets resulting from operations |
(2,531,590 | ) | 2,468,872 | (4,455,140 | ) | 3,325,185 | (2,670,464 | ) | 1,403,634 | |||||||||||||||
| DISTRIBUTIONS TO SHAREHOLDERS: |
||||||||||||||||||||||||
| Institutional Class |
(1,055,667 | ) | (217,846 | ) | (1,698,835 | ) | (489,632 | ) | (819,048 | ) | (134,267 | ) | ||||||||||||
| Total distributions to shareholders |
(1,055,667 | ) | (217,846 | ) | (1,698,835 | ) | (489,632 | ) | (819,048 | ) | (134,267 | ) | ||||||||||||
| TRANSACTIONS IN SHARES OF COMMON STOCK |
||||||||||||||||||||||||
| Institutional Class |
952,862 | 218,347 | 1,205,906 | (34,784 | ) | 638,747 | 428,228 | |||||||||||||||||
| Net Increase (Decrease) in net assets from portfolio share transactions |
952,862 | 218,347 | 1,205,906 | (34,784 | ) | 638,747 | 428,228 | |||||||||||||||||
| NET INCREASE (DECREASE) IN NET ASSETS |
(2,634,395 | ) | 2,469,373 | (4,948,069 | ) | 2,800,769 | (2,850,765 | ) | 1,697,595 | |||||||||||||||
| NET ASSETS |
||||||||||||||||||||||||
| At beginning of year |
9,856,389 | 7,387,016 | 15,294,771 | 12,494,002 | 9,064,567 | 7,366,972 | ||||||||||||||||||
| At end of year |
$7,221,994 | $9,856,389 | $10,346,702 | $15,294,771 | $6,213,802 | $9,064,567 | ||||||||||||||||||
See Notes to Financial Statements
57
Table of Contents
Harding, Loevner Funds, Inc.
Statements of Changes in Net Assets (continued)
For the Fiscal Years Ended October 31
| Chinese Equity Portfolio |
Emerging Portfolio(1) |
International Developed Markets Equity Portfolio(2) | ||||||||||||||
| 2022 | 2021(3) | 2022 | 2022 | |||||||||||||
| INCREASE (DECREASE) IN NET ASSETS FROM OPERATIONS |
||||||||||||||||
| Net investment income (loss) |
$9,995 | $(7,935 | ) | $3,762 | $1,761 | |||||||||||
| Net realized gain (loss) on investments and foreign currency transactions |
(595,808 | ) | (171,141 | ) | 2,080 | 2,862 | ||||||||||
| Net change in unrealized appreciation (depreciation) on investments and translation of assets and liabilities denominated in foreign currencies |
(1,648,488 | ) | (159,119 | ) | (76,009 | ) | 61,026 | |||||||||
| Net increase (decrease) in net assets resulting from operations |
(2,234,301 | ) | (338,195 | ) | (70,167 | ) | 65,649 | |||||||||
| DISTRIBUTIONS TO SHAREHOLDERS: |
||||||||||||||||
| Institutional Class |
(11,045 | ) | — | — | — | |||||||||||
| Total distributions to shareholders |
(11,045 | ) | — | — | — | |||||||||||
| TRANSACTIONS IN SHARES OF COMMON STOCK |
||||||||||||||||
| Institutional Class |
903,377 | 4,280,500 | 3,109,000 | 1,921,000 | ||||||||||||
| Net Increase in net assets from portfolio share transactions |
903,377 | 4,280,500 | 3,109,000 | 1,921,000 | ||||||||||||
| NET INCREASE (DECREASE) IN NET ASSETS |
(1,341,969 | ) | 3,942,305 | 3,038,833 | 1,986,649 | |||||||||||
| NET ASSETS |
||||||||||||||||
| At beginning of year |
3,942,305 | — | — | — | ||||||||||||
| At end of year |
$2,600,336 | $3,942,305 | $3,038,833 | $1,986,649 | ||||||||||||
| (1) | For the period from September 14, 2022 (commencement of operations) through October 31, 2022. |
| (2) | For the period from September 28, 2022 (commencement of operations) through October 31, 2022. |
| (3) | For the period from December 16, 2020 (commencement of operations) through October 31, 2021. |
See Notes to Financial Statements
58
Table of Contents
Financial Highlights
For the Fiscal Years Ended October 31
| Global Equity Portfolio Institutional Class | ||||||||||||||||||||
| 2022 | 2021 | 2020 | 2019 | 2018 | ||||||||||||||||
| Net asset value, beginning of year |
$ | 53.93 | $ | 42.41 | $ | 35.38 | $ | 35.68 | $ | 40.84 | ||||||||||
| Increase (Decrease) in Net Assets from Operations |
||||||||||||||||||||
| Net investment income (loss)(1) |
(0.04 | ) | (0.14 | ) | (0.06 | ) | 0.09 | 0.13 | ||||||||||||
| Net realized and unrealized gain (loss) on investments and foreign currency-related transactions |
(15.63 | ) | 14.30 | 7.33 | 3.45 | (0.13 | ) | |||||||||||||
| Net increase (decrease) from investment operations |
(15.67 | ) | 14.16 | 7.27 | 3.54 | — | ||||||||||||||
| Distributions to Shareholders from: |
||||||||||||||||||||
| Net investment income |
— | — | (0.24 | ) | (0.12 | ) | (0.14 | ) | ||||||||||||
| Net realized gain from investments |
(7.41 | ) | (2.64 | ) | — | (3.72 | ) | (5.02 | ) | |||||||||||
| Total distributions |
(7.41 | ) | (2.64 | ) | (0.24 | ) | (3.84 | ) | (5.16 | ) | ||||||||||
| Net asset value, end of year |
$ | 30.85 | $ | 53.93 | $ | 42.41 | $ | 35.38 | $ | 35.68 | ||||||||||
| Total Return |
(33.35 | )% | 34.57 | % | 20.63 | % | 11.86 | % | (0.35 | )% | ||||||||||
| Ratios/Supplemental Data: |
||||||||||||||||||||
| Net assets, end of year (000’s) |
$ | 753,480 | $ | 1,354,918 | $ | 1,043,741 | $ | 684,764 | $ | 619,347 | ||||||||||
| Expenses to average net assets |
0.85 | % | 0.88 | % | 0.92 | % | 0.93 | % | 0.94 | % | ||||||||||
| Expenses to average net assets (net of fees waived/reimbursed) |
0.85 | % | 0.88 | % | 0.92 | % | 0.93 | % | 0.94 | % | ||||||||||
| Net investment income (loss) to average net assets |
(0.10 | )% | (0.28 | )% | (0.15 | )% | 0.28 | % | 0.34 | % | ||||||||||
| Portfolio turnover rate |
37 | % | 59 | % | 63 | % | 39 | % | 42 | % | ||||||||||
| (1) | Net investment income per share was calculated using the average shares outstanding method. |
See Notes to Financial Statements
59
Table of Contents
Harding, Loevner Funds, Inc.
Financial Highlights (continued)
For the Fiscal Years Ended October 31
| Global Equity Portfolio Institutional Class Z | ||||||||||||||||||||
| 2022 | 2021 | 2020 | 2019 | 2018 | ||||||||||||||||
| Net asset value, beginning of year |
$ | 53.95 | $ | 42.39 | $ | 35.36 | $ | 35.67 | $ | 40.84 | ||||||||||
| Increase (Decrease) in Net Assets from Operations |
||||||||||||||||||||
| Net investment income (loss)(1) |
(0.02 | ) | (0.10 | ) | (0.02 | ) | 0.11 | 0.17 | ||||||||||||
| Net realized and unrealized gain (loss) on investments and foreign currency-related transactions |
(15.64 | ) | 14.30 | 7.31 | 3.44 | (0.15 | ) | |||||||||||||
| Net increase (decrease) from investment operations |
(15.66 | ) | 14.20 | 7.29 | 3.55 | 0.02 | ||||||||||||||
| Distributions to Shareholders from: |
||||||||||||||||||||
| Net investment income |
— | — | (0.26 | ) | (0.14 | ) | (0.17 | ) | ||||||||||||
| Net realized gain from investments |
(7.41 | ) | (2.64 | ) | — | (3.72 | ) | (5.02 | ) | |||||||||||
| Total distributions |
(7.41 | ) | (2.64 | ) | (0.26 | ) | (3.86 | ) | (5.19 | ) | ||||||||||
| Net asset value, end of year |
$ | 30.88 | $ | 53.95 | $ | 42.39 | $ | 35.36 | $ | 35.67 | ||||||||||
| Total Return |
(33.31 | )% | 34.66 | % | 20.76 | % | 11.89 | % | (0.26 | )% | ||||||||||
| Ratios/Supplemental Data: |
||||||||||||||||||||
| Net assets, end of year (000’s) |
$ | 234,800 | $ | 379,781 | $ | 289,320 | $ | 229,355 | $ | 140,359 | ||||||||||
| Expenses to average net assets |
0.79 | % | 0.81 | % | 0.85 | % | 0.88 | % | 0.91 | % | ||||||||||
| Expenses to average net assets (net of fees waived/reimbursed) |
0.79 | % | 0.80 | % | 0.84 | % | 0.88 | % | 0.90 | % | ||||||||||
| Net investment income (loss) to average net assets |
(0.04 | )% | (0.20 | )% | (0.05 | )% | 0.32 | % | 0.43 | % | ||||||||||
| Portfolio turnover rate |
37 | % | 59 | % | 63 | % | 39 | % | 42 | % | ||||||||||
| (1) | Net investment income per share was calculated using the average shares outstanding method. |
See Notes to Financial Statements
60
Table of Contents
Harding, Loevner Funds, Inc.
Financial Highlights (continued)
For the Fiscal Years Ended October 31
| Global Equity Portfolio Advisor Class | ||||||||||||||||||||
| 2022 | 2021 | 2020 | 2019 | 2018 | ||||||||||||||||
| Net asset value, beginning of year |
$ | 53.82 | $ | 42.41 | $ | 35.30 | $ | 35.60 | $ | 40.78 | ||||||||||
| Increase (Decrease) in Net Assets from Operations |
||||||||||||||||||||
| Net investment income (loss)(1) |
(0.11 | ) | (0.24 | ) | (0.12 | ) | 0.03 | 0.07 | ||||||||||||
| Net realized and unrealized gain (loss) on investments and foreign currency-related transactions |
(15.60 | ) | 14.29 | 7.33 | 3.43 | (0.15 | ) | |||||||||||||
| Net increase (decrease) from investment operations |
(15.71 | ) | 14.05 | 7.21 | 3.46 | (0.08 | ) | |||||||||||||
| Distributions to Shareholders from: |
||||||||||||||||||||
| Net investment income |
— | — | (0.10 | ) | (0.04 | ) | (0.08 | ) | ||||||||||||
| Net realized gain from investments |
(7.41 | ) | (2.64 | ) | — | (3.72 | ) | (5.02 | ) | |||||||||||
| Total distributions |
(7.41 | ) | (2.64 | ) | (0.10 | ) | (3.76 | ) | (5.10 | ) | ||||||||||
| Net asset value, end of year |
$ | 30.70 | $ | 53.82 | $ | 42.41 | $ | 35.30 | $ | 35.60 | ||||||||||
| Total Return |
(33.50 | )% | 34.28 | % | 20.47 | % | 11.60 | % | (0.57 | )% | ||||||||||
| Ratios/Supplemental Data: |
||||||||||||||||||||
| Net assets, end of year (000’s) |
$ | 26,934 | $ | 53,483 | $ | 53,112 | $ | 48,181 | $ | 90,567 | ||||||||||
| Expenses to average net assets |
1.05 | % | 1.09 | % | 1.11 | % | 1.12 | % | 1.14 | % | ||||||||||
| Expenses to average net assets (net of fees waived/reimbursed) |
1.05 | % | 1.09 | % | 1.11 | % | 1.12 | % | 1.14 | % | ||||||||||
| Net investment income (loss) to average net assets |
(0.30 | )% | (0.48 | )% | (0.32 | )% | 0.09 | % | 0.18 | % | ||||||||||
| Portfolio turnover rate |
37 | % | 59 | % | 63 | % | 39 | % | 42 | % | ||||||||||
| (1) | Net investment income per share was calculated using the average shares outstanding method. |
See Notes to Financial Statements
61
Table of Contents
Harding, Loevner Funds, Inc.
Financial Highlights (continued)
For the Fiscal Years Ended October 31
| International Equity Portfolio Institutional Class | ||||||||||||||||||||
| 2022 | 2021 | 2020 | 2019 | 2018 | ||||||||||||||||
| Net asset value, beginning of year |
$ | 30.69 | $ | 23.76 | $ | 22.72 | $ | 20.74 | $ | 22.64 | ||||||||||
| Increase (Decrease) in Net Assets from Operations |
||||||||||||||||||||
| Net investment income(1) |
0.41 | 0.34 | 0.23 | 0.29 | 0.31 | |||||||||||||||
| Net realized and unrealized gain (loss) on investments and foreign currency-related transactions |
(8.93 | ) | 6.80 | 1.19 | 1.98 | (1.83 | ) | |||||||||||||
| Net increase (decrease) from investment operations |
(8.52 | ) | 7.14 | 1.42 | 2.27 | (1.52 | ) | |||||||||||||
| Distributions to Shareholders from: |
||||||||||||||||||||
| Net investment income |
(0.43 | ) | (0.21 | ) | (0.38 | ) | (0.29 | ) | (0.20 | ) | ||||||||||
| Net realized gain from investments |
(0.32 | ) | — | — | — | (0.18 | ) | |||||||||||||
| Total distributions |
(0.75 | ) | (0.21 | ) | (0.38 | ) | (0.29 | ) | (0.38 | ) | ||||||||||
| Net asset value, end of year |
$ | 21.42 | $ | 30.69 | $ | 23.76 | $ | 22.72 | $ | 20.74 | ||||||||||
| Total Return |
(28.42 | )% | 30.16 | % | 6.25 | % | 11.19 | % | (6.86 | )% | ||||||||||
| Ratios/Supplemental Data: |
||||||||||||||||||||
| Net assets, end of year (000’s) |
$ | 11,113,757 | $ | 18,268,498 | $ | 13,596,900 | $ | 13,766,876 | $ | 11,995,592 | ||||||||||
| Expenses to average net assets |
0.79 | % | 0.80 | % | 0.81 | % | 0.81 | % | 0.81 | % | ||||||||||
| Expenses to average net assets (net of fees waived/reimbursed) |
0.79 | % | 0.80 | % | 0.81 | % | 0.81 | % | 0.81 | % | ||||||||||
| Net investment income to average net assets |
1.58 | % | 1.17 | % | 1.01 | % | 1.35 | % | 1.34 | % | ||||||||||
| Portfolio turnover rate |
16 | % | 14 | % | 17 | % | 30 | % | 10 | % | ||||||||||
| (1) | Net investment income per share was calculated using the average shares outstanding method. |
See Notes to Financial Statements
62
Table of Contents
Harding, Loevner Funds, Inc.
Financial Highlights (continued)
For the Fiscal Years Ended October 31
| International Equity Portfolio Institutional Class Z | ||||||||||||||||||||
| 2022 | 2021 | 2020 | 2019 | 2018 | ||||||||||||||||
| Net asset value, beginning of year |
$ | 30.69 | $ | 23.76 | $ | 22.72 | $ | 20.75 | $ | 22.64 | ||||||||||
| Increase (Decrease) in Net Assets from Operations |
||||||||||||||||||||
| Net investment income(1) |
0.43 | 0.37 | 0.25 | 0.30 | 0.40 | |||||||||||||||
| Net realized and unrealized gain (loss) on investments and foreign currency-related transactions |
(8.93 | ) | 6.79 | 1.18 | 1.98 | (1.90 | ) | |||||||||||||
| Net increase (decrease) from investment operations |
(8.50 | ) | 7.16 | 1.43 | 2.28 | (1.50 | ) | |||||||||||||
| Distributions to Shareholders from: |
||||||||||||||||||||
| Net investment income |
(0.45 | ) | (0.23 | ) | (0.39 | ) | (0.31 | ) | (0.21 | ) | ||||||||||
| Net realized gain from investments |
(0.32 | ) | — | — | — | (0.18 | ) | |||||||||||||
| Total distributions |
(0.77 | ) | (0.23 | ) | (0.39 | ) | (0.31 | ) | (0.39 | ) | ||||||||||
| Net asset value, end of year |
$ | 21.42 | $ | 30.69 | $ | 23.76 | $ | 22.72 | $ | 20.75 | ||||||||||
| Total Return |
(28.36 | )% | 30.25 | % | 6.32 | % | 11.29 | % | (6.79 | )% | ||||||||||
| Ratios/Supplemental Data: |
||||||||||||||||||||
| Net assets, end of year (000’s) |
$ | 2,715,026 | $ | 3,235,428 | $ | 2,165,343 | $ | 1,938,763 | $ | 1,342,804 | ||||||||||
| Expenses to average net assets |
0.71 | % | 0.72 | % | 0.73 | % | 0.75 | % | 0.74 | % | ||||||||||
| Expenses to average net assets (net of fees waived/reimbursed) |
0.71 | % | 0.72 | % | 0.73 | % | 0.75 | % | 0.74 | % | ||||||||||
| Net investment income to average net assets |
1.71 | % | 1.25 | % | 1.08 | % | 1.42 | % | 1.77 | % | ||||||||||
| Portfolio turnover rate |
16 | % | 14 | % | 17 | % | 30 | % | 10 | % | ||||||||||
| (1) | Net investment income per share was calculated using the average shares outstanding method. |
See Notes to Financial Statements
63
Table of Contents
Harding, Loevner Funds, Inc.
Financial Highlights (continued)
For the Fiscal Years Ended October 31
| International Equity Portfolio Investor Class | ||||||||||||||||||||
| 2022 | 2021 | 2020 | 2019 | 2018 | ||||||||||||||||
| Net asset value, beginning of year |
$ | 30.61 | $ | 23.70 | $ | 22.66 | $ | 20.65 | $ | 22.55 | ||||||||||
| Increase (Decrease) in Net Assets from Operations |
||||||||||||||||||||
| Net investment income(1) |
0.33 | 0.24 | 0.16 | 0.22 | 0.21 | |||||||||||||||
| Net realized and unrealized gain (loss) on investments and foreign currency-related transactions |
(8.92 | ) | 6.80 | 1.18 | 1.98 | (1.80 | ) | |||||||||||||
| Net increase (decrease) from investment operations |
(8.59 | ) | 7.04 | 1.34 | 2.20 | (1.59 | ) | |||||||||||||
| Distributions to Shareholders from: |
||||||||||||||||||||
| Net investment income |
(0.33 | ) | (0.13 | ) | (0.30 | ) | (0.19 | ) | (0.13 | ) | ||||||||||
| Net realized gain from investments |
(0.32 | ) | — | — | — | (0.18 | ) | |||||||||||||
| Total distributions |
(0.65 | ) | (0.13 | ) | (0.30 | ) | (0.19 | ) | (0.31 | ) | ||||||||||
| Net asset value, end of year |
$ | 21.37 | $ | 30.61 | $ | 23.70 | $ | 22.66 | $ | 20.65 | ||||||||||
| Total Return |
(28.63 | )% | 29.74 | % | 5.91 | % | 10.79 | % | (7.16 | )% | ||||||||||
| Ratios/Supplemental Data: |
||||||||||||||||||||
| Net assets, end of year (000’s) |
$ | 196,666 | $ | 408,864 | $ | 337,348 | $ | 395,339 | $ | 411,712 | ||||||||||
| Expenses to average net assets |
1.10 | % | 1.12 | % | 1.13 | % | 1.13 | % | 1.14 | % | ||||||||||
| Expenses to average net assets (net of fees waived/reimbursed) |
1.10 | % | 1.12 | % | 1.13 | % | 1.13 | % | 1.14 | % | ||||||||||
| Net investment income to average net assets |
1.28 | % | 0.83 | % | 0.69 | % | 1.03 | % | 0.92 | % | ||||||||||
| Portfolio turnover rate |
16 | % | 14 | % | 17 | % | 30 | % | 10 | % | ||||||||||
| (1) | Net investment income per share was calculated using the average shares outstanding method. |
See Notes to Financial Statements
64
Table of Contents
Harding, Loevner Funds, Inc.
Financial Highlights (continued)
For the Fiscal Years Ended October 31
| International Small Companies Portfolio Institutional Class | ||||||||||||||||||||
| 2022 | 2021 | 2020 | 2019 | 2018 | ||||||||||||||||
| Net asset value, beginning of year |
$ | 22.80 | $ | 17.14 | $ | 15.64 | $ | 15.29 | $ | 16.67 | ||||||||||
| Increase (Decrease) in Net Assets from Operations |
||||||||||||||||||||
| Net investment income(1) |
0.15 | 0.06 | 0.08 | 0.12 | 0.13 | |||||||||||||||
| Net realized and unrealized gain (loss) on investments and foreign currency-related transactions |
(7.07 | ) | 5.63 | 1.53 | 1.24 | (1.30 | ) | |||||||||||||
| Net increase (decrease) from investment operations |
(6.92 | ) | 5.69 | 1.61 | 1.36 | (1.17 | ) | |||||||||||||
| Distributions to Shareholders from: |
||||||||||||||||||||
| Net investment income |
(0.07 | ) | (0.03 | ) | (0.11 | ) | (0.13 | ) | (0.06 | ) | ||||||||||
| Net realized gain from investments |
(0.61 | ) | — | — | (0.88 | ) | (0.15 | ) | ||||||||||||
| Total distributions |
(0.68 | ) | (0.03 | ) | (0.11 | ) | (1.01 | ) | (0.21 | ) | ||||||||||
| Net asset value, end of year |
$ | 15.20 | $ | 22.80 | $ | 17.14 | $ | 15.64 | $ | 15.29 | ||||||||||
| Total Return |
(31.20 | )% | 33.16 | % | 10.34 | % | 10.14 | % | (7.15 | )% | ||||||||||
| Ratios/Supplemental Data: |
||||||||||||||||||||
| Net assets, end of year (000’s) |
$ | 457,624 | $ | 549,895 | $ | 337,166 | $ | 272,252 | $ | 151,283 | ||||||||||
| Expenses to average net assets |
1.11 | % | 1.16 | % | 1.34 | % | 1.38 | % | 1.39 | % | ||||||||||
| Expenses to average net assets (net of fees waived/reimbursed) |
1.11 | % | 1.14 | % | 1.15 | % | 1.15 | % | 1.15 | % | ||||||||||
| Net investment income to average net assets |
0.84 | % | 0.29 | % | 0.50 | % | 0.78 | % | 0.75 | % | ||||||||||
| Portfolio turnover rate |
24 | % | 13 | % | 30 | % | 37 | % | 52 | % | ||||||||||
| (1) | Net investment income per share was calculated using the average shares outstanding method. |
See Notes to Financial Statements
65
Table of Contents
Harding, Loevner Funds, Inc.
Financial Highlights (continued)
For the Fiscal Years Ended October 31
| International Small Companies Portfolio Investor Class | ||||||||||||||||||||
| 2022 | 2021 | 2020 | 2019 | 2018 | ||||||||||||||||
| Net asset value, beginning of year |
$ | 22.51 | $ | 16.94 | $ | 15.48 | $ | 15.16 | $ | 16.55 | ||||||||||
| Increase (Decrease) in Net Assets from Operations |
||||||||||||||||||||
| Net investment income(1) |
0.10 | — | (2) | 0.04 | 0.09 | 0.10 | ||||||||||||||
| Net realized and unrealized gain (loss) on investments and foreign currency-related transactions |
(6.99 | ) | 5.58 | 1.51 | 1.21 | (1.29 | ) | |||||||||||||
| Net increase (decrease) from investment operations |
(6.89 | ) | 5.58 | 1.55 | 1.30 | (1.19 | ) | |||||||||||||
| Distributions to Shareholders from: |
||||||||||||||||||||
| Net investment income |
(0.01 | ) | (0.01 | ) | (0.09 | ) | (0.10 | ) | (0.05 | ) | ||||||||||
| Net realized gain from investments |
(0.61 | ) | — | — | (0.88 | ) | (0.15 | ) | ||||||||||||
| Total distributions |
(0.62 | ) | (0.01 | ) | (0.09 | ) | (0.98 | ) | (0.20 | ) | ||||||||||
| Net asset value, end of year |
$ | 15.00 | $ | 22.51 | $ | 16.94 | $ | 15.48 | $ | 15.16 | ||||||||||
| Total Return |
(31.39 | )% | 32.84 | % | 10.07 | % | 9.82 | % | (7.35 | )% | ||||||||||
| Ratios/Supplemental Data: |
||||||||||||||||||||
| Net assets, end of year (000’s) |
$ | 30,361 | $ | 49,757 | $ | 39,696 | $ | 57,095 | $ | 57,912 | ||||||||||
| Expenses to average net assets |
1.44 | % | 1.50 | % | 1.67 | % | 1.70 | % | 1.75 | % | ||||||||||
| Expenses to average net assets (net of fees waived/reimbursed) |
1.37 | % | 1.40 | % | 1.40 | % | 1.40 | % | 1.40 | % | ||||||||||
| Net investment income to average net assets |
0.54 | % | 0.01 | % | 0.28 | % | 0.63 | % | 0.58 | % | ||||||||||
| Portfolio turnover rate |
24 | % | 13 | % | 30 | % | 37 | % | 52 | % | ||||||||||
| (1) | Net investment income per share was calculated using the average shares outstanding method. |
| (2) | Amount was less than $0.005 per share. |
See Notes to Financial Statements
66
Table of Contents
Harding, Loevner Funds, Inc.
Financial Highlights (continued)
For the Fiscal Years Ended October 31
| Institutional Emerging Markets Portfolio Institutional Class | ||||||||||||||||||||
| 2022 | 2021 | 2020 | 2019 | 2018 | ||||||||||||||||
| Net asset value, beginning of year |
$ | 25.59 | $ | 21.23 | $ | 21.25 | $ | 18.43 | $ | 21.94 | ||||||||||
| Increase (Decrease) in Net Assets from Operations |
||||||||||||||||||||
| Net investment income(1) |
0.19 | 0.09 | 0.12 | 0.24 | 0.19 | |||||||||||||||
| Net realized and unrealized gain (loss) on investments and foreign currency-related transactions |
(9.63 | ) | 4.37 | 0.19 | 2.76 | (3.53 | ) | |||||||||||||
| Net increase (decrease) from investment operations |
(9.44 | ) | 4.46 | 0.31 | 3.00 | (3.34 | ) | |||||||||||||
| Distributions to Shareholders from: |
||||||||||||||||||||
| Net investment income |
(0.18 | ) | (0.10 | ) | (0.33 | ) | (0.18 | ) | (0.17 | ) | ||||||||||
| Net asset value, end of year |
$ | 15.97 | $ | 25.59 | $ | 21.23 | $ | 21.25 | $ | 18.43 | ||||||||||
| Total Return |
(37.14 | )% | 21.03 | % | 1.38 | % | 16.43 | % | (15.33 | )% | ||||||||||
| Ratios/Supplemental Data: |
||||||||||||||||||||
| Net assets, end of year (000’s) |
$ | 2,302,000 | $ | 5,774,486 | $ | 4,847,707 | $ | 4,864,702 | $ | 3,978,321 | ||||||||||
| Expenses to average net assets |
1.12 | % | 1.22 | % | 1.28 | % | 1.27 | % | 1.27 | % | ||||||||||
| Expenses to average net assets (net of fees waived/reimbursed) |
1.10 | % | 1.15 | % | 1.28 | % | 1.27 | % | 1.27 | % | ||||||||||
| Net investment income to average net assets |
0.91 | % | 0.33 | % | 0.59 | % | 1.18 | % | 0.84 | % | ||||||||||
| Portfolio turnover rate |
24 | % | 13 | % | 23 | % | 17 | % | 24 | % | ||||||||||
| (1) | Net investment income per share was calculated using the average shares outstanding method. |
See Notes to Financial Statements
67
Table of Contents
Harding, Loevner Funds, Inc.
Financial Highlights (continued)
For the Fiscal Years Ended October 31
| Institutional Emerging Markets Portfolio Institutional Class Z | ||||||||||||||||||||
| 2022 | 2021 | 2020 | 2019 | 2018 | ||||||||||||||||
| Net asset value, beginning of year |
$ | 25.65 | $ | 21.28 | $ | 21.28 | $ | 18.45 | $ | 21.94 | ||||||||||
| Increase (Decrease) in Net Assets from Operations |
||||||||||||||||||||
| Net investment income(1) |
0.21 | 0.11 | 0.15 | 0.27 | 0.22 | |||||||||||||||
| Net realized and unrealized gain (loss) on investments and foreign currency-related transactions |
(9.66 | ) | 4.38 | 0.20 | 2.76 | (3.52 | ) | |||||||||||||
| Net increase (decrease) from investment operations |
(9.45 | ) | 4.49 | 0.35 | 3.03 | (3.30 | ) | |||||||||||||
| Distributions to Shareholders from: |
||||||||||||||||||||
| Net investment income |
(0.18 | ) | (0.12 | ) | (0.35 | ) | (0.20 | ) | (0.19 | ) | ||||||||||
| Net asset value, end of year |
$ | 16.02 | $ | 25.65 | $ | 21.28 | $ | 21.28 | $ | 18.45 | ||||||||||
| Total Return |
(37.07 | )% | 21.11 | % | 1.55 | % | 16.61 | % | (15.21 | )% | ||||||||||
| Ratios/Supplemental Data: |
||||||||||||||||||||
| Net assets, end of year (000’s) |
$ | 362,413 | $ | 719,400 | $ | 626,632 | $ | 557,924 | $ | 391,583 | ||||||||||
| Expenses to average net assets |
1.04 | % | 1.13 | % | 1.19 | % | 1.19 | % | 1.20 | % | ||||||||||
| Expenses to average net assets (net of fees waived/reimbursed) |
1.00 | % | 1.07 | % | 1.11 | % | 1.11 | % | 1.11 | % | ||||||||||
| Net investment income to average net assets |
1.04 | % | 0.41 | % | 0.76 | % | 1.34 | % | 1.00 | % | ||||||||||
| Portfolio turnover rate |
24 | % | 13 | % | 23 | % | 17 | % | 24 | % | ||||||||||
| (1) | Net investment income per share was calculated using the average shares outstanding method. |
See Notes to Financial Statements
68
Table of Contents
Harding, Loevner Funds, Inc.
Financial Highlights (continued)
For the Fiscal Years Ended October 31
| Emerging Markets Portfolio Advisor Class | ||||||||||||||||||||
| 2022 | 2021 | 2020 | 2019 | 2018 | ||||||||||||||||
| Net asset value, beginning of year |
$ | 66.93 | $ | 55.48 | $ | 55.65 | $ | 48.21 | $ | 57.46 | ||||||||||
| Increase (Decrease) in Net Assets from Operations |
||||||||||||||||||||
| Net investment income(1) |
0.44 | 0.12 | 0.26 | 0.58 | 0.42 | |||||||||||||||
| Net realized and unrealized gain (loss) on investments and foreign currency-related transactions |
(23.60 | ) | 11.55 | 0.40 | 7.28 | (9.24 | ) | |||||||||||||
| Net increase (decrease) from investment operations |
(23.16 | ) | 11.67 | 0.66 | 7.86 | (8.82 | ) | |||||||||||||
| Distributions to Shareholders from: |
||||||||||||||||||||
| Net investment income |
(0.36 | ) | (0.22 | ) | (0.83 | ) | (0.42 | ) | (0.40 | ) | ||||||||||
| Net realized gain from investments |
(4.72 | ) | — | — | — | (0.03 | ) | |||||||||||||
| Total distributions |
(5.08 | ) | (0.22 | ) | (0.83 | ) | (0.42 | ) | (0.43 | ) | ||||||||||
| Net asset value, end of year |
$ | 38.69 | $ | 66.93 | $ | 55.48 | $ | 55.65 | $ | 48.21 | ||||||||||
| Total Return |
(37.18 | )% | 21.04 | % | 1.11 | % | 16.46 | % | (15.47 | )% | ||||||||||
| Ratios/Supplemental Data: |
||||||||||||||||||||
| Net assets, end of year (000’s) |
$ | 1,397,761 | $ | 3,813,331 | $ | 3,739,209 | $ | 4,274,314 | $ | 3,459,157 | ||||||||||
| Expenses to average net assets |
1.19 | % | 1.31 | % | 1.36 | % | 1.37 | % | 1.40 | % | ||||||||||
| Expenses to average net assets (net of fees waived/reimbursed) |
1.19 | % | 1.28 | % | 1.36 | % | 1.37 | % | 1.40 | % | ||||||||||
| Net investment income to average net assets |
0.87 | % | 0.18 | % | 0.49 | % | 1.10 | % | 0.73 | % | ||||||||||
| Portfolio turnover rate |
33 | % | 15 | % | 18 | % | 19 | % | 24 | % | ||||||||||
| (1) | Net investment income per share was calculated using the average shares outstanding method. |
See Notes to Financial Statements
69
Table of Contents
Harding, Loevner Funds, Inc.
Financial Highlights (continued)
For the Fiscal Years Ended October 31
| Frontier Emerging Markets Portfolio Institutional Class I | ||||||||||||||||||||
| 2022 | 2021 | 2020 | 2019 | 2018 | ||||||||||||||||
| Net asset value, beginning of year |
$ | 8.97 | $ | 6.92 | $ | 7.80 | $ | 7.62 | $ | 8.50 | ||||||||||
| Increase (Decrease) in Net Assets from Operations |
||||||||||||||||||||
| Net investment income(1) |
0.14 | 0.06 | 0.10 | 0.14 | 0.11 | |||||||||||||||
| Net realized and unrealized gain (loss) on investments and foreign currency-related transactions |
(2.24 | ) | 2.12 | (0.82 | ) | 0.14 | (0.82 | ) | ||||||||||||
| Net increase (decrease) from investment operations |
(2.10 | ) | 2.18 | (0.72 | ) | 0.28 | (0.71 | ) | ||||||||||||
| Distributions to Shareholders from: |
||||||||||||||||||||
| Net investment income |
(0.07 | ) | (0.13 | ) | (0.16 | ) | (0.10 | ) | (0.17 | ) | ||||||||||
| Net asset value, end of year |
$ | 6.80 | $ | 8.97 | $ | 6.92 | $ | 7.80 | $ | 7.62 | ||||||||||
| Total Return |
(23.56 | )% | 31.74 | % | (9.50 | )% | 3.59 | % | (8.47 | )% | ||||||||||
| Ratios/Supplemental Data: |
||||||||||||||||||||
| Net assets, end of year (000’s) |
$ | 74,804 | $ | 96,905 | $ | 73,376 | $ | 144,742 | $ | 220,367 | ||||||||||
| Expenses to average net assets |
1.60 | % | 1.64 | % | 1.68 | % | 1.63 | % | 1.62 | % | ||||||||||
| Expenses to average net assets (net of fees waived/reimbursed) |
1.60 | % | 1.64 | % | 1.68 | % | 1.63 | % | 1.62 | % | ||||||||||
| Net investment income to average net assets |
1.85 | % | 0.75 | % | 1.44 | % | 1.72 | % | 1.24 | % | ||||||||||
| Portfolio turnover rate |
18 | % | 30 | % | 21 | % | 31 | % | 20 | % | ||||||||||
| (1) | Net investment income per share was calculated using the average shares outstanding method. |
See Notes to Financial Statements
70
Table of Contents
Harding, Loevner Funds, Inc.
Financial Highlights (continued)
For the Fiscal Years Ended October 31
| Frontier Emerging Markets Portfolio Institutional Class II | ||||||||||||||||||||
| 2022 | 2021 | 2020 | 2019 | 2018 | ||||||||||||||||
| Net asset value, beginning of year |
$ | 9.03 | $ | 6.95 | $ | 7.82 | $ | 7.63 | $ | 8.50 | ||||||||||
| Increase (Decrease) in Net Assets from Operations |
||||||||||||||||||||
| Net investment income(1) |
0.17 | 0.09 | 0.14 | 0.17 | 0.14 | |||||||||||||||
| Net realized and unrealized gain (loss) on investments and foreign currency-related transactions |
(2.27 | ) | 2.13 | (0.84 | ) | 0.13 | (0.83 | ) | ||||||||||||
| Net increase (decrease) from investment operations |
(2.10 | ) | 2.22 | (0.70 | ) | 0.30 | (0.69 | ) | ||||||||||||
| Distributions to Shareholders from: |
||||||||||||||||||||
| Net investment income |
(0.08 | ) | (0.14 | ) | (0.17 | ) | (0.11 | ) | (0.18 | ) | ||||||||||
| Net asset value, end of year |
$ | 6.85 | $ | 9.03 | $ | 6.95 | $ | 7.82 | $ | 7.63 | ||||||||||
| Total Return |
(23.44 | )% | 32.18 | % | (9.26 | )% | 4.01 | % | (8.31 | )% | ||||||||||
| Ratios/Supplemental Data: |
||||||||||||||||||||
| Net assets, end of year (000’s) |
$ | 90,188 | $ | 117,689 | $ | 116,911 | $ | 128,742 | $ | 163,794 | ||||||||||
| Expenses to average net assets |
1.52 | % | 1.55 | % | 1.60 | % | 1.55 | % | 1.56 | % | ||||||||||
| Expenses to average net assets (net of fees waived/reimbursed) |
1.35 | % | 1.35 | % | 1.35 | % | 1.35 | % | 1.35 | % | ||||||||||
| Net investment income to average net assets |
2.13 | % | 1.05 | % | 1.95 | % | 2.19 | % | 1.51 | % | ||||||||||
| Portfolio turnover rate |
18 | % | 30 | % | 21 | % | 31 | % | 20 | % | ||||||||||
| (1) | Net investment income per share was calculated using the average shares outstanding method. |
See Notes to Financial Statements
71
Table of Contents
Harding, Loevner Funds, Inc.
Financial Highlights (continued)
For the Fiscal Years Ended October 31
| Frontier Emerging Markets Portfolio Investor Class | ||||||||||||||||||||
| 2022 | 2021 | 2020 | 2019 | 2018 | ||||||||||||||||
| Net asset value, beginning of year |
$ | 8.92 | $ | 6.88 | $ | 7.75 | $ | 7.57 | $ | 8.43 | ||||||||||
| Increase (Decrease) in Net Assets from Operations |
||||||||||||||||||||
| Net investment income(1) |
0.11 | 0.03 | 0.08 | 0.11 | 0.07 | |||||||||||||||
| Net realized and unrealized gain (loss) on investments and foreign currency-related transactions |
(2.23 | ) | 2.11 | (0.83 | ) | 0.13 | (0.79 | ) | ||||||||||||
| Net increase (decrease) from investment operations |
(2.12 | ) | 2.14 | (0.75 | ) | 0.24 | (0.72 | ) | ||||||||||||
| Distributions to Shareholders from: |
||||||||||||||||||||
| Net investment income |
(0.04 | ) | (0.10 | ) | (0.12 | ) | (0.06 | ) | (0.14 | ) | ||||||||||
| Net asset value, end of year |
$ | 6.76 | $ | 8.92 | $ | 6.88 | $ | 7.75 | $ | 7.57 | ||||||||||
| Total Return |
(23.84 | )% | 31.14 | % | (9.70 | )% | 3.24 | % | (8.75 | )% | ||||||||||
| Ratios/Supplemental Data: |
||||||||||||||||||||
| Net assets, end of year (000’s) |
$ | 6,692 | $ | 9,542 | $ | 10,327 | $ | 20,560 | $ | 25,388 | ||||||||||
| Expenses to average net assets |
2.15 | % | 2.14 | % | 2.12 | % | 2.00 | % | 2.06 | % | ||||||||||
| Expenses to average net assets (net of fees waived/reimbursed) |
2.00 | % | 2.00 | % | 2.00 | % | 2.00 | % | 2.00 | % | ||||||||||
| Net investment income to average net assets |
1.45 | % | 0.35 | % | 1.17 | % | 1.38 | % | 0.87 | % | ||||||||||
| Portfolio turnover rate |
18 | % | 30 | % | 21 | % | 31 | % | 20 | % | ||||||||||
| (1) | Net investment income per share was calculated using the average shares outstanding method. |
See Notes to Financial Statements
72
Table of Contents
Harding, Loevner Funds, Inc.
Financial Highlights (continued)
For the Fiscal Years Ended October 31
| Global Equity Research Portfolio Institutional Class | ||||||||||||||||||||
| 2022 | 2021 | 2020 | 2019 | 2018 | ||||||||||||||||
| Net asset value, beginning of year |
$ | 16.59 | $ | 12.76 | $ | 12.57 | $ | 12.06 | $ | 12.23 | ||||||||||
| Increase (Decrease) in Net Assets from Operations |
||||||||||||||||||||
| Net investment income(1) |
0.14 | 0.10 | 0.10 | 0.14 | 0.10 | |||||||||||||||
| Net realized and unrealized gain (loss) on investments and foreign currency-related transactions |
(4.02 | ) | 4.11 | 0.78 | 1.40 | 0.23 | ||||||||||||||
| Net increase (decrease) from investment operations |
(3.88 | ) | 4.21 | 0.88 | 1.54 | 0.33 | ||||||||||||||
| Distributions to Shareholders from: |
||||||||||||||||||||
| Net investment income |
(0.11 | ) | (0.09 | ) | (0.15 | ) | (0.09 | ) | (0.18 | ) | ||||||||||
| Net realized gain from investments |
(1.67 | ) | (0.29 | ) | (0.54 | ) | (0.94 | ) | (0.32 | ) | ||||||||||
| Total distributions |
(1.78 | ) | (0.38 | ) | (0.69 | ) | (1.03 | ) | (0.50 | ) | ||||||||||
| Net asset value, end of year |
$ | 10.93 | $ | 16.59 | $ | 12.76 | $ | 12.57 | $ | 12.06 | ||||||||||
| Total Return |
(25.96 | )% | 33.45 | % | 7.15 | % | 14.36 | % | 2.74 | % | ||||||||||
| Ratios/Supplemental Data: |
||||||||||||||||||||
| Net assets, end of year (000’s) |
$ | 7,222 | $ | 9,856 | $ | 7,387 | $ | 6,895 | $ | 5,452 | ||||||||||
| Expenses to average net assets |
1.82 | % | 1.75 | % | 2.04 | % | 1.96 | % | 2.64 | % | ||||||||||
| Expenses to average net assets (net of fees waived/reimbursed) |
0.80 | % | 0.80 | % | 0.80 | % | 0.83 | % | 0.90 | % | ||||||||||
| Net investment income to average net assets |
1.11 | % | 0.67 | % | 0.80 | % | 1.18 | % | 0.76 | % | ||||||||||
| Portfolio turnover rate |
34 | % | 39 | % | 44 | % | 44 | % | 45 | % | ||||||||||
| (1) | Net investment income per share was calculated using the average shares outstanding method. |
See Notes to Financial Statements
73
Table of Contents
Harding, Loevner Funds, Inc.
Financial Highlights (continued)
For the Fiscal Years Ended October 31
| International Equity Research Portfolio Institutional Class | ||||||||||||||||||||
| 2022 | 2021 | 2020 | 2019 | 2018 | ||||||||||||||||
| Net asset value, beginning of year |
$ | 14.71 | $ | 12.01 | $ | 12.03 | $ | 11.59 | $ | 13.11 | ||||||||||
| Increase (Decrease) in Net Assets from Operations |
||||||||||||||||||||
| Net investment income(1) |
0.18 | 0.14 | 0.14 | 0.18 | 0.14 | |||||||||||||||
| Net realized and unrealized gain (loss) on investments and foreign currency-related transactions |
(4.12 | ) | 3.03 | 0.07 | 1.17 | (0.93 | ) | |||||||||||||
| Net increase (decrease) from investment operations |
(3.94 | ) | 3.17 | 0.21 | 1.35 | (0.79 | ) | |||||||||||||
| Distributions to Shareholders from: |
||||||||||||||||||||
| Net investment income |
(0.16 | ) | (0.15 | ) | (0.14 | ) | (0.13 | ) | (0.14 | ) | ||||||||||
| Net realized gain from investments |
(1.50 | ) | (0.32 | ) | (0.09 | ) | (0.78 | ) | (0.59 | ) | ||||||||||
| Total distributions |
(1.66 | ) | (0.47 | ) | (0.23 | ) | (0.91 | ) | (0.73 | ) | ||||||||||
| Net asset value, end of year |
$ | 9.11 | $ | 14.71 | $ | 12.01 | $ | 12.03 | $ | 11.59 | ||||||||||
| Total Return |
(29.83 | )% | 26.76 | % | 1.73 | % | 12.93 | % | (6.43 | )% | ||||||||||
| Ratios/Supplemental Data: |
||||||||||||||||||||
| Net assets, end of year (000’s) |
$ | 10,347 | $ | 15,295 | $ | 12,494 | $ | 19,458 | $ | 9,305 | ||||||||||
| Expenses to average net assets |
1.45 | % | 1.45 | % | 1.40 | % | 1.42 | % | 1.78 | % | ||||||||||
| Expenses to average net assets (net of fees waived/reimbursed) |
0.75 | % | 0.75 | % | 0.75 | % | 0.79 | % | 0.90 | % | ||||||||||
| Net investment income to average net assets |
1.59 | % | 0.99 | % | 1.20 | % | 1.62 | % | 1.07 | % | ||||||||||
| Portfolio turnover rate |
33 | % | 38 | % | 51 | % | 44 | % | 43 | % | ||||||||||
| (1) | Net investment income per share was calculated using the average shares outstanding method. |
See Notes to Financial Statements
74
Table of Contents
Harding, Loevner Funds, Inc.
Financial Highlights (continued)
For the Fiscal Years Ended October 31
| Emerging Markets Research Portfolio Institutional Class | ||||||||||||||||||||
| 2022 | 2021 | 2020 | 2019 | 2018 | ||||||||||||||||
| Net asset value, beginning of year |
$ | 13.15 | $ | 11.21 | $ | 11.42 | $ | 10.82 | $ | 13.01 | ||||||||||
| Increase (Decrease) in Net Assets from Operations |
||||||||||||||||||||
| Net investment income(1) |
0.10 | 0.10 | 0.09 | 0.15 | 0.12 | |||||||||||||||
| Net realized and unrealized gain (loss) on investments and foreign currency-related transactions |
(3.73 | ) | 2.04 | 0.17 | 1.35 | (1.34 | ) | |||||||||||||
| Net increase (decrease) from investment operations |
(3.63 | ) | 2.14 | 0.26 | 1.50 | (1.22 | ) | |||||||||||||
| Distributions to Shareholders from: |
||||||||||||||||||||
| Net investment income |
(0.11 | ) | (0.07 | ) | (0.14 | ) | (0.09 | ) | (0.23 | ) | ||||||||||
| Net realized gain from investments |
(1.08 | ) | (0.13 | ) | (0.33 | ) | (0.81 | ) | (0.74 | ) | ||||||||||
| Total distributions |
(1.19 | ) | (0.20 | ) | (0.47 | ) | (0.90 | ) | (0.97 | ) | ||||||||||
| Net asset value, end of year |
$ | 8.33 | $ | 13.15 | $ | 11.21 | $ | 11.42 | $ | 10.82 | ||||||||||
| Total Return |
(30.09 | )% | 19.18 | % | 2.19 | % | 15.05 | % | (10.24 | )% | ||||||||||
| Ratios/Supplemental Data: |
||||||||||||||||||||
| Net assets, end of year (000’s) |
$ | 6,214 | $ | 9,065 | $ | 7,367 | $ | 7,198 | $ | 5,702 | ||||||||||
| Expenses to average net assets |
2.36 | % | 2.30 | % | 2.40 | % | 2.29 | % | 2.90 | % | ||||||||||
| Expenses to average net assets (net of fees waived/reimbursed) |
1.15 | % | 1.15 | % | 1.15 | % | 1.19 | % | 1.30 | % | ||||||||||
| Net investment income to average net assets |
0.94 | % | 0.76 | % | 0.83 | % | 1.35 | % | 0.93 | % | ||||||||||
| Portfolio turnover rate |
43 | % | 45 | % | 67 | % | 58 | % | 55 | % | ||||||||||
| (1) | Net investment income per share was calculated using the average shares outstanding method. |
See Notes to Financial Statements
75
Table of Contents
Harding, Loevner Funds, Inc.
Financial Highlights (continued)
For the Fiscal Years Ended October 31
| Chinese Equity Portfolio Institutional Class | ||||||||
| 2022 | 2021(1) | |||||||
| Net asset value, beginning of year |
$ | 9.36 | $ | 10.00 | ||||
| Increase (Decrease) in Net Assets from Operations |
||||||||
| Net investment income (loss)(2) |
0.02 | (0.02 | ) | |||||
| Net realized and unrealized gain (loss) on investments and foreign currency-related transactions |
(4.33 | ) | (0.62 | ) | ||||
| Net increase (decrease) from investment operations |
(4.31 | ) | (0.64 | ) | ||||
| Distributions to Shareholders from: |
||||||||
| Net investment income |
(0.03 | ) | — | |||||
| Net asset value, end of year |
$ | 5.02 | $ | 9.36 | ||||
| Total Return |
(46.20 | )% | (6.40 | )%(A) | ||||
| Ratios/Supplemental Data: |
||||||||
| Net assets, end of year (000’s) |
$ | 2,600 | $ | 3,942 | ||||
| Expenses to average net assets |
4.01 | % | 7.00 | %(B) | ||||
| Expenses to average net assets (net of fees waived/reimbursed) |
1.15 | % | 1.15 | %(B) | ||||
| Net investment income (loss) to average net assets |
0.27 | % | (0.23 | )%(B) | ||||
| Portfolio turnover rate |
42 | % | 17 | %(A) | ||||
| (A) | Not Annualized. |
| (B) | Annualized. |
| (1) | For the period from December 16, 2020 (commencement of operations) through October 31, 2021. |
| (2) | Net investment income per share was calculated using the average shares outstanding method. |
See Notes to Financial Statements
76
Table of Contents
Harding, Loevner Funds, Inc.
Financial Highlights (continued)
For the Fiscal Years Ended October 31
| Emerging Markets ex China Portfolio Institutional Class | ||||
| 2022(1) | ||||
| Net asset value, beginning of year |
$ | 10.00 | ||
| Increase (Decrease) in Net Assets from Operations |
||||
| Net investment income(2) |
0.01 | |||
| Net realized and unrealized gain (loss) on investments and foreign currency-related transactions |
(0.24 | ) | ||
| Net increase (decrease) from investment operations |
(0.23 | ) | ||
| Distributions to Shareholders from: |
||||
| Net investment income |
— | |||
| Net asset value, end of year |
$ | 9.77 | ||
| Total Return |
(2.30 | )%(A) | ||
| Ratios/Supplemental Data: |
||||
| Net assets, end of year (000’s) |
$ | 3,039 | ||
| Expenses to average net assets |
13.55 | %(B) | ||
| Expenses to average net assets (net of fees waived/reimbursed) |
1.10 | %(B) | ||
| Net investment income to average net assets |
0.99 | %(B) | ||
| Portfolio turnover rate |
1 | %(A) | ||
| (A) | Not Annualized. |
| (B) | Annualized. |
| (1) | For the period from September 14, 2022 (commencement of operations) through October 31, 2022. |
| (2) | Net investment income per share was calculated using the average shares outstanding method. |
See Notes to Financial Statements
77
Table of Contents
Harding, Loevner Funds, Inc.
Financial Highlights (continued)
For the Fiscal Years Ended October 31
| International Developed Markets Equity Portfolio Institutional Class | ||||
| 2022(1) | ||||
| Net asset value, beginning of year |
$ | 10.00 | ||
| Increase (Decrease) in Net Assets from Operations |
||||
| Net investment income(2) |
0.01 | |||
| Net realized and unrealized gain (loss) on investments and foreign currency-related transactions |
0.33 | |||
| Net increase (decrease) from investment operations |
0.34 | |||
| Distributions to Shareholders from: |
||||
| Net investment income |
— | |||
| Net asset value, end of year |
$ | 10.34 | ||
| Total Return |
3.40 | %(A) | ||
| Ratios/Supplemental Data: |
||||
| Net assets, end of year (000’s) |
$ | 1,987 | ||
| Expenses to average net assets |
23.52 | %(B) | ||
| Expenses to average net assets (net of fees waived/reimbursed) |
0.80 | %(B) | ||
| Net investment income to average net assets |
1.00 | %(B) | ||
| Portfolio turnover rate |
3 | %(A) | ||
| (A) | Not Annualized. |
| (B) | Annualized. |
| (1) | For the period from September 28, 2022 (commencement of operations) through October 31, 2022. |
| (2) | Net investment income per share was calculated using the average shares outstanding method. |
See Notes to Financial Statements
78
Table of Contents
Notes to Financial Statements
October 31, 2022
1. Organization
Harding, Loevner Funds, Inc. (the “Fund”) was organized as a Maryland corporation on July 31, 1996, and is registered under the Investment Company Act of 1940, as amended (the “1940 Act”), as an open-end management investment company. The Fund currently has eleven separate diversified Portfolios and one non-diversified Portfolio, all of which were active as of October 31, 2022 (individually, a “Portfolio”, collectively, the “Portfolios”). The Fund is managed by Harding Loevner LP (the “Investment Adviser”).
| Portfolio |
Inception Date |
Investment Objective | ||
| Global Equity Portfolio (“Global Equity”) |
Institutional Class: November 3, 2009 Institutional Class Z: August 1, 2017 Advisor Class: December 1, 1996 |
to seek long-term capital appreciation through investments in equity securities of companies based both inside and outside the United States | ||
| International Equity Portfolio (“International Equity”) |
Institutional Class: May 11, 1994* Institutional Class Z: July 17, 2017 Investor Class: September 30, 2005 |
to seek long-term capital appreciation through investments in equity securities of companies based outside the United States | ||
| International Small Companies Portfolio (“International Small Companies”) |
Institutional Class: June 30, 2011 Investor Class: March 26, 2007 |
to seek long-term capital appreciation through investments in equity securities of small companies based outside the United States | ||
| Institutional Emerging Markets Portfolio** (“Institutional Emerging Markets”) |
Institutional Class (Formerly Class I): October 17, 2005 Institutional Class Z (Formerly Class II): March 5, 2014 |
to seek long-term capital appreciation through investments in equity securities of companies based in emerging markets | ||
| Emerging Markets Portfolio** (“Emerging Markets”) |
Advisor Class: November 9, 1998 | to seek long-term capital appreciation through investments in equity securities of companies based in emerging markets | ||
| Frontier Emerging Markets Portfolio (“Frontier Emerging Markets”) |
Institutional Class I: May 27, 2008 Institutional Class II: March 1, 2017 Investor Class: December 31, 2010 |
to seek long-term capital appreciation through investments in equity securities of companies based in frontier and smaller emerging markets | ||
| Global Equity Research Portfolio (“Global Equity Research”) |
Institutional Class: December 19, 2016 | to seek long-term capital appreciation through investments in equity securities of companies based both inside and outside the United States | ||
| International Equity Research Portfolio (“International Equity Research”) |
Institutional Class: December 17, 2015 | to seek long-term capital appreciation through investments in equity securities of companies based outside the United States | ||
| Emerging Markets Research Portfolio (“Emerging Markets Research”) |
Institutional Class: December 19, 2016 | to seek long-term capital appreciation through investments in equity securities of companies based in emerging markets | ||
| Chinese Equity Portfolio (“Chinese Equity”) |
Institutional Class: December 16, 2020 | to seek long-term capital appreciation through investments in equity securities of Chinese companies | ||
| Emerging Markets ex China Portfolio (“Emerging Markets ex China”) |
Institutional Class: September 14, 2022 | to seek long-term capital appreciation through investments in equity securities of companies based in emerging markets. | ||
| International Developed Markets Equity Portfolio (“International Developed Markets Equity”) |
Institutional Class: September 28, 2022 | to seek long-term capital appreciation through investments in equity securities of companies based in developed markets outside the United States |
* The International Equity Portfolio is the successor to the HLM International Equity Portfolio of AMT Capital Fund, Inc., pursuant to a reorganization that took place on October 31, 1996. Information for periods prior to October 31, 1996, is historical information for the predecessor portfolio.
** Effective March 1, 2019, the Institutional Emerging Markets and Emerging Markets Portfolios’ shares are generally available for purchase by new and existing shareholders, subject to certain limitations that may apply at the Fund’s discretion.
2. Summary of Significant Accounting Policies
The accounting policies of the Fund are in conformity with accounting principles generally accepted in the United States (“GAAP”) for investment companies. Accordingly, the Fund follows accounting and reporting guidance under Financial Accounting Standards Board (“FASB”) Accounting Standards Codification Topic 946, “Financial Services - Investment Companies”. The following is a summary of the Fund’s significant accounting policies:
79
Table of Contents
Harding, Loevner Funds, Inc.
Notes to Financial Statements (continued)
October 31, 2022
2. Summary of Significant Accounting Policies (continued)
Estimates
The preparation of financial statements in accordance with GAAP requires management to make estimates and assumptions that affect the reported amounts and disclosures in the financial statements. Actual results could differ from those estimates.
Valuation
The Board of Directors of the Fund (the “Board” or the “Directors”) has approved procedures (“Procedures”) to govern the valuation of the securities held by each Portfolio of the Fund in accordance with the 1940 Act and Rule 2a-5 thereunder. The Procedures incorporate principles set forth in relevant pronouncements of the Securities and Exchange Commission (“SEC”) and its staff, including guidance on the obligations of the Portfolios and their Directors to determine, in good faith, the fair value of the Portfolios’ securities when market quotations are not “readily available”, as defined by Rule 2a-5.
In determining a Portfolio’s net asset value per share (“NAV”), each equity security traded on a securities exchange, including the NASDAQ Stock Market, and over-the-counter securities, are first valued at the closing price on the exchange or market designated by the Fund’s accounting agent as the principal exchange (each, a “principal exchange”). The closing price provided by the Fund’s accounting agent for a principal exchange may differ from the price quoted elsewhere and may represent information such as last sales price, an official closing price, a closing auction price or other information, depending on exchange or market convention. Shares of open-end mutual funds including money market funds are valued at NAV. Such securities are typically categorized as “Level 1” pursuant to the hierarchy described below.
Since trading in many foreign securities is normally completed before the time at which a Portfolio calculates its NAV, the effect on the value of such securities held by a Portfolio of events that occur between the close of trading in the security and the time at which the Portfolio prices its securities would not be reflected in the Portfolio’s calculation of its NAV if foreign securities were generally valued at their closing prices. To address this issue, the Board has approved the daily use of quantitative models provided by an approved pricing service that may adjust the closing prices of certain foreign equity securities based on information that becomes available after the foreign market closes, through the application of an adjustment factor to such securities’ closing price. Adjustment factors may be greater than, less than, or equal to 1. Thus, use of these quantitative models could cause a Portfolio to value a security higher, lower or equal to its closing market price, which in turn could cause the Portfolio’s NAV per share to differ significantly from that which would have been calculated using closing market prices. The use of these quantitative models is also intended to decrease the opportunities for persons to engage in ‘‘time zone arbitrage,’’ i.e., trading intended to take advantage of stale closing prices in foreign markets that could affect the NAV of the Portfolios. Securities subjected to an adjustment factor due to the use of these quantitative models are not specifically designated on the Portfolios’ Portfolio of Investments as being “fair valued”. Securities with an adjustment factor greater than or less than 1, which are absent the use of significant unobservable inputs into their valuation, are categorized as “Level 2” and securities with an adjustment factor equal to 1, which are absent the use of significant unobservable inputs into their valuation, are categorized as “Level 1” pursuant to the hierarchy described below.
Any securities for which market quotations are not “readily available”, as defined by Rule 2a-5, are priced by the Investment Adviser, as valuation designee, at “fair value as determined in good faith”, in accordance with the Procedures. Such securities are identified on the Portfolios’ Portfolio of Investments as securities valued at “fair value as determined in good faith” and absent the use of significant unobservable inputs into their valuation, such securities would be categorized as “Level 2” pursuant to the hierarchy described below.
GAAP has established a hierarchy for NAV determination purposes in which various inputs are used in determining the value of each Portfolio’s assets or liabilities. GAAP defines fair value as the price that the Portfolio would receive upon selling an investment in a timely transaction to an independent buyer in the principal or most advantageous market of the investment. GAAP establishes a three-tier hierarchy to maximize the use of observable market data and minimize the use of unobservable inputs and to establish classification of fair value measurements for disclosure purposes. Inputs may be observable or unobservable and refer broadly to the assumptions that market participants would use in pricing the asset or liability including assumptions about risk. Such risks include the inherent risk in a particular valuation technique which is used to measure fair value. This may include the quantitative models and/or the inputs to the quantitative models used in the valuation technique described above. Observable inputs are inputs that reflect the assumptions market participants would use in pricing the asset or liability developed based on market data obtained from sources independent of the reporting entity. Unobservable inputs are inputs that reflect the reporting entity’s own assumptions about the assumptions market participants would use in pricing the asset or liability developed based on the best information available in the circumstances. The three-tier hierarchy of inputs is summarized in the three broad levels listed below.
80
Table of Contents
Harding, Loevner Funds, Inc.
Notes to Financial Statements (continued)
October 31, 2022
2. Summary of Significant Accounting Policies (continued)
Level 1 unadjusted quoted prices in active markets for identical assets
Level 2 other significant observable inputs (including quoted prices for similar investments, interest rates, prepayment speeds, credit risk, etc.)
Level 3 significant unobservable inputs (including the Portfolio’s own assumptions in determining the fair value of investments)
GAAP provides additional guidance for estimating fair value when the volume and level of activity for the asset or liability have significantly decreased as well as guidance on identifying circumstances that indicate when a transaction is not orderly.
The following is a summary of the Portfolios’ investments classified by Level 1, Level 2 and Level 3 and security type as of October 31, 2022. Please refer to each Portfolio’s Portfolio of Investments to view individual securities classified by industry type and country.
| Portfolio | Unadjusted Quoted Prices in Active Markets for Identical Assets (Level 1) |
Other Significant Observable Inputs (Level 2) |
Significant Unobservable Inputs (Level 3) |
Total | ||||||||||||
| Global Equity |
||||||||||||||||
| Common Stocks |
$ | 730,909,555 | $ | 251,212,230 | $ | — | $ | 982,121,785 | ||||||||
| Short Term Investments |
27,278,526 | — | — | 27,278,526 | ||||||||||||
| Total Investments |
$ | 758,188,081 | $ | 251,212,230 | $ | — | $ | 1,009,400,311 | ||||||||
| International Equity |
||||||||||||||||
| Common Stocks |
$ | 3,549,295,872 | $ | 9,978,301,954 | $ | — | ‡ | $ | 13,527,597,826 | |||||||
| Short Term Investments |
469,312,346 | — | — | 469,312,346 | ||||||||||||
| Total Investments |
$ | 4,018,608,218 | $ | 9,978,301,954 | $ | — | $ | 13,996,910,172 | ||||||||
| International Small Companies |
||||||||||||||||
| Common Stocks |
$ | 114,292,254 | $ | 354,351,933 | $ | — | $ | 468,644,187 | ||||||||
| Short Term Investments |
15,013,108 | — | — | 15,013,108 | ||||||||||||
| Total Investments |
$ | 129,305,362 | $ | 354,351,933 | $ | — | $ | 483,657,295 | ||||||||
| Institutional Emerging Markets |
||||||||||||||||
| Common Stocks |
$ | 679,350,572 | $ | 1,849,921,118 | $ | — | ‡ | $ | 2,529,271,690 | |||||||
| Preferred Stocks |
93,730,127 | — | — | 93,730,127 | ||||||||||||
| Short Term Investments |
47,286,911 | — | — | 47,286,911 | ||||||||||||
| Total Investments |
$ | 820,367,610 | $ | 1,849,921,118 | $ | — | $ | 2,670,288,728 | ||||||||
| Emerging Markets |
||||||||||||||||
| Common Stocks |
$ | 356,360,781 | $ | 970,388,920 | $ | — | ‡ | $ | 1,326,749,701 | |||||||
| Preferred Stocks |
49,167,350 | — | — | 49,167,350 | ||||||||||||
| Short Term Investments |
23,869,801 | — | — | 23,869,801 | ||||||||||||
| Total Investments |
$ | 429,397,932 | $ | 970,388,920 | $ | — | $ | 1,399,786,852 | ||||||||
| Frontier Emerging Markets |
||||||||||||||||
| Common Stocks |
$ | 33,506,072 | $ | 127,523,985 | $ | — | $ | 161,030,057 | ||||||||
| Preferred Stocks |
3,972,993 | — | — | 3,972,993 | ||||||||||||
| Short Term Investments |
2,879,760 | — | — | 2,879,760 | ||||||||||||
| Total Investments |
$ | 40,358,825 | $ | 127,523,985 | $ | — | $ | 167,882,810 | ||||||||
| Global Equity Research |
||||||||||||||||
| Common Stocks |
$ | 3,790,927 | $ | 3,252,575 | $ | — | ‡ | $ | 7,043,502 | |||||||
| Preferred Stocks |
61,549 | 19,412 | — | 80,961 | ||||||||||||
| Short Term Investments |
119,103 | — | — | 119,103 | ||||||||||||
| Total Investments |
$ | 3,971,579 | $ | 3,271,987 | $ | — | $ | 7,243,566 | ||||||||
81
Table of Contents
Harding, Loevner Funds, Inc.
Notes to Financial Statements (continued)
October 31, 2022
2. Summary of Significant Accounting Policies (continued)
| Portfolio | Unadjusted Quoted Prices in Active Markets for Identical Assets (Level 1) |
Other Significant Observable Inputs (Level 2) |
Significant Unobservable Inputs (Level 3) |
Total | ||||||||||||
| International Equity Research |
||||||||||||||||
| Common Stocks |
$ | 2,005,898 | $ | 7,956,445 | $ | — | ‡ | $ | 9,962,343 | |||||||
| Preferred Stocks |
122,589 | 64,234 | — | 186,823 | ||||||||||||
| Short Term Investments |
231,828 | — | — | 231,828 | ||||||||||||
| Total Investments |
$ | 2,360,315 | $ | 8,020,679 | $ | — | $ | 10,380,994 | ||||||||
| Emerging Markets Research |
||||||||||||||||
| Common Stocks |
$ | 1,598,443 | $ | 4,355,298 | $ | — | ‡ | $ | 5,953,741 | |||||||
| Preferred Stocks |
143,089 | — | — | 143,089 | ||||||||||||
| Short Term Investments |
78,235 | — | — | 78,235 | ||||||||||||
| Total Investments |
$ | 1,819,767 | $ | 4,355,298 | $ | — | $ | 6,175,065 | ||||||||
| Chinese Equity |
||||||||||||||||
| Common Stocks |
$ | — | $ | 2,532,554 | $ | — | $ | 2,532,554 | ||||||||
| Short Term Investments |
72,238 | — | — | 72,238 | ||||||||||||
| Total Investments |
$ | 72,238 | $ | 2,532,554 | $ | — | $ | 2,604,792 | ||||||||
| Emerging Markets ex China |
||||||||||||||||
| Common Stocks |
$ | 1,033,496 | $ | 1,813,103 | $ | — | $ | 2,846,599 | ||||||||
| Preferred Stocks |
82,737 | — | — | 82,737 | ||||||||||||
| Short Term Investments |
60,933 | — | — | 60,933 | ||||||||||||
| Total Investments |
$ | 1,177,166 | $ | 1,813,103 | $ | — | $ | 2,990,269 | ||||||||
| International Developed Markets Equity |
||||||||||||||||
| Common Stocks |
$ | 378,710 | $ | 1,504,067 | $ | — | $ | 1,882,777 | ||||||||
| Short Term Investments |
949 | — | — | 949 | ||||||||||||
| Total Investments |
$ | 379,659 | $ | 1,504,067 | $ | — | $ | 1,883,726 | ||||||||
| ‡ | Investments categorized as level 3 security that is effectively valued at zero. |
As of October 31, 2022, there were investments related to five companies held within the Portfolios, all of which were effectively valued at zero due to the inability of the Portfolios to transact in these investments, the lack of visibility on when the Portfolios may do so, and the lack of readily available market prices for such investments. All of these factors are related to the Russian invasion of Ukraine and responses to that event. The value of these securities compared to the Portfolio’s net assets is not material and therefore, the reconciliation of Level 3 securities and related valuation techniques are not disclosed.
Securities
For financial reporting purposes, all securities transactions are recorded on a trade date basis, as of the last business day in the reporting period. Throughout the reporting period, securities transactions are typically accounted for on a trade date – plus one business day basis. Interest income and expenses are recorded on an accrual basis. Dividend income is recorded on the ex-dividend date (except for certain foreign dividends that may be recorded as soon as the Portfolio is informed of such dividends). The Portfolios use the specific identification method for determining realized gains or losses from sales of securities.
Dividends to Shareholders
It is the policy of the Portfolios to declare dividends from net investment income annually. Net short-term and long-term capital gains distributions for the Portfolios, if any, are also normally distributed on an annual basis.
82
Table of Contents
Harding, Loevner Funds, Inc.
Notes to Financial Statements (continued)
October 31, 2022
2. Summary of Significant Accounting Policies (continued)
Dividends from net investment income and distributions from net realized gains from investment transactions have been determined in accordance with income tax regulations and may differ from net investment income and realized gains recorded by the Portfolios for financial reporting purposes. Differences result primarily from foreign currency transactions and timing differences related to recognition of income, and gains and losses from investment transactions. In general, to the extent that any differences, which are permanent in nature, result in over distributions to shareholders, the amount of the over distribution is reclassified within the capital accounts based on its federal tax basis treatment and may be reported as return of capital. Temporary differences do not require reclassification.
Currency Translation
Assets and liabilities denominated in foreign currencies and commitments under forward foreign currency exchange contracts are translated into U.S. dollars at the mean of the quoted bid and asked prices of such currencies against the U.S. dollar. Purchases and sales of the Portfolios’ securities are translated at the rates of exchange prevailing when such securities were acquired or sold. Income and expenses are translated at exchange rates prevailing when accrued. The Portfolios do not isolate that portion of the results of operations resulting from changes in foreign exchange rates on investments from the fluctuations arising from changes in market prices of securities held. Such fluctuations are included with the “Net realized gain (loss) on investment transactions” and “Change in unrealized appreciation (depreciation) on investments” on the Statements of Operations.
Net realized gains and losses from foreign currency-related transactions arise from sales of foreign currency, currency gains or losses realized between the trade and settlement dates on securities transactions, and the difference between the amounts of dividends, interest, and foreign withholding taxes recorded on the Portfolios’ books, and the U.S. dollar equivalent of the amounts actually received or paid. Net unrealized appreciation or depreciation on translation of assets and liabilities denominated in foreign currencies arise from changes in the value of assets and liabilities other than investments in securities at the period end, resulting from changes in the exchange rates.
Expenses
Most expenses of the Fund can be directly attributed to a particular Portfolio. Expenses which cannot be directly attributed are apportioned among the Portfolios based upon relative net assets or other appropriate measures. If an expense is incurred at the Portfolio level, it is generally apportioned among the classes of that Portfolio based upon relative net assets of each respective class. Certain expenses are incurred at the class level and charged only to that particular class. These expenses may be class specific (i.e., distribution fees charged only to a particular class) or they may be identifiable to a particular class (i.e., the costs related to mailing shareholder reports to shareholders of a particular class).
Organization and Offering Fees
Costs incurred by the International Developed Markets Equity and Emerging Markets ex China Portfolios in connection with their organization were expensed as they were incurred. Costs related to the offering of shares were deferred and amortized on a straight line basis over the twelve-month period from the date of commencement of operations of the Portfolios.
Indemnifications
Under the Fund’s organizational document, its officers and Board are indemnified against certain liability arising out of the performance of their duties to the Portfolios. In the normal course of business, the Fund may enter into contracts that contain a variety of representations or that provide indemnification for certain liabilities. The Fund’s maximum exposure under these arrangements is unknown, as this would involve future claims that may be made against the Fund that have not yet occurred. However, the Fund has not had prior claims or losses pursuant to these contracts and expects the risk of loss to be remote.
3. Transactions with Affiliates and Significant Agreements
The Board has approved investment advisory agreements with the Investment Adviser. Advisory fees are computed daily and paid monthly based on the average daily net assets of each Portfolio. The Investment Adviser has contractually agreed to reduce its fee and/or reimburse the Portfolios for other operating expenses to the extent that aggregate expenses, excluding certain non-operating expenses, exceed certain annual rates of the average daily net assets of each class.
83
Table of Contents
Harding, Loevner Funds, Inc.
Notes to Financial Statements (continued)
October 31, 2022
3. Transactions with Affiliates and Significant Agreements (continued)
The following annualized advisory fees and contractual expense limits were in effect for the year ended October 31, 2022. The advisory fees are charged at the Portfolio level as a whole and expense limitations are at the class specific level.
| Portfolio | First $1 billion of assets |
Next $1 billion of assets |
Next $1 billion of assets |
Over $3 billion of assets |
Over $4 billion of assets |
Over $5 billion of assets |
Contractual Expense Limit(a) |
|||||||||||||||||||||||||||||||||
| Global Equity–Institutional Class |
0.75 | % | 0.73 | % | 0.71 | % | 0.69 | % | 0.69 | % | 0.69 | % | 0.90 | % | ||||||||||||||||||||||||||
| Global Equity–Institutional Class Z |
0.75 | % | 0.73 | % | 0.71 | % | 0.69 | % | 0.69 | % | 0.69 | % | 0.80 | % | ||||||||||||||||||||||||||
| Global Equity–Advisor Class |
0.75 | % | 0.73 | % | 0.71 | % | 0.69 | % | 0.69 | % | 0.69 | % | 1.20 | % | ||||||||||||||||||||||||||
|
International Equity–Institutional Class |
0.75 | % | 0.73 | % | 0.71 | % | 0.69 | % | 0.67 | % | 0.65 | % | 1.00 | % | ||||||||||||||||||||||||||
|
International Equity–Institutional Class Z |
0.75 | % | 0.73 | % | 0.71 | % | 0.69 | % | 0.67 | % | 0.65 | % | 0.80 | % | ||||||||||||||||||||||||||
| International Equity–Investor Class |
0.75 | % | 0.73 | % | 0.71 | % | 0.69 | % | 0.67 | % | 0.65 | % | 1.25 | % | ||||||||||||||||||||||||||
|
International Small Companies–Institutional Class |
0.95 | % | 0.95 | % | 0.95 | % | 0.95 | % | 0.95 | % | 0.95 | % | 1.15 | % | ||||||||||||||||||||||||||
| International Small Companies–Investor Class |
0.95 | % | 0.95 | % | 0.95 | % | 0.95 | % | 0.95 | % | 0.95 | % | 1.30 | %(b),(c) | ||||||||||||||||||||||||||
|
Institutional Emerging Markets–Institutional Class |
1.00 | % | 0.98 | % | 0.96 | % | 0.94 | % | 0.94 | % | 0.94 | % | 1.10 | % | ||||||||||||||||||||||||||
| Institutional Emerging Markets–Institutional Class Z |
1.00 | % | 0.98 | % | 0.96 | % | 0.94 | % | 0.94 | % | 0.94 | % | 1.00 | % | ||||||||||||||||||||||||||
| Emerging Markets–Advisor Class |
1.00 | % | 0.98 | % | 0.96 | % | 0.94 | % | 0.94 | % | 0.94 | % | 1.30 | % | ||||||||||||||||||||||||||
| Frontier Emerging Markets–Institutional Class I |
1.35 | % | 1.35 | % | 1.35 | % | 1.35 | % | 1.35 | % | 1.35 | % | 1.75 | % | ||||||||||||||||||||||||||
| Frontier Emerging Markets–Institutional Class II |
1.35 | % | 1.35 | % | 1.35 | % | 1.35 | % | 1.35 | % | 1.35 | % | 1.35 | % | ||||||||||||||||||||||||||
| Frontier Emerging Markets–Investor Class |
1.35 | % | 1.35 | % | 1.35 | % | 1.35 | % | 1.35 | % | 1.35 | % | 2.00 | % | ||||||||||||||||||||||||||
| Global Equity Research–Institutional Class |
0.70 | % | 0.70 | % | 0.70 | % | 0.70 | % | 0.70 | % | 0.70 | % | 0.80 | % | ||||||||||||||||||||||||||
| International Equity Research–Institutional Class |
0.70 | % | 0.70 | % | 0.70 | % | 0.70 | % | 0.70 | % | 0.70 | % | 0.75 | % | ||||||||||||||||||||||||||
| Emerging Markets Research–Institutional Class |
1.00 | % | 1.00 | % | 1.00 | % | 1.00 | % | 1.00 | % | 1.00 | % | 1.15 | % | ||||||||||||||||||||||||||
| Chinese Equity–Institutional Class |
0.95 | % | 0.95 | % | 0.95 | % | 0.95 | % | 0.95 | % | 0.95 | % | 1.15 | % | ||||||||||||||||||||||||||
| Emerging Markets ex China–Institutional Class |
1.00 | % | 1.00 | % | 1.00 | % | 1.00 | % | 1.00 | % | 1.00 | % | 1.10 | %(c) | ||||||||||||||||||||||||||
| International Developed Markets Equity–Institutional Class |
0.70 | % | 0.70 | % | 0.70 | % | 0.70 | % | 0.70 | % | 0.70 | % | 0.80 | %(c) | ||||||||||||||||||||||||||
| (a) | Effective through February 28, 2023 for each Portfolio except International Small Companies–Investor Class, International Developed Markets Equity-Institutional Class and Emerging Markets ex China-Institutional Class. |
| (b) | Prior to July 1, 2022, the Investment Adviser had contractually agreed to cap the expenses for the International Small Companies Portfolio Investor Class at 1.40%. |
| (c) | Effective through February 28, 2024. |
For the year ended October 31, 2022, the Investment Adviser waived and/or reimbursed the following amounts pursuant to the contractual expense limits described above:
| Portfolio | Fees waived and/or reimbursed by the Investment Adviser | |
| International Small Companies-Investor Class |
$ 26,119 | |
| Institutional Emerging Markets-Institutional Class |
716,916 | |
| Institutional Emerging Markets-Institutional Class Z |
206,524 | |
| Frontier Emerging Markets-Institutional Class II |
178,585 | |
| Frontier Emerging Markets-Investor Class |
12,227 | |
| Global Equity Research-Institutional Class |
85,578 | |
| International Equity Research-Institutional Class |
88,343 | |
| Emerging Markets Research-Institutional Class |
91,967 | |
| Chinese Equity-Institutional Class |
105,952 | |
| Emerging Markets ex China-Institutional Class |
47,349 | |
| International Developed Markets Equity-Institutional Class |
40,100 |
The Fund has an administration agreement with The Northern Trust Company (“Northern Trust”), which provides certain accounting, clerical and bookkeeping services, Blue Sky, corporate secretarial services and assistance in the preparation and filing of tax returns and reports to shareholders and the SEC.
84
Table of Contents
Harding, Loevner Funds, Inc.
Notes to Financial Statements (continued)
October 31, 2022
3. Transactions with Affiliates and Significant Agreements (continued)
Northern Trust also serves as custodian of each Portfolio’s securities and cash, transfer agent, dividend disbursing agent and agent in connection with any accumulation, open-account or similar plans provided to the shareholders of the Portfolios.
Foreside Management Services, LLC provides compliance support to the Fund’s Chief Compliance Officer. Fees paid pursuant to these services are shown as “Compliance officers’ fees and expenses” on the Statements of Operations.
The Fund has adopted an Amended Plan of Distribution pursuant to Rule 12b-1 under the 1940 Act (“Distribution Plan”). Under the Distribution Plan, the Investor Class of each of the International Equity, International Small Companies and Frontier Emerging Markets Portfolios may pay underwriters, distributors, dealers or brokers a fee at an annual rate of up to 0.25% of the average daily net assets of the Portfolio’s Investor Class shares for services or expenses arising in connection with activities primarily intended to result in the sale of Investor Class shares of the Portfolios or for Shareholder Services (defined below) consistent with those described under the Shareholder Servicing Plan.
The Fund, on behalf of the Portfolios, has agreements with various financial intermediaries and “mutual fund supermarkets”, under which customers of these intermediaries may purchase and hold Portfolio shares. These intermediaries assess fees in consideration for providing certain account maintenance, recordkeeping and transactional and other shareholder services (collectively, “Shareholder Services”). With the exception of Institutional Class Z, each Portfolio or class is authorized, pursuant to a Shareholder Servicing Plan, to pay to each intermediary an annual rate of up to 0.25% of its average daily net assets attributable to that intermediary (subject to the contractual expense limits described above) for such Shareholder Services. Because of the contractual expense limits on certain Portfolios’ fees and expenses, the Investment Adviser paid a portion of the Portfolios’ share of these fees during the year ended October 31, 2022. Such payments, if any, are included in the table above under the caption “Fees waived and/or reimbursed by the Investment Adviser”.
A Portfolio may purchase securities from, or sell securities to, an affiliated fund provided the affiliation is due solely to having a common investment adviser, common officers, or common Directors. For the year ended October 31, 2022, no Portfolios engaged in purchases and/or sales of securities from an affiliated portfolio in compliance with Rule 17a-7 of the 1940 Act.
4. Class Specific Expenses
The class level expenses for the year ended October 31, 2022, were as follows for each Portfolio:
| Portfolio | Distribution Fees |
State Registration Filing Fees |
Printing and Postage Fees |
Transfer Agent Fees and Expenses |
Shareholder Servicing Fees |
|||||||||||||||
| Global Equity–Institutional Class |
$ | — | $ | 29,680 | $ | 8,272 | $ | 5,005 | $ | 566,981 | ||||||||||
| Global Equity–Institutional Class Z |
— | 20,209 | 1,638 | 1,212 | — | |||||||||||||||
| Global Equity–Advisor Class |
— | 18,720 | — | 2,455 | 86,129 | |||||||||||||||
| International Equity–Institutional Class |
— | 109,672 | 285,368 | 268,583 | 12,272,591 | |||||||||||||||
| International Equity–Institutional Class Z |
— | 36,940 | 130,956 | 16,327 | — | |||||||||||||||
| International Equity–Investor Class |
800,183 | 27,694 | 40,948 | 17,004 | 395,928 | |||||||||||||||
| International Small Companies–Institutional Class |
— | 30,880 | 29,791 | — | 370,902 | |||||||||||||||
| International Small Companies–Investor Class |
97,790 | 20,645 | 2,781 | 1,119 | 41,753 | |||||||||||||||
| Institutional Emerging Markets–Institutional Class |
— | 42,179 | 111,809 | 11,103 | 3,402,055 | |||||||||||||||
| Institutional Emerging Markets–Institutional Class Z |
— | 25,810 | 9,734 | 5,480 | — | |||||||||||||||
| Emerging Markets–Advisor Class |
— | 64,564 | 169,230 | — | 3,602,730 | |||||||||||||||
| Frontier Emerging Markets–Institutional Class I |
— | 18,799 | 2,155 | 953 | 51,794 | |||||||||||||||
| Frontier Emerging Markets–Institutional Class II |
— | 17,194 | 101 | 247 | — | |||||||||||||||
| Frontier Emerging Markets–Investor Class |
19,826 | 17,814 | 1,020 | 785 | 11,811 | |||||||||||||||
| Global Equity Research–Institutional Class |
— | 22,396 | 83 | 475 | — | |||||||||||||||
| International Equity Research–Institutional Class |
— | 23,513 | 383 | 530 | 997 | |||||||||||||||
| Emerging Markets Research–Institutional Class |
— | 22,410 | 407 | 513 | 283 | |||||||||||||||
| Chinese Equity–Institutional Class |
— | 21,049 | 368 | 742 | 230 | |||||||||||||||
| Emerging Markets ex China–Institutional Class* |
— | 3,431 | 161 | 98 | — | |||||||||||||||
| International Developed Markets Equity–Institutional Class** |
— | 2,409 | 161 | 69 | — | |||||||||||||||
| * | For the period from September 14, 2022 (commencement of operations) through October 31, 2022. |
| ** | For the period from September 28, 2022 (commencement of operations) through October 31, 2022. |
85
Table of Contents
Harding, Loevner Funds, Inc.
Notes to Financial Statements (continued)
October 31, 2022
5. Investment Transactions
Cost of purchases and proceeds from sales of investment securities, other than short-term investments, for the year ended October 31, 2022, were as follows for each Portfolio:
| Portfolio |
Purchase Cost of Investment Securities |
Proceeds from Sales of Investment Securities | ||||||
| Global Equity |
$ 476,517,345 | $ | 690,631,000 | |||||
| International Equity |
2,750,705,959 | 3,991,585,020 | ||||||
| International Small Companies |
213,666,924 | 124,954,325 | ||||||
| Institutional Emerging Markets |
1,050,459,058 | 2,579,837,089 | ||||||
| Emerging Markets |
843,017,478 | 1,950,554,497 | ||||||
| Frontier Emerging Markets |
33,611,618 | 34,787,687 | ||||||
| Global Equity Research |
2,805,824 | 2,811,077 | ||||||
| International Equity Research |
4,065,199 | 4,303,122 | ||||||
| Emerging Markets Research |
3,184,673 | 3,269,372 | ||||||
| Chinese Equity |
2,518,945 | 1,513,674 | ||||||
| Emerging Markets ex China* |
3,045,741 | 39,781 | ||||||
| International Developed Markets Equity** |
1,880,673 | 61,665 | ||||||
| * | For the period from September 14, 2022 (commencement of operations) through October 31, 2022. |
| ** | For the period from September 28, 2022 (commencement of operations) through October 31, 2022. |
6. In-Kind Redemptions
During the year ended October 31, 2022, the International Equity Portfolio delivered portfolio securities rather than cash in exchange for the redemption of shares for certain investors (in-kind redemptions). These investors received readily marketable securities that were valued on the redemption date using the same method employed in calculating the Portfolio’s NAV per share. The International Equity Portfolio had in-kind redemptions of approximately $73,824,231. The redemption amounts are included in “Net increase (decrease) in net assets from portfolio share transactions” on the Statements of Changes in Net Assets. Net gain of approximately $41,683,876 on the securities resulting from such in-kind redemptions are included in “Net realized gain (loss) on investments and foreign currency transactions” in the Statements of Changes in Net Assets. For financial reporting purposes, these transactions are treated as sales of securities and the resulting gains and losses are recognized based on the market value of the securities on the date of the redemption. For tax purposes, no gains or losses are recognized.
7. Capital Share Transactions
Transactions in capital shares for the year ended October 31, 2022, were as follows for each Portfolio:
| Net | Net | |||||||||||||||||||||||||||||||
| Proceeds | Shares From | Reinvestment | Payments | Increase | Increase | |||||||||||||||||||||||||||
| Shares | From | Reinvested | of | Shares | for Shares | (Decrease) | (Decrease) | |||||||||||||||||||||||||
| Sold | Shares Sold | Dividends | Dividends | Redeemed | Redeemed | in Shares | in Net Assets | |||||||||||||||||||||||||
| Global Equity |
||||||||||||||||||||||||||||||||
| Institutional Class |
4,499,014 | $ | 163,935,948 | 3,943,187 | $ | 176,536,474 | (9,138,598 | ) | $ | (333,756,177 | ) | (696,397 | ) | $ | 6,716,245 | |||||||||||||||||
| Institutional Class Z |
177,195 | 6,768,641 | 1,048,461 | 46,971,052 | (660,623 | ) | (27,975,151 | ) | 565,033 | 25,764,542 | ||||||||||||||||||||||
| Advisor Class |
85,512 | 3,344,463 | 159,875 | 7,138,414 | (362,000 | ) | (12,930,489 | ) | (116,613 | ) | (2,447,612 | ) | ||||||||||||||||||||
| International Equity |
||||||||||||||||||||||||||||||||
| Institutional Class |
121,556,775 | 3,130,568,965 | 11,513,852 | 335,974,199 | (209,556,327 | ) | (5,199,499,358 | ) | (76,485,700 | ) | (1,732,956,194 | ) | ||||||||||||||||||||
| Institutional Class Z |
35,957,143 | 927,103,574 | 2,485,478 | 72,476,537 | (17,121,493 | ) | (436,550,437 | ) | 21,321,128 | 563,029,674 | ||||||||||||||||||||||
| Investor Class |
3,248,977 | 83,706,469 | 279,397 | 8,155,604 | (7,681,750 | ) | (185,789,421 | ) | (4,153,376 | ) | (93,927,348 | ) | ||||||||||||||||||||
| International Small Companies |
|
|||||||||||||||||||||||||||||||
| Institutional Class |
12,760,628 | 225,781,592 | 710,008 | 14,860,475 | (7,489,974 | ) | (132,604,022 | ) | 5,980,662 | 108,038,045 | ||||||||||||||||||||||
| Investor Class |
426,937 | 7,516,379 | 62,997 | 1,304,026 | (677,265 | ) | (11,792,670 | ) | (187,331 | ) | (2,972,265 | ) | ||||||||||||||||||||
| Institutional Emerging Markets |
|
|||||||||||||||||||||||||||||||
| Institutional Class |
45,070,778 | 925,238,726 | 1,366,081 | 32,977,191 | (127,900,747 | ) | (2,497,513,793 | ) | (81,463,888 | ) | (1,539,297,876 | ) | ||||||||||||||||||||
| Institutional Class Z |
4,223,110 | 96,480,073 | 178,360 | 4,316,319 | (9,816,205 | ) | (193,225,310 | ) | (5,414,735 | ) | (92,428,918 | ) | ||||||||||||||||||||
| Emerging Markets |
||||||||||||||||||||||||||||||||
| Advisor Class |
14,020,894 | 725,209,438 | 4,567,688 | 267,209,765 | (39,441,987 | ) | (1,871,896,415 | ) | (20,853,405 | ) | (879,477,212 | ) | ||||||||||||||||||||
86
Table of Contents
Harding, Loevner Funds, Inc.
Notes to Financial Statements (continued)
October 31, 2022
7. Capital Share Transactions (continued)
| Net | Net | |||||||||||||||||||||||||||||||
| Proceeds | Shares From | Reinvestment | Payments | Increase | Increase | |||||||||||||||||||||||||||
| Shares | From | Reinvested | of | Shares | for Shares | (Decrease) | (Decrease) | |||||||||||||||||||||||||
| Sold | Shares Sold | Dividends | Dividends | Redeemed | Redeemed | in Shares | in Net Assets | |||||||||||||||||||||||||
| Frontier Emerging Markets |
|
|||||||||||||||||||||||||||||||
| Institutional Class I |
2,866,309 | $ | 21,310,690 | 80,150 | $ 682,875 | (2,749,323 | ) | $ | (21,111,289 | ) | 197,136 | $ | 882,276 | |||||||||||||||||||
| Institutional Class II |
— | — | 119,815 | 1,026,818 | — | — | 119,815 | 1,026,818 | ||||||||||||||||||||||||
| Investor Class |
104,395 | 801,129 | 4,964 | 42,195 | (188,853 | ) | (1,445,992 | ) | (79,494 | ) | (602,668 | ) | ||||||||||||||||||||
| Global Equity Research |
||||||||||||||||||||||||||||||||
| Institutional Class |
1 | 10 | 73,566 | 1,055,667 | (6,957 | ) | (102,815 | ) | 66,610 | 952,862 | ||||||||||||||||||||||
| International Equity Research |
||||||||||||||||||||||||||||||||
| Institutional Class |
18,703 | 212,600 | 136,234 | 1,698,835 | (58,784 | ) | (705,529 | ) | 96,153 | 1,205,906 | ||||||||||||||||||||||
| Emerging Markets Research |
||||||||||||||||||||||||||||||||
| Institutional Class |
14,127 | 142,899 | 71,408 | 819,048 | (29,111 | ) | (323,200 | ) | 56,424 | 638,747 | ||||||||||||||||||||||
| Chinese Equity |
||||||||||||||||||||||||||||||||
| Institutional Class |
179,957 | 1,533,831 | 1,233 | 11,045 | (84,681 | ) | (641,499 | ) | 96,509 | 903,377 | ||||||||||||||||||||||
| Emerging Markets ex China |
||||||||||||||||||||||||||||||||
| Institutional Class* |
310,900 | 3,109,000 | — | — | — | — | 310,900 | 3,109,000 | ||||||||||||||||||||||||
| International Developed Markets Equity |
||||||||||||||||||||||||||||||||
| Institutional Class** |
192,100 | 1,921,000 | — | — | — | — | 192,100 | 1,921,000 | ||||||||||||||||||||||||
| * | For the period from September 14, 2022 (commencement of operations) through October 31, 2022. |
| ** | For the period from September 28, 2022 (commencement of operations) through October 31, 2022. |
Transactions in capital shares for the year ended October 31, 2021, were as follows for each Portfolio:
| Net | Net | |||||||||||||||||||||||||||||||
| Proceeds | Shares From | Reinvestment | Payments | Increase | Increase | |||||||||||||||||||||||||||
| Shares | From | Reinvested | of | Shares | for Shares | (Decrease) | (Decrease) | |||||||||||||||||||||||||
| Sold | Shares Sold | Dividends | Dividends | Redeemed | Redeemed | in Shares | in Net Assets | |||||||||||||||||||||||||
| Global Equity |
||||||||||||||||||||||||||||||||
| Institutional Class |
2,755,173 | $ | 134,959,470 | 1,350,884 | $61,262,574 | (3,594,707 | ) | $ | (177,912,826 | ) | 511,350 | $ | 18,309,218 | |||||||||||||||||||
| Institutional Class Z |
1,253,152 | 60,994,104 | 296,046 | 13,419,766 | (1,334,691 | ) | (67,042,458 | ) | 214,507 | 7,371,412 | ||||||||||||||||||||||
| Advisor Class |
260,555 | 12,723,575 | 72,150 | 3,270,573 | (591,279 | ) | (29,240,671 | ) | (258,574 | ) | (13,246,523 | ) | ||||||||||||||||||||
| International Equity |
||||||||||||||||||||||||||||||||
| Institutional Class |
135,837,628 | 3,960,640,326 | 3,415,990 | 94,725,399 | (116,226,503 | ) | (3,408,764,560 | ) | 23,027,115 | 646,601,165 | ||||||||||||||||||||||
| Institutional Class Z |
40,762,511 | 1,210,064,860 | 756,652 | 20,966,814 | (27,234,972 | ) | (808,810,658 | ) | 14,284,191 | 422,221,016 | ||||||||||||||||||||||
| Investor Class |
3,429,544 | 101,106,880 | 59,184 | 1,641,770 | (4,364,393 | ) | (124,448,384 | ) | (875,665 | ) | (21,699,734 | ) | ||||||||||||||||||||
| International Small Companies |
||||||||||||||||||||||||||||||||
| Institutional Class |
7,747,074 | 162,134,735 | 29,893 | 569,448 | (3,321,648 | ) | (69,970,353 | ) | 4,455,319 | 92,733,830 | ||||||||||||||||||||||
| Investor Class |
178,402 | 3,648,929 | 661 | 12,455 | (310,774 | ) | (6,371,973 | ) | (131,711 | ) | (2,710,589 | ) | ||||||||||||||||||||
| Institutional Emerging Markets |
||||||||||||||||||||||||||||||||
| Institutional Class |
39,751,528 | 1,033,720,059 | 773,359 | 19,248,905 | (43,255,578 | ) | (1,125,114,886 | ) | (2,730,691 | ) | (72,145,922 | ) | ||||||||||||||||||||
| Institutional Class Z |
6,828,128 | 178,141,359 | 126,142 | 3,145,987 | (8,363,042 | ) | (220,163,091 | ) | (1,408,772 | ) | (38,875,745 | ) | ||||||||||||||||||||
| Emerging Markets |
||||||||||||||||||||||||||||||||
| Advisor Class |
11,237,277 | 764,954,443 | 203,160 | 13,223,728 | (21,865,322 | ) | (1,501,100,934 | ) | (10,424,885 | ) | (722,922,763 | ) | ||||||||||||||||||||
| Frontier Emerging Markets |
||||||||||||||||||||||||||||||||
| Institutional Class I |
3,693,948 | 29,496,185 | 132,190 | 1,028,440 | (3,620,253 | ) | (29,434,849 | ) | 205,885 | 1,089,776 | ||||||||||||||||||||||
| Institutional Class II |
— | — | 291,739 | 2,278,483 | (4,064,425 | ) | (33,725,470 | ) | (3,772,686 | ) | (31,446,987 | ) | ||||||||||||||||||||
| Investor Class |
152,653 | 1,225,142 | 17,809 | 138,196 | (600,304 | ) | (4,763,885 | ) | (429,842 | ) | (3,400,547 | ) | ||||||||||||||||||||
| Global Equity Research |
||||||||||||||||||||||||||||||||
| Institutional Class |
34 | 501 | 15,309 | 217,846 | — | — | 15,343 | 218,347 | ||||||||||||||||||||||||
| International Equity Research |
||||||||||||||||||||||||||||||||
| Institutional Class |
14,627 | 208,669 | 36,323 | 489,632 | (51,422 | ) | (733,085 | ) | (472 | ) | (34,784 | ) | ||||||||||||||||||||
| Emerging Markets Research |
||||||||||||||||||||||||||||||||
| Institutional Class |
22,627 | 302,608 | 10,514 | 134,267 | (653 | ) | (8,647 | ) | 32,488 | 428,228 | ||||||||||||||||||||||
87
Table of Contents
Harding, Loevner Funds, Inc.
Notes to Financial Statements (continued)
October 31, 2022
7. Capital Share Transactions (continued)
| Net | Net | |||||||||||||||||||||||||||||||
| Proceeds | Shares From | Reinvestment | Payments | Increase | Increase | |||||||||||||||||||||||||||
| Shares | From | Reinvested | of | Shares | for Shares | (Decrease) | (Decrease) | |||||||||||||||||||||||||
| Sold | Shares Sold | Dividends | Dividends | Redeemed | Redeemed | in Shares | in Net Assets | |||||||||||||||||||||||||
| Chinese Equity |
||||||||||||||||||||||||||||||||
| Institutional Class* |
421,003 | $ | 4,280,500 | — | $ | — | — | $ | — | 421,003 | $ | 4,280,500 | ||||||||||||||||||||
| * | For the period from December 16, 2020 (commencement of operations) through October 31, 2021. |
8. Income Tax
The cost of investments for federal income tax purposes and the components of net unrealized appreciation (depreciation) on investments at October 31, 2022, for each of the Portfolios were as follows:
| Gross | Gross | Net Unrealized | ||||||||||||||
| Unrealized | Unrealized | Appreciation / | ||||||||||||||
| Portfolio | Appreciation | Depreciation | (Depreciation) | Cost | ||||||||||||
| Global Equity |
$ | 195,860,803 | $ | (133,220,506 | ) | $ | 62,640,297 | $ | 946,760,014 | |||||||
| International Equity |
3,204,039,092 | (1,841,401,977 | ) | 1,362,637,115 | 12,634,273,057 | |||||||||||
| International Small Companies |
56,322,999 | (86,856,359 | ) | (30,533,360 | ) | 514,190,655 | ||||||||||
| Institutional Emerging Markets |
685,127,442 | (776,177,371 | ) | (91,049,929 | ) | 2,761,338,657 | ||||||||||
| Emerging Markets |
377,920,518 | (286,858,851 | ) | 91,061,667 | 1,308,725,185 | |||||||||||
| Frontier Emerging Markets |
22,452,233 | (20,408,197 | ) | 2,044,036 | 165,838,774 | |||||||||||
| Global Equity Research |
1,128,586 | (1,426,147 | ) | (297,561 | ) | 7,541,127 | ||||||||||
| International Equity Research |
1,008,421 | (2,622,162 | ) | (1,613,741 | ) | 11,994,735 | ||||||||||
| Emerging Markets Research |
582,497 | (2,093,208 | ) | (1,510,711 | ) | 7,685,776 | ||||||||||
| Chinese Equity |
1,900 | (1,880,630 | ) | (1,878,730 | ) | 4,483,522 | ||||||||||
| Emerging Markets ex China |
109,993 | (186,014 | ) | (76,021 | ) | 3,066,290 | ||||||||||
| International Developed Markets Equity |
96,665 | (36,152 | ) | 60,513 | 1,823,213 | |||||||||||
It is the policy of each Portfolio of the Fund to qualify as a regulated investment company by complying with the applicable provisions of the Internal Revenue Code, and to make distributions of taxable income sufficient to relieve it from substantially all federal income and excise taxes; therefore, no federal income tax provision is required.
The Portfolios may be subject to taxes imposed by countries in which they invest. Such taxes are generally based on income and/or capital gains earned. Taxes are accrued based on net investment income, net realized gains and net unrealized appreciation as such income and/or gains are recorded. Taxes accrued on unrealized gains are reflected as a liability on the Statements of Assets and Liabilities under the caption “Deferred capital gains tax” and as a reduction in “Distributable earnings”. When assets subject to capital gains tax are sold, accrued taxes are relieved, and the actual amount of the taxes paid is reflected on the Statements of Operations as a reduction in “Net realized gain (loss) on Investment Transactions”. The Portfolios seek to recover a portion of foreign withholding taxes applied to income earned in jurisdictions where favorable treaty rates for US investors are available. The portion of such taxes believed to be recoverable is reflected as an asset on the Statements of Assets and Liabilities under the caption “Tax reclaims receivable”.
Management has performed an analysis of each Portfolio’s tax positions for the open tax years as of October 31, 2022, and has concluded that no provisions for income tax are required. The Portfolios’ federal tax returns for the prior three fiscal years (open tax years: October 31, 2020; October 31, 2021; October 31, 2022) remain subject to examination by the Portfolios’ major tax jurisdictions, which include the United States, the State of New Jersey and the State of Maryland. Management is not aware of any events that are reasonably possible to occur in the next twelve months that would result in the amounts of any unrecognized tax benefits significantly increasing or decreasing for the Portfolios. However, management’s conclusions regarding tax positions taken may be subject to review and adjustment at a later date based on factors including, but not limited to, new tax laws and accounting regulations and interpretations thereof.
88
Table of Contents
Harding, Loevner Funds, Inc.
Notes to Financial Statements (continued)
October 31, 2022
8. Income Tax (continued)
The tax character of distributions paid during the fiscal years ended October 31, 2022 and 2021 were as follows:
| Distributions From | ||||||||||||||||
|
|
||||||||||||||||
| Ordinary | Long-Term | Ordinary | Long-Term | |||||||||||||
| Income | Capital Gains | Income | Capital Gains | |||||||||||||
| Portfolio | 2022 | 2022 | 2021 | 2021 | ||||||||||||
|
|
||||||||||||||||
| Global Equity |
$ | 25,226,683 | $ | 218,044,994 | $ | 10,667,822 | $ | 75,826,990 | ||||||||
| International Equity |
304,870,793 | 229,955,619 | 147,195,007 | — | ||||||||||||
| International Small Companies |
1,591,579 | 15,922,215 | 622,621 | — | ||||||||||||
| Institutional Emerging Markets |
44,801,573 | — | 26,645,680 | — | ||||||||||||
| Emerging Markets |
20,227,648 | 269,068,922* | 14,604,731 | — | ||||||||||||
| Frontier Emerging Markets |
1,827,725 | — | 3,730,104 | — | ||||||||||||
| Global Equity Research |
275,005 | 780,662 | 190,800 | 27,046 | ||||||||||||
| International Equity Research |
639,474 | 1,059,361 | 489,632 | — | ||||||||||||
| Emerging Markets Research |
278,543 | 540,505 | 66,856 | 67,411 | ||||||||||||
| Chinese Equity |
11,045 | — | — | — | ||||||||||||
| * | This amount does not include tax equalization utilized of $46,349,498 which the Fund designated as being distributed to shareholders upon their redemption of shares. |
As of October 31, 2022, the components of distributable earnings/(deficit) on a tax basis were as follows:
|
|
||||||||||||||||||||
| Undistributed | Undistributed | Accumulated | Unrealized | Total | ||||||||||||||||
| Ordinary | Long-Term | Capital and | Appreciation | Accumulated | ||||||||||||||||
| Portfolio | Income | Capital Gains | Other Losses | (Depreciation)(1) | Earnings/(Deficit) | |||||||||||||||
|
|
|
|
|
|
|
|
|
|
|
|
||||||||||
| Global Equity |
$ | — | $ | — | $ | (174,565 | ) | $ | 62,576,922 | $ | 62,402,357 | |||||||||
| International Equity |
365,137,514 | — | (58,148,818 | ) | 1,360,038,395 | 1,667,027,091 | ||||||||||||||
| International Small Companies |
3,730,317 | 7,560,617 | — | (30,653,747 | ) | (19,362,813 | ) | |||||||||||||
| Institutional Emerging Markets |
24,039,983 | — | (74,333,569 | ) | (98,199,699 | ) | (148,493,285 | ) | ||||||||||||
| Emerging Markets |
10,426,911 | 101,851,078 | — | 87,179,178 | 199,457,167 | |||||||||||||||
| Frontier Emerging Markets |
3,560,898 | — | (106,394,078 | ) | 1,487,850 | (101,345,330 | ) | |||||||||||||
| Global Equity Research |
80,904 | 373,656 | — | (300,614 | ) | 153,946 | ||||||||||||||
| International Equity Research |
172,567 | 232,023 | (4,394 | ) | (1,620,998 | ) | (1,220,802 | ) | ||||||||||||
| Emerging Markets Research |
45,681 | — | (138,048 | ) | (1,521,843 | ) | (1,614,210 | ) | ||||||||||||
| Chinese Equity |
12,320 | — | (715,857 | ) | (1,878,730 | ) | (2,582,267 | ) | ||||||||||||
| Emerging Markets ex China* |
7,613 | — | (811 | ) | (76,009 | ) | (69,207 | ) | ||||||||||||
| International Developed Markets Equity** |
5,381 | — | — | 60,500 | 65,881 | |||||||||||||||
| * | For the period from September 14, 2022 (commencement of operations) through October 31, 2022. |
| ** | For the period from September 28, 2022 (commencement of operations) through October 31, 2022. |
(1) The difference between book basis and tax basis net unrealized appreciation is attributable primarily to the tax deferral of losses on certain sale of securities. Unrealized Appreciation (Depreciation) includes amounts related to foreign currency and currency translations.
89
Table of Contents
Harding, Loevner Funds, Inc.
Notes to Financial Statements (continued)
October 31, 2022
8. Income Tax (continued)
Under the Regulated Investment Company Modernization Act of 2010 (the “Act”), each Portfolio is permitted to carry forward capital losses incurred in taxable years beginning after the date of enactment for an unlimited period. Additionally, post-enactment capital loss carryforwards will retain their character as either short-term or long-term capital losses.
At October 31, 2022, capital losses incurred that will be carried forward indefinitely under provisions of the Act were as follows:
| Portfolio | Short-Term Capital Loss Carryforward |
Long-Term Capital Loss Carryforward |
||||||
|
|
||||||||
| Global Equity |
$ | (174,565 | ) | $ | — | |||
| International Equity |
(58,148,818 | ) | — | |||||
| Institutional Emerging Markets |
(74,333,569 | ) | — | |||||
| Frontier Emerging Markets |
(19,744,192 | ) | (86,649,886 | ) | ||||
| Emerging Markets Research |
(122,869 | ) | (15,179 | ) | ||||
| Chinese Equity |
(389,424 | ) | (304,620 | ) | ||||
| Emerging Markets ex China* |
(811 | ) | — | |||||
| * | For the period from September 14, 2022 (commencement of operations) through October 31, 2022. |
Primarily as a result of differing book/tax treatment of foreign currency transactions and foreign capital gain tax expenses, the Portfolios made reclassifications among certain capital accounts. The reclassifications have no impact on the net assets of the Portfolios. As of October 31, 2022, the following reclassifications were made to the Statements of Assets and Liabilities:
|
|
||||||||
| Portfolio | Paid-in Capital | Distributable earnings | ||||||
|
|
||||||||
| Global Equity |
$ | (1,272,727 | ) | $ | 1,272,727 | |||
| International Equity |
38,917,579 | (38,917,579 | ) | |||||
| Emerging Markets |
46,349,498 | (46,349,498 | ) | |||||
| Emerging Markets ex China |
(960 | ) | 960 | |||||
| International Developed Markets Equity |
(232 | ) | 232 | |||||
During the fiscal year ended October 31, 2022, the Institutional Emerging Markets Portfolio utilized $17,751,889 in capital loss carryforwards.
9. Foreign Exchange Contracts
The Portfolios do not generally hedge foreign currency exposure, however, the Portfolios may enter into forward foreign exchange contracts in order to hedge their exposure to changes in foreign currency exchange rates on their foreign portfolio holdings. Each Portfolio will conduct its currency transactions either on a spot (cash) basis at the rate prevailing in the currency exchange market, or by entering into forward contracts to purchase or sell currency. Foreign currency transactions entered into on the spot markets serve to pay for foreign investment purchases or to convert to dollars, the proceeds from foreign investment sales or dividend and interest receipts. The Portfolios will disclose open forward currency contracts, if any, on the Portfolios of Investments. The Portfolios do not separately disclose open spot market transactions on the Portfolios of Investments. Such realized gain (loss) and unrealized appreciation (depreciation) on spot market transactions is included in “Net realized gain (loss) on foreign currency transactions” and “Change in unrealized appreciation (depreciation) on translation of assets and liabilities denominated in foreign currencies”, respectively, on the Portfolios’ Statements of Operations. The Portfolios held no open forward currency contracts as of or during the fiscal year ended October 31, 2022.
The Central Bank of Nigeria has implemented currency controls that significantly limit the ability to convert Nigerian Naira (NGN) to U.S. dollars. As of October 31, 2022, the Frontier Emerging Markets Portfolio had 5.2% of Nigeria exposure (comprised of 1.6% NGN and 3.6% Nigerian equities) and the Emerging Markets Research Portfolio had 0.9% of Nigeria exposure (comprised of 0.9% NGN). The NGN has been valued based on an established foreign currency benchmark rate and the Nigerian equity securities have been valued at their closing price on the Nigerian Stock Exchange. These valuation methodologies are in accordance with the Procedures and GAAP. However, the conversion rate from NGN to U.S. dollars does not reflect the impact of the aforementioned currency controls. As a result, the value of NGN currently held, any proceeds from the sale of Nigerian equities received by the Frontier Emerging Markets and Emerging Markets Research Portfolios, or dividends received by the Portfolios in connection with their investment in such Nigerian equities, may differ materially once converted from NGN to U.S. dollars.
90
Table of Contents
Harding, Loevner Funds, Inc.
Notes to Financial Statements (continued)
October 31, 2022
10. Concentration of Ownership
At October 31, 2022, the percentage of total shares outstanding held by record shareholders each owning 10% or greater of the aggregate shares outstanding of each Portfolio were as follows:
|
No. of Shareholders |
% Ownership | |||||||
| Global Equity |
2 | 42.79 | %* | |||||
| International Equity |
2 | 25.90 | %* | |||||
| International Small Companies |
3 | 52.83 | %* | |||||
| Institutional Emerging Markets |
2 | 53.04 | %* | |||||
| Emerging Markets |
4 | 88.25 | %* | |||||
| Frontier Emerging Markets |
3 | 47.03 | %* | |||||
| Global Equity Research |
2 | 84.22 | % | |||||
| International Equity Research |
3 | 74.60 | %* | |||||
| Emerging Markets Research |
2 | 73.60 | % | |||||
| Chinese Equity |
1 | 51.55 | % | |||||
| Emerging Markets ex China |
2 | 64.33 | % | |||||
| International Developed Markets Equity |
2 | 78.08 | % | |||||
| * | Includes omnibus positions of broker-dealers representing numerous shareholder accounts. |
Investment activities of these shareholders may have a material effect on the Portfolios.
11. Concentration of Risk
Investing in securities of foreign issuers and currency transactions may involve certain considerations and risks not typically associated with investments in U.S. issuers. These risks include revaluation of currencies; adverse fluctuations in foreign currency values; and possible adverse political, social and economic developments, including those particular to a specific industry, country or region, which could cause the securities and their markets to be less liquid and prices more volatile than those of comparable U.S. companies and U.S. government securities. These risks are greater with respect to securities of issuers located in emerging market countries in which the Portfolios are authorized to invest.
The Frontier Emerging Markets Portfolio is permitted to invest up to 35% of its total assets in companies in the same industry, if, at the time of investment, that industry represents 20% or more of the Frontier Emerging Markets Portfolio’s benchmark index. During periods when the Frontier Emerging Markets Portfolio has invested more than 25% of its total assets in companies in the same industry, it will operate as a concentrated portfolio and be subject to additional risks and greater volatility. Such additional risks include increased competition within the industry, or changes in legislation, or government regulations affecting the industry. The value of the Frontier Emerging Markets Portfolio’s shares may be particularly vulnerable to factors affecting the banking industry, such as the availability and cost of capital funds, changes in interest rates, the rate of corporate and consumer debt defaults, extensive government regulation, and price competition. Such risks may be magnified with respect to securities of issuers in Frontier Emerging Markets. At October 31, 2022, the Frontier Emerging Markets Portfolio’s investment in the Banking industry amounted to 33.09% of its total assets.
As a non-diversified fund, the Chinese Equity Portfolio has the ability to invest a larger percentage of its assets in the securities of a smaller number of issuers than a diversified fund. As a result, poor performance by a single issuer could adversely affect the Chinese Equity Portfolio’s performance more than if the Chinese Equity Portfolio were invested in a larger number of issuers.
Investing in securities issued by companies located in Russia involves significant risks, including legal, regulatory, currency and economic risks that are specific to Russia. In addition, investing in securities issued by companies located in Russia involves risks associated with the settlement of portfolio transactions and loss of a Portfolio’s ownership rights in its portfolio securities as a result of the system of share registration and custody in Russia. Governments in the U.S. and many other countries have imposed economic sanctions on certain Russian individuals and Russian corporate and banking entities. A number of jurisdictions may also institute broader sanctions on Russia, including banning Russia from global payments systems that facilitate cross-border payments. Additionally, Russia is alleged to have participated in state-sponsored cyberattacks against foreign companies and foreign governments. Russia launched a large-scale invasion of Ukraine on February 24, 2022. The extent and duration of the military action, resulting sanctions and resulting future market disruptions, including declines in its stock markets and the value of the ruble against the U.S. dollar, are impossible to predict, but could be significant. Any such disruptions caused by Russian military action or other actions (including cyberattacks and espionage) or resulting actual and threatened responses to such activity, including purchasing and financing restrictions, boycotts or changes in consumer or purchaser preferences, sanctions, tariffs or cyberattacks on the Russian government, Russian companies, or Russian individuals, including politicians, may impact Russia’s economy and Russian issuers of securities in which a Portfolio invests. Actual and threatened responses to such military action may also impact the markets for certain Russian
91
Table of Contents
Harding, Loevner Funds, Inc.
Notes to Financial Statements (continued)
October 31, 2022
11. Concentration of Risk (continued)
commodities, such as oil and natural gas, as well as other sectors of the Russian economy, and may likely have collateral impacts on such sectors globally. Such responses could also result in the immediate freeze of Russian securities and/or funds invested in prohibited assets, impairing the ability of a Portfolio to buy, sell, receive or deliver those securities and/or assets.
12. Pandemic Risk
The outbreak of the novel coronavirus (“COVID-19”) and subsequent global pandemic has significantly impacted the global economy, individual companies, and financial markets in general and throughout the world has created significant uncertainty. The duration and extent of COVID-19 over the long-term cannot be reasonably estimated at this time. The ultimate impact of COVID-19 and the extent to which COVID-19 impacts the Fund’s normal course of business, results of operations, investments, and cash flows will depend on future developments, which are highly uncertain and difficult to predict.
13. Line of Credit
The Fund has a $300 million line of credit agreement with Northern Trust. Borrowings are made solely to facilitate the handling of redemptions or unusual or unanticipated short-term cash requirements. Because several Portfolios participate and collateral requirements apply, there is no assurance that an individual Portfolio will have access to the entire $300 million at any particular time. Interest is charged to each Portfolio based on its borrowings at an amount above the Federal Funds rate, subject to a minimum rate. In addition, a facility fee is computed at an annual rate of 0.25% on the line of credit and is allocated among the Portfolios.
For the year ended October 31, 2022, Emerging Markets had an outstanding balance for four days with a maximum balance of $173,600,000 at an average weighted interest rate of 1.92%. Chinese Equity had an outstanding balance for four days with a maximum balance of $200,000 at an average weighted interest rate of 2.46%.
14. Subsequent Events
Subsequent events occurring after the date of this report have been evaluated for potential impact, for purposes of recognition or disclosure in the financial statements, through the date the report was issued.
92
Table of Contents

KPMG LLP
345 Park Avenue
New York, NY 10154-0102
Report of Independent Registered Public Accounting Firm
To the Shareholders and Board of Directors
Harding, Loevner Funds, Inc.:
Opinion on the Financial Statements
We have audited the accompanying statements of assets and liabilities of Global Equity Portfolio, International Equity Portfolio, International Small Companies Portfolio, Institutional Emerging Markets Portfolio, Emerging Markets Portfolio, Frontier Emerging Markets Portfolio, Global Equity Research Portfolio, International Equity Research Portfolio, Emerging Markets Research Portfolio, Chinese Equity Portfolio, Emerging Markets ex China Portfolio, and International Developed Markets Equity Portfolio (each a portfolio of Harding, Loevner Funds, Inc.) (the Portfolios), including the portfolios of investments, as of October 31, 2022, the related statements of operations and changes in net assets for the Portfolios and periods listed in Appendix A, and the related notes (collectively, the financial statements) and the financial highlights for the Portfolios and periods listed in Appendix A. In our opinion, the financial statements and financial highlights present fairly, in all material respects, the financial position of the Portfolios as of October 31, 2022, the results of their operations and changes in their net assets for the Portfolios and periods listed in Appendix A, and the financial highlights for the Portfolios and periods listed in Appendix A, in conformity with U.S. generally accepted accounting principles.
Basis for Opinion
These financial statements and financial highlights are the responsibility of the Portfolios’ management. Our responsibility is to express an opinion on these financial statements and financial highlights based on our audits. We are a public accounting firm registered with the Public Company Accounting Oversight Board (United States) (PCAOB) and are required to be independent with respect to the Portfolios in accordance with the U.S. federal securities laws and the applicable rules and regulations of the Securities and Exchange Commission and the PCAOB.
We conducted our audits in accordance with the standards of the PCAOB. Those standards require that we plan and perform the audit to obtain reasonable assurance about whether the financial statements and financial highlights are free of material misstatement, whether due to error or fraud. Our audits included performing procedures to assess the risks of material misstatement of the financial statements and financial highlights, whether due to error or fraud, and performing procedures that respond to those risks. Such procedures included examining, on a test basis, evidence regarding the amounts and disclosures in the financial statements and financial highlights. Such procedures also included confirmation of securities owned as of October 31, 2022, by correspondence with custodians and brokers; when replies were not received from brokers, we performed other auditing procedures. Our audits also included evaluating the accounting principles used and significant estimates made by management, as well as evaluating the overall presentation of the financial statements and financial highlights. We believe that our audits provide a reasonable basis for our opinion.

We have served as the auditor of one or more Harding, Loevner Funds, Inc. Portfolios since 2006.
New York, New York
December 16, 2022
KPMG LLP, a Delaware limited liability partnership and a member firm of
the KPMG global organization of independent member firms affiliated with
KPMG International Limited, a private English company limited by guarantee.
93
Table of Contents
Appendix A
Portfolios and Periods
For the year ended October 31, 2022 (statements of operations); each of the years in the two-year period ended October 31, 2022 (statements of changes in net assets); each of the years in the five-year period ended October 31, 2022 (financial highlights):
Global Equity Portfolio
International Equity Portfolio
International Small Companies Portfolio
Institutional Emerging Markets Portfolio
Emerging Markets Portfolio
Frontier Emerging Markets Portfolio
Global Equity Research Portfolio
International Equity Research Portfolio
Emerging Markets Research Portfolio
For the year ended October 31, 2022 (statement of operations); the year ended October 31, 2022 and the period from December 16, 2020 (commencement of operations) through October 31, 2021 (statement of changes in net assets and financial highlights):
Chinese Equity Portfolio
For the period from September 14, 2022 (commencement of operations) through October 31, 2022 (statement of operations, statement of changes in net assets, and financial highlights):
Emerging Markets ex China Portfolio
For the period from September 28, 2022 (commencement of operations) through October 31, 2022 (statement of operations, statement of changes in net assets, and financial highlights):
International Developed Markets Equity Portfolio
94
Table of Contents
Supplemental Tax Information
(unaudited)
International Equity, International Small Companies, Institutional Emerging Markets, Emerging Markets, Frontier Emerging Markets, Global Equity Research, International Equity Research, Emerging Markets Research, Chinese Equity, Emerging Markets ex China, and International Developed Markets Equity paid qualifying foreign taxes of $17,684,164, $958,413, $13,281,483, $8,761,722, $522,956, $14,739, $32,067, $22,716, $1,850, $653, and $493 and earned $410,443,236, $5,200,383, $51,100,847, $28,266,313, $4,300,809, $86,064, $228,338, $88,426, $11,898, $3,269, and $2,121 from foreign source income during the fiscal year ended October 31, 2022, respectively. Pursuant to Section 853 of the Internal Revenue Code, International Equity, International Small Companies, Institutional Emerging Markets, Emerging Markets, Frontier Emerging Markets, Global Equity Research, International Equity Research, Emerging Markets Research, Chinese Equity, Emerging Markets ex China, and International Developed Markets Equity designated $0.0270, $0.0298, $0.0796, $0.2425, $0.0208, $0.0223, $0.0282, $0.0305, $0.0036, $0.0021, and $0.0026 per share as foreign taxes paid and $0.6268, $0.1619, $0.3064, $0.7825, $0.1710, $0.1302, $0.2010, $0.1185, $0.0230, $0.0105, and $0.0110 per share as income earned from foreign sources for the fiscal year ended October 31, 2022, respectively.
International Equity, International Small Companies, Institutional Emerging Markets, Emerging Markets, Frontier Emerging Markets, Global Equity Research, International Equity Research, Emerging Markets Research, Chinese Equity, Emerging Markets ex China, and International Developed Markets Equity had qualifying dividend income of $485,325,766, $8,545,284, $64,166,321, $38,259,711, $4,234,448, $150,525, $267,675, $114,007, $18,458, $4,067, and $3,255 respectively, during the fiscal year ended October 31, 2022.
For the fiscal year ended October 31, 2022, Global Equity Research designated 35.52% of the distributions from net investment income as qualifying for the 100% corporate dividend received deduction.
Pursuant to Section 852 of the Internal Revenue Code, International Small Companies designated $7,560,617 as a long term capital gain dividend for the fiscal year ended October 31, 2022.
Pursuant to Section 852 of the Internal Revenue Code, Emerging Markets designated $101,851,078 as a long term capital gain dividend for the fiscal year ended October 31, 2022.
Pursuant to Section 852 of the Internal Revenue Code, Global Equity Research designated $373,656 as a long term capital gain dividend for the fiscal year ended October 31, 2022.
Pursuant to Section 852 of the Internal Revenue Code, International Equity Research designated $232,023 as a long term capital gain dividend for the fiscal year ended October 31, 2022.
95
Table of Contents
Approval of Investment Advisory Agreements
(unaudited)
The following statements reflect the basis for the approval of investment advisory agreements by the Board of Directors of Harding, Loevner Funds, Inc. during the Fund’s most recent fiscal half year.
Approval of Investment Advisory Agreement – Annual Considerations of Advisory Agreements
At an in-person meeting of the board of directors (collectively, the “Board” or “Directors” and, each, a “Director”) of Harding, Loevner Funds, Inc. (the “Fund”) held on June 10, 2022 (the “Meeting”), the Board, including a majority of those Directors who are not “interested persons” of the Fund (the “Independent Directors”), as defined in the Investment Company Act of 1940, as amended (the “1940 Act”) considered and approved the continuation of four investment advisory agreements (the “Advisory Agreements”): the first, between Harding Loevner LP (“Harding Loevner” or the “Adviser”) and the Fund, on behalf of the Global Equity Portfolio, the International Equity Portfolio, the International Small Companies Portfolio, the Institutional Emerging Markets Portfolio, the Emerging Markets Portfolio, and the Frontier Emerging Markets Portfolio (collectively, the “Traditional Portfolios”); the second, between the Adviser and the Fund, on behalf of the International Equity Research Portfolio (the “IER Portfolio”); the third, between the Adviser and the Fund on behalf of the Global Equity Research Portfolio (the “GER Portfolio”) and Emerging Markets Research Portfolio (the “EMR Portfolio” and together with the IER Portfolio and GER Portfolio, the “Research Portfolios”); and the fourth, between the Adviser and the Fund, on behalf of the Chinese Equity Portfolio (together with the Traditional Portfolios and the Research Portfolios, each a “Portfolio” and collectively, the “Portfolios”).
Overview of the Review Process
Prior to the Meeting, the Board established a subcommittee of the Governance Committee of the Board comprised of three Independent Directors (the “Subcommittee”) to conduct a preliminary review of the materials provided to the Board by the Adviser in connection with consideration of the Advisory Agreements, to assist the Board in its deliberations, and to liaise with the Adviser. In addition, legal counsel to the Independent Directors (“Independent Counsel”), on behalf of the Independent Directors, delivered to the Adviser a written request for information that the Board believed necessary to evaluate the terms of the Advisory Agreements. In response, the Adviser furnished materials to facilitate the Board’s evaluation of the terms of the Advisory Agreements (the “Renewal Materials”), including information on, among other things: (i) the investment performance, expenses and advisory fees of each Portfolio relative to other mutual funds and benchmark indices, as set forth in reports prepared by Strategic Insight, which has been acquired by Institutional Shareholder Services Inc. (the “ISS Reports”), a third-party fund analytics provider engaged as part of the Advisory Agreement review process; (ii) the Adviser’s profitability and costs arising from services provided to the Fund; (iii) the qualifications of the Adviser and portfolio management personnel with respect to services provided to the Portfolios; and (iv) the Adviser’s investment research capabilities and resources. The Adviser also sought to provide the foregoing information in the context of the global market-wide shift in the relative performance of growth stocks versus value stocks, the impact on Russian equities and world markets following Russia’s invasion of Ukraine in late February 2022, and new and different circumstances faced by the industry as a whole, given the continuing COVID-19 pandemic.
In preparation for the Meeting, the Adviser provided the Subcommittee with a preliminary version of the Renewal Materials for review and comment. The Subcommittee and representatives of the Adviser discussed the preliminary Renewal Materials during a telephonic meeting on May 24, 2022. Following this meeting, the Adviser revised the Renewal Materials in response to the Subcommittee’s comments and distributed the Renewal Materials in final form to the full Board. The Board also received and considered a memorandum regarding the Board’s responsibilities in connection with renewal of the Advisory Agreements prepared by Independent Counsel and Independent Counsel assisted the Independent Directors throughout the process.
At the Meeting, both in general and executive sessions, the Board considered and discussed the materials presented by the Adviser. During the presentations, the Adviser expanded on those materials and responded to specific questions from the Board. Among other things, the Adviser focused on the long-term performance records of the Portfolios and the competitiveness of the Portfolios’ advisory fees and total expense ratios. The Adviser also focused on the quality of the services provided to the Portfolios and its continued investment in personnel, technology and other resources that service the Fund, noting the continued investment in the face of declining assets under management. The Independent Directors met in executive session with Independent Counsel prior to the commencement of the Meeting and during the course of the Meeting to discuss the materials provided and information presented by the Adviser.
In evaluating continuance of the Advisory Agreements with respect to each Portfolio, among other things, the Board considered the various factors and information discussed below. The following discussion is not intended to be all-inclusive, as the Board reviewed a variety of factors and considered a significant amount of information.
Nature, Extent and Quality of Services
96
Table of Contents
Harding, Loevner Funds, Inc.
Approval of Investment Advisory Agreements (continued)
(unaudited)
The Board evaluated the information it deemed necessary to assess the nature, extent and quality of investment advisory services provided to the Portfolios by the Adviser. The Board also considered the nature, extent and quality of the extensive non-advisory services provided to the Portfolios by the Adviser, including portfolio trading; the resources devoted to, and the record of compliance with, each Portfolio’s compliance policies and procedures; the resources devoted to the supervision of third-party service providers; and the quality and quantity of administrative and shareholder servicing. The Board noted that it received information in connection with quarterly Board and committee meetings throughout the year regarding the services rendered by the Adviser concerning the management of each Portfolio’s affairs and the Adviser’s role in coordinating providers of other services to the Portfolios.
The Adviser presented and discussed with the Board the qualifications, backgrounds and responsibilities of the Adviser’s management team and information regarding the members of each Portfolio’s portfolio management team. The Board evaluated the Adviser’s ability to attract and retain qualified investment advisory and non-advisory personnel and engaged in a discussion with the Adviser regarding its recruitment, retention and professional development programs and strategies.
The Board also considered the adequacy of the Adviser’s financial and operational resources committed to each Portfolio, and how well the Adviser utilized those resources to meet the Portfolio’s investment needs, to oversee non-investment services and to satisfy compliance requirements. The Board also considered the nature and extent of the steps taken by the Adviser to deliver the same quality of service to its clients, including the Fund, under the “hybrid” work environment brought about by the COVID-19 pandemic. The Board considered the operation of the Adviser’s business continuity plan and cybersecurity policies during its remote and “hybrid” work operations. The Board considered that the Adviser had been able to operate unimpeded, in a “business as usual” mode.
The Board further noted that, as of March 31, 2022, the Adviser had approximately $74.3 billion in assets under management and that the Fund was the Adviser’s largest client, with assets of approximately $29.2 billion. The Board took into account the benefits realized by the Portfolios from the Adviser’s affiliation with Affiliated Managers Group, Inc., an established global asset management company.
The Board considered annual and periodic reports of the Fund’s Chief Compliance Officer (the “CCO”) with respect to the effectiveness and adequacy of the Fund’s and the Adviser’s compliance programs. The Board noted the CCO’s determination that the Adviser’s compliance program is reasonably designed to prevent violations of the federal securities laws.
Based on these considerations, the Board concluded that it was satisfied with the nature, extent and quality of services historically provided and to be provided to each Portfolio under its Advisory Agreements.
Performance of the Adviser
For each Portfolio, the Board considered, among other things, the historical performance for multiple time periods ended as of March 31, 2022, including the one-year, three-year, five-year and ten-year periods (or shorter for newer Portfolios) included in the ISS Reports, compared against each Portfolio’s Morningstar Category and benchmark index. The Board considered each Portfolio’s risk relative to its respective benchmark and high active share (i.e., low overlap with holdings in benchmark indices) historically inherent in the Adviser’s investment process.
With respect to the recent performance of the Portfolios, the Board noted that for the one-year period ended March 31, 2022: each class of the Portfolios underperformed its respective benchmark index; and each class of the Global Equity Portfolio, International Equity Portfolio, Frontier Emerging Markets Portfolio, International Small Companies Portfolio, and Global Equity Research Portfolio, outperformed its respective Morningstar Category, and each of the remaining Portfolios underperformed its respective Morningstar Category.
In assessing longer term performance by the Portfolios, for the five-year period ended March 31, 2022, the Board noted that each class of the Global Equity Portfolio, International Equity Portfolio and International Small Companies Portfolio, with at least five years of operations, outperformed its respective benchmark index. Each class of the Emerging Markets Portfolio, Institutional Emerging Markets Portfolio, Frontier Emerging Markets Portfolio, International Equity Research Portfolio, Global Equity Research Portfolio and Emerging Markets Research Portfolio, with at least five years of operations underperformed its respective benchmark index; and each class of the Portfolios with at least five years of operations underperformed its respective Morningstar Category. The Board noted in their review that the Chinese Equity Portfolio had not yet completed five years of operations.
For the ten-year period ended March 31, 2022, the Board noted that, each class of the Global Equity Portfolio, International Equity Portfolio and International Small Companies Portfolio, and the Institutional Class I of the Frontier Emerging Markets Portfolio, with at least ten years of operations, outperformed its respective benchmark index; and, with the exception of the Institutional Class of the International Equity Portfolio,
97
Table of Contents
Harding, Loevner Funds, Inc.
Approval of Investment Advisory Agreements (continued)
(unaudited)
each class of all Portfolios with at least ten years of operations underperformed its respective Morningstar Category. The Board noted in its review that the Chinese Equity Portfolio, International Equity Research Portfolio, Global Equity Research Portfolio and Emerging Markets Research Portfolios had not yet completed ten years of operations.
In addition, the Board reviewed the Adviser’s investment philosophy used to manage the Portfolios, as well as the effectiveness of the Adviser’s use of portfolio management teams for the day-to-day management of Portfolios. The Board noted the Adviser’s bottom-up, business-focused approach based on the study of individual companies and the competitive dynamics of the global industries in which those companies participate. The Board considered the Adviser’s disciplined adherence to its investment philosophy and process, in spite of the significant global developments that adversely affected the Portfolios’ market-relative returns over the twelve months to March 31, 2022 and during the month of April: (1) a global market-wide shift in the relative performance of growth stocks versus value stocks, particularly with respect to relatively higher price and higher quality growth stocks; and (2) particularly with respect to the Emerging Markets Portfolio and Institutional Emerging Markets Portfolio, following Russia’s invasion of Ukraine, the decision to fair value Russian holdings at approximately zero as a result of the sudden cessation of trading of Russian depositary receipts and the decision by the Russian government to prohibit foreign investors from the U.S. and other “unfriendly” countries from trading Russian securities on local stock exchanges. The Board also took note of the Adviser’s continued integration of environmental, social and governance (“ESG”) factors in its investment process.
In evaluating the investment performance of the Portfolios, the Board acknowledged that the Adviser’s investment style may result in periods of underperformance, but has generally produced outperformance over longer time periods. The Board found that, historically, the Portfolios performed well relative to their respective benchmark indices. The Board also considered the Adviser’s ongoing efforts to identify the causes of any underperformance and the effectiveness of these efforts. Finally, the Board considered that the Morningstar Category performance data provided within the ISS Reports was less useful with respect to the Frontier Emerging Markets Portfolio, as Morningstar did not have a Frontier Markets category at March 31, 2022 and instead compared the Portfolio to the Diversified Emerging Markets category.
Based on these considerations, the Board concluded that each Portfolio’s performance was consistent with the Adviser’s investment discipline.
Costs of the Services and Profitability of the Adviser
The Board considered information regarding the Adviser’s costs to provide investment management services to the Portfolios and the profitability to the Adviser from managing the Portfolios. In evaluating the Adviser’s profitability, the Board considered the Adviser’s profitability analyses for calendar years 2020 and 2021, noting that the Adviser’s profit margin after assumed tax, in relation to its management of the Portfolios, was slightly higher in 2021 compared to 2020. The Board also considered profitability adjusted, on a pro forma basis, for estimated provisions for federal and state corporate income taxes; each Portfolio’s expense ratio; the allocation methodology used by the Adviser to compute such profitability; and the Adviser’s contractual fee waivers and expense reimbursements with respect to the applicable Portfolios. The Board further considered profitability on a Portfolio-by-Portfolio basis, focusing on the Adviser’s profit both with and without taking into account those costs borne by the Adviser with respect to its efforts to expand the Portfolios’ shareholder base.
The Adviser also presented its profitability analyses for calendar years 2020 and 2021 on an adjusted basis to reflect the equity-related compensation received by certain senior personnel of the Adviser who are limited partners of the Adviser. In the adjusted profitability analyses, the Adviser stated that it had adjusted the Adviser’s personnel expenses to an amount that more closely resembled the compensation paid to similarly situated personnel at peer firms, noting that the salaries and bonuses paid to the Adviser’s limited partners are lower than the compensation paid at peer firms because the limited partners also receive equity- related compensation. The Board noted that this adjusted profitability information was useful in its consideration and assessment of the Adviser’s profitability.
The Board took note of the costs the Adviser has incurred that are intended to assure the continued delivery of high-quality services to its clients, including the Portfolios, and the future costs the Adviser plans to incur, including hiring additional qualified personnel and further investing in technology, including with respect to cybersecurity as well as enhancing its operational infrastructure. The Board considered the Adviser’s need to accommodate changing regulatory requirements and to adapt to structural changes in the mutual fund marketplace. The Board also noted that future profitability to the Adviser from managing the Portfolios would depend on the level of assets in the Portfolios and investment returns, as well as the Adviser’s total assets under management, and may be limited as certain Portfolios’ investment strategies encounter their capacity limitations. In assessing profitability, the Board considered each Portfolio’s profitability in the context of the services provided and the reasonableness of the fees charged for those services.
Based upon these considerations, the Board concluded that the profits historically realized by the Adviser, and the profits the Adviser anticipates will be realized from its continued relationship with the Portfolios, are not excessive in light of the nature, extent and quality of the services provided to the Portfolios.
98
Table of Contents
Harding, Loevner Funds, Inc.
Approval of Investment Advisory Agreements (continued)
(unaudited)
Comparison of Fees and Services Provided by the Adviser
The Board reviewed the contractual advisory fees that are payable by the Portfolios to the Adviser and the actual investment advisory fees realized by the Adviser taking into account the fee waiver and/or expense reimbursement arrangements for certain of the Portfolios. The Board considered the fact that the Adviser’s waiver/expense reimbursement arrangements are not subject to recapture and that the proposed fee reductions and breakpoints were contractual in nature, noting that in fiscal year 2021, the Adviser waived a portion of its advisory fees for the following Portfolios and classes: the Institutional Class Z of the Global Equity Portfolio and the Institutional Class Z of the Institutional Emerging Markets Portfolio; the Institutional Class of the Chinese Equity Portfolio; the Investor Class and Institutional Class II of the Frontier Emerging Markets Portfolio; the Investor Class of the International Small Companies Portfolio; and the Institutional Class of the International Equity Research Portfolio, the Global Equity Research Portfolio and the Emerging Markets Research Portfolio. In addition, the Board compared the Adviser’s separate account fee schedule with the advisory fees payable by the Portfolios to the Adviser. Further, the Board took note that the fee waivers in place for the Chinese Equity Portfolio, Global Equity Research Portfolio and Emerging Markets Research Portfolio exceeded the Adviser’s advisory fee.
The Board considered the ISS Reports, which included information comparing each Portfolio’s management fee and overall expenses with those of funds in a group of peer funds selected by Institutional Shareholder Services (the “Expense Group”), as well as with each Portfolio’s peer funds in its respective Morningstar Category-derived universe (the “Expense Universe”). The Board noted that the net operating expenses (expenses other than the fees pursuant to the Advisory Agreements and distribution and service fees) (the “Net Operating Expenses”) of each Portfolio were below the median of their respective Expense Group and Expense Universe, with the exception of the Chinese Equity Portfolio and the Research Portfolios. With respect to the Chinese Equity Portfolio and the Research Portfolios, the Board took note that Net Operating Expenses exceed the median of their respective Expense Group and Expense Universe due to the small asset size of these Portfolios, although this was partially offset by the voluntary subsidy of those Portfolios by the Adviser. The Board also observed that, except as noted below, the net total expense ratio of each class of each Portfolio, after any applicable waiver of advisory fees and reimbursement of expenses (“Net Total Expense Ratio”), was at or below its respective Expense Group and Expense Universe medians. Exceptions included: the Institutional Class of the Institutional Emerging Markets Portfolio, the Investor Class and the Institutional Class of the International Small Companies Portfolio, and the Institutional Class of the Emerging Markets Equity Research Portfolio, each of which had a Net Total Expense Ratio above the median for its Expense Group and Expense Universe; the Institutional Class of the Chinese Equity Portfolio, which had a Net Total Expense Ratio above the median for its Expense Universe; and the Investor Class of the Frontier Emerging Markets Equity Portfolio, which had a Net Total Expense Ratio above the median for its Expense Group. The Board did not consider any of these differences to be material.
The Board noted that the net management fee for each class of each Portfolio after any applicable waiver of advisory fees and reimbursement of expenses (“Net Total Management Fee”), was at or below the median of its Expense Group, except the Advisor Class of the Emerging Markets Portfolio; both classes of the Institutional Emerging Markets Portfolio, the Institutional Class of the International Small Companies Portfolio; and all classes of the Frontier Emerging Markets Portfolio, each of which were above the median for their respective Expense Groups. The Board also noted that, for each Portfolio with an Expense Universe, the Net Total Management Fee was at or below the median of its Expense Universe, except all classes of the Global Equity Portfolio, the Institutional Class and the Institutional Class Z of the International Equity Portfolio; the Advisor Class of the Emerging Markets Portfolio; and both classes of the Institutional Emerging Markets Portfolio and the International Small Companies Portfolio, each of which were above the median for their respective Expense Universes.
The Board noted that the Adviser did not consider the Expense Universe to be an appropriate comparator for the Frontier Emerging Markets Portfolio, as it was comprised of the Diversified Emerging Markets Morningstar Category, which is not limited exclusively to funds primarily investing in equity securities of companies based in the frontier emerging markets. Frontier markets involve higher costs than emerging markets investing generally. In its consideration of each Portfolio’s Net Total Management Fee, the Board considered each Portfolio’s long-term performance record, the Adviser’s commitment and adherence to its investment philosophy and process, and the extensive scope of non-advisory services provided by the Adviser, which it performs without additional compensation. The Board also considered the Adviser’s voluntary waiver of advisory fees and reimbursement of expenses for applicable Portfolios.
The Board recognized that the Adviser’s separate account and collective trust clients require fewer services from the Adviser than the Fund. The Board additionally recognized the Adviser’s efforts to direct more institutional investors into pooled vehicles, including the Portfolios, to the extent possible. Further, the Board took note that many sophisticated institutional investors, after reviewing similar investment vehicles with the assistance of their consultants, had determined and continue to invest in the Portfolios, which further supported the reasonableness of the advisory fees charged by the Adviser.
The Board also noted the Adviser’s commitment to review periodically the fees charged to the Portfolios and the proposed decrease in the expense cap for the Investor Class of the International Small Companies Portfolio to 1.30%, through February 28, 2024, as part of the 2022 Advisory Agreements renewal process, to ensure that the fees remain competitive.
99
Table of Contents
Harding, Loevner Funds, Inc.
Approval of Investment Advisory Agreements (continued)
(unaudited)
Based on these considerations, the Board concluded that each Portfolio’s advisory fee, in light of the services provided by the Adviser, was reasonable.
Economies of Scale
The Board considered the extent to which economies of scale have been realized in light of the Portfolios’ asset size, whether there is potential for realization of further economies of scale for the Portfolios, and whether material economies of scale are being shared with shareholders. The Board also considered that, although the Adviser’s and the Portfolios’ assets had decreased over the period, the Adviser continues to reinvest in its business so as to continue to provide the same or better quality of services to the Portfolios as it has historically. The Board noted too that the Portfolios have historically benefitted both from asset growth in the Portfolios and from asset growth in the Adviser’s other accounts, each of which have resulted in certain expenses becoming a smaller percentage of overall assets.
The Board acknowledged that other aspects of the Portfolios’ investment strategies may limit the realization of economies of scale, including a particular strategy’s capacity limitations. The Board also acknowledged the Adviser’s increased operational expenses as a result of its pursuit of excellence in investment results and in the shareholder experience, in a competitive marketplace.
The Board considered that the Adviser assumes substantial business risk each time it sponsors a new Portfolio. The Board also noted that the Adviser provides the same high-quality services to the Frontier Emerging Markets Portfolio, the Chinese Equity Portfolio, and the Research Portfolios, which have not yet achieved profitability due to their smaller level of assets.
Based on these considerations, the Board concluded that it was satisfied with the extent to which any economies of scale currently are and will be realized for the benefit of the Portfolios’ shareholders, and recognized its obligation to consider the same annually based on changing circumstances.
Other Benefits
The Board considered other benefits derived or to be derived by the Adviser from the relationship with the Portfolios as part of its consideration of continuance of the Advisory Agreements. In this regard, the Board noted that the only tangible material indirect benefit from the Adviser’s relationship with the Portfolios is from the receipt of research products and services obtained through soft dollars in connection with Portfolio brokerage transactions. The Board also considered the extent to which the Adviser and its clients, including the Portfolios, benefitted from receipt of these research products and services.
The Board also considered other benefits that the Portfolios derived from their association with the Adviser. In this regard, the Board considered the competitive nature of the mutual fund marketplace and that the Portfolios’ shareholders invested in the Portfolios because of the Fund’s relationship with the Adviser.
Conclusion
Following extensive discussion, both in general session and in an executive session of the Independent Directors meeting alone with Independent Counsel, the Board determined that it had received sufficient information to take action on the proposed resolutions regarding continuance of the Advisory Agreements and that all of its questions had been addressed to its satisfaction. The Board, including a majority of the Independent Directors, concluded with respect to each Portfolio that its investment advisory fees were sufficiently supported by their review of the factors described above.
In light of all the foregoing, the Board, and separately, a majority of the Independent Directors, approved the continuance of each Advisory Agreement on behalf of the respective Portfolio(s). The Board’s approval determinations were made on the basis of each Director’s business judgment after consideration of all the information presented and their related conclusions, with no single factor or conclusion being determinative and with each Director not necessarily attributing the same weight to each factor.
Approval of Investment Advisory Agreement: Emerging Markets ex China Portfolio
At in-person meetings of the board of directors (collectively, the “Board” or “Directors” and, each, a “Director”) of Harding, Loevner Funds, Inc. (the “Fund”) held on June 10, 2022 (the “June Meeting”) and September 13, 2022 (the “September Meeting” and, with the “June Meeting,” the “Meetings”), the Board considered whether to approve the investment advisory agreement between the Fund and Harding Loevner LP (“Harding Loevner” or the “Adviser”) on behalf of a new series of the Fund, the Emerging Markets ex China Portfolio (the “EMEC Portfolio”), for an initial
100
Table of Contents
Harding, Loevner Funds, Inc.
Approval of Investment Advisory Agreements (continued)
(unaudited)
two-year period (the “EMEC Portfolio Advisory Agreement”). Following considerations and discussions during the Meetings, the Board, including a majority of those Directors who are not “interested persons” of the Fund (the “Independent Directors”), as defined in the Investment Company Act of 1940, as amended (the “1940 Act”), approved the EMEC Portfolio Advisory Agreement at the September Meeting.
In considering the approval of the EMEC Portfolio Advisory Agreement, the Board noted that the terms and conditions of the EMEC Portfolio Advisory Agreement are substantially identical to the terms and conditions of the existing investment advisory agreements (the “Existing Advisory Agreements”)1 between the Adviser and the Fund on behalf of the following: the Global Equity Portfolio, the International Equity Portfolio, the International Small Companies Portfolio, the Institutional Emerging Markets Portfolio (the “IEM Portfolio”), the Emerging Markets Portfolio (the “EM Portfolio”), the Chinese Equity Portfolio, the Frontier Emerging Markets Portfolio, the International Equity Research Portfolio, the Global Equity Research Portfolio and the Emerging Markets Research Portfolio (each, an “Existing Portfolio” and collectively, the “Existing Portfolios”).
Prior to and during the June Meeting, the Board received and assessed information regarding: (i) the qualifications of the portfolio managers primarily responsible for the day-to-day management of the EMEC Portfolio; (ii) the investment strategy and portfolio construction approach to be implemented by Harding Loevner for the EMEC Portfolio; (iii) Harding Loevner’s plans to position the EMEC Portfolio in the marketplace relative to the Existing Portfolios and peer mutual funds; and (iv) the services provided to the Existing Portfolios by Harding Loevner under the Existing Advisory Agreements, which the Board had voted to renew during the June Meeting. In addition, during the September Meeting, the Board received and assessed information regarding Harding Loevner’s representations regarding the management fees of the peer funds of the EMEC Portfolio with similar characteristics, as well as the estimated costs associated with managing the EMEC Portfolio and proposed fees payable to Harding Loevner under the EMEC Portfolio Advisory Agreement relative to the costs and fees payable under the Existing Advisory Agreements.
In addition, the Board considered, among other things, the following factors:
Nature, Extent and Quality of Services
The Board evaluated the information it deemed necessary to assess the nature, extent and quality of investment advisory services to be provided to the EMEC Portfolio by Harding Loevner. The Board also considered the nature, extent and quality of: (i) the extensive non-advisory services to be provided to the EMEC Portfolio by Harding Loevner, including portfolio trading; (ii) the resources to be devoted to the EMEC Portfolio’s compliance policies and procedures; (iii) the resources to be devoted to the supervision of third-party service providers; and (iv) the quality and quantity of administrative and shareholder servicing. In this regard, the Board took note of the quality of the services provided to the Existing Portfolios and the Adviser’s continued investment in personnel, technology and other resources that service the Fund, noting the Adviser’s continued investment notwithstanding a recent decline in assets under management. The Board considered Harding Loevner’s record of compliance with its compliance policies and procedures, as well as the qualifications, backgrounds and responsibilities of Harding Loevner’s management team and information regarding the members of the investment analyst and portfolio management team for the EMEC Portfolio. Based on these considerations, the Board concluded that it was satisfied with the nature, extent and quality of services to be provided to the EMEC Portfolio under the EMEC Portfolio Advisory Agreement.
Performance of Harding Loevner
Because the EMEC Portfolio had not commenced operations, the Board considered, among other things, the Existing Portfolios’ strong historical performance for multiple time periods compared against each Existing Portfolio’s Morningstar Category and benchmark index. The Board noted the extensive review and analysis of the performance of the Existing Portfolios conducted before and during the June Meeting, when the Board approved the continuance of the Existing Advisory Agreements pursuant to Section 15(c) of the 1940 Act. Further, the Board considered that each member of the EMEC Portfolio’s portfolio management team has deep experience investing in emerging markets. In addition, the Board took note that Harding Loevner has over 30 years of experience investing in emerging markets.
Costs of the Services and Profitability of Harding Loevner
In considering the EMEC Portfolio’s profitability to Harding Loevner, the Board recognized that there was not yet profitability data to evaluate, but noted that profitability information would be provided after the EMEC Portfolio commenced operations and, as with other new portfolios launched by Harding Loevner, the EMEC Portfolio was not expected to be profitable to Harding Loevner initially. In evaluating Harding
1 The International Developed Markets Equity Portfolio is also a new series of the Fund whose investment advisory agreement was approved at the September Meeting; as a result, it is not counted among the Existing Portfolios for purposes of this discussion.
101
Table of Contents
Harding, Loevner Funds, Inc.
Approval of Investment Advisory Agreements (continued)
(unaudited)
Loevner’s profitability, the Board recognized: (i) the significant resources that Harding Loevner is committing to the organization and management of the EMEC Portfolio; (ii) the substantial business risk assumed in sponsoring the EMEC Portfolio; and (iii) the proposed fee waiver for the EMEC Portfolio. Further, the Board noted that the EMEC Portfolio may not achieve profitability for some time.
Comparison of Fees and Services Provided by Harding Loevner
During the September Meeting, the Board considered the contractual advisory fees that are payable by the EMEC Portfolio to Harding Loevner and the estimated investment advisory fees to be realized by Harding Loevner taking into account the fee waiver and/or expense reimbursement arrangement for the EMEC Portfolio. The Board also considered the fact that Harding Loevner’s fee waiver/expense reimbursement arrangement with the EMEC Portfolio is not subject to recapture and that the proposed fee reductions are contractual in nature and may exceed the investment advisory fee for some time. The Board considered the fees payable to Harding Loevner by the EMEC Portfolio compared to investment advisory fees payable to Harding Loevner by the Existing Portfolios and compared to investment advisory fees to be paid by the EMEC Portfolio’s respective peer funds. Based on these considerations, the Board concluded that the investment advisory fee to be paid by the EMEC Portfolio, in light of the services provided by the Adviser, was reasonable.
Economies of Scale
The Board considered whether there is potential for realization of economies of scale for the EMEC Portfolio and whether material economies of scale would be shared with shareholders. The Board noted that the EMEC Portfolio was not expected to raise a significant level of assets during the initial contract term and therefore was unlikely to realize material economies of scale.
Other Benefits
The Board considered other benefits to be derived by Harding Loevner from its relationship with the EMEC Portfolio. In this regard, the Board noted that the only likely tangible material benefits from Harding Loevner’s relationship with the EMEC Portfolio would be from the receipt of research products and services obtained through soft dollars in connection with EMEC Portfolio brokerage transactions. The Board also considered the extent to which Harding Loevner and its other clients, including the Existing Portfolios, would benefit from receipt of these research products and services. In light of the costs of providing investment management, administrative and other services to the EMEC Portfolio, these other ancillary benefits that Harding Loevner may receive were considered reasonable.
In addition to the factors discussed above, the Board members noted that they had performed a comprehensive review of the services provided to the Existing Portfolios by Harding Loevner under the Existing Advisory Agreements during the June Meeting and had voted to renew the Existing Advisory Agreements. The Board determined that the information they had considered in connection with the renewal of the Existing Advisory Agreements at the June Meeting, as supplemented by relevant information provided during prior Board meetings and regarding the EMEC Portfolio, was applicable to their decision to approve the EMEC Portfolio Advisory Agreement.
Conclusion
Following discussion, both in general session and in an executive session of the Independent Directors meeting alone with Independent Counsel, the Board determined that it had received sufficient information to take action on the proposed resolutions approving the EMEC Portfolio Advisory Agreement and that all of its questions had been addressed to its satisfaction. The Board, including a majority of the Independent Directors, concluded with respect to the EMEC Portfolio that Harding Loevner’s investment advisory fee was sufficiently supported by the Board’s review of the factors described above.
In light of all the foregoing, the Board, and separately, a majority of the Independent Directors, approved the EMEC Portfolio Advisory Agreement. The Board’s approval determination was made on the basis of each Director’s business judgment after consideration of all the information presented. The Board’s decision was based on all of the above-mentioned factors and their related conclusions, with no single factor or conclusion being determinative and with each Director not necessarily attributing the same weight to each factor.
Approval of Investment Advisory Agreement: International Developed Markets Equity Portfolio
At an in-person meeting of the board of directors (collectively, the “Board” or “Directors” and, each, a “Director”) of Harding, Loevner Funds, Inc. (the “Fund”) held on September 13, 2022 (the “September Meeting”), the Board considered whether to approve the investment advisory agreement between the Fund and Harding Loevner LP (“Harding Loevner” or the “Adviser”) on behalf of a new series of the Fund, the International Developed Markets Equity Portfolio (the “IDME Portfolio”), for an initial two-year period (the “IDME Portfolio Advisory
102
Table of Contents
Harding, Loevner Funds, Inc.
Approval of Investment Advisory Agreements (continued)
(unaudited)
Agreement”). Following considerations and discussions during the Meetings, the Board, including a majority of those Directors who are not “interested persons” of the Fund (the “Independent Directors”), as defined in the Investment Company Act of 1940, as amended (the “1940 Act”), approved the IDME Portfolio Advisory Agreement at the September Meeting.
In considering the approval of the IDME Portfolio Advisory Agreement, the Board noted that the terms and conditions of the IDME Portfolio Advisory Agreement are substantially identical to the terms and conditions of the then-existing investment advisory agreements (the “Existing Advisory Agreements”)1 between the Adviser and the Fund, on behalf of the following: the Global Equity Portfolio, the International Equity Portfolio, the International Small Companies Portfolio, the Institutional Emerging Markets Portfolio (the “IEM Portfolio”), the Emerging Markets Portfolio (the “EM Portfolio”), the Chinese Equity Portfolio, the Frontier Emerging Markets Portfolio, the International Equity Research Portfolio, the Global Equity Research Portfolio and the Emerging Markets Research Portfolio (each, an “Existing Portfolio” and collectively, the “Existing Portfolios”).
Prior to and during the September Meeting, the Board received and assessed information regarding: (i) the qualifications of the portfolio managers primarily responsible for the day-to-day management of the IDME Portfolio; (ii) the investment strategy and portfolio construction approach to be implemented by Harding Loevner for the IDME Portfolio; (iii) Harding Loevner’s plans to position the IDME Portfolio in the marketplace relative to the Existing Portfolios and peer mutual funds; and (iv) the services provided to the Existing Portfolios by Harding Loevner under the Existing Advisory Agreements, which the Board voted to renew during its June 10, 2022 meeting (the “June Meeting”). In addition, during the September Meeting, the Board received and assessed information regarding Harding Loevner’s representations regarding the management fees of the peer funds of the IDME Portfolio with similar characteristics, as well as the estimated costs associated with managing the IDME Portfolio and proposed fees payable to Harding Loevner under the IDME Portfolio Advisory Agreement relative to the costs and fees payable under the Existing Advisory Agreements.
In addition, the Board considered, among other things, the following factors:
Nature, Extent and Quality of Services
The Board evaluated the information it deemed necessary to assess the nature, extent and quality of investment advisory services to be provided to the IDME Portfolio by Harding Loevner. The Board also considered the nature, extent and quality of: (i) the extensive non-advisory services to be provided to the IDME Portfolio by Harding Loevner, including portfolio trading; (ii) the resources to be devoted to the IDME Portfolio’s compliance policies and procedures; (iii) the resources to be devoted to the supervision of third- party service providers; and (iv) the quality and quantity of administrative and shareholder servicing. In this regard, the Board took note of the quality of the services provided to the Existing Portfolios and the Adviser’s continued investment in personnel, technology and other resources that service the Fund, noting the Adviser’s continued investment notwithstanding a recent decline in assets under management. The Board considered Harding Loevner’s record of compliance with its compliance policies and procedures, as well as the qualifications, backgrounds and responsibilities of Harding Loevner’s management team and information regarding the members of the investment analyst and portfolio management team for the IDME Portfolio. Based on these considerations, the Board concluded that it was satisfied with the nature, extent and quality of services to be provided to the IDME Portfolio under the New Portfolio Advisory Agreement.
Performance of Harding Loevner
Because the IDME Portfolio had not commenced operations, the Board considered, among other things, the Existing Portfolios’ strong historical performance for multiple time periods compared against each Existing Portfolio’s Morningstar Category and benchmark index. The Board noted the extensive review and analysis of the performance of the Existing Portfolios conducted before and during the June Meeting, when the Board approved the continuance of the Existing Advisory Agreements pursuant to Section 15(c) of the 1940 Act. The Board noted with particular interest Harding Loevner’s historical experience managing an EAFE investment strategy in separate account format, a similar strategy to that of the IDME Portfolio. Further, the Board considered that each member of the IDME Portfolio’s portfolio management team has deep experience investing in international markets. In addition, the Board took note that Harding Loevner has over 30 years of experience investing in international markets.
Costs of the Services and Profitability of Harding Loevner
In considering the IDME Portfolio’s profitability to Harding Loevner, the Board recognized that there was not yet profitability data to evaluate, but noted that profitability information would be provided after the IDME Portfolio commenced operations and, as with other new portfolios launched by Harding Loevner, the IDME Portfolio was not expected to be profitable to Harding Loevner initially. In evaluating Harding
1The Emerging Markets ex China Portfolio is also a new series of the Fund whose investment advisory agreement was approved at the September Meeting; as a result, it is not counted among the Existing Portfolios for purposes of this discussion.
103
Table of Contents
Harding, Loevner Funds, Inc.
Approval of Investment Advisory Agreements (continued)
(unaudited)
Loevner’s profitability, the Board recognized: (i) the significant resources that Harding Loevner is committing to the organization and management of the IDME Portfolio; (ii) the substantial business risk assumed in sponsoring the IDME Portfolio; and (iii) the proposed fee waiver for the IDME Portfolio. Further, the Board noted that the IDME Portfolio may not achieve profitability for some time.
Comparison of Fees and Services Provided by Harding Loevner
The Board considered the contractual advisory fees that are payable by the IDME Portfolio to Harding Loevner and the estimated actual investment advisory fees to be realized by Harding Loevner, taking into account the fee waiver and/or expense reimbursement arrangement for the IDME Portfolio. The Board also considered the fact that Harding Loevner’s fee waiver/expense reimbursement arrangement with the IDME Portfolio is not subject to recapture and that the proposed fee reductions are contractual in nature and may exceed the investment advisory fee for some time. The Board considered the fees payable to Harding Loevner by the IDME Portfolio compared to investment advisory fees payable to Harding Loevner by the Existing Portfolios and compared to investment advisory fees paid by the IDME Portfolio’s respective peer funds. Based on these considerations, the Board concluded that the investment advisory fee to be paid by the IDME Portfolio, in light of the services provided by the Adviser, was reasonable.
Economies of Scale
The Board considered whether there is potential for realization of economies of scale for the IDME Portfolio and whether material economies of scale would be shared with shareholders. The Board noted that the IDME Portfolio was not expected to raise a significant level of assets during the initial contract term and therefore was unlikely to realize material economies of scale.
Other Benefits
The Board considered other benefits to be derived by Harding Loevner from its relationship with the IDME Portfolio. In this regard, the Board noted that the only likely tangible material benefits from Harding Loevner’s relationship with the IDME Portfolio would be from the receipt of research products and services obtained through soft dollars in connection with IDME Portfolio brokerage transactions. The Board also considered the extent to which Harding Loevner and its other clients, including the Existing Portfolios, would benefit from receipt of these research products and services. In light of the costs of providing investment management, administrative and other services to the IDME Portfolio, these other ancillary benefits that Harding Loevner may receive were considered reasonable.
In addition to the factors discussed above, the Board members noted that they had performed a comprehensive review of the services provided to the Existing Portfolios by Harding Loevner under the Existing Advisory Agreements during the June Meeting and had voted to renew the Existing Advisory Agreements. The Board determined that the information they had considered in connection with the renewal of the Existing Advisory Agreements at the June Meeting, as supplemented by relevant information provided during prior Board meetings and regarding the IDME Portfolio, was applicable to their decision to approve the IDME Portfolio Advisory Agreement.
Conclusion
Following discussion, both in general session and in an executive session of the Independent Directors meeting alone with Independent Counsel, the Board determined that it had received sufficient information to take action on the proposed resolutions approving the IDME Portfolio Advisory Agreement and that all of its questions had been addressed to its satisfaction. The Board, including a majority of the Independent Directors, concluded with respect to the IDME Portfolio that Harding Loevner’s investment advisory fee was sufficiently supported by the Board’s review of the factors described above.
In light of all the foregoing, the Board, and separately, a majority of the Independent Directors, approved the IDME Portfolio Advisory Agreement. The Board’s approval determination was made on the basis of each Director’s business judgment after consideration of all the information presented. The Board’s decision was based on all of the above-mentioned factors and their related conclusions, with no single factor or conclusion being determinative and with each Director not necessarily attributing the same weight to each factor.
104
Table of Contents
Privacy Notice
(unaudited)
HARDING, LOEVNER FUNDS, INC.
PRIVACY NOTICE
The Fund collects nonpublic personal information about you from the following sources:
| • | Information, such as your name, address, social security number, assets and income, submitted by you on applications, forms, or in other written or verbal customer communications. This information may also be provided by a consultant or intermediary acting on your behalf. |
| • | Information that results from any transaction performed by us for you. |
The Fund will not disclose any nonpublic personal information about you or its former customers to anyone except as permitted or required by law.
If you decide to close your account(s) or become an inactive customer, the Fund will adhere to the privacy policies and practices as described in this notice.
The Fund restricts access to your personal and account information to only those employees who need to know that information to provide products or services to you. The Fund maintains physical, administrative and technical safeguards to protect your nonpublic personal information.
105
Table of Contents
Directors and Principal Officers
(unaudited)
Independent Directors:
| Name, Address and Year of Birth |
Position with the Fund |
Term of Office and Length of Time Served |
Principal Occupation During Past Five Years |
Number of Portfolios in Fund Complex Overseen By Director |
Other Directorships | |||||
| Carolyn N. Ainslie c/o Harding Loevner LP 400 Crossing Boulevard Fourth Floor Bridgewater, NJ 08807 1958 |
Director | Indefinite; Director since 2015; Member of the Audit Committee since 2015; Co - Chairperson of the Audit Committee June - December, 2017; and Chairperson of the Audit Committee since 2018; Member of the Governance Committee since March 2018 | Bill & Melinda Gates Foundation, Chief Financial Officer, 2018-present; Princeton University, Vice President for Finance and Treasurer, 2008 – 2018. |
13 | None. | |||||
| Jill R. Cuniff c/o Harding Loevner LP 400 Crossing Boulevard Fourth Floor Bridgewater, NJ 08807 1964 |
Director | Indefinite; Director since 2018; Member of the Audit Committee since 2018; Member of the Governance Committee since March 2018 | Retired, 2016 to present | 13 | None. | |||||
| R. Kelly Doherty c/o Harding Loevner LP 400 Crossing Boulevard Fourth Floor Bridgewater, NJ 08807 1958 |
Director | Indefinite; Director since 2004; Lead Independent Director since 2014; Member of the Governance Committee since March 2018 | Caymen Partners (private investment vehicles), Managing Partner, 1999 - present | 13 | Selective Insurance Group, Inc. (SIGI). | |||||
106
Table of Contents
Harding, Loevner Funds, Inc.
Directors and Principal Officers
(unaudited)
Independent Directors (continued):
| Name, Address and Year of Birth |
Position with the Fund |
Term of Office and Length of Time Served |
Principal Occupation During Past Five Years |
Number of Portfolios in Fund Complex Overseen By Director |
Other Directorships | |||||
| Charles W. Freeman, III c/o Harding Loevner LP 400 Crossing Boulevard Fourth Floor Bridgewater, NJ 08807 1964 |
Director |
Indefinite; Director since 2008; Member of the Governance Committee since March 2018 | U.S. Chamber of Commerce, Senior Vice President for Asia, 2018 - present; Bower Group Asia, Managing Director, China, December 2016 – 2017. | 13 | None. | |||||
| Jason Lamin c/o Harding Loevner LP 400 Crossing Boulevard Fourth Floor Bridgewater, NJ 08807 1974 |
Director | Indefinite; Director since 2021; Member of the Audit Committee since 2021; Member of the Governance Committee beginning March 2021. | Lenox Park Solutions, Inc. (FinTech Company), Founder and Chief Executive Officer, 2009 – present. | 13 | None. | |||||
| Eric Rakowski c/o Harding Loevner LP 400 Crossing Boulevard Fourth Floor Bridgewater, NJ 08807 1958 |
Director | Indefinite; Director since 2008; Chairman of the Governance Committee since March 2018 | University of California at Berkeley School of Law, Professor, 1990 – present. | 13 | AMG Funds (46 portfolios); AMG Pantheon Private Equity Fund (1 portfolio); AMG Pantheon Private Equity Master Fund (1 portfolio); AMG Pantheon Subsidiary Fund, LLC (1 portfolio); Parnassus Funds (5 portfolios). | |||||
| Interested Directors: | ||||||||||
| Name, Address and Year of Birth |
Position with the Fund |
Term of Office and Length of Time Served* |
Principal Occupation During Past Five Years |
Number of Portfolios in Fund Complex Overseen By Director |
Other Directorships | |||||
| David R. Loevner** c/o Harding Loevner LP 1230 Ida Dr. Ste. 31⁄2 PO Box 383 Wilson, WY 83014 1954 |
Director and Chairman of the Board of Directors | Indefinite; Director and Chairman of the Board since 1996 | Harding Loevner LP, Chairman and Chief Executive Officer, 1989 – present; Harding Loevner Funds, plc, Director, 2007 - present. | 13 | None. | |||||
107
Table of Contents
Harding, Loevner Funds, Inc.
Directors and Principal Officers
(unaudited)
Independent Directors (continued):
| Name, Address and Year of Birth |
Position with the Fund |
Term of Office and Length of Time Served* |
Principal Occupation During Past Five Years |
Number of Portfolios in Fund Complex Overseen By Director |
Other Directorships | |||||
| Alexandra K. Lynn*** Affiliated Managers Group, Inc. 777 South Flagler Drive West Palm Beach, FL 33401 1979 |
Director | Indefinite; Director since 2021. | Affiliated Managers Group, Inc., 2009 – present (Chief Administrative Officer, 2018 – present) |
13 | None. | |||||
* Each of Mr. Loevner and Ms. Lynn is elected to serve in accordance with the Articles of Incorporation and By-Laws of the Fund until their respective successor is duly elected and qualified.
** Mr. Loevner is considered an “interested person” of the Fund as defined in 1940 Act, because he serves as Chairman of Harding Loevner LP, the Fund’s investment advisor.
*** Ms. Lynn is considered an “interested person” of the Fund as defined in the 1940 Act, as a result of her position with, and interest in securities of, AMG, a control person of Harding Loevner.
The Funds’ Statement of Additional Information contains additional information about the Directors and is available upon request and without charge by calling (877) 435-8105.
108
Table of Contents
Harding, Loevner Funds, Inc.
Directors and Principal Officers
(unaudited)
Principal Officers of the Fund:
| Name, Address and Year of Birth |
Position(s) with the Fund |
Term of Office and Length of Time Served* |
Principal Occupation During Past Five Years | |||
| Ryan Bowles Harding Loevner LP 400 Crossing Boulevard Fourth Floor Bridgewater, NJ 08807 1988 |
President | 1 year; since 2022 | Harding Loevner LP, Product Manager, 2010 - present. | |||
| Tracy L. Dotolo Foreside Management Services, LLC (d/b/a ACA Group) 3 Canal Plaza Third Floor Portland, ME 04101 1976 |
Chief Financial Officer and Treasurer | 1 year; since 2019 | Senior Director at Foreside Management Services, LLC (d/b/a ACA Group), 2016 – present. | |||
| Aaron J. Bellish Harding Loevner LP 400 Crossing Boulevard Fourth Floor Bridgewater, NJ 08807 1979 |
Assistant Treasurer | 1 year; since 2012 | Harding Loevner LP, Chief Operating Officer, 2021 – present; Chief Financial Officer, 2012 – 2021. | |||
| Derek A. Jewusiak The Northern Trust Company 333 South Wabash Chicago, IL 60604 1971 |
Assistant Treasurer | 1 year; since 2013 | The Northern Trust Company, Vice President, 2012 – present. | |||
| Lisa Togneri Harding Loevner LP 400 Crossing Boulevard Fourth Floor Bridgewater, NJ 08807 1976 |
Assistant Treasurer | 1 year; since 2021 | Harding Loevner LP, Chief Financial Officer, 2021 – present; Deputy Chief Financial Officer, 2019 – 2021; Soundlink Partners, Chief Financial Officer and Chief Operating Officer, 2015-2019. | |||
| Tom Dula Harding Loevner LP 400 Crossing Boulevard Fourth Floor Bridgewater, NJ 08807 1974 |
Assistant Treasurer | Since 2022 | Harding Loevner LP Product Operations Manager, Nov 2022 - present; Northern Trust Client Executive, Nov 2016 - Nov 2022. | |||
| Lisa R. Price Harding Loevner LP 400 Crossing Boulevard Fourth Floor Bridgewater, NJ 08807 1979 |
Assistant Secretary | 1 year; since 2019 | Harding Loevner LP, Counsel, 2019 – present; Oak Hill Advisors, LP, Principal, Associate General Counsel and Chief Compliance Officer (OHAI), January 2019 – August 2019, Vice President, Associate General Counsel and Chief Compliance Officer (OHAI), 2015 – 2018. | |||
| Brian D. Simon Harding Loevner LP 400 Crossing Boulevard Fourth Floor Bridgewater, NJ 08807 |
Chief Compliance Officer, Anti-Money Laundering Compliance Officer and Assistant Secretary | 1 year, since 2016, 2016 and 2015 respectively | Harding Loevner LP, General Counsel, 2014 – present; Chief Compliance Officer, 2021 – present. | |||
109
Table of Contents
Harding, Loevner Funds, Inc.
Directors and Principal Officers
(unaudited)
Principal Officers of the Fund (continued):
| Name, Address and Year of Birth |
Position(s) with the Fund |
Term of Office and Length of Time Served* |
Principal Occupation During Past Five Years | |||
| Tanya S. Tancheff The Northern Trust Company 333 South Wabash Avenue Chicago, IL 60604 1973 |
Secretary | 1 year; since December 2022 | The Northern Trust Company, Second Vice President, 2022 – present; ALPS Holdings, Inc., Senior Paralegal 2017 - 2022 | |||
* Officers are elected to hold such office until their successor is elected and qualified to carry out the duties and responsibilities of their office, or until he or she resigns or is removed from office.
There is no family relationship among any of the Directors or officers listed above.
110
Table of Contents
Supplemental Information
(unaudited)
Quarterly Portfolio Schedules of Investments
Each Portfolio files its complete portfolio of investments with the SEC for the first and third quarters of each fiscal year as an exhibit to its reports on Form N-PORT. The Portfolios’ Forms N-PORT are available on the SEC’s website at www.sec.gov. Additionally, they are available upon request by calling (877) 435-8105.
Proxy Voting Record
The Fund’s proxy voting record relating to the Portfolios’ securities during the most recent 12-month period ended June 30 is available on the Fund’s website at www.hardingloevnerfunds.com and on the SEC’s website at www.sec.gov, on Form N-PX.
Proxy Voting Policies and Procedures
The Fund’s proxy voting policies and procedures are included in Appendix B to the Fund’s Statement of Additional Information and is available without charge, upon request, by calling (877) 435-8105 or on the SEC’s website at www.sec.gov.
Additional Information
The Adviser updates Fact Sheets for the Portfolios each calendar quarter that are posted to the Fund’s website at www.hardingloevnerfunds.com. This information, along with the Adviser’s commentaries on its various strategies, is available without charge, upon request, by calling (877) 435-8105.
111
Table of Contents
This page intentionally left blank.
Table of Contents
This report is intended for shareholders of Harding, Loevner Funds, Inc. It may not be used as sales literature unless preceded or accompanied by the current Prospectus, which gives details about charges, expenses, investment objectives, risks and policies of the Portfolios.
Table of Contents
Harding, Loevner Funds, Inc.
c/o Northern Trust
Attn: Funds Center, Floor 38
333 South Wabash Avenue
Chicago, IL 60604
(877) 435-8105
www.hardingloevnerfunds.com

Table of Contents
Item 1. Reports to Stockholders (cont.).
| (b) | Not applicable. |
Item 2. Code of Ethics.
| (a) | As of the end of the period covered by this report, the registrant has adopted a code of ethics for senior officers pursuant to the Sarbanes-Oxley Act of 2002 (“SOX Code”) that applies to the registrant’s principal executive officer, principal financial officer, principal accounting officer or controller, or persons performing similar functions, regardless of whether these individuals are employed by the registrant or a third party. |
For purposes of this item, “code of ethics” means written standards that are reasonably designed to deter wrongdoing and to promote:
| 1. | Honest and ethical conduct, including the ethical handling of actual or apparent conflicts of interest between personal and professional relationships; |
| 2. | Full, fair, accurate, timely, and understandable disclosure in reports and documents that a registrant files with, or submits to, the Commission and in other public communications made by the registrant; |
| 3. | Compliance with applicable governmental laws, rules, and regulations; |
| 4. | The prompt internal reporting of violations of the code to an appropriate person or persons identified in the code; and |
| 5. | Accountability for adherence to the code. |
| (b) | During the period covered by this report, there were no amendments to the Fund’s SOX Code other than to update the list of senior officers in Exhibit A. |
| (c) | Waivers: During the period covered by the report, the registrant has not granted any express or implicit waivers from the provisions of the SOX Code. |
| (d) | Not applicable. |
| (e) | The Registrant’s SOX Code referred to in Item 2(a) above is attached as an Exhibit 13(a)(1), hereto. |
Item 3. Audit Committee Financial Expert.
As of October 31, 2022, the Registrant’s Board of Directors has determined that the following members of the Audit Committee are audit committee financial experts and independent: Carolyn N. Ainslie and Jill R. Cuniff.
Item 4. Principal Accountant Fees and Services.
(a) Audit Fees: The aggregate fees billed for each of the last two fiscal years for professional services rendered by KPMG LLP, the Registrant’s principal accountant, for the audit of the Registrant’s annual financial statements in connection with statutory and regulatory filings or engagements for those fiscal years are $296,310 in 2022 and $249,570 in 2021.
(b) Audit-Related Fees: The aggregate fees billed in each of the last two fiscal years for assurance and related services by KPMG LLP that are reasonably related to the performance of the audit of the Registrant statutory and regulatory filings or engagements are $13,000 in 2022 and $0 in 2021.
2
Table of Contents
(c) Tax Fees: The aggregate fees billed in each of the last two fiscal years for professional services rendered by KPMG LLP for the review of domestic tax returns were $107,200 in 2022 and $86,630 in 2021.
(d) All Other Fees: The aggregate fees billed in each of the last two fiscal years for products and services provided by KPMG LLP, other than the services reported in paragraphs (a) through (c) of this Item are $0 in 2022 and $0 in 2021.
(e)(1) Disclose the audit committee pre-approval policies and procedures described in paragraph (c)(7) of Rule 2-01 of Regulation S-X.
A copy of the Audit Committee’s Pre-Approval Policies and Procedures is incorporated by reference under Item 13(c).
(e)(2) There were no amounts that were pre-approved by the Audit Committee pursuant to paragraph (c)(7)(i)(C) of Rule 2-01 of Regulation S-X.
(f) Not applicable.
(g) Not applicable.
(h) Not applicable.
(i) Not applicable.
(j) Not applicable.
Item 5. Audit Committee of Listed Registrants.
Not applicable.
Item 6. Investments.
| (a) | Schedule I is included as part of the report to shareholders filed under Item 1(a) of this report on Form N-CSR. |
| (b) | Not applicable. |
Item 7. Disclosure of Proxy Voting Policies and Procedures for Closed-End Management Investment Companies.
Not applicable.
Item 8. Portfolio Managers of Closed-End Management Investment Companies.
Not applicable.
Item 9. Purchases of Equity Securities by Closed-End Management Investment Company and Affiliated Purchasers.
Not applicable.
Item 10. Submission of Matters to a Vote of Security Holders.
Not applicable.
3
Table of Contents
Item 11. Controls and Procedures.
| (a) | The Registrant’s Principal Executive Officer and Principal Financial Officer, or persons performing similar functions, have concluded that the Registrant’s disclosure controls and procedures (as defined in Rule 30a-3(c) under the Investment Company Act of 1940, as amended (the “1940 Act”)) were effective as of a date within 90 days prior to the filing date of this report, based on their evaluation of the effectiveness of the Registrant’s disclosure controls and procedures as of the evaluation date. |
| (b) | There were no significant changes in the Registrant’s internal control over financial reporting (as defined in Rule 30a-3(d) under the 1940 Act) that occurred during the period covered by this report that have materially affected, or are reasonably likely to materially affect, the Registrant’s internal control over financial reporting. |
Item 12. Disclosure of Securities Lending Activities for Closed-End Management Investment Companies.
Not applicable.
Item 13. Exhibits.
| (a)(1) |
| (a)(2) |
| (a)(3) | Not applicable. |
| (a)(4) | Not applicable. |
| (b) |
| (c) |
4
Table of Contents
SIGNATURES
Pursuant to the requirements of the Securities Exchange Act of 1934 and the Investment Company Act of 1940, the Registrant has duly caused this report to be signed on its behalf by the undersigned, thereunto duly authorized.
| Harding, Loevner Funds, Inc. | ||
| By | /s/ Ryan Bowles | |
| Ryan Bowles | ||
| President | ||
| (Principal Executive Officer) | ||
| Date: January 5, 2023 | ||
Pursuant to the requirements of the Securities Exchange Act of 1934 and the Investment Company Act of 1940, this report has been signed below by the following persons on behalf of the Registrant and in the capacities and on the dates indicated.
| By | /s/ Ryan Bowles | |
| Ryan Bowles | ||
| President | ||
| (Principal Executive Officer) | ||
| Date: January 5, 2023 | ||
| By | /s/ Tracy L. Dotolo | |
| Tracy L. Dotolo | ||
| Chief Financial Officer and Treasurer | ||
| (Principal Financial Officer) | ||
| Date: January 5, 2023 | ||
5