UNITED STATES
SECURITIES AND EXCHANGE COMMISSION
Washington, D.C. 20549
FORM 10-K
(Mark One)
|
☒
|
ANNUAL REPORT PURSUANT TO SECTION 13 OR 15(d) OF THE SECURITIES
EXCHANGE ACT OF 1934
|
For the fiscal year ended: February 2, 2019
or
|
☐
|
TRANSITION REPORT PURSUANT TO SECTION 13 OR 15(d) OF THE
SECURITIES EXCHANGE ACT OF 1934
|
For the transition period from: __________________________ to __________________________
Commission file number: 000-20969

HIBBETT SPORTS, INC.
(Exact name of registrant as specified in its charter)
|
DELAWARE
|
20-8159608
|
|
|
(State or other jurisdiction of incorporation or organization)
|
(I.R.S. Employer Identification No.)
|
2700 Milan Court, Birmingham, Alabama 35211
(Address of principal executive offices, including zip code)
205-942-4292
(Registrant’s telephone number, including area code)
Securities registered pursuant to Section 12(b) of the Act:
|
Common Stock, $0.01 Par Value Per Share
|
NASDAQ Global Select Market
|
|
|
Title of Class
|
Name of each exchange on which registered
|
|
Securities registered pursuant to section 12(g) of the Act:
|
NONE
|
Indicate by check mark if the registrant is a well-known seasoned issuer, as defined in Rule 405 of the Securities Act.
|
Yes
|
☒ |
No
|
☐ |
|
Indicate by check mark if the registrant is not required to file reports pursuant to Section 13 or Section 15(d) of the Act.
|
||||||
|
Yes
|
☐ |
No
|
☒
|
|||
Indicate by check mark whether the registrant (1) has filed all reports required to be filed by Section 13 or 15(d) of the Securities Exchange Act of 1934
during the preceding 12 months (or for such shorter period that the registrant was required to file such reports), and (2) has been subject to such filing requirements for the past 90 days.
|
Yes
|
☒
|
No
|
☐ |
Indicate by check mark whether the registrant has submitted electronically every Interactive Data File required to be submitted pursuant to Rule 405 of
Regulation S-T (§232.405 of this chapter) during the preceding 12 months (or for such shorter period that the registrant was required to submit such files).
|
Yes
|
☒
|
No
|
☐ |
Indicate by check mark if disclosure of delinquent filers pursuant to Item 405 of Regulation S-K (§229.405 of this chapter) is not contained herein, and
will not be contained, to the best of registrant’s knowledge, in definitive proxy or information statements incorporated by reference in Part III of this Form 10-K or any amendment to this Form 10-K. ☒
Indicate by check mark whether the registrant is a large accelerated filer, an accelerated filer, a non-accelerated filer, a smaller reporting company, or
an emerging growth company. See the definitions of “large accelerated filer,” “accelerated filer,” “smaller reporting company,” and “emerging growth company” in Rule 12b-2 of the Exchange Act.
|
Large accelerated filer
|
☐ |
Accelerated filer
|
☒
|
|
|
Non-accelerated filer
|
☐ |
Smaller reporting company
|
☐ | |
|
Emerging growth company
|
☐ |
If an emerging growth company, indicate by check mark if the registrant has elected not to use the extended transition period for complying with any new or
revised financial accounting standards provided pursuant to Section 13(a) of the Exchange Act. ☐
Indicate by check mark whether the registrant is a shell company (as defined in Rule 12b-2 of the Act).
|
Yes
|
☐ |
No
|
☒
|
The aggregate market value of the voting stock held by non-affiliates of the Registrant (assuming for purposes of this calculation that all executive
officers and directors are “affiliates”) was $444,759,513 on August 4, 2018, based on the closing sale price of $24.15 at August 3, 2018 for the common stock on such date on the NASDAQ Global Select Market.
The number of shares outstanding of the Registrant’s common stock, as of April 2, 2019, was 18,384,835.
DOCUMENTS INCORPORATED BY REFERENCE
Portions of the Registrant’s Proxy Statement for the 2019 Annual Meeting of Stockholders to be held on May 23, 2019, are incorporated by reference into Part
III of this Annual Report on Form 10-K. Registrant’s definitive Proxy Statement will be filed with the Securities and Exchange Commission on or before April 23, 2019.
HIBBETT SPORTS, INC.
|
Page
|
||
|
Item 1.
|
4
|
|
|
Item 1A.
|
11
|
|
|
Item 1B.
|
22
|
|
|
Item 2.
|
23
|
|
|
Item 3.
|
23
|
|
|
Item 4.
|
24
|
|
|
Item 5.
|
25
|
|
|
Item 6.
|
27
|
|
|
Item 7.
|
29
|
|
|
Item 7A.
|
39
|
|
|
Item 8.
|
40
|
|
|
Item 9.
|
69
|
|
|
Item 9A.
|
69
|
|
|
Item 9B.
|
70
|
|
|
Item 10.
|
70
|
|
|
Item 11.
|
70
|
|
|
Item 12.
|
71
|
|
|
Item 13.
|
71
|
|
|
Item 14.
|
71
|
|
|
Item 15.
|
72
|
|
|
Item 16.
|
74
|
|
|
75
|
||
Introductory Note
References to “we”, “our”, “us”, “Hibbett” and the “Company” used throughout this document refer to Hibbett Sports, Inc. and its
subsidiaries. Unless specifically indicated otherwise, any reference to the following years or fiscal years relates to:
|
Year
|
Related Fiscal Year End
|
Weeks in
Fiscal Period
|
|
2020 or Fiscal 2020
|
February 1, 2020
|
52
|
|
2019 or Fiscal 2019
|
February 2, 2019
|
52
|
|
2018 or Fiscal 2018
|
February 3, 2018
|
53
|
|
2017 or Fiscal 2017
|
January 28, 2017
|
52
|
Cautionary Statement Regarding Forward-Looking Statements
This document contains “forward-looking statements” as that term is used in the Private Securities Litigation Reform Act of 1995.
Forward-looking statements address future events, developments and results and do not relate strictly to historical facts. Any statements contained herein that are not statements of historical fact may be deemed to be forward-looking
statements. They include statements preceded by, followed by or including words such as “believe,” “anticipate,” “could,” “expect,” “intend,” “may,” “outlook,” “forecast,” “guidance,” “continue,” “plan,” “predict,” “should,” “will,” “target,”
“estimate” or other similar words, phrases or expressions, whether in the negative or affirmative. For example, our forward-looking statements include statements
regarding:
| · |
our plans, expectations and estimates concerning the integration of City Gear, LLC (City Gear) and related costs;
|
| · |
our ability to retain key personnel at Hibbett and City Gear;
|
| · |
our anticipated net sales, comparable store net sales changes, net sales growth, gross margins, expenses and earnings;
|
| · |
our business strategy, omni-channel platform, logistics structure, target market presence and the expected impact of such factors on our net sales growth;
|
| · |
our store growth, including our plans to add, expand, relocate or close stores, our markets’ ability to support such growth, expected changes in total square footage, our
ability to secure suitable locations for new stores and the suitability of our wholesale and logistics facility;
|
| · |
our expectations regarding the growth of our online business and the role of technology in supporting such growth;
|
| · |
our policy of leasing rather than owning stores and our ability to renew or replace store leases satisfactorily;
|
| · |
the cost of regulatory compliance, including the costs and possible outcomes of pending legal actions and other contingencies;
|
| · |
our cash needs, including our ability to fund our future capital expenditures, working capital requirements and repurchases of Company common stock under our repurchase
program;
|
| · |
our analysis of our risk factors and their possible effect on financial results;
|
| · |
our ability and plans to renew our credit facilities;
|
| · |
our expectations regarding our capital expenditures and dividend policy;
|
| · |
our seasonal sales patterns and assumptions concerning customer buying behavior;
|
| · |
our expectations regarding competition;
|
| · |
our estimates and assumptions as they relate to the fair value of assets acquired and liabilities assumed in the purchase of City Gear, preferable tax and financial
accounting methods, accruals, inventory valuations, long-lived assets, store closure charges, carrying amount and liquidity of financial instruments, fair value of options and other stock-based compensation, economic and useful lives
of depreciable assets and leases, income tax liabilities, deferred taxes and uncertain tax positions;
|
| · |
our expectations concerning future stock-based award types and the exercise of outstanding stock options;
|
| · |
the possible effect of inflation, market decline and other economic changes on our costs and profitability;
|
| · |
our assessment of the materiality and impact on our business of recent accounting pronouncements adopted by the Financial Accounting Standards Board;
|
| · |
the possible effects of uncertainty within the capital markets, on the commercial credit environment and on levels of consumer confidence;
|
| · |
our analyses of trends as related to marketing, sales and earnings performance;
|
| · |
our ability to receive favorable brand name merchandise and pricing from key vendors;
|
| · |
the future reliability of, and cost associated with, our sources of supply, particularly imported goods;
|
| · |
our relationships with vendors and the loss of key vendor support;
|
| · |
our plans, expectations and abilities relating to cybersecurity; and
|
| · |
our ability to mitigate the risk of possible business interruptions.
|
A forward-looking statement is neither a prediction nor a guarantee of future results, events or circumstances. You should not place
undue reliance on forward-looking statements. Our forward-looking statements are all based on currently available operating, financial and business information and speak only as of the date of this Annual Report on Form 10-K. Our business,
financial condition, results of operations and prospects may have changed since that date. For a discussion of the risks, uncertainties and assumptions that could affect our future events, developments or results, you should carefully review the
“Risk Factors” as well as “Management’s Discussion and Analysis of Financial Condition and Results of
Operations” included elsewhere in this report.
We cannot assure you that the results, events and circumstances reflected in the forward-looking statements will be achieved or occur,
and actual results, events or circumstances could differ materially from those described in the forward-looking statements. Moreover, new risks and uncertainties emerge from time to time and it is not possible for us to predict all risks and
uncertainties that could have an impact on our forward-looking statements.
We do not undertake to publicly update or revise any forward-looking statements after the date of this Form 10-K, whether as a result of
new information, future events, or otherwise, and you should not expect us to do so.
Investors should also be aware that while we do, from time to time, communicate with securities analysts and others, we do not, by
policy, selectively disclose to them any material non-public information in connection with any statement or report issued by any analyst regardless of the content of the statement or report. We do not, by policy, confirm forecasts or
projections issued by others. Thus, to the extent that reports issued by securities analysts contain any projections, forecasts or opinions, such reports are not our responsibility.
Our Company
Our Company began in 1945 under the name Dixie Supply Company in Florence, Alabama. Although we initially specialized primarily in the
marine and small aircraft business, by 1960, we were solely in the sporting goods business. In 1965, we opened our second store, Dyess & Hibbett Sporting Goods, in Huntsville, Alabama, and hired Mickey Newsome, who is now Chairman of our
Board. The following year, we opened another sporting goods store in Birmingham and by the end of 1980, we had 12 stores in central and northwest Alabama with a distribution center located in Birmingham and our central accounting office in
Florence. We became a public company in October 1996.
In November 2018, we acquired City Gear, LLC (City Gear), a privately held city specialty retailer with over 130 stores. The City Gear
acquisition provides us with substantially greater scale in the athletic specialty market and is an extension of our strategy to provide high demand, branded products to underserved markets. Today, we are a leading athletic-inspired omni-channel
retailer operating stores primarily located in small and mid-sized communities, and e-commerce websites under hibbett.com and citygear.com. As of February 2, 2019, we operated a total of 1,163 stores consisting of 1,025 Hibbett stores and 138
City Gear stores in 35 states. Overall, our stores are approximately 5,500 square feet and are located primarily in strip centers frequently influenced by a major chain retailer.
Our primary merchandising strategy is to
provide a broad assortment of quality brand name footwear, apparel, accessories and athletic equipment at competitive prices in a conveniently located full-service environment. At the end of the second quarter of Fiscal 2018, we successfully
launched our e-commerce website. We will continue to grow our online business aggressively, while continuing to enhance our stores to improve the overall customer experience. We believe that the breadth and depth of our brand name merchandise
consistently exceeds the product selection carried by most of our competitors, particularly in our smaller markets. Many of these brand name products are highly technical and require expert sales assistance. We continuously educate our sales
staff on new products and trends through coordinated efforts with our vendors.
Our Executive Officers
Our current executive officers and their prior business experience are as follows:
Jeffry O. Rosenthal, age 61,
has been our Chief Executive Officer and President since March 2010. He also currently serves on our Board of Directors. Formerly, he served as President and Chief Operating Officer from February 2009 through March 2010 and as Vice President of
Merchandising from August 1998 through February 2009. Prior to joining us, Mr. Rosenthal was Vice President and Divisional Merchandise Manager for Apparel with Champs Sports, a division of Foot Locker, Inc., from 1981 to 1998.
Scott J. Bowman, age 52, was
hired as our Senior Vice President and Chief Financial Officer in July 2012. Prior to joining us, Mr. Bowman was Division Chief Financial Officer – Northern Division of The Home Depot, a large home improvement retailer. Previously, Mr. Bowman
served The Home Depot as their Senior Director, Finance – IT for approximately three years. In prior retail experience, he has worked in various controller and accounting management positions.
Jared S. Briskin, age 46,
was appointed our Senior Vice President and Chief Merchant in September 2014. Formerly, he served as Vice President/Divisional Merchandise Manager of Footwear and Equipment from March 2010 through September 2014 and Vice President/Divisional
Merchandise Manager of Apparel and Equipment from June 2004 through March 2010. Prior to his appointment to Vice President in 2004, Mr. Briskin held various merchandising positions across multiple categories since joining the Company in April
1998.
Cathy E. Pryor, age 55, has
been our Senior Vice President of Operations since 2012. Formerly, she served as Vice President of Operations from 1995 to 2012. She joined our Company in 1988 serving in areas of increasing responsibility including district manager and
Director of Store Operations.
Our Employees
As of February 2, 2019, we employed approximately 10,600 employees, of which approximately 3,600 are full‑time employees. None of our
employees are represented by a labor union. The number of part‑time employees fluctuates depending on seasonal needs. We consider our relationship with our employees to be good and have not experienced significant interruptions of operations
due to labor disagreements. We have implemented programs in our stores and corporate offices to ensure that we hire and promote the most qualified employees in a non-discriminatory way.
Employee Development: We develop our training
programs in a continuing effort to service the needs of our customers and employees. These programs include online and DVD training in all stores for the latest in technical detail of new products and new operational and customer service
techniques. We also have an intensive, five-day session designed specifically for new store managers. Periodically, we conduct shorter onsite training sessions for all or a specific group of employees as needed. Because we primarily promote or
relocate current employees to serve as managers for new stores, training and assessment of our employees is essential to our sustained growth.
Our Business Strategy
We target small to mid-sized markets with branded products and provide a high level of customer service. This market strategy enables us
to achieve significant cost benefits including lower corporate expenses, reduced logistics costs and increased economies of scale from marketing activities. We use information systems to maintain tight controls over inventory and operating costs
and continually search for ways to improve efficiencies and the customer experience through information system upgrades. In addition, we establish greater customer, vendor and landlord recognition as a leading athletic specialty retailer in
these communities. We believe our ability to align our merchandising mix to local preferences and trends differentiates us from our national competitors.
We strive to hire enthusiastic sales people with an interest in sports and athletics-inspired fashion. Our extensive training program
focuses on product knowledge and selling skills and is conducted through the use of in-store clinics, interactive group discussions and store associate training, self-study courses and Hibbett University designed specifically for store
management.
Our Store Banners
Hibbett Sports: As of February 2, 2019, we
operated 1,007 Hibbett Sports stores. These stores average approximately 5,700 square feet and are located primarily in strip centers, usually near a major chain retailer such as a Wal-Mart store. We operated 809 Hibbett Sports stores in strip
centers, which includes free-standing stores, and 198 stores in enclosed malls, the majority of which are the only enclosed malls in their county.
City Gear: In November 2018, we acquired 136
City Gear stores and as of February 2, 2019, operated 138 City Gear stores which average 5,000 square feet and are located primarily in strip centers. We operated 97 City Gear stores in strip centers, which includes free-standing stores, and 41
stores in enclosed malls.
Sports Additions: We operate 18 Sports
Additions (SA) stores, which average 2,500 square feet and are located primarily in enclosed malls. Approximately 90% of the merchandise carried in our SA stores is athletic footwear with the remainder consisting of headwear and apparel.
Team: In December 2017, we sold a portion of
the assets and ceased the operations of Hibbett Team Sales, Inc. (Team), a wholly‑owned subsidiary of the Company. Team was a supplier of customized athletic apparel, equipment and footwear primarily to school athletic programs in Alabama and
parts of Georgia, Florida and Mississippi. Team sold its merchandise directly to educational institutions and youth associations. The operations of Team were independent of the operations of our retail stores.
In selecting retail locations, we consider the size, demographics, quality of real estate and competitive conditions in each market. Our
stores offer a core merchandising mix of localized footwear, apparel, accessories and equipment designed to appeal to a wide range of customers within each market. We strive to meet the technical and fashion demands of our consumer as well as
respond quickly to major sporting events in college or professional team sports of local interest within our markets.
None of our store concepts meets the quantitative or qualitative requirements of Accounting Standards Codification (ASC) Topic 280, Segment Reporting.
Our Growth Strategy
We identify markets for our stores under a clustered expansion program. This approach primarily focuses on opening new stores within a
two‑hour driving distance of existing locations, allowing us to take advantage of efficiencies in logistics, marketing and regional management. It also aids us in building a better understanding of appropriate merchandise selection for the local
market. In addition to proximity to existing stores, we also consider population, economic conditions, local competitive dynamics, availability of suitable real estate and potential for return on investment when evaluating potential markets.
Omni-channel strategy: We recognize that our
customer is evolving and looking to engage with us in multiple ways. As a result, we continue to make investments that will enable us to engage our customer specifically in the digital commerce channel. In addition to having store-to-store and
store-to-home capability allowing us to use our chain-wide inventory to satisfy a customer sale, we have an e-commerce website allowing customers to shop across both channels. In Fiscal 2019, we completed development of our mobile app and rolled
out Buy Online, Pickup in Store (BOPIS) and Reserve Online, Pickup in Store (ROPIS). These developments complement our website and provide our customers with even more advanced features such as shopping, loyalty and raffle capabilities.
Our Logistics
We maintain a full-line wholesale and logistics facility in Alabaster, Alabama (a suburb of Birmingham) where we receive and ship most
our merchandise. In addition, we utilize a third-party logistics facility in Memphis, Tennessee and a third-party consolidation center in southern California to improve efficiencies and to improve time to market. For key products, we maintain
backstock at the Alabaster facility. This product is allocated and shipped to stores through an automatic replenishment system based on inventory levels and sales. Merchandise is delivered to stores via Company‑operated vehicles, small package
carriers or third-party logistics providers. We believe strong logistics support for our stores is a critical element of our business strategy and that our current logistics structure will support our growth over the next several years. See “Risk Factors.”
Our Merchandise
Our merchandising strategy is to provide a
broad assortment of premium brand name footwear, apparel, accessories and athletic equipment at competitive prices in a full service environment.
We believe that the assortment of brand name merchandise we offer consistently exceeds the merchandise selection carried by most of our
brick and mortar competitors, particularly in our smaller markets. Many of these brand name products have limited availability and/or are technical in nature requiring considerable sales assistance. We coordinate with our vendors to educate the
sales staff at the store level on new products and trends.
Although the core merchandise assortment tends to be similar for each store, important demographic, local and/or regional differences
exist. Accordingly, our stores offer products that reflect preferences for particular demographics as well as interests from each community. Our knowledge of these interests, combined with access to leading vendors, enables our merchandising
staff to react quickly to emerging trends or special events, such as fashion shifts or athletic events.
Our merchandising staff, operations staff and management analyze current trends primarily through the lens of our store typing strategy.
Information is largely gathered and analyzed utilizing business intelligence tools. Other strategic measures we utilize to recognize trends or changes in our industry include:
| · |
maintaining close relationships with vendors and other retailers;
|
| · |
studying other retailers for best practices in merchandising;
|
| · |
attending various trade shows, both in our industry and outside as well as reviewing industry trade publications;
|
| · |
actively participating in industry associations such as the National Sporting Goods Association (NSGA);
|
| · |
visiting competitor store locations;
|
| · |
monitoring industry data sources and periodicals;
|
| · |
monitoring product selection at competing stores and online; and
|
| · |
communicating with our regional vice presidents, district managers and store managers.
|
The merchandising staff works closely with store personnel to meet the requirements of individual stores for appropriate merchandise in
sufficient quantities. See “Risk Factors.”
Our Vendor Relationships
The athletic specialty retail business is brand name driven. Accordingly, we maintain positive relationships with a number of well-known
vendors to satisfy customer demand. We believe that our stores are among the primary brick and mortar retail distribution avenues for brand name vendors that seek to penetrate our target markets. As a result, we are able to attract considerable
vendor interest and establish long‑term partnerships with vendors. As our vendors expand their product lines and grow in popularity, we expand sales of these products within our stores. In addition, as we continue to increase our store base and
enter new markets, our vendors increase their brand presence within these regions. We also work with our vendors to establish favorable pricing and to receive cooperative marketing funds. See “Risk Factors.”
Our Information Systems
We use technology as an enabler of our business strategies. We have implemented and maintained systems targeted at improving financial
control, cost management, inventory control, merchandise planning, logistics, replenishment, and product allocation. Based on our evaluation of City Gear to-date, we believe that it followed a similar approach to maintaining package and
partner-based systems.
Our systems are designed to be flexible to meet the unique needs of each specific store location. In Fiscal 2018, we added our digital
channel and in Fiscal 2019, we accomplished further channel integration and a more seamless and frictionless set of capabilities aimed at enhancing our customers shopping experience in store, online and through our mobile solutions. In Fiscal
2020, we expect to extend shipping options that our customers have expressed great interest in and also decrease costs for shipping services. Additionally, we plan to co-brand our web presence by including City Gear into our omni-channel
experience.
Our communications networks send and receive critical business data to and from stores, third-party cloud providers, and managed hosting
facilities (data centers). Our company’s information is processed in a secure environment to protect both the actual data and the physical assets. We attempt to mitigate the risk of cyber-security threats and business interruptions by
maintaining strong security protocols, threat monitoring, regular risk reviews, and a detailed disaster recovery plan. While many of these same controls are utilized by City Gear, we plan to update the City Gear systems where warranted to the
above stated aspects of security to be more closely aligned across all our operations.
We strive to maintain highly qualified and motivated third-party partners and teams of individuals to support our information systems,
which includes security, help desk, engineering, operations, quality assurance, business analysis, solution development and project managers. Our systems are monitored 24 hours a day and management believes that our current systems and practice
of implementing regular updates will continue to support current needs and future growth. We use a strategic information systems planning process that involves senior management and is integrated into our overall business planning and enterprise
risk management. Information systems projects are prioritized based upon strategic, financial, regulatory and other business criteria.
Our Marketing and Promotion
We focus on marketing opportunities that drive traffic and sales to our stores and website. In Fiscal 2019, digital marketing was the
major growth area of our marketing budget, while direct mail continued to be an important part of our marketing mix. Because these investments in digital marketing are yielding strong response, we expect to continue to grow digital marketing in
Fiscal 2020. We utilize our internal marketing team, as well as external digital marketing agencies, to ensure execution and returns from these new programs.
We offer two customer loyalty programs, the Hibbett Rewards program and City Gear Reward Points, whereby customers can earn awards that
can be redeemed in our stores. Our Rewards programs represent a significant portion of overall sales. In Fiscal 2018, we launched an improved Hibbett program that provided more value to our customers and made it easier to use. Since then, we
have significantly increased our member base as well as their frequency of purchases. We continue to explore opportunities to further improve our Rewards programs to drive member acquisition and sales.
Our Competition
The business in which we are engaged is highly competitive. The marketplace for athletic specialty merchandise is highly fragmented as
many different brick and mortar and online retailers compete for market share by utilizing a variety of formats and merchandising strategies. We compete with department and discount stores, traditional shoe stores, specialty sporting goods
shops, local sporting goods stores, outlet centers, mass merchandisers, e-commerce retailers and, in some of our large and mid-size markets, national sporting goods superstores. In addition, we face competition from vendors that sell directly to
consumers.
Although we face competition from a variety of competitors, we
believe that our stores are able to compete effectively by providing a premium assortment of footwear, apparel, accessories and team sports equipment. Additionally, we differentiate our store experience through extensive product knowledge,
customer service and convenient locations. We believe we compete favorably with respect to these factors in the smaller markets predominantly in the South, Southwest, Mid-Atlantic and Midwest regions of the United States. See “Risk Factors.”
Our Trademarks
Our Company, by and through subsidiaries, is the owner or licensee of trademarks that are very important to our business. For the most
part, trademarks are valid as long as they are in use and/or their registrations are properly maintained. Registrations of trademarks can generally be renewed indefinitely as long as the trademarks are in use.
Following is a list of active trademarks registered and owned by the Company:
| · |
Hibbett Sports, Registration No. 2717584
|
| · |
Sports Additions, Registration No. 1767761
|
| · |
Hibbett, Registration No. 3275037
|
| · |
City G.E.A.R, Registration No. 4398655
|
| · |
City G.E.A.R., Registration No. 4413864
|
| · |
CITY GEAR, Registration No. 4675462
|
| · |
City GEAR, Registration No. 5008316
|
| · |
DEVEROES, Registration No. 3479737
|
| · |
GRINDHOUSE, Registration No. 5107399
|
| · |
GRINDHOUSE DENIM, Registration No. 5107398
|
Available Information
Our annual reports on Form 10-K, quarterly reports on Form 10-Q, current reports on Form 8-K and amendments to those reports filed or
furnished pursuant to Section 13(a) or 15(d) of the Securities Exchange Act of 1934 (Exchange Act) are available free of charge through our website www.hibbett.com, as
soon as reasonably practicable after such material is electronically filed with, or furnished to, the U.S. Securities and Exchange Commission (SEC). Our website is the primary source of publicly disclosed news about Hibbett Sports, Inc. In
addition to accessing copies of our reports online, you may request a copy of our Annual Report on Form 10-K for the fiscal year ended February 2, 2019, at no charge, by writing to: Investor Relations, Hibbett Sports, Inc., 2700 Milan Court,
Birmingham, Alabama 35211.
In addition, we make available, through our website, the Company’s Code of Business Conduct and Ethics, Corporate Governance Guidelines
and the written charters of the Audit Committee, Compensation Committee and Nominating and Corporate Governance Committee. Information contained on our website is not included as part of, or incorporated by reference into, this Annual Report.
You should carefully consider the following risks, as well as the other information contained in this report, before investing in shares
of our common stock. The occurrence of one or more of the circumstances or events described in this section could have a material adverse effect on our business, financial condition, results of operations, cash flows or on the trading prices of
our common stock. The risks and uncertainties described in this Annual Report on Form 10-K are not the only ones facing us. Additional risks and uncertainties not known to us at this time or that we currently believe are immaterial also may
adversely affect our business and operations.
Risks Related to Our Business and Industry
Integrating City Gear’s operations with ours may be more difficult, costly or time consuming than expected and the
anticipated benefits, synergies and cost savings of the acquisition may not be realized.
The success of the City Gear acquisition (Acquisition), including anticipated benefits, synergies and cost savings, will depend, in part,
on our ability to successfully combine and integrate the businesses and cultures of City Gear into our company. It is possible that the integration process will take longer than anticipated, and could result in the loss of key employees, higher
than expected costs, ongoing diversion of management attention, increased competition, the disruption of our ongoing business or inconsistencies in standards, controls, procedures and policies that adversely affect our ability to maintain
relationships with customers, vendors and employees. If we experience difficulties with the integration process, the anticipated benefits of the Acquisition may not be realized fully or at all, or may take longer to realize than expected. In
addition, the actual cost savings of the Acquisition could be less than anticipated.
If we lose any of our key vendors or any of our key vendors fail to supply us with quality brand name merchandise at
competitive prices, we may not be able to meet the demand of our customers and our net sales and profitability could decline.
We are a retailer of manufacturers’ branded items and are thereby dependent on the availability of key products and brands. Our top
three vendors accounted for approximately 80% of our total inventory purchases during Fiscal 2019. Our business is dependent upon close relationships with vendors and our ability to purchase brand name merchandise at competitive prices. As a
retailer, we cannot control the supply, design, function or cost of many of the products we offer for sale. Moreover, certain merchandise that is in high demand may be allocated by vendors based upon the vendors’ internal criteria, which is
beyond our control.
As a result, our sales could decline if we are not provided with a sufficient allocation of high demand merchandise from one or more of
our key vendors or if the vendor’s merchandise were to decline in quantity, quality or desirability to our customers. Our profits could decline if we are unable to pass along any increases in the cost of brand merchandise from our key vendors,
including costs resulting from higher tariffs or taxes on imported merchandise. In addition, many of our vendors provide us with return privileges, volume purchasing allowances and cooperative marketing such that any changes to such benefits
could have an adverse effect on our business.
We believe that we have long-standing and strong relationships with our vendors and that we have adequate sources of brand name
merchandise on competitive terms. However, the loss or decline of key vendor support could have a material adverse effect on our business, financial condition and results of operations. There can be no assurances that we will be able to acquire
such merchandise at competitive prices or on competitive terms in the future.
We also rely on services and products from non-merchandise vendors. A disruption in these services or products due to the financial
condition or inefficient operations of these vendors could adversely affect our business operations.
If we are unable to identify and capitalize on retail trends or provide an omni-channel experience for our customers
that is comparable to our competitors, we may not be able to compete effectively, and our sales and profitability may be adversely affected.
Competition in the e-commerce market continues to intensify as the Internet continues to facilitate competitive entry into the market and
comparison shopping by consumers. As a result, a growing portion of total consumer expenditures with retailers is occurring through digital platforms rather than traditional retail stores as consumers increasingly embrace shopping online and
through mobile commerce applications. Our future success could be materially and adversely affected if we are unable to identify and capitalize on retail trends, including technology, e-commerce and other process efficiencies, to gain market
share and better service our customers, or if we are unable to provide an omni-channel experience for our customers that is comparable to our competitors.
In Fiscal 2018, we successfully launched our omni-channel platform, which integrated digital commerce with our stores to provide a
seamless experience for our customers. In Fiscal 2019, we launched our new mobile app, Buy Online Pickup in Store (BOPIS) and Reserve Online Pickup in Store (ROPIS) which complements our e-commerce site and provides our customers with customized
advanced features and shopping experiences. We cannot give any assurances that our omni-channel platform, including our mobile app, BOPIS and ROPIS, will perform in a manner that will give us the ability to attract and retain customers, increase
sales and successfully compete with other online retailers. If we do not successfully provide a relevant and up-to-date digital experience or cannot attract online buyers through our omni-channel platform, our sales and profitability could be
adversely affected.
We are increasing the use of social media as a means of interacting and enhancing the shopping experiences of our customers. If we are
unable to attract and retain team members or contract third parties with the specialized skills to support our omni-channel platform or are unable to implement improvements to our customer-facing technology in a timely manner, our ability to
compete and our results of operations could be adversely affected. In addition, if our websites and our other customer-facing technology systems do not function as designed, the customer experience could be negatively affected, resulting in a
loss of customer confidence and satisfaction, as well as lost sales, which could adversely affect our reputation and results of operations.
Our inability or failure to recognize, respond to and effectively manage the accelerated impact of social media
could adversely impact our business.
In recent years, there has been a marked increase in the use of social media platforms, including blogs, chat platforms, social media
websites, and other forms of internet-based communications that allow individuals access to a broad audience of consumers and other persons. The rising popularity of social media and other consumer-oriented technologies has increased the speed
and accessibility of information dissemination. The dissemination of negative information via social media could harm our business, brand, reputation, marketing partners, financial condition, and results of operations, regardless of the
information’s accuracy.
In addition, we frequently use social media to communicate with consumers and the public in general. Failure to use social media
effectively could lead to a decline in brand value and revenue. Other risks associated with the use of social media include improper disclosure of proprietary information, negative comments about our brand, exposure of personally identifiable
information, fraud, hoaxes or malicious dissemination of false information.
Pressure from our competitors may force us to reduce our prices or increase our spending on marketing and promotion,
which could lower our net sales, gross profit and operating income.
The business in which we are engaged is a highly competitive and evolving market. The marketplace for athletic specialty merchandise is highly fragmented as many different brick and mortar and online retailers compete for market share by utilizing a variety of formats and merchandising strategies. We compete
with e-commerce retailers, traditional shoe stores, department and discount stores, national sporting goods superstores, specialty sporting goods shops, local sporting goods stores, outlet centers and mass merchandisers. In addition, we face
competition from vendors that sell directly to consumers. Direct sales by vendors may adversely affect our market share and reduce our revenues.
Many of our competitors have greater financial, marketing and distribution resources than we do, which enable them to spend significantly
more on marketing and other initiatives. In addition, many of our competitors employ price discounting policies that, if intensified, may make it difficult for us to reach our sales goals without reducing our prices. Should our competitors
increase spending on marketing and other initiatives such as additional discounting, if our marketing funds decrease for any reason, or should our marketing, promotions or initiatives be less effective than our competitors, there could be a
material adverse effect on our results of operations and financial condition. As a result, we may also need to spend more on marketing, promotions and initiatives than we anticipate. Inadequate marketing that is less effective than our
competitors could inhibit our ability to maintain relevance in the market place and drive increased sales.
We cannot guarantee that we will continue to be able to compete successfully against existing or future competitors. Expansion into
markets served by our competitors, entry of new competitors or expansion of existing competitors into our markets could be detrimental to our business, financial condition and results of operations.
Our inability to identify and anticipate changes in consumer demands and preferences and our inability to respond to
such consumer demands in a timely manner could reduce our net sales or profitability.
Our products appeal to a broad range of consumers whose preferences cannot be predicted with certainty and are subject to rapid change.
Our success depends on our ability to identify product trends as well as to anticipate and respond to changing merchandise trends and consumer demand in a timely manner. We cannot assure you that we will be able to continue to offer assortments
of products that appeal to our customers or that we will satisfy changing consumer demands in the future. Accordingly, our business, financial condition and results of operations could be materially and adversely affected if:
| · |
we are unable to identify and respond to emerging trends, including shifts in the popularity of certain products;
|
| · |
we miscalculate either the market for the merchandise in our stores or our customers’ purchasing habits; or
|
| · |
consumer demand unexpectedly shifts away from athletic footwear or our more profitable apparel lines.
|
In addition, we may be faced with significant excess inventory of some products and missed opportunities for other products, which could
decrease our profitability.
We depend on key personnel, the loss of which may adversely affect our ability to run our business effectively and
our results of operations.
We benefit from the leadership and performance of our senior management team and other key employees. If we lose the services of any of
our principal executive officers or other skilled and experienced personnel, we may not be able to fully implement our business strategy or run our business effectively and operating results could suffer. The Compensation Committee of our Board
of Directors reviews, on a regular basis, a succession plan prepared by senior management that addresses the potential loss of key personnel positions. The goal of the succession plan is to have a contingency plan that minimizes disruptions in
the workplace until a suitable replacement can be found, but no assurance can be given that we will be able to retain existing or attract additional qualified personnel when needed.
On March 22, 2019, we announced the planned retirement of our Chief Executive Officer, Jeff Rosenthal. Although we expect him to remain
in his capacity as CEO until a successor is named and to assist in the leadership transition, he is currently under no binding agreement to do so. No assurance can be given that Mr. Rosenthal will remain through a satisfactory leadership
transition or that we will be successful in finding a suitable replacement in a timely manner.
Further, as our business grows, we will need to attract and retain additional qualified personnel in a timely manner and develop, train
and manage an increasing number of management-level sales associates and other employees. Competition for qualified employees could require us to pay higher wages and benefits to attract a sufficient number of qualified employees and increases in
the minimum wage or other employee benefit costs could increase our operating expense. An inability to attract and retain personnel as needed in the future could negatively impact our net sales growth and operating results.
Security threats, including physical and cyber-security threats, and unauthorized disclosure of sensitive or
confidential information could harm our business and reputation with our consumers.
The protection of Company, customer and employee data is critical to us. Through our sales, marketing activities and use of third-party
information, we collect and retain certain personally identifiable information that our customers provide to purchase products, enroll in promotional programs, register on our website, or otherwise communicate and interact with us. This may
include, but is not limited to, names, addresses, phone numbers, driver license numbers, e-mail addresses, contact preferences, personally identifiable information stored on electronic devices, and payment account information, including credit
and debit card information. We also gather and retain information about our employees in the normal course of business. Furthermore, our online operations depend upon the secure transmission of confidential information over public networks,
such as information permitting cashless payments.
We have security measures designed to protect against the misappropriation or corruption of our systems, intentional or unintentional
disclosure of confidential information or disruption of our operations. Our risk remediation procedures include an annual IT risk assessment based on the SANS Institute Critical Security Controls framework which prioritizes security functions
that are effective against the latest advanced targeted threats while emphasizing security controls that have demonstrated real world effectiveness. While we maintain insurance coverage that may, subject to policy terms and conditions, cover
certain aspects of our cyber risks, such insurance coverage may be insufficient to cover our losses or all types of claims that may arise in the continually evolving area of cyber risk.
Even so, these security measures may be compromised as a result of third-party breaches, burglaries, cyber-attacks, errors by employees
or employees of third-party vendors, faulty password management, misappropriation of data by employees, vendors or unaffiliated third-parties or other irregularity, and result in persons obtaining unauthorized access to our data or accounts.
Despite such safeguards for the protection of such information, we cannot be certain that all of our systems and those of our vendors and unaffiliated third-parties are entirely free from vulnerability to attack or compromise given that the
techniques used to obtain unauthorized access, disable or degrade service, or sabotage systems change frequently. During the normal course of our business, we have experienced and we expect to continue to experience attempts to breach our
systems, and we may be unable to protect sensitive data and the integrity of our systems or to prevent fraudulent purchases. Moreover, an alleged or actual security breach that affects our systems or results in the unauthorized release of
personally identifiable information could:
| · |
materially damage our reputation and negatively affect customer satisfaction and loyalty;
|
| · |
expose us to negative publicity, individual claims or consumer class actions, administrative, civil or criminal investigations or actions; and
|
| · |
cause us to incur substantial costs, including but not limited to, costs associated with remediation for stolen assets or information, litigation costs, lost revenues
resulting from unauthorized use of proprietary information or the failure to retain or attract customers following an attack, and increased cyber protection costs.
|
We plan to initiate a strategic realignment, which includes an accelerated store closure plan, that may not yield the
economic results expected.
As the retail environment continues to evolve, the Company is focused on improving the productivity of the store base while continuing to
grow its omni-channel business to serve customers where and when they want to shop. In an effort to adapt to changing shopping patterns, the Company has decided to initiate a strategic realignment that will include the closure of approximately
95 underperforming Hibbett stores in Fiscal 2020, while opening approximately 10 to 15 new Hibbett Sports and City Gear stores. We cannot guarantee that this strategic realignment will result in an economic benefit for the company. Our results
of operations could be adversely affected by the underperforming stores’ liquidation process through reduced gross margin rates and increased operating costs.
We rely heavily on information systems to conduct our business. Problems with our information systems could disrupt
our operations and negatively impact our financial results and materially adversely affect our business operations.
Our ability to manage and operate our business depends significantly on information technology systems. Specifically, we rely on our
information systems to effectively manage our sales, logistics, merchandise planning and replenishment, to process financial information and sales transactions and to optimize our overall inventory levels. We could experience adverse events
relating to our information systems, including, among other things, system failures, problems with integrating various data sources, challenges in transitioning to upgraded or replacement systems or difficulty in integrating new systems.
Although we attempt to mitigate the risk of possible business interruptions through change control protocols and a disaster recovery plan, which includes storing critical business information off-site, the failure of these systems to operate
effectively and support growth and expansion could materially adversely impact the operation of our business.
Most of our information system infrastructure is centrally located, and we rely on third-party service providers for certain system
applications that are hosted remotely or in cloud-based applications. There is a risk that we may not have adequately addressed risks associated with using third-party providers or cloud-based applications. Such risks include security issues
such as adequate encryption and intrusion detection; user access control; data separation; the impact of technical problems such as server outages; their disaster recovery capabilities; and exit strategies. A service provider disruption or
failure in any of these areas could have a material adverse effect on our business.
Integration of technology and systems related to the acquired City Gear business could be more difficult or costlier than anticipated.
In addition, insufficient investment in technology, inadequate preventive maintenance, investment in the wrong technology, delayed
replacement of obsolete equipment, shifts in technology, the failure to attract and retain highly-qualified IT personnel and inadequate policies to identify our technology needs could have a material adverse effect on our business.
Our failure to effectively manage our real estate portfolio may negatively impact our operating results.
Effective management of our real estate portfolio is critical to our omni-channel strategy. All of our stores are subject to leases and,
as such, it is essential that we effectively evaluate a range of considerations that may influence the success of our long-term real estate strategy. Such considerations include but are not limited to:
| · |
changing patterns of customer behavior from physical store locations to online shopping in the context of an evolving omni-channel retail environment;
|
| · |
the appropriate number of stores in our portfolio;
|
| · |
the formats, sizes and interior layouts of our stores;
|
| · |
the locations of our stores, including the demographics and economic data of each store;
|
| · |
the local competition in and around our stores;
|
| · |
the primary lease term of each store and occupancy cost of each store relative to market rents; and
|
| · |
distribution considerations for each store location.
|
If we fail to effectively evaluate these factors or negotiate appropriate terms or if unforeseen changes arise, the consequences could
include, for example:
| · |
having to close stores and abandon the related assets while retaining the financial commitments of the leases;
|
| · |
incurring costs to remodel or transform our stores;
|
| · |
having stores or distribution channels that no longer meet the needs of our business; and
|
| · |
bearing excessive lease or occupancy expenses.
|
These consequences could have a materially adverse impact on our profitability, cash flows and liquidity. The financial impact of
exiting a leased location can vary greatly depending on, among other factors, the terms of the lease, the condition of the local real estate market, demand for the specific property and our relationship with the landlord. It is difficult for us
to influence some of these factors, and the costs of exiting a property can be significant. In addition to rent, we could still be responsible for the maintenance, taxes, insurance and common area maintenance charges for vacant properties until
the lease commitment expires or is terminated.
Our success depends substantially on the value and perception of the brand name merchandise we sell.
Our success is largely dependent on our consumers’ perception and connection to the brand names we carry, such as Nike, Under Armour,
Reebok, adidas, Easton, The North Face, etc. Brand value is based in part on our consumer’s perception on a variety of subjective qualities so that even an isolated incident could erode brand value and consumer trust, particularly if there is
considerable publicity or litigation. Consumer demand for our products or brands could diminish significantly in the event of erosion of consumer confidence or trust, resulting in lower sales which could have a material adverse effect on our
business, financial condition and results of operations.
We would be materially and adversely affected if all or a significant portion of our primary wholesale and logistics
facility were shut down.
Our primary wholesale and logistics facility is located in Alabaster, Alabama, a suburb of Birmingham, where we receive and ship a
significant portion of our merchandise. Any natural disaster or other serious disruption to this facility would damage a portion of our inventory and could impair our ability to adequately stock our stores and process returns of products to
vendors and could adversely affect our net sales and profitability. In addition, we could incur significantly higher costs and longer lead times associated with shipping our products to our stores during the time it takes for us to reopen or
replace the facility.
Further, because we rely heavily on our primary wholesale and logistics facility, our growth could be limited if the facility reaches
full capacity. Such restraint could result in a loss of market share and our inability to execute our business strategy and could have a material adverse effect on our business, financial condition and operating results.
A disruption in the flow of imported merchandise or an increase in the cost of those goods could significantly
decrease our net sales and operating income.
Many of our largest vendors source a majority of their products from foreign countries. Imported goods are generally less expensive than
domestic goods and contribute significantly to our favorable profit margins. Our ability to provide quality imported merchandise on a profitable basis may be subject to political and economic factors and influences that we cannot control.
National or international events, including changes in government trade or other policies, could increase our merchandise costs and other costs that are critical to our operations. If imported merchandise becomes more expensive, we may find it
difficult to pass the increase on to customers. If imported merchandise becomes unavailable, the transition to alternative sources by our vendors may not occur in time to meet our demands or the demands of our customers. Products from
alternative sources may also be more expensive or may be of lesser quality than those our vendors currently import. Risks associated with reliance on imported goods include:
| · |
increases in the cost of purchasing or shipping foreign merchandise resulting from, for example:
|
| · |
import tariffs, taxes or other governmental actions affecting trade, including the United States imposing antidumping or countervailing duty orders, safeguards, remedies
or compensation and retaliation due to illegal foreign trade practices;
|
| · |
foreign government regulations;
|
| · |
rising commodity prices;
|
| · |
increased costs of oceanic shipping;
|
| · |
changes in currency exchange rates or policies and local economic conditions; and
|
| · |
trade restrictions, including import quotas or loss of “most favored nation” status with the United States.
|
| · |
disruptions in the flow of imported goods because of factors such as:
|
| · |
raw material shortages, work stoppages, labor availability and political unrest;
|
| · |
problems with oceanic shipping, including blockages or labor union strikes at U.S. or foreign ports; and
|
| · |
economic crises and international disputes.
|
In addition, to the extent that any foreign manufacturer from whom our vendors are associated may directly or indirectly utilize labor
practices that are not commonly accepted in the United States, we could be affected by any resulting negative publicity.
Disruptions in the economy and in financial markets could adversely affect consumer purchases of discretionary items,
which could reduce our net sales.
In general, our sales represent discretionary spending by our customers. Discretionary spending is affected by many factors that are
outside our control, including, among others, general business conditions, interest rates, inflation, household income, consumer debt levels, the availability of consumer credit, tax rates and tax refunds, sales tax holidays, energy prices,
unemployment trends, home values and other matters that influence consumer confidence and spending. Disruptions in the U.S. economy, financial markets or other economic conditions affecting disposable consumer income may adversely affect our
business. A reduction in customer traffic to our stores or a shift in customer spending to products other than those sold by us or to products sold by us that are less profitable could result in lower net sales, decreases in inventory turnover
or a reduction in profitability due to lower margins.
Increases in transportation or shipping costs, climate change regulation and other factors may negatively impact our
results of operations.
We rely upon various means of transportation, including ship and truck, to deliver products to our primary wholesale and logistics
facility, our stores and our customers. Consequently, our results can vary depending upon the price of fuel. The price of oil has fluctuated significantly over the last few years. In addition, governmental efforts to combat climate change
through reduction of greenhouse gases may result in higher fuel costs through taxation or other means. Any increases in fuel costs would increase our transportation costs.
In addition, general labor shortages or strikes in the transportation or shipping industries could negatively affect transportation and
shipping costs and our ability to supply our stores in a timely manner. We also rely on efficient and effective operations within our primary wholesale and logistics facility to ensure accurate product delivery to our stores. Failure to
maintain such operations could adversely affect net sales.
We may face difficulties in meeting our labor needs to effectively operate our business.
We are heavily dependent upon our labor workforce in the geographic areas where we conduct our business. Our compensation packages are
designed to provide benefits commensurate with our level of expected service. However, within our retail and logistics operations, we face the challenge of filling many positions at wage scales that are appropriate to the industry and
competitive factors. In addition, there is the risk that prevailing wage rates for our labor workforce will increase in the future and that the costs of employee benefits will rise, resulting in increased expenses that could adversely affect our
profitability. We also face other risks in meeting our labor needs, including competition for qualified personnel and overall unemployment levels. Changes in any of these factors, including a shortage of available workforce in areas in which
we operate, could interfere with our ability to adequately service our customers or to open suitable locations and could result in increasing labor costs.
Our operating results are subject to seasonal and quarterly fluctuations. Furthermore, our quarterly operating
results, including comparable store net sales, will fluctuate and may not be a meaningful indicator of future performance.
We experience seasonal fluctuations in our net sales and results of operations. We typically experience higher net sales in early spring
due to spring sports and annual tax refunds, late summer due to back-to-school shopping and winter due to holiday shopping. In addition, our quarterly results of operations may fluctuate significantly as a result of a variety of factors,
including the timing of new store openings, the amount and timing of net sales contributed by new stores, weather fluctuations, merchandise mix, demand for merchandise driven by local interest in sporting events, and the timing of sales tax
holidays and annual tax refunds. Any of these events, particularly in the fourth quarter, could have a material adverse effect on our business, financial condition and operating results for the entire fiscal year.
Comparable store net sales vary from quarter to quarter, and an unanticipated decline in comparable store net sales may cause the price
of our common stock to fluctuate significantly. Factors which could affect our comparable store net sales results include:
| · |
shifts in consumer tastes and fashion trends;
|
| · |
calendar shifts of holiday or seasonal periods;
|
| · |
the timing of income tax refunds to customers;
|
| · |
increases in personal income taxes paid by our customers;
|
| · |
calendar shifts or cancellations of sales tax-free holidays in certain states;
|
| · |
the success or failure of college and professional sports teams within our core regions;
|
| · |
changes in or lack of tenants in the shopping centers in which we are located;
|
| · |
pricing, promotions or other actions taken by us or our existing or possible new competitors; and
|
| · |
unseasonable weather conditions or natural disasters.
|
We cannot assure you that comparable store net sales will increase at the rates achieved in prior periods or that rates will not decline.
We are subject to regional risks due to our stores within the South, Southwest, Mid-Atlantic and Midwest regions of
the United States.
Our stores are heavily concentrated in certain regions of the United States. We are subject to regional risks, such as the regional
economy, weather conditions and natural disasters, increasing costs of electricity, oil and natural gas, as well as government regulations specific in the states and localities within which we operate. In addition, falling oil prices may
adversely affect employment and consumer spending in those states that are within our regions that rely on oil revenues as a significant part of the economies of those states. We sell a significant amount of merchandise that can be adversely
affected by significant weather events that postpone the start of or shorten sports seasons or that limit participation of fans and sports enthusiasts.
Unforeseen events, including public health issues and natural disasters such as earthquakes, hurricanes, tornados, snow or ice storms,
floods and heavy rains could disrupt our operations or the operations of our suppliers; significantly damage or destroy our retail locations; prohibit consumers from traveling to our retail locations; or prevent us from resupplying our stores or
wholesale and logistics facility. We believe that we take reasonable precautions to prepare for such events; however, our precautions may not be adequate to deal with such events in the future. If such events occur in areas in which we have our
wholesale and logistics facility or a concentration of retail stores, or if they occur during peak shopping seasons, it could have a material adverse effect on our business, financial condition and results of operations.
We sell a significant amount of licensed team sports merchandise, the sale of which may be subject to fluctuations based on the success
or failure of such teams. The poor performance by college and professional sports teams within our core regions of operations, as well as professional team lockouts, could cause our financial results to fluctuate year over year.
Risks Related to Our Capital Structure
We manage cash and cash equivalents beyond federally insured limits per financial institution and purchase
investments not fully guaranteed by the Federal Deposit Insurance Corporation (FDIC), subjecting us to investment and credit availability risks.
We manage cash and cash equivalents in various institutions at levels beyond federally insured limits per institution, and we purchase
investments not guaranteed by the FDIC. Accordingly, there is a risk that we will not recover the full principal of our investments or that their liquidity may be diminished. In an attempt to mitigate this risk, our investment policy emphasizes
preservation of principal and liquidity. We cannot be assured that we will not experience losses on our deposits or investments.
Our indebtedness could adversely affect our financial condition, limit our ability to obtain additional financing,
restrict our operations and make us more vulnerable to economic downturns and competitive pressures. In addition, we face risk that financial institutions may fail to fulfill commitments under our credit facilities.
In connection with the acquisition of City Gear, we expanded our two credit facilities from $30 million each to $50 million each and
substantially increased our indebtedness, which could adversely affect our ability to fulfill our obligations and have a negative impact on our financing options and liquidity position. As of February 2, 2019, our indebtedness under our
facilities was $35 million. This level of debt could have the following impacts:
| · |
limit our ability to obtain additional financing in the future for working capital, capital expenditures, acquisitions or other general corporate purposes;
|
| · |
require a substantial portion of our cash flows to be dedicated to debt service payments, instead of other purposes, thereby reducing the amount of cash flows available
for working capital, capital expenditures, acquisition or other general corporate purposes;
|
| · |
limit our ability to refinance our indebtedness on terms acceptable to us or at all;
|
| · |
place us at a competitive disadvantage to competitors carrying less debt or limit our ability to withstand competitive pressure; and
|
| · |
make us more vulnerable to economic downturns and interest rate increases.
|
In addition, our financial institutions are committed to providing loans under our credit facilities. There is a risk that these
institutions cannot deliver against these obligations in a timely matter, or at all. If the financial institutions that provide these credit facilities were to default on their obligation to fund the commitments, these facilities would not be
available to us, which could adversely affect our liquidity and financial condition. For discussion of our credit facilities, see “Liquidity and Capital Resources” in Item 7 and Note 6 to our consolidated financial statements.
Risks Related to Ownership of Our Common Stock.
The market price of our common stock, like the stock market in general, is likely to be highly volatile. Factors that could cause
fluctuation in our common stock price may include, among other things:
| · |
actual or anticipated variations in quarterly operating results;
|
| · |
changes in financial estimates by investment analysts and our inability to meet or exceed those estimates;
|
| · |
additions or departures of key personnel;
|
| · |
market rumors or announcements by us or by our competitors of significant acquisitions, divestitures or joint ventures, strategic partnerships, large capital commitments
or other strategic initiatives;
|
| · |
changes in retail sales data that indicate consumers may spend less on discretionary purchases; and
|
| · |
sales of our common stock by key personnel or large institutional holders.
|
Many of these factors are beyond our control and may cause the market price of our common stock to decline, regardless of our operating
performance.
Significant stockholders or potential stockholders may attempt to effect changes or acquire control over our company,
which could adversely affect our results of operations and financial condition.
Stockholders may from time to time attempt to effect changes, engage in proxy solicitations or advance stockholder proposals. Responding
to proxy contests and other actions by activist stockholders can be costly and time-consuming, disrupting our operations and diverting the attention of our Board of Directors and senior management from the daily operations of our business or
pursuing our business strategies. As a result, activist stockholder campaigns could adversely affect our results of operations and financial condition, and the perceived uncertainty as to our future direction resulting from activist strategies
could also affect the market price and volatility of the Company’s common stock.
There can be no assurance that we will continue to repurchase our common stock or that we will repurchase our common
stock at favorable prices.
In November 2018, our Board of Directors authorized the continuation of our existing stock repurchase program (Program) until January 29,
2022 under which we may purchase up to $300.0 million of our outstanding common stock. The purchases may be made from time to time in the open market (including, without limitation, the use of Rule 10b5-1 plans), depending on a number of
factors, including our evaluation of general market and economic conditions and the trading price of our common stock. The Program may be extended, modified, suspended or discontinued at any time. We expect to fund the Program with existing
cash on hand, cash generated from operations, and/or borrowings under our credit facilities. A reduction in, or the completion or expiration of, our Program could have a negative effect on our stock price. We can provide no assurance that we
will repurchase our common stock at favorable prices, or at all.
Risks Related to Governance, Regulatory, Legislative and Legal Matters.
Provisions in our charter documents and Delaware law might deter acquisition bids for us.
Certain provisions of our certificate of incorporation and bylaws may be deemed to have anti-takeover effects and may discourage, delay
or prevent a takeover attempt that a stockholder might consider in its best interest. These provisions, among other things:
| · |
classify our Board of Directors into three classes, each of which serves for different three-year periods;
|
| · |
provide that a director may be removed by stockholders only for cause by a vote of the holders of not less than two-thirds of our shares entitled to vote;
|
| · |
provide that all vacancies on our Board of Directors, including any vacancies resulting from an increase in the number of directors, may be filled by a majority of the
remaining directors, even if the number is less than a quorum;
|
| · |
provide that special meetings of the common stockholders may only be called by the Board of Directors, the Chairman of the Board of Directors or upon the demand of the
holders of a majority of the total voting power of all outstanding securities of the Company entitled to vote at any such special meeting; and
|
| · |
call for a vote of the holders of not less than two-thirds of the shares entitled to vote in order to amend the foregoing provisions and certain other provisions of our
certificate of incorporation and bylaws.
|
In addition, our Board of Directors, without further action of the stockholders, is permitted to issue and fix the terms of preferred
stock, which may have rights senior to those of common stock. We are also subject to the Delaware business combination statute, which may render a change in control of us more difficult. Section 203 of the Delaware General Corporation Laws
would be expected to have an anti-takeover effect with respect to transactions not approved in advance by the Board of Directors, including discouraging takeover attempts that might result in a premium over the market price for the shares of
common stock held by stockholders.
Changes in federal, state or local laws, or our failure to comply with such laws, could increase our expenses and
expose us to legal risks.
Our Company is subject to numerous laws and regulatory matters relating to the conduct of our business. In addition, certain
jurisdictions have taken a particularly aggressive stance with respect to certain matters and have stepped up enforcement, including fines and other sanctions. Such laws and regulatory matters include:
| · |
The California Consumer Privacy Act (CCPA) and other emerging privacy laws;
|
| · |
The Telephone Consumer Protection Act (TCPA) provisions that regulate telemarketing, auto-dialed and pre-recorded calls as well as text messages and unsolicited faxes;
|
| · |
Labor and employment laws that govern employment matters such as minimum wage, exempt employment status, overtime, family leave mandates and workplace safety regulations,
including the Fair Labor Standards Act proposed rules;
|
| · |
Securities and exchange laws and regulations;
|
| · |
New or changing laws relating to cybersecurity, privacy, cashless payments and consumer credit, protection and fraud;
|
| · |
New or changing laws and regulations concerning product safety or truth in advertising;
|
| · |
The Americans with Disabilities Act and similar state laws that give civil rights protections to individuals with disabilities in the context of employment, public
accommodations and other areas;
|
| · |
New or changing federal and state immigration laws and regulations;
|
| · |
The Patient Protection and Affordable Care Act provisions;
|
| · |
New or changing environmental regulations, including measures related to climate change and greenhouse gas emissions; and
|
| · |
New or changing laws relating to state and local taxation and licensing, including sales and use tax laws, withholding taxes and property taxes.;
|
Our operations will continue to be subject to federal, state and local governmental regulation. Uncertainty with respect to the U.S.
presidential administration and Congress and potential changes that may be made in laws, regulations and policies could exacerbate the risks above. Changes in domestic policy, including significant changes in tax, trade, healthcare and other
laws and regulations could affect our operations. For example, tax proposals may include changes, which could, if implemented, have an adverse or a beneficial impact on our operations, including a “border adjustment tax” or new import tariffs,
which could adversely affect us because we sell imported products. Proposals to modify or repeal the Patient Protection and Affordable Care Act, if implemented, may also affect us. Unknown matters, new laws and regulations or stricter
interpretations of existing laws or regulations may affect our business or operations in the future and could lead to government enforcement and resulting litigation by private litigants. Increasing regulations could expose us to a challenging
enforcement environment or to third-party liability (such as monetary recoveries and recoveries of attorney’s fees) and could have a material adverse effect on our business and results of operations.
Our corporate legal department monitors regulatory activity and is active in notifying and updating applicable departments and personnel
on pertinent matters and legislation. Our Human Resources (HR) Department leads compliance training programs to ensure our field managers are kept abreast of HR-related regulatory activity that affects their areas of responsibility. We believe
that we are in substantial compliance with applicable environmental and other laws and regulations, and although no assurances can be given, we do not foresee the need for any significant expenditures in this area in the near future.
Changes in privacy laws could adversely affect our
ability to market our products effectively.
We rely on a variety of direct marketing techniques, including email, text messages and postal mailings. Any new or emerging
restrictions in federal or state laws regarding marketing and solicitation or data protection laws that govern these activities could adversely affect the continuing effectiveness of email, text messages and postal mailing techniques and could
force changes in our marketing strategies. If this occurs, we may need to develop alternative marketing strategies, which may not be as effective and could impact the amount and timing of our revenues. Further, any new or emerging privacy laws
could include onerous and expensive compliance obligations regarding consent, retention, deletion, and anti-discrimination that could lead to regulatory actions or litigation, and potentially fines and damages for non-compliance.
Litigation may adversely affect our business, financial condition and results of operations.
Our business is subject to the risk of litigation by employees, consumers, suppliers, competitors, stockholders, government agencies or
others through private actions, class actions, administrative proceedings, regulatory actions or other litigation. The outcome of litigation, particularly class action lawsuits and regulatory actions, is difficult to assess or quantify. We may
incur losses relating to these claims, and in addition, these proceedings could cause us to incur costs and may require us to devote resources to defend against these claims that could adversely affect our results of operations. For a
description of current legal proceedings, see “Part I, Item 3, Legal Proceedings.”
Product liability claims or product recalls can adversely affect our business reputation, expose us to lawsuits or
increased scrutiny by federal and state regulators and may not be fully covered by insurance.
We sell products, particularly athletic equipment, which entails an inherent risk of product liability and product recall and the
resultant adverse publicity. We may be subject to significant claims if the purchase of a defective product from any of our stores causes injury or death. Our merchandise could be subject to a product recall which could reflect negatively on our
business reputation. We cannot be assured that product liability claims will not be asserted against us in the future. Any claims made may create adverse publicity that would have a material adverse effect on our business, reputation, financial
condition and results of operations.
We and our vendors maintain insurance with respect to certain of these risks, including product liability insurance and general liability
insurance, but in many cases such insurance is expensive, difficult to obtain and no assurance can be given that such insurance can be maintained in the future on acceptable terms, or in sufficient amounts to protect us against losses due to any
such events, or at all. Moreover, even though our insurance coverage may be designed to protect us from losses attributable to certain events, it may not adequately protect us from liability and expenses we incur in connection with such events.
We cannot be assured that we will not experience pressure from labor unions or become the target of labor union
campaigns.
While we believe we maintain good relations with our employees, we cannot provide any assurances that we will not experience pressure
from labor unions or become the target of labor union campaigns. The potential for unionization could increase in the United States if federal legislation or regulatory changes are adopted that would facilitate labor organization. Significant
union representation would require us to negotiate wages, salaries, benefits and other terms with many of our employees collectively and could adversely affect our results of operations by increasing our labor costs or otherwise restricting our
ability to maximize the efficiency of our operations.
Changes in rules related to accounting for income taxes, changes in tax laws in any of the jurisdictions in which we
operate or adverse outcomes from audits by taxing authorities could result in an unfavorable change in our effective tax rate.
We operate our business in numerous tax jurisdictions. As a result, our effective tax rate is derived from a combination of the federal
rate and applicable tax rates in the various states in which we operate. Our effective tax rate may be lower or higher than our tax rates have been in the past due to numerous factors, including the sources of our income and the tax filing
positions we take. We base our estimate of an effective tax rate at any given point in time upon a calculated mix of the tax rates applicable to our Company and on estimates of the amount of business likely to be done in any given jurisdiction.
Changes in rules related to accounting for income taxes, changes in tax laws in any of the jurisdictions in which we operate, expiration of tax credits formerly available, failure to manage and utilize available tax credits, or adverse outcomes
from tax audits that we may be subject to in any of the jurisdictions in which we operate could result in an unfavorable change in our effective tax rate.
None.
We own our corporate office building in Birmingham, Alabama and our wholesale and logistics facility in Alabaster, Alabama. In addition,
we lease administrative offices in Memphis, Tennessee and lease all our existing 1,163 store locations and expect that our policy of leasing rather than owning will continue as we continue to expand. Our leases typically provide for terms of
five to ten years with options on our part to extend. Most leases also contain a kick-out clause if projected sales levels are not met and an early termination/remedy option if co-tenancy and exclusivity provisions are violated. We believe this
leasing strategy enhances our flexibility to pursue various expansion opportunities resulting from changing market conditions and to periodically re‑evaluate store locations. See “Risk
Factors.”
As current leases expire, we believe we will either be able to obtain lease renewals for present store locations or to obtain leases for
equivalent or better locations in the same general area. We believe our wholesale and logistics facility is suitable and adequate to support our operations for many years. See “Risk
Factors.”
Store Locations
As of February 2, 2019, we operated 1,163 stores in 35 contiguous states. Of these stores, 254 are in enclosed malls, 33 are
free-standing and 876 are in strip-shopping centers, which are frequently near a major chain retailer such as Wal-Mart. The following shows the number of locations by state as of February 2, 2019:
|
Alabama
|
105
|
Kentucky
|
58
|
Oklahoma
|
40
|
||
|
Arkansas
|
42
|
Louisiana
|
67
|
Pennsylvania
|
6
|
||
|
Arizona
|
8
|
Maryland
|
5
|
South Carolina
|
41
|
||
|
California
|
12
|
Minnesota
|
1
|
South Dakota
|
3
|
||
|
Colorado
|
6
|
Mississippi
|
74
|
Tennessee
|
78
|
||
|
Delaware
|
1
|
Missouri
|
39
|
Texas
|
123
|
||
|
Florida
|
64
|
Nebraska
|
9
|
Utah
|
4
|
||
|
Georgia
|
122
|
New Jersey
|
3
|
Virginia
|
22
|
||
|
Illinois
|
30
|
New Mexico
|
15
|
West Virginia
|
10
|
||
|
Indiana
|
26
|
New York
|
4
|
Wisconsin
|
4
|
||
|
Iowa
|
17
|
North Carolina
|
60
|
Wyoming
|
2
|
||
|
Kansas
|
26
|
Ohio
|
36
|
TOTAL
|
1,163
|
As of April 2, 2019, we operated 1,149 stores in 35 states.
We are a party to various legal proceedings incidental to our business. Where we are able to reasonably estimate an amount of probable
loss in these matters based on known facts, we have accrued that amount as a current liability on our balance sheet. We are not able to reasonably estimate the possible loss or range of loss in excess of the amount accrued for these proceedings
based on the information currently available to us, including, among others, (i) uncertainties as to the outcome of pending proceedings (including motions and appeals) and (ii) uncertainties as to the likelihood of settlement and the outcome of
any negotiations with respect thereto. We do not believe that any of these matters will, individually or in the aggregate, have a material effect on our business or financial condition. We cannot give assurance, however, that one or more of
these proceedings will not have a material effect on our results of operations for the period in which they are resolved. At February 2, 2019 and February 3, 2018, we estimated that the liability related to these matters was approximately $0.7
million and $0.5 million, respectively, and accordingly, we accrued $0.7 million and $0.5 million, respectively, as a current liability in our consolidated balance sheets.
The estimates of our liability for pending and unasserted potential claims do not include litigation costs. It is our policy to accrue
legal fees when it is probable that we will have to defend against known claims or allegations and we can reasonably estimate the amount of the anticipated expense.
From time to time, we enter into certain types of agreements that require us to indemnify parties against third-party claims under
certain circumstances. Generally, these agreements relate to: (a) agreements with vendors and suppliers under which we may provide customary indemnification to our vendors and suppliers in respect to actions they take at our request or otherwise
on our behalf; (b) agreements to indemnify vendors against trademark and copyright infringement claims concerning merchandise manufactured specifically for or on behalf of the Company; (c) real estate leases, under which we may agree to indemnify
the lessors from claims arising from our use of the property; and (d) agreements with our directors, officers and employees, under which we may agree to indemnify such persons for liabilities arising out of their relationship with us. We have
director and officer liability insurance, which, subject to the policy’s conditions, provides coverage for indemnification amounts payable by us with respect to our directors and officers up to specified limits and subject to certain deductibles.
If we believe that a loss is both probable and estimable for a particular matter, the loss is accrued in accordance with the requirements
of ASC Topic 450, Contingencies. With respect to any matter, we could change our belief as to whether a loss is probable or estimable, or its estimate of
loss, at any time.
None.
Our common stock is traded on the NASDAQ Global Select Market under the symbol HIBB. As of April 2, 2019, we had 11 stockholders of
record.
The graph below compares the cumulative five-year total shareholder return on our common stock with the cumulative total returns of the
NASDAQ Composite index and the NASDAQ Retail Trade index. The graph tracks the five-year performance of a $100 investment in our common stock and in each index (with the reinvestment of all dividends) on January 31, 2014.
COMPARISON OF 5 YEAR CUMULATIVE TOTAL RETURN*
Among Hibbett Sports, Inc., the NASDAQ Composite Index
and the NASDAQ Retail Trade Index
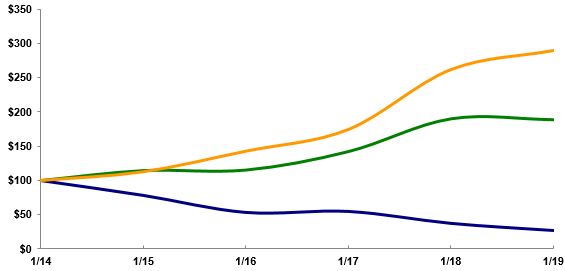
 |
 |
 |
 |
 |
 |
| *$100 invested on 1/31/14 in stock or index, including reinvestment of dividends. | |
|
|
Fiscal year ending January 31.
|
|
1/14
|
1/15
|
1/16
|
1/17
|
1/18
|
1/19
|
|
|
Hibbett Sports, Inc.
|
100.00
|
78.39
|
53.59
|
54.99
|
37.66
|
27.23
|
|
NASDAQ Composite
|
100.00
|
114.30
|
115.10
|
141.84
|
189.26
|
187.97
|
|
NASDAQ Retail Trade
|
100.00
|
112.78
|
142.83
|
174.47
|
261.97
|
289.77
|
The stock price performance included in this graph is not necessarily indicative of future stock price performance.
Dividend Policy
We have never declared or paid any dividends on our common stock. We currently intend to retain our future earnings to finance the
growth and development of our business and for our stock repurchase program, and therefore do not anticipate declaring or paying cash dividends on our common stock for the foreseeable future. Any future decision to declare or pay dividends will
be at the discretion of our Board of Directors and will be dependent upon our financial condition, results of operations, capital requirements and such other factors as our Board of Directors deems relevant.
Equity Compensation Plans
For information on securities authorized for issuance under our equity compensation plans, see “Part III, Item 12, Security
Ownership of Certain Beneficial Owners and Management and Related Stockholder Matters.”
Issuer Repurchases of Equity Securities
The following table presents our stock repurchase activity for the thirteen weeks ended February 2, 2019 (1):
|
Period
|
Total Number
of Shares
Purchased
|
Average
Price per
Share
|
Total Number of
Shares
Purchased as
Part of Publicly
Announced
Programs
|
Approximate Dollar
Value of Shares that
may yet be
Purchased Under the
Programs (in
thousands)
|
||||||||||||
|
November 4, 2018 to December 1, 2018
|
3,900
|
$
|
16.87
|
3,900
|
$
|
188,000
|
||||||||||
|
December 2, 2018 to January 5, 2019
|
-
|
-
|
$
|
188,000
|
||||||||||||
|
January 6, 2019 to February 2, 2019
|
-
|
-
|
$
|
188,000
|
||||||||||||
|
Total
|
3,900
|
$
|
16.87
|
3,900
|
$
|
188,000
|
||||||||||
(1) In November 2018, our Board authorized the continuation of our existing 2015 Stock Repurchase Program (Program) until January 29,
2022 (Fiscal 2022). The 2015 Program had been scheduled to expire on February 2, 2019. See Part II, Item 8. Consolidated Financial Statements Note 1, “Stock Repurchase Program.”
The following selected consolidated financial data has been derived from the consolidated financial statements of the Company. The
data set forth below should be read in conjunction with “Management’s Discussion and Analysis of Financial Condition and Results of Operations” and our “Consolidated Financial Statements and Supplementary Data” and “Notes to Consolidated Financial Statements” thereto.
|
(In thousands, except per share amounts)
|
||||||||||||||||||||
|
Fiscal Year Ended
|
||||||||||||||||||||
|
February 2,
2019
(52 weeks)
|
February 3,
2018
(53 weeks)
|
January 28,
2017
(52 weeks)
|
January 30,
2016
(52 weeks)
|
January 31,
2015
(52 weeks)
|
||||||||||||||||
|
Statement
of Operations Data:
|
||||||||||||||||||||
|
Net sales
|
$
|
1,008,682
|
$
|
968,219
|
$
|
972,960
|
$
|
943,104
|
$
|
913,486
|
||||||||||
|
Cost of goods sold
|
679,947
|
655,502
|
634,364
|
610,389
|
586,702
|
|||||||||||||||
|
Gross margin
|
328,735
|
312,717
|
338,596
|
332,715
|
326,784
|
|||||||||||||||
|
Store operating, selling and administrative expenses
|
264,142
|
231,832
|
222,785
|
203,673
|
192,648
|
|||||||||||||||
|
Depreciation and amortization
|
27,052
|
24,207
|
19,047
|
17,038
|
15,990
|
|||||||||||||||
|
Operating income
|
37,541
|
56,678
|
96,764
|
112,004
|
118,146
|
|||||||||||||||
|
Interest (income) expense, net
|
(17
|
)
|
231
|
268
|
292
|
293
|
||||||||||||||
|
Income before provision for income taxes
|
37,558
|
56,447
|
96,496
|
111,712
|
117,853
|
|||||||||||||||
|
Provision for income taxes
|
9,137
|
21,417
|
35,421
|
41,184
|
44,269
|
|||||||||||||||
|
Net income
|
$
|
28,421
|
$
|
35,030
|
$
|
61,075
|
$
|
70,528
|
$
|
73,584
|
||||||||||
|
Basic earnings per share
|
$
|
1.52
|
$
|
1.72
|
$
|
2.75
|
$
|
2.95
|
$
|
2.90
|
||||||||||
|
Diluted earnings per share
|
$
|
1.51
|
$
|
1.71
|
$
|
2.72
|
$
|
2.92
|
$
|
2.87
|
||||||||||
|
Basic weighted average shares outstanding
|
18,644
|
20,347
|
22,240
|
23,947
|
25,369
|
|||||||||||||||
|
Diluted weighted average shares outstanding
|
18,826
|
20,450
|
22,427
|
24,129
|
25,620
|
|||||||||||||||
Note: No dividends have been declared or paid.
(In thousands, except Other Data and Selected Store Data)
|
Fiscal Year Ended
|
||||||||||||||||||||
|
February 2,
2019
(52 weeks)
|
February 3,
2018
(53 weeks)
|
January 28,
2017
(52 weeks)
|
January 30,
2016
(52 weeks)
|
January 31,
2015
(52 weeks)
|
||||||||||||||||
|
Other Data:
|
||||||||||||||||||||
|
Net sales increase (decrease)
|
4.2
|
%
|
-0.5
|
%
|
3.2
|
%
|
3.2
|
%
|
7.2
|
%
|
||||||||||
|
Comparable store sales
|
2.2
|
%
|
-3.8
|
%
|
0.2
|
%
|
-0.4
|
%
|
2.9
|
%
|
||||||||||
|
Gross margin (as a % to net sales)
|
32.6
|
%
|
32.3
|
%
|
34.8
|
%
|
35.3
|
%
|
35.8
|
%
|
||||||||||
|
Store operating, selling and administrative expenses (as a % to net sales)
|
26.2
|
%
|
23.9
|
%
|
22.9
|
%
|
21.6
|
%
|
21.1
|
%
|
||||||||||
|
Depreciation and amortization (as a % to net sales)
|
2.7
|
%
|
2.5
|
%
|
2.0
|
%
|
1.8
|
%
|
1.8
|
%
|
||||||||||
|
Provision for income taxes (as a % to net sales)
|
0.9
|
%
|
2.2
|
%
|
3.6
|
%
|
4.4
|
%
|
4.8
|
%
|
||||||||||
|
Net income (as a % to net sales)
|
2.8
|
%
|
3.6
|
%
|
6.3
|
%
|
7.5
|
%
|
8.1
|
%
|
||||||||||
|
Balance
Sheet Data:
|
||||||||||||||||||||
|
Cash and cash equivalents
|
$
|
61,756
|
$
|
73,544
|
$
|
38,958
|
$
|
32,274
|
$
|
88,397
|
||||||||||
|
Average inventory per store
|
$
|
241
|
$
|
235
|
$
|
260
|
$
|
271
|
$
|
243
|
||||||||||
|
Working capital
|
$
|
194,583
|
$
|
231,207
|
$
|
242,192
|
$
|
225,178
|
$
|
253,373
|
||||||||||
|
Total assets
|
$
|
546,065
|
$
|
461,846
|
$
|
458,854
|
$
|
442,372
|
$
|
452,397
|
||||||||||
|
Long-term capital lease obligations
|
$
|
1,994
|
$
|
2,522
|
$
|
2,857
|
$
|
3,149
|
$
|
3,029
|
||||||||||
|
Stockholders’ investment
|
$
|
336,049
|
$
|
319,596
|
$
|
334,040
|
$
|
310,846
|
$
|
324,781
|
||||||||||
|
Treasury shares repurchased
|
776
|
2,843
|
1,236
|
2,236
|
1,206
|
|||||||||||||||
|
Cost of treasury shares purchased
|
$
|
16,540
|
$
|
54,506
|
$
|
43,058
|
$
|
91,332
|
$
|
60,971
|
||||||||||
|
Selected
Store Data:
|
||||||||||||||||||||
|
Stores open at beginning of period
|
1,079
|
1,078
|
1,044
|
988
|
927
|
|||||||||||||||
|
Stores acquired
|
136
|
-
|
-
|
-
|
-
|
|||||||||||||||
|
New stores opened
|
32
|
44
|
65
|
71
|
80
|
|||||||||||||||
|
Stores closed
|
(84
|
)
|
(43
|
)
|
(31
|
)
|
(15
|
)
|
(19
|
)
|
||||||||||
|
Stores open at end of period
|
1,163
|
1,079
|
1,078
|
1,044
|
988
|
|||||||||||||||
|
Stores expanded during the period
|
7
|
11
|
8
|
16
|
9
|
|||||||||||||||
|
Estimated square footage (in thousands)
|
6,542
|
6,140
|
6,141
|
5,974
|
5,649
|
|||||||||||||||
As you read the MD&A, please refer to our consolidated financial statements, included in “Item 8. Financial Statements and
Supplementary Data” and “Item 6. Selected Consolidated Financial Data” of this Form 10-K. This Annual Report on Form 10-K contains forward-looking statements within the meaning of the Private Securities Litigation Reform Act of 1995. See Part I. Item 1. “Cautionary Statement Regarding Forward-Looking
Statements” and Part I, Item 1A. “Risk Factors.”
Key Events and Recent Developments
In Fiscal 2019, we experienced key events that impacted our operations and for which we are still assessing future impacts on our
business. Included in those events are:
| · |
The acquisition of City Gear;
|
| · |
The launch of our new mobile app as well as Buy Online, Pick Up in Store (BOPIS) and Reserve in Store (ROPIS);
|
| · |
The expansion of our credit facilities to facilitate the purchase of City Gear; and
|
| · |
The continuation of our Stock Repurchase Program through January 2022.
|
City Gear results and data are presented as of the November 4, 2018 acquisition closing date.
In addition, in Fiscal 2020, we expect to initiate a strategic realignment that will include the closure of approximately 95 stores,
while opening approximately 10 to 15 new Hibbett Sports and City Gear stores.
General Overview
Hibbett Sports, Inc. is a leading athletic-inspired fashion retailer primarily located in small and mid-sized communities across the
country. Founded in 1945, Hibbett stores have a rich history of convenient locations, personalized customer service and access to coveted footwear, apparel and equipment from top
brands like Nike, Under Armour and Adidas. Consumers can browse styles, find new releases or shop looks by visiting their nearest store or by visiting www.hibbett.com. Follow us @HibbettSports. We became a public company in October 1996. As of February 2, 2019, we operated a total of 1,163 retail stores in 35 states composed of 1,007
Hibbett Sports stores, 138 City Gear stores and 18 Sports Additions athletic shoe stores.
Our Hibbett Sports stores average 5,700 square feet and are located primarily in strip centers which are usually near a major chain
retailer such as Wal-Mart. Our City Gear stores average 5,000 square feet and are located primarily in strip centers. Our store base consisted of 876 stores located in strip centers, 33 free-standing stores and 254 enclosed mall locations as
of February 2, 2019.
Hibbett operates on a 52- or 53-week fiscal year ending on the Saturday nearest to January 31 of each year. The consolidated
statements of operations for Fiscal 2019, Fiscal 2018 and Fiscal 2017 included 52 weeks, 53 weeks and 52 weeks of operations, respectively. Fiscal 2020 will include 52 weeks of operations.
Executive Summary
Following is a highlight of our financial results over the last three fiscal years:
|
Fiscal 2019
(52 weeks) |
Fiscal 2018
(53 weeks) |
Fiscal 2017
(52 weeks) |
||||||||||
|
Net sales (in millions)
|
$
|
1,008.7
|
$
|
968.2
|
$
|
973.0
|
||||||
|
Operating income, percentage to net sales
|
3.7
|
%
|
5.9
|
%
|
10.0
|
%
|
||||||
|
Comparable store sales
|
2.2
|
%
|
-3.8
|
%
|
0.2
|
%
|
||||||
|
Net income (in millions)
|
$
|
28.4
|
$
|
35.0
|
$
|
61.1
|
||||||
|
Net income, percentage decrease
|
-18.9
|
%
|
-42.6
|
%
|
-13.4
|
%
|
||||||
|
Diluted earnings per share
|
$
|
1.51
|
$
|
1.71
|
$
|
2.72
|
||||||
During Fiscal 2019, Hibbett acquired 136 City Gear stores, opened 32 new stores and closed 84 underperforming stores, bringing the
store base to 1,163 in 35 states as of February 2, 2019. Inventory on a per store basis increased 2.6% compared to the prior fiscal year. Hibbett ended Fiscal 2019 with $61.8 million of available cash and cash equivalents on the consolidated
balance sheet. As of February 2, 2019, Hibbett had $35.0 million in debt outstanding, mainly due to the acquisition of City Gear, and $65.0 million available under its unsecured credit facilities.
Due to the 53rd week in Fiscal 2018, each quarter in
Fiscal 2019 started one week later than the same quarter in Fiscal 2018. The charts below present comparable store sales and net sales for Fiscal 2018 as originally reported and as adjusted to represent the same 13-week period as the Fiscal
2019 quarters:
|
Fiscal 2018
|
||||||||||||||||||||
|
|
First
Quarter
|
Second
Quarter
|
Third
Quarter
|
Fourth
Quarter
|
Full Year
|
|||||||||||||||
|
Comparable store sales increase (originally reported)
|
-4.9
|
%
|
-11.7
|
%
|
-1.3
|
%
|
1.6
|
%
|
-3.8
|
%
|
||||||||||
|
Comparable store sales increase (adjusted for week shift)
|
-4.8
|
%
|
-11.0
|
%
|
0.3
|
%
|
1.0
|
%
|
-3.6
|
%
|
||||||||||
|
Impact of week shift
|
0.1
|
%
|
0.7
|
%
|
1.6
|
%
|
-0.6
|
%
|
0.2
|
%
|
||||||||||
|
Fiscal 2018
|
||||||||||||||||||||
|
|
First
Quarter
|
Second
Quarter
|
Third
Quarter
|
Fourth
Quarter
|
Full Year
|
|||||||||||||||
|
Net sales (originally reported)
|
$
|
275.7
|
$
|
188.0
|
$
|
237.8
|
$
|
266.7
|
$
|
968.2
|
||||||||||
|
Net sales (adjusted for week shift)
|
$
|
275.2
|
$
|
206.0
|
$
|
220.6
|
$
|
265.8
|
$
|
967.6
|
||||||||||
|
Impact of week shift
|
$
|
(0.5
|
)
|
$
|
18.0
|
$
|
(17.2
|
)
|
$
|
(0.9
|
)
|
$
|
(0.6
|
)
|
||||||
For Fiscal 2019, total company-wide square footage increased 6.6%. Our plan for Fiscal 2020 is to decrease total company-wide square
footage by approximately 7.0% as we continue to optimize our store base and maximize return on invested capital. To supplement new store openings, we continue to expand high performing stores, increasing the square footage in 7 existing stores
in Fiscal 2019 for an average increase in square footage of 48.0%.
In Fiscal 2019, comparable store sales increased 2.2%. For Fiscal 2020, comparable store sales are expected to be in the range of
-1.0% to 1.0%. We expect overall gross margin rate to decrease in the range of 25 to 45 basis points, driven by a lower gross margin in our City Gear stores, and a slight increase in logistics expenses as a percentage of net sales due to
increased fulfillment costs. We see an opportunity for improvement in gross margin as we work through the City Gear integration. Store occupancy expenses are expected to be relatively flat as a percentage of net sales.
We expect operating, selling and administrative expenses to increase in the range of 10 to 20 basis points as a percentage of net sales
in Fiscal 2020. This is primarily due to non-recurring costs related to store closures and acquisition integration costs. We also expect to continue to generate sufficient cash to enable us to expand and remodel our store base, to enable
capital expenditures including technology upgrade projects and to repurchase our common stock under our stock repurchase program.
As the retail environment continues to evolve, the Company is focused on improving the productivity of the store base while continuing
to grow its omni-channel business to serve customers where and when they want to shop. As a result, subsequent to the year ended February 2, 2019, the Company has decided to close approximately 95 Hibbett stores in Fiscal 2020, while opening
10 to 15 new Hibbett and City Gear stores. This will result in non-recurring impairment and store closure charges in the range of $0.15 to $0.20 per diluted share in Fiscal 2020. Associates will be extended opportunities to transition to
similar positions at other Hibbett stores wherever possible.
Comparable store sales data for the periods presented reflects sales for our traditional format Hibbett Sports and Sports Additions
stores open throughout the period and the corresponding period of the prior fiscal year, and e-commerce sales. City Gear stores and e-commerce sales will not be presented in comparable store sales data until the fourth quarter of Fiscal 2020.
If a store remodel, relocation, or expansion results in the store being closed for a significant period, its sales are removed from the comparable store sales base until it has been open a full 12 months. In addition, re-branded stores will be
treated as a new store and not presented in comparable store sales until they have been open a full 12 months under the new banner.
About Non-GAAP Measures
This MD&A includes certain non-GAAP financial measures, including adjusted net income, earnings per share, gross margin and
SG&A expenses as a percentage of net sales. Management believes that non-GAAP net income, earnings per share, gross margin and SG&A expenses as a percentage of net sales, which exclude the effects of non-recurring expenses related to
the acquisition of City Gear and our accelerated store closure plan, are useful measures for providing more accurate comparisons of our current financial results to historical operations, forward looking guidance and the financial results of
peer companies. The non-recurring costs related to the acquisition of City Gear include amortization of inventory step-up value and professional service fees and expenses consisting primarily of investment banking, legal and accounting fees
and expenses. In future periods, such acquisition-related costs may include one or more of the following categories of expenses: (i) transition and integration costs, (ii) professional service fees and expenses and (iii) acquisition-related
adjustments. Future non-recurring costs related to the accelerated store closure plan may include: (i) lease and equipment impairment costs, (ii) third party liquidation fees, (iii) store exit costs, and (iv) residual lease costs.
While we use these non-GAAP financial measures as a tool to enhance our understanding of certain aspects of our financial performance,
our management does not consider these measures to be a substitute for, or superior to, the information provided by GAAP financial statements. Consistent with this approach, we believe that disclosing non-GAAP financial measures to the readers
of our financial statements provides such readers with useful supplemental data that, while not a substitute for GAAP financial statements, allows for greater transparency in the review of our financial and operational performance. It should
be noted as well that our non-GAAP information may be different from the non-GAAP information provided by other companies.
Recent Accounting Pronouncements
See Note 2 of Item 8 of this Annual Report on Form 10-K for the fiscal year ended February 2, 2019, for information regarding recent
accounting pronouncements.
Results of Operations
The following table sets forth the percentage relationship to net sales of certain items included in our consolidated statements of
operations for the periods indicated.
|
Fiscal Year Ended
|
||||||||||||
|
February 2,
2019
(52 weeks) |
February 3,
2018
(53 weeks) |
January 28,
2017
(52 weeks) |
||||||||||
|
Net sales
|
100.0
|
%
|
100.0
|
%
|
100.0
|
%
|
||||||
|
Cost of goods sold
|
67.4
|
67.7
|
65.2
|
|||||||||
|
Gross margin
|
32.6
|
32.3
|
34.8
|
|||||||||
|
Store operating, selling and administrative expenses
|
26.2
|
23.9
|
22.9
|
|||||||||
|
Depreciation and amortization
|
2.7
|
2.5
|
2.0
|
|||||||||
|
Operating income
|
3.7
|
5.9
|
10.0
|
|||||||||
|
Interest income (expense), net
|
-
|
-
|
-
|
|||||||||
|
Income before provision for income taxes
|
3.7
|
5.8
|
9.9
|
|||||||||
|
Provision for income taxes
|
0.9
|
2.2
|
3.6
|
|||||||||
|
Net income
|
2.8
|
%
|
3.6
|
%
|
6.3
|
%
|
||||||
Note: Columns may not sum due to rounding.
Fiscal 2019 Compared to Fiscal 2018
Net sales. Net sales increased $40.5
million, or 4.2%, to $1.0 billion for Fiscal 2019 from $968.2 million for Fiscal 2018. Furthermore:
| · |
We acquired 136 City Gear stores, opened 32 Hibbett Sports or City Gear stores while closing 84 underperforming Hibbett Sports stores for a net addition of 84 stores in
Fiscal 2019. We expanded 7 high performing stores.
|
| · |
Comparable store net sales for Fiscal 2019 increased 2.2% compared to Fiscal 2018. Stores not in the comparable store net sales calculation accounted for $97.1 million
of net sales of which $49.1 million was attributable to the acquisition of City Gear.
|
During Fiscal 2019, 950 stores were included in the comparable store sales comparison. Comparable store net sales were driven by gains
in footwear, activewear and cleats, offset by declines in licensed product and equipment. Significant increases were achieved in lifestyle footwear, men’s and women’s activewear, and cleats. Significant declines were experienced in college
apparel, MLB apparel, socks, hydration, and football equipment. In Fiscal 2019, we saw an increase in average ticket and a decrease in items per transaction.
Gross margin. Cost of goods sold includes
the cost of merchandise, occupancy costs for stores, occupancy and operating costs for our wholesale and logistics facility and ship-to-home freight. Gross margin was $328.7 million, or 32.6% of net sales, in Fiscal 2019, compared with $312.7
million, or 32.3% of net sales, in Fiscal 2018. Furthermore:
| · |
Merchandise gross margin increased 15 basis points as a percentage of net sales due to promotional markdowns resulting from lower levels of aged inventory, and an
approximate $0.9 million non-recurring charge from last year related to our Team Division. This was partially offset by a higher percentage of e-commerce sales and a non-recurring charge of approximately $1.9 million to amortize an
inventory step-up value related to the City Gear acquisition.
|
| · |
Wholesale and logistics expense was relatively flat increasing two basis points as a percentage of net sales.
|
| · |
Store occupancy expense decreased 16 basis points as a percentage of net sales mainly due to the closure of 84 lower volume stores and growth in e-commerce sales.
|
Store operating, selling and administrative
expenses. Store operating, selling and administrative expenses were $264.1 million, or 26.2% of net sales, for Fiscal 2019, compared with $231.8 million, or 23.9% of net sales, for Fiscal 2018. Furthermore:
| · |
Total salary and benefit costs increased 70 basis points as a percentage of net sales due to increased wages for store associates, increases in incentive compensation
and health care costs, and severance costs related to a workforce reduction.
|
| · |
Expenses associated with our omni-channel initiative increased 98 basis points as a percentage of net sales due to increased operational and marketing costs to support
increased sales, and the development and rollout of new functionality such as BOPIS, ROPIS and a new mobile app.
|
| · |
Overall expenses increased 43 basis points due to non-recurring costs associated with the City Gear acquisition and increased 30 basis points due to a $3.1 million
non-recurring gain last year from the sale of our Team Division.
|
| · |
We expect overall store operating, selling and administrative expenses to increase slightly as a percentage of net sales in Fiscal 2020 mainly due to non-recurring
costs related to the integration of City Gear.
|
Depreciation and amortization. Depreciation
and amortization as a percentage of net sales was 2.7% in Fiscal 2019 and 2.5% in Fiscal 2018. In Fiscal 2019, depreciation expense increased mainly due to the capitalization of omni-channel and other IT investments and the acceleration of
depreciation for stores likely to close. We expect depreciation expense to decline slightly as a percentage of net sales in Fiscal 2020.
Provision for income taxes. The combined
federal, state and local effective income tax rate as a percentage of pre-tax income was 24.3% for Fiscal 2019 and 37.9% for Fiscal 2018. The decrease in rate was primarily due to the Tax Cuts and Jobs Act, which lowered the statutory federal income tax rate from 35% to 21%. We do not expect major changes in our state and local income tax rates in Fiscal 2020.
Non-GAAP financial measures. The following
table provides a reconciliation of our consolidated statement of operations for the fifty-two weeks ended February 2, 2019, as reported on a GAAP basis, to a statement of operations for the same period prepared on a non-GAAP basis. For more
information regarding our non-GAAP financial measures, see “Executive Summary – About Non-GAAP Measures” above.
GAAP to Non-GAAP Reconciliation
(Dollars in thousands, except per share amounts)
|
Fifty-Two Weeks Ended February 2, 2019
|
||||||||||||||||
|
Non-Recurring Costs
|
||||||||||||||||
|
GAAP Basis
(As Reported)
|
Acquisition
Costs
|
Severance
Costs
|
Non-GAAP Basis
February 2,
2019
|
|||||||||||||
|
Net sales
|
$
|
1,008,682
|
$
|
-
|
$
|
-
|
$
|
1,008,682
|
||||||||
|
Cost of goods sold
|
679,947
|
1,911
|
-
|
678,036
|
||||||||||||
|
Gross margin
|
328,735
|
1,911
|
-
|
330,646
|
||||||||||||
|
Store operating, selling and administrative expenses
|
264,142
|
4,299
|
289
|
259,554
|
||||||||||||
|
Depreciation and amortization
|
27,052
|
-
|
-
|
27,052
|
||||||||||||
|
Operating income
|
37,541
|
6,210
|
289
|
44,040
|
||||||||||||
|
Interest income, net
|
(17
|
)
|
-
|
-
|
(17
|
)
|
||||||||||
|
Income before provision for income taxes
|
37,558
|
6,210
|
289
|
44,057
|
||||||||||||
|
Provision for income taxes
|
9,137
|
(1,511
|
)
|
(70
|
)
|
10,718
|
||||||||||
|
Net income
|
$
|
28,421
|
$
|
4,699
|
$
|
219
|
$
|
33,339
|
||||||||
|
Basic earnings per share
|
$
|
1.52
|
$
|
0.25
|
$
|
0.01
|
$
|
1.79
|
||||||||
|
Diluted earnings per share
|
$
|
1.51
|
$
|
0.25
|
$
|
0.01
|
$
|
1.77
|
||||||||
|
Weighted average shares outstanding:
|
||||||||||||||||
|
Basic
|
18,644
|
18,644
|
18,644
|
18,644
|
||||||||||||
|
Diluted
|
18,826
|
18,826
|
18,826
|
18,826
|
||||||||||||
Non-recurring acquisition costs represent costs incurred during the fifty-two weeks ended February 2, 2019, related to the acquisition
of City Gear and consists primarily of amortization of inventory fair-market value step-up and legal, accounting and professional fees. Non-recurring severance costs represent costs incurred during the fifty-two weeks ended February 2, 2019,
related to elimination of 30 positions to streamline operations.
Fiscal 2018 Compared to Fiscal 2017
Net sales. Net sales decreased $4.8
million, or 0.5%, to $968.2 million for Fiscal 2018 from $973.0 million for Fiscal 2017. Furthermore:
| · |
We opened 44 Hibbett Sports stores while closing 43 underperforming Hibbett Sports stores for net addition of 1 store in Fiscal 2018. We expanded 11 high performing
stores.
|
| · |
Comparable store net sales for Fiscal 2018 decreased 3.8% compared to Fiscal 2017. Stores not in the comparable store net sales calculation accounted for $53.4 million
of net sales.
|
During Fiscal 2018, 968 stores were included in the comparable store sales comparison. Comparable store net sales were driven by gains
in footwear, offset by declines in apparel and equipment. Significant increases were achieved in basketball and lifestyle footwear, while accessories, socks, hydration, college apparel, women’s activewear and performance running footwear
experienced significant declines. In Fiscal 2018, we saw an increase in average ticket and a slight decrease in items per transaction.
Gross margin. Cost of goods sold included
the cost of merchandise, occupancy costs for stores, occupancy and operating costs for our wholesale and logistics facility and ship-to-home freight. Gross margin was $312.7 million, or 32.3% of net sales, in Fiscal 2018, compared with $338.6
million, or 34.8% of net sales, in Fiscal 2017. Furthermore:
| · |
Merchandise gross margin decreased 258 basis points as a percentage of net sales due to promotional markdowns, the introduction of e-commerce sales and a one-time
charge of approximately $0.9 million to establish a reserve against the inventory of our Team business.
|
| · |
Wholesale and logistics expense increased eight basis points as a percentage of net sales due to increased data processing costs associated with our omni-channel
initiative and increased transportation costs.
|
| · |
Store occupancy expense decreased 17 basis points as a percentage of net sales mainly due to savings realized in utility costs resulting from cost savings initiatives.
|
Store operating, selling and administrative
expenses. Store operating, selling and administrative expenses were $231.8 million, or 23.9% of net sales, for Fiscal 2018, compared with $222.8 million, or 22.9% of net sales, for Fiscal 2017. Furthermore:
| · |
Total salary and benefit costs increased 67 basis points as a percentage of net sales due to de-leverage associated with lower comparable store sales and hiring to
support our e-commerce business.
|
| · |
Expenses associated with our omni-channel initiative increased 82 basis points as a percentage of net sales due to the launch of our e-commerce business and on-going
operational and marketing costs to support the e-commerce business.
|
| · |
Overall expenses decreased 32 basis points due to a $3.1 million one-time gain resulting from the sale of the Company’s Team Division.
|
| · |
Credit card fees decreased 21 basis points mainly due to the implementation of EMV chip technology in our stores.
|
Depreciation and amortization. Depreciation
and amortization as a percentage of net sales was 2.5% of net sales in Fiscal 2018 and 2.0% of net sales in Fiscal 2017. In Fiscal 2018, depreciation expense increased due to the addition of new stores and the capitalization of omni-channel
and other IT investments.
Provision for income taxes. The combined
federal, state and local effective income tax rate as a percentage of pre-tax income was 37.9% for Fiscal 2018 and 36.7% for Fiscal 2017. The increase in rate was primarily due to an accounting standards change (ASU 2016-09) for stock-based
compensation. This accounting standard stipulated that the income tax effect of fluctuations in the value of stock-based awards between the grant date and vesting date be recorded directly to income tax expense. In the past, this effect was
recorded directly to equity. This change primarily affected the first quarter of Fiscal 2018 due to timing of stock-based awards.
Liquidity and Capital Resources
Our capital requirements relate primarily to new store openings, stock repurchases, facilities and systems to support company growth
and working capital requirements. Our working capital requirements are somewhat seasonal in nature and typically reach their peak near the end of the third and the beginning of the fourth quarters of our fiscal year. Historically, we have
funded our cash requirements primarily through our cash flow from operations and occasionally from borrowings under our credit facilities. We use excess cash on deposit to offset bank fees and to invest in interest-bearing deposits and
securities.
Our consolidated statements of cash flows are summarized as follows (in thousands):
|
Fiscal Year Ended
|
||||||||||||
|
February 2,
2019
(52 weeks) |
February 3,
2018
(53 weeks) |
January 28,
2017
(52 weeks) |
||||||||||
|
Net cash provided by operating activities
|
$
|
73,417
|
$
|
111,926
|
$
|
78,675
|
||||||
|
Net cash used in investing activities
|
(103,871
|
)
|
(22,900
|
)
|
(29,409
|
)
|
||||||
|
Net cash provided by (used in) financing activities
|
18,666
|
(54,440
|
)
|
(42,582
|
)
|
|||||||
|
Net (decrease) increase in cash and cash equivalents
|
$
|
(11,788
|
)
|
$
|
34,586
|
$
|
6,684
|
|||||
Operating Activities.
Cash flow from operations is seasonal in our business. Typically, we use cash flow from operations to increase inventory in advance of
peak selling seasons, such as winter holidays, the spring sales period and late summer back-to-school shopping. Inventory levels are reduced in connection with higher sales during the peak selling seasons and this inventory reduction, combined
with proportionately higher net income, typically produces a positive cash flow.
Net cash provided by operating activities was $73.4 million for Fiscal 2019 compared with net cash provided by operating activities of
$111.9 million and $78.7 million in Fiscal 2018 and Fiscal 2017, respectively. Net cash provided by operating activities for Fiscal 2019 compared to Fiscal 2018 and Fiscal 2017 was impacted by the following:
| · |
Net income provided cash of $28.4 million, $35.0 million and $61.1 million during Fiscal 2019, Fiscal 2018 and Fiscal 2017, respectively.
|
| · |
Ending inventory per store increased 2.6% at February 2, 2019 and declined 9.9% at February 3, 2018, compared to the prior year. Fiscal 2019 inventory increased on a
per store basis mainly due to the acquisition of City Gear. Fiscal 2018 inventory declined on a per store basis mainly due to vendor returns, cancellations and markdowns taken to liquidate excess inventory. The change in inventory
provided cash of $16.8 million, $27.5 million and $2.4 million during Fiscal 2019, Fiscal 2018 and Fiscal 2017, respectively.
|
| · |
The change in accounts payable used cash of $9.9 million in Fiscal 2019, provided cash of $16.4 million in Fiscal 2018 and used cash of $11.4 million in Fiscal 2017.
The decrease in Fiscal 2019 and increase in Fiscal 2018 resulted mainly from the timing of receipts prior to our peak selling seasons.
|
| · |
Non-cash charges included depreciation and amortization expense of $27.1 million, $24.2 million and $19.0 million during Fiscal 2019, Fiscal 2018 and Fiscal 2017,
respectively, and stock-based compensation expense of $4.3 million, $3.9 million and $4.6 million during Fiscal 2019, Fiscal 2018 and Fiscal 2017, respectively. Fluctuations in stock-based compensation generally result from the
achievement of performance-based equity awards at greater or lesser than their granted level, fluctuations in the price of our common stock and levels of forfeitures in any given period. Depreciation expense has increased in each
fiscal year due to investments in facilities and information technology systems, and due to accelerated depreciation taken in Fiscal 2019 resulting from an increase in store closures. Depreciation is expected to decline slightly in
Fiscal 2020.
|
Investing Activities.
Cash used in investing activities in Fiscal 2019, Fiscal 2018 and Fiscal 2017 totaled $103.9 million, $22.9 million and $29.4 million,
respectively. The increase in Fiscal 2019 over previous years was due to the investment in City Gear of $86.8 million. Gross capital expenditures used $17.7 million, $23.1 million and $29.7 million during Fiscal 2019, Fiscal 2018 and Fiscal
2017, respectively. Capital expenditures in all periods primarily consisted of new stores, relocations, remodels and expansions of existing stores and IT projects.
We acquired 136 stores through the acquisition of City Gear in the fourth quarter of Fiscal 2019. In addition, we opened 32 new stores
and expanded and/or relocated 10 existing stores in Fiscal 2019. We opened 44 new stores, expanded 11 existing stores and relocated and/or remodeled six additional existing stores during Fiscal 2018. We opened 65 new stores, expanded eight
existing stores and relocated and/or remodeled two additional existing stores during Fiscal 2017.
We estimate the cash outlay for capital expenditures in the fiscal year ending February 1, 2020 will be approximately $18.0 million to
$22.0 million, which relates to expenditures for:
| · |
The opening of new stores, the remodeling, relocation or expansion of selected existing stores;
|
| · |
Information system infrastructure, projects, upgrades and security (including City Gear integration); and
|
| · |
Other departmental needs.
|
Of the total budgeted dollars for capital expenditures for Fiscal 2020, we anticipate that approximately 51% will be related to the
opening new stores, store expansions and relocations and store remodels. Approximately 30% will be related to information technology, consisting primarily of expenditures for projects and software, City Gear integration, omni-channel,
infrastructure and various system enhancements, upgrades and security. The remaining 19% relates primarily to specific department expenditures and includes facility upgrades, transportation equipment, automobiles, fixtures and security
equipment for our stores.
Financing Activities.
Net cash provided by financing activities was $18.7 million in Fiscal 2019 and net cash used in financing activities was $54.4 million
and $42.6 million in Fiscal 2018 and Fiscal 2017, respectively. In Fiscal 2019, net cash provided by financing activities resulted from borrowings against our credit facilities to facilitate the acquisition of City Gear. Historically, the
fluctuation in financing activity between years is primarily the result of repurchases of our common stock. We expended $16.5 million, $54.5 million and $43.1 million on repurchases of our common stock during Fiscal 2019, Fiscal 2018 and
Fiscal 2017, respectively, which included cash used to settle net share equity awards of $0.4 million, $0.7 million and $0.9 million during Fiscal 2019, Fiscal 2018 and Fiscal 2017, respectively.
Financing activities also consisted of proceeds from stock option exercises and employee stock plan purchases. As stock options are
exercised and shares are purchased through our employee stock purchase plan, we will continue to receive proceeds and expect a tax deduction; however, the amounts and timing cannot be predicted.
At February 2, 2019, we had two unsecured credit facilities that allow borrowings up to $50.0 million each, and which expire in October
2021. Under the provisions of both facilities, we do not pay commitment fees. However, both are subject to negative pledge agreements that, among other things, restrict liens or transfers of assets including inventory, tangible or intangible
personal property and land and land improvements. We plan to renew these facilities as they expire and do not anticipate any problems in doing so; however, no assurance can be given that we will be granted a renewal or terms which are
acceptable to us. As of February 2, 2019, a total of $65.0 million was available to us from these facilities.
The following table lists the aggregate maturities of various classes of obligations and expiration amounts of various classes of
commitments related to Hibbett Sports, Inc. at February 2, 2019 (in thousands):
|
Payment due by period
|
||||||||||||||||||||
|
Contractual Obligations
|
Less than 1
year
|
1 - 3 years
|
3 - 5 years
|
More than
5 years
|
Total
|
|||||||||||||||
|
Long-term debt obligations
|
$
|
-
|
$
|
-
|
$
|
-
|
$
|
-
|
$
|
-
|
||||||||||
|
Credit facilities
|
35,000
|
-
|
-
|
-
|
35,000
|
|||||||||||||||
|
Capital lease obligations (1)
|
1,017
|
1,148
|
634
|
212
|
3,011
|
|||||||||||||||
|
Interest on capital lease obligations (1)
|
242
|
244
|
90
|
5
|
581
|
|||||||||||||||
|
Operating lease obligations (1)
|
68,002
|
105,349
|
56,437
|
40,181
|
269,969
|
|||||||||||||||
|
Purchase obligations (2)
|
8,920
|
7,337
|
3,041
|
-
|
19,298
|
|||||||||||||||
|
Other liabilities (3)
|
242
|
9,200
|
-
|
2,540
|
11,982
|
|||||||||||||||
|
Total
|
$
|
113,423
|
$
|
123,278
|
$
|
60,202
|
$
|
42,938
|
$
|
339,841
|
||||||||||
|
(1)
|
See “Part II, Item 8, Consolidated Financial Statements. Note 7 – Leases.”
|
|
(2)
|
Purchase obligations include all material legally binding contracts such as software license commitments and service contracts. The table above also includes a
stand-by letter of credit in conjunction with our self-insured workers’ compensation and general liability insurance coverage. Contractual obligations that are not binding agreements, including purchase orders for inventory,
are excluded from the table above. Store utility contracts, including waste disposal agreements, are also excluded.
|
|
(3)
|
Other liabilities include amounts accrued for various deferred compensation arrangements and contingent earnouts related to the City Gear acquisition. See “Part
II, Item 8, Consolidated Financial Statements. Note 8 – Defined Contribution Benefit Plans” for a discussion regarding our employee benefit plans.
|
Non-current liabilities have been excluded from the above table to the extent that the timing and/or amount of any cash
payment are uncertain. Excluded from this table are approximately $1.2 million of unrecognized tax benefits, which have been recorded as liabilities in accordance with ASC Topic 740, Income Taxes, as the timing of such payments cannot be reasonably determined. See “Part II, Item 8, Consolidated Financial Statements Note 1 – Deferred Rent” for a discussion on our deferred rent
liabilities. See “Part II, Item 8, Consolidated Financial Statements. Note 10 – Income Taxes” for a discussion of our unrecognized tax benefits.
Off-Balance Sheet Arrangements
We have not provided any financial guarantees through February 2, 2019. We have not created, and are not party to, any special-purpose
or off-balance sheet entities for the purpose of raising capital, incurring debt or operating our business. We do not have any arrangements or relationships with entities that are not consolidated into the financial statements.
Inflation and Other Economic Factors
Our ability to provide quality imported merchandise on a profitable basis may be subject to political and economic factors and
influences that we cannot control. National or international events, including changes in government trade or other policies, could increase our merchandise costs and other costs that are critical to our operations. Consumer spending could
also decline because of economic pressures. See “Risk Factors.”
We do not believe that inflation has had a material impact on our financial position or results of operations to date. A high rate of
inflation or other increases in the cost of conducting our business in the future may have an adverse effect on our ability to maintain current levels of gross profit and selling, general and administrative expenses as a percentage of net sales
if the selling prices of our merchandise do not increase with these increased costs.
Our Critical Accounting Policies
Our critical accounting policies reflected in the consolidated financial statements are detailed below.
Revenue Recognition. We
recognize revenue in accordance with Accounting Standards Codification (ASC) Topic 606, Revenue from Contracts with Customers, when control of the
merchandise is transferred to our customer. Sales are recorded net of expected returns at the time the customer takes possession of the merchandise. Net sales exclude sales taxes because we are a pass-through conduit for collecting and
remitting these taxes.
Retail Store Sales: For merchandise sold in
our stores, revenue is recognized at the point of sale when tender is accepted and the customer takes possession of the merchandise.
Retail Store Orders: Retail store customers
may order merchandise available in other retail store locations for pickup in the selling store at a later date. Customers make a deposit with the remaining balance due at pickup. These deposits are recorded as deferred revenue until the
transaction is completed and the customer takes possession of the merchandise. Retail store customers may also order merchandise to be shipped to home. Payment is received in full at the time of order and recorded as deferred revenue until
delivery.
Layaways: Some of our stores offer a retail
store program giving customers the option of paying a deposit and placing merchandise on layaway. The customer may make further payments in installments, but the full purchase price must be received by us within 30 days. The payments are
recorded as deferred revenue until the transaction is completed and the customer takes possession of the merchandise.
Digital Channel Sales: For merchandise
shipped to home, customer payment is received when the order ships. Revenue is deferred until control passes to the customer at delivery. Shipping and handling costs billed to customers are included in net sales.
Customer Loyalty Programs: We offer two
customer loyalty programs; the Hibbett Rewards program and the City Gear Reward Points program. Upon registration and in accordance with the terms of the programs, customers earn points on certain purchases. Points convert into rewards at
defined thresholds. The short-term future performance obligation liability is estimated at each reporting period based on historical conversion and redemption patterns. The liability is included in other accrued expenses on our consolidated
balance sheets and was $2.2 million and $0.2 million at February 2, 2019 and February 3, 2018, respectively.
Gift Cards: Proceeds received from the
issuance of our non-expiring gift cards are initially recorded as deferred revenue. Revenue is subsequently recognized at the time the customer redeems the gift cards and takes possession of the merchandise. Unredeemed gift cards are recorded
in accounts payable on our consolidated balance sheet.
The net deferred revenue liability for gift cards, customer orders and layaways at February 2, 2019 and February 3, 2018 was $7.5
million and $6.2 million, respectively, recognized in accounts payable on our consolidated balance sheets. In Fiscal 2019, gift card breakage income was recognized in net sales in proportion to the redemption pattern of rights exercised by the
customer and was $0.6 million. During Fiscal 2018 and Fiscal 2017, income from unredeemed gift cards was recognized on our consolidated statements of operations as a reduction to store operating, selling and administrative expenses when the
likelihood of redemption was deemed remote. Gift card breakage was not material in Fiscal 2018 or Fiscal 2017.
During the fiscal year ended February 2, 2019, $2.1 million of gift card deferred revenue from prior periods was realized.
Return Sales: The liability for return sales
is estimated at each reporting period based on historical return patterns and is recognized at the transaction price. The liability is included in accounts payable on our consolidated balance sheets. We also recognize a return asset and a
corresponding adjustment to cost of goods sold for our right to recover the merchandise returned by the customer. This right to recover the asset is included in net inventory on our consolidated balance sheet at the former carrying value of
the merchandise less any expected recovery costs which was $0.8 million at February 2, 2019.
Inventories. Inventories
are valued using the lower of weighted average cost or net realizable value method. Items are removed from inventory using the weighted average cost method.
Lower of Cost and Net Realizable Value: We
regularly review inventories to determine if the carrying value exceeds net realizable value, and we record an accrual to reduce the carrying value to net realizable value as necessary. We account for obsolescence as part of our lower of cost
and net realizable value accrual based on historical trends and specific identification. As of February 2, 2019 and February 3, 2018, the accrual was $4.5 million and $5.2 million, respectively. A determination of net realizable value
requires significant judgment.
Shrink Reserves: We accrue for inventory
shrinkage based on the actual historical results of our physical inventory counts. These estimates are compared to actual results as physical inventory counts are performed and reconciled to the general ledger. Physical inventory counts are
performed on a cyclical basis. As of February 2, 2019 and February 3, 2018, the accrual was $1.6 million and $1.4 million, respectively.
Inventory Purchase Concentration: Our business is dependent to a significant degree upon close relationships with our vendors. Our largest vendor, Nike, represented
65.4%, 57.9% and 57.0% of our purchases for Fiscal 2019, Fiscal 2018 and Fiscal 2017, respectively. Our second largest vendor, adidas, represented 10.0%, 11.0% and 5.5% of our purchases for Fiscal 2019, Fiscal 2018 and Fiscal 2017,
respectively. Our third largest vendor, Under Armour, represented 5.7%, 10.8% and 16.4% of our purchases for Fiscal 2019, Fiscal 2018 and Fiscal 2017, respectively.
Income Taxes. We estimate the annual tax rate based on projected taxable income for the full year and record a quarterly income tax provision in accordance with the
anticipated annual rate. As the year progresses, we refine the estimates of the year’s taxable income as new information becomes available, including year-to-date financial results. This continual estimation process often results in a change
to our expected effective tax rate for the year. When this occurs, we adjust the income tax provision during the quarter in which the change in estimate occurs so that the year-to-date provision reflects the expected annual tax rate.
Significant judgment is required in determining our effective tax rate and in evaluating our tax position and changes in estimates could materially impact our results of operations and financial position.
We account for uncertain tax positions in accordance with ASC Subtopic 740-10. The application of income tax law is inherently
complex. Laws and regulations in this area are voluminous and are often ambiguous. As such, we are required to make many subjective assumptions and judgments regarding our income tax exposures. Interpretations of and guidance surrounding
income tax laws and regulations change over time. As such, changes in our subjective assumptions and judgments can materially affect amounts recognized in the consolidated balance sheets and statements of operations. See “Part II, Item 8,
Consolidated Financial Statements Note 10 – Income Taxes” for additional detail on our uncertain tax positions.
Goodwill and Indefinite-Lived
Intangible Assets. Goodwill and the City Gear tradename are indefinite-lived assets which are not amortized but rather tested for impairment at
least annually, or on an interim basis if events and circumstances have occurred that indicate that is more likely than not that an asset is impaired. Such events or circumstances could include, but are not limited to, significant negative
industry or economic trends, unanticipated changes in the competitive environment and a significant sustained decline in the market price of our stock. If it is more likely than not that an asset is impaired, the amount that the carrying value
exceeds the fair value is recorded as an impairment charge to current income. No impairment of these assets existed as of February 2, 2019.
Long-Lived Assets. We continually evaluate whether events and circumstances have occurred that indicate the carrying amount of long-lived assets may be may not be
recoverable. If circumstances require a long-lived asset or asset group be tested for possible impairment, our policy is to first compare undiscounted cash flows expected to be generated by that asset or asset group over its remaining life to
its carrying amount. If the carrying amount of the long-lived asset or asset group is not recoverable on an undiscounted cash flow basis, an impairment loss is recognized as a charge to current income to the extent that the carrying amount
exceeds its fair value. Fair value is determined through various valuation techniques including discounted cash flow models, quoted market values and third-party independent appraisals, as considered necessary. Assets or asset groups to be
disposed of are reported at the lower of their carrying value or fair value less any costs of disposition. Evaluation of asset impairment requires significant judgment.
Investment and Credit Availability Risk
We manage cash and cash equivalents in various institutions at levels beyond federally insured limits per institution, and we may
purchase investments not guaranteed by the FDIC. Accordingly, there is a risk that we will not recover the full principal of our investments or that their liquidity may be diminished. In an attempt to mitigate this risk, our investment policy
emphasizes preservation of principal and liquidity.
We also have financial institutions that are committed to provide loans under our credit facilities. There is a risk that these
institutions cannot deliver against these obligations. See “Risk Factors.”
Interest Rate Risk
Our net exposure to interest rate risk results primarily from interest rate fluctuations on our credit facilities, which bears interest
at a rate which varies with LIBOR, prime or federal funds rates. At the end of Fiscal 2019, we had $35.0 million outstanding on our credit facilities. At the end of Fiscal 2018, we had no borrowings outstanding under any credit facility. A
125-basis point increase or decrease in the interest rate on borrowings under our credit facilities would not result in a material impact to our results of operations at current borrowing levels.
There were 95 days during the 52 weeks ended February 2, 2019, where we incurred borrowings against our credit facilities for an
average and maximum borrowing of $45.4 million and $75.0 million, respectively, and an average interest rate of 3.7%.
There were seven days during the 53 weeks ended February 3, 2018, where we incurred borrowings against our credit facilities for an
average and maximum borrowing of $4.1 million and $4.9 million, respectively, and an average interest rate of 2.78%.
Quarterly and Seasonal Fluctuations
We experience seasonal fluctuations in our net sales and results of operations. We typically experience higher net sales in early
spring due to spring sports and annual tax refunds, late summer due to back-to-school shopping and winter due to holiday shopping. In addition, our quarterly results of operations may fluctuate significantly as a result of a variety of
factors, including the timing of new store openings, the amount and timing of net sales contributed by new stores, weather fluctuations, merchandise mix, demand for merchandise driven by local interest in sporting events, and the timing of
sales tax holidays and annual income tax refunds.
Although our operations are influenced by general economic conditions, we do not believe that, historically, inflation has had a
material impact on our results of operations as we are generally able to pass along inflationary increases in costs to our customers. See “Inflation and Other Economic Factors” above.
The following consolidated financial statements and supplementary data of our Company are included in response to this item:
All other schedules are omitted because they are not applicable or the required information is shown in the consolidated financial
statements or notes thereto.
To the Stockholders and Board of Directors
Hibbett Sports, Inc.:
Opinions on the Consolidated Financial Statements and Internal Control Over Financial Reporting
We have audited the accompanying consolidated balance sheets of Hibbett Sports, Inc. and subsidiaries (the Company) as of February 2, 2019 and February 3,
2018, the related consolidated statements of operations, stockholders’ investment, and cash flows for each of the fiscal years in the three-year period ended February 2, 2019 and the related notes (collectively, the consolidated financial
statements). We also have audited the Company’s internal control over financial reporting as of February 2, 2019, based on criteria established in Internal
Control – Integrated Framework (2013) issued by the Committee of Sponsoring Organizations of the Treadway Commission.
In our opinion, the consolidated financial statements referred to above present fairly, in all material respects, the financial position of the Company as
of February 2, 2019 and February 3, 2018, and the results of its operations and its cash flows for each of the fiscal years in the three-year period ended February 2, 2019, in conformity with U.S. generally accepted accounting principles. Also
in our opinion, the Company maintained, in all material respects, effective internal control over financial reporting as of February 2, 2019, based on criteria established in Internal Control – Integrated Framework (2013) issued by the Committee of Sponsoring Organizations of the Treadway Commission.
The Company acquired City Gear, LLC (City Gear) during fiscal year 2019, and management excluded from its assessment of the effectiveness of the Company’s
internal control over financial reporting as of February 2, 2019, City Gear’s internal control over financial reporting associated with total assets of $123.8 million and net sales of $49.1 million included in the consolidated financial
statements of the Company as of and for the fiscal year ended February 2, 2019. Our audit of internal control over financial reporting of the Company also excluded an evaluation of the internal control over financial reporting of City Gear.
Basis for Opinions
The Company’s management is responsible for these consolidated financial statements, for maintaining effective internal control over financial reporting,
and for its assessment of the effectiveness of internal control over financial reporting, included in the accompanying Management’s Report on Internal Control Over Financial Reporting. Our responsibility is to express an opinion on the
Company’s consolidated financial statements and an opinion on the Company’s internal control over financial reporting based on our audits. We are a public accounting firm registered with the Public Company Accounting Oversight Board (United
States) (PCAOB) and are required to be independent with respect to the Company in accordance with the U.S. federal securities laws and the applicable rules and regulations of the Securities and Exchange Commission and the PCAOB.
We conducted our audits in accordance with the standards of the PCAOB. Those standards require that we plan and perform the audits to obtain reasonable
assurance about whether the consolidated financial statements are free of material misstatement, whether due to error or fraud, and whether effective internal control over financial reporting was maintained in all material respects.
Our audits of the consolidated financial statements included performing procedures to assess the risks of material misstatement of the consolidated
financial statements, whether due to error or fraud, and performing procedures that respond to those risks. Such procedures included examining, on a test basis, evidence regarding the amounts and disclosures in the consolidated financial
statements. Our audits also included evaluating the accounting principles used and significant estimates made by management, as well as evaluating the overall presentation of the consolidated financial statements. Our audit of internal control
over financial reporting included obtaining an understanding of internal control over financial reporting, assessing the risk that a material weakness exists, and testing and evaluating the design and operating effectiveness of internal control
based on the assessed risk. Our audits also included performing such other procedures as we considered necessary in the circumstances. We believe that our audits provide a reasonable basis for our opinions.
Definition and Limitations of Internal Control Over Financial Reporting
A company’s internal control over financial reporting is a process designed to provide reasonable assurance regarding the reliability of financial
reporting and the preparation of financial statements for external purposes in accordance with generally accepted accounting principles. A company’s internal control over financial reporting includes those policies and procedures that (1)
pertain to the maintenance of records that, in reasonable detail, accurately and fairly reflect the transactions and dispositions of the assets of the company; (2) provide reasonable assurance that transactions are recorded as necessary to
permit preparation of financial statements in accordance with generally accepted accounting principles, and that receipts and expenditures of the company are being made only in accordance with authorizations of management and directors of the
company; and (3) provide reasonable assurance regarding prevention or timely detection of unauthorized acquisition, use, or disposition of the company’s assets that could have a material effect on the financial statements.
Because of its inherent limitations, internal control over financial reporting may not prevent or detect misstatements. Also, projections of any
evaluation of effectiveness to future periods are subject to the risk that controls may become inadequate because of changes in conditions, or that the degree of compliance with the policies or procedures may deteriorate.
/s/ KPMG LLP
We have served as the Company’s auditor since 2002.
Birmingham, Alabama
April 18, 2019
Hibbett Sports, Inc. and Subsidiaries
(In thousands, except share and per share information)
|
ASSETS
|
February 2, 2019
|
February 3, 2018
|
||||||
|
Current Assets:
|
||||||||
|
Cash and cash equivalents
|
$
|
61,756
|
$
|
73,544
|
||||
|
Receivables, net
|
9,470
|
6,599
|
||||||
|
Inventories, net
|
280,287
|
253,201
|
||||||
|
Prepaid expenses and other
|
16,343
|
13,430
|
||||||
|
Total current assets
|
367,856
|
346,774
|
||||||
|
Property and equipment, net
|
115,394
|
109,698
|
||||||
|
Goodwill
|
23,133
|
-
|
||||||
|
Trade name intangible asset
|
32,400
|
-
|
||||||
|
Deferred income taxes, net
|
2,278
|
2,176
|
||||||
|
Other assets, net
|
5,004
|
3,198
|
||||||
|
Total Assets
|
$
|
546,065
|
$
|
461,846
|
||||
|
LIABILITIES AND STOCKHOLDERS’ INVESTMENT
|
||||||||
|
Current Liabilities:
|
||||||||
|
Accounts payable
|
$
|
107,315
|
$
|
93,435
|
||||
|
Credit facilities
|
35,000
|
-
|
||||||
|
Capital lease obligations
|
1,017
|
663
|
||||||
|
Accrued payroll expenses
|
13,929
|
10,424
|
||||||
|
Deferred rent
|
5,838
|
5,909
|
||||||
|
Other accrued expenses
|
10,174
|
5,136
|
||||||
|
Total current liabilities
|
173,273
|
115,567
|
||||||
|
Capital lease obligations
|
1,994
|
2,522
|
||||||
|
Deferred rent
|
19,522
|
20,291
|
||||||
|
Unrecognized tax benefits
|
1,401
|
1,294
|
||||||
|
Other liabilities
|
13,826
|
2,576
|
||||||
|
Total liabilities
|
210,016
|
142,250
|
||||||
|
Stockholders’ Investment:
|
||||||||
|
Preferred stock, $.01 par value, 1,000,000 shares authorized, no shares issued
|
-
|
-
|
||||||
|
Common stock, $.01 par value, 80,000,000 shares authorized, 38,983,232 and 38,862,929 shares
issued at February 2, 2019 and February 3, 2018, respectively
|
390
|
389
|
||||||
|
Paid-in capital
|
185,752
|
180,536
|
||||||
|
Retained earnings
|
759,677
|
731,901
|
||||||
|
Treasury stock, at cost, 20,686,242 and 19,910,291 shares repurchased at February 2, 2019 and
February 3, 2018, respectively
|
(609,770
|
)
|
(593,230
|
)
|
||||
|
Total stockholders’ investment
|
336,049
|
319,596
|
||||||
|
Total Liabilities and Stockholders’ Investment
|
$
|
546,065
|
$
|
461,846
|
||||
See accompanying notes to consolidated financial statements.
Hibbett Sports, Inc. and Subsidiaries
(In thousands, except per share information)
|
Fiscal Year Ended
|
||||||||||||
|
February 2, 2019
(52 weeks) |
February 3, 2018
(53 weeks) |
January 28, 2017
(52 weeks) |
||||||||||
|
Net sales
|
$
|
1,008,682
|
$
|
968,219
|
$
|
972,960
|
||||||
|
Cost of goods sold
|
679,947
|
655,502
|
634,364
|
|||||||||
|
Gross margin
|
328,735
|
312,717
|
338,596
|
|||||||||
|
Store operating, selling and administrative expenses
|
264,142
|
231,832
|
222,785
|
|||||||||
|
Depreciation and amortization
|
27,052
|
24,207
|
19,047
|
|||||||||
|
Operating income
|
37,541
|
56,678
|
96,764
|
|||||||||
|
Interest income
|
731
|
39
|
24
|
|||||||||
|
Interest expense
|
(714
|
)
|
(270
|
)
|
(292
|
)
|
||||||
|
Interest income (expense), net
|
17
|
(231
|
)
|
(268
|
)
|
|||||||
|
Income before provision for income taxes
|
37,558
|
56,447
|
96,496
|
|||||||||
|
Provision for income taxes
|
9,137
|
21,417
|
35,421
|
|||||||||
|
Net income
|
$
|
28,421
|
$
|
35,030
|
$
|
61,075
|
||||||
|
Basic earnings per share
|
$
|
1.52
|
$
|
1.72
|
$
|
2.75
|
||||||
|
Diluted earnings per share
|
$
|
1.51
|
$
|
1.71
|
$
|
2.72
|
||||||
|
Weighted average shares outstanding:
|
||||||||||||
|
Basic
|
18,644
|
20,347
|
22,240
|
|||||||||
|
Diluted
|
18,826
|
20,450
|
22,427
|
|||||||||
See accompanying notes to consolidated financial statements.
Hibbett Sports, Inc. and Subsidiaries
(In thousands)
|
Fiscal Year Ended
|
||||||||||||
|
|
February 2,
(52 weeks)2019 |
February 3,
2018
(53 weeks) |
January 28,
2017
(52 weeks) |
|||||||||
|
Cash Flows From Operating Activities:
|
||||||||||||
|
Net income
|
$
|
28,421
|
$
|
35,030
|
$
|
61,075
|
||||||
|
Adjustments to reconcile net income to net cash provided by operating activities:
|
||||||||||||
|
Depreciation and amortization
|
27,052
|
24,207
|
19,047
|
|||||||||
|
Amortization of inventory step-up
|
1,911
|
-
|
-
|
|||||||||
|
Deferred income taxes and unrecognized income tax benefit, net
|
244
|
3,488
|
1,418
|
|||||||||
|
Loss on disposal and write-down of assets, net
|
940
|
597
|
238
|
|||||||||
|
Stock-based compensation
|
4,316
|
3,880
|
4,592
|
|||||||||
|
Other non-cash adjustments
|
(104
|
)
|
-
|
(99
|
)
|
|||||||
|
Changes in operating assets and liabilities:
|
||||||||||||
|
Receivables, net
|
1,422
|
2,303
|
(1,826
|
)
|
||||||||
|
Inventories, net
|
16,804
|
27,500
|
2,398
|
|||||||||
|
Prepaid expenses and other
|
(501
|
)
|
(3,074
|
)
|
(1,712
|
)
|
||||||
|
Other assets
|
(162
|
)
|
185
|
351
|
||||||||
|
Accounts payable
|
(9,927
|
)
|
16,389
|
(11,410
|
)
|
|||||||
|
Deferred rent
|
(839
|
)
|
(514
|
)
|
3,623
|
|||||||
|
Accrued expenses and other
|
3,840
|
1,935
|
980
|
|||||||||
|
Net cash provided by operating activities
|
73,417
|
111,926
|
78,675
|
|||||||||
|
|
||||||||||||
|
Cash Flows From Investing Activities:
|
||||||||||||
|
Capital expenditures
|
(17,696
|
)
|
(23,081
|
)
|
(29,733
|
)
|
||||||
|
Acquisition of City Gear
|
(86,837
|
)
|
-
|
-
|
||||||||
|
Proceeds from sale of property and equipment
|
330
|
288
|
154
|
|||||||||
|
Other
|
332
|
(107
|
)
|
170
|
||||||||
|
Net cash used in investing activities
|
(103,871
|
)
|
(22,900
|
)
|
(29,409
|
)
|
||||||
|
|
||||||||||||
|
Cash Flows From Financing Activities:
|
||||||||||||
|
Cash used for stock repurchases
|
(16,124
|
)
|
(53,794
|
)
|
(42,115
|
)
|
||||||
|
Borrowings under credit facilities, net
|
35,000
|
-
|
-
|
|||||||||
|
Payments on capital lease obligations
|
(695
|
)
|
(601
|
)
|
(485
|
)
|
||||||
|
Excess tax benefit from stock option exercises
|
-
|
-
|
99
|
|||||||||
|
Cash used to settle net share equity awards
|
(416
|
)
|
(712
|
)
|
(943
|
)
|
||||||
|
Proceeds from options exercised and purchase of shares under the employee stock purchase plan
|
901
|
667
|
862
|
|||||||||
|
Net cash provided by (used in) financing activities
|
18,666
|
(54,440
|
)
|
(42,582
|
)
|
|||||||
|
|
||||||||||||
|
Net (decrease) increase in cash and cash equivalents
|
(11,788
|
)
|
34,586
|
6,684
|
||||||||
|
Cash and cash equivalents, beginning of year
|
73,544
|
38,958
|
32,274
|
|||||||||
|
Cash and cash equivalents, end of year
|
$
|
61,756
|
$
|
73,544
|
$
|
38,958
|
||||||
|
|
||||||||||||
|
Supplemental Disclosures of Cash Flow Information:
|
||||||||||||
|
Cash paid during the year for:
|
||||||||||||
|
Interest
|
$
|
723
|
$
|
261
|
$
|
285
|
||||||
|
Income taxes, net of refunds
|
$
|
8,261
|
$
|
15,104
|
$
|
35,057
|
||||||
|
|
||||||||||||
|
Supplemental Schedule of Non-Cash Activities:
|
||||||||||||
|
Property and equipment additions under capital leases
|
$
|
773
|
$
|
352
|
$
|
342
|
||||||
See accompanying notes to consolidated financial statements.
Hibbett Sports, Inc. and Subsidiaries
(in thousands)
|
Common Stock
|
Treasury Stock
|
|||||||||||||||||||||||||||
|
Number of
Shares
|
Amount
|
Paid-In
Capital
|
Retained
Earnings
|
Number of
Shares
|
Amount
|
Total
Stockholders’
Investment
|
||||||||||||||||||||||
|
Balance-January 30, 2016
|
38,628
|
$
|
386
|
$
|
169,543
|
$
|
636,583
|
15,832
|
$
|
(495,666
|
)
|
$
|
310,846
|
|||||||||||||||
|
Net income
|
-
|
-
|
-
|
61,075
|
-
|
-
|
61,075
|
|||||||||||||||||||||
|
Issuance of shares through the Company’s equity plans
|
111
|
1
|
960
|
-
|
-
|
-
|
961
|
|||||||||||||||||||||
|
Adjustment to income tax benefit from exercises of employee stock options
|
-
|
-
|
(376
|
)
|
-
|
-
|
-
|
(376
|
)
|
|||||||||||||||||||
|
Purchase of shares under the stock repurchase program
|
-
|
-
|
-
|
-
|
1,209
|
(42,115
|
)
|
(42,115
|
)
|
|||||||||||||||||||
|
Settlement of net share equity awards
|
-
|
-
|
-
|
-
|
26
|
(943
|
)
|
(943
|
)
|
|||||||||||||||||||
|
Stock-based compensation
|
-
|
-
|
4,592
|
-
|
-
|
-
|
4,592
|
|||||||||||||||||||||
|
Balance-January 28, 2017
|
38,739
|
387
|
174,719
|
697,658
|
17,067
|
(538,724
|
)
|
334,040
|
||||||||||||||||||||
|
Net income
|
-
|
-
|
-
|
35,030
|
-
|
-
|
35,030
|
|||||||||||||||||||||
|
Issuance of shares through the Company’s equity plans
|
124
|
2
|
665
|
-
|
-
|
-
|
667
|
|||||||||||||||||||||
|
Adjustment for adoption of accounting standard
|
-
|
-
|
1,272
|
(787
|
)
|
-
|
-
|
485
|
||||||||||||||||||||
|
Purchase of shares under the stock repurchase program
|
-
|
-
|
-
|
-
|
2,818
|
(53,794
|
)
|
(53,794
|
)
|
|||||||||||||||||||
|
Settlement of net share equity awards
|
-
|
-
|
-
|
-
|
25
|
(712
|
)
|
(712
|
)
|
|||||||||||||||||||
|
Stock-based compensation
|
-
|
-
|
3,880
|
-
|
-
|
-
|
3,880
|
|||||||||||||||||||||
|
Balance-February 3, 2018
|
38,863
|
389
|
180,536
|
731,901
|
19,910
|
(593,230
|
)
|
319,596
|
||||||||||||||||||||
|
Net income
|
-
|
-
|
-
|
28,421
|
-
|
-
|
28,421
|
|||||||||||||||||||||
|
Issuance of shares through the Company’s equity plans
|
120
|
1
|
900
|
-
|
-
|
-
|
901
|
|||||||||||||||||||||
|
Adjustment for adoption of accounting standard
|
-
|
-
|
-
|
(645
|
)
|
-
|
-
|
(645
|
)
|
|||||||||||||||||||
|
Purchase of shares under the stock repurchase program
|
-
|
-
|
-
|
-
|
757
|
(16,124
|
)
|
(16,124
|
)
|
|||||||||||||||||||
|
Settlement of net share equity awards
|
-
|
-
|
-
|
-
|
19
|
(416
|
)
|
(416
|
)
|
|||||||||||||||||||
|
Stock-based compensation
|
-
|
-
|
4,316
|
-
|
-
|
-
|
4,316
|
|||||||||||||||||||||
|
Balance-February 2, 2019
|
38,983
|
$
|
390
|
$
|
185,752
|
$
|
759,677
|
20,686
|
$
|
(609,770
|
)
|
$
|
336,049
|
|||||||||||||||
See accompanying notes to consolidated financial statements.
Hibbett Sports, Inc. and Subsidiaries
Note 1. Basis of Presentation and Summary of Critical and Significant Accounting Policies
Business
Hibbett Sports, Inc. is a leading athletic-inspired fashion retailer primarily located in small and mid-sized communities across the
country. References to “we,” “our,” “us”, “Hibbett” and the “Company” refer to Hibbett Sports, Inc. and its subsidiaries as well as its predecessors. Our fiscal year ends on the Saturday closest to January 31 of each year. The consolidated
statements of operations for Fiscal 2019, Fiscal 2018 and Fiscal 2017 include 52 weeks, 53 week and 52 weeks of operations, respectively. Our merchandise assortment features a core selection of brand name merchandise emphasizing athletic
footwear, athletic and fashion apparel, team sports equipment and related accessories. We complement this core assortment with a selection of localized footwear, apparel and accessories designed to appeal to a wide range of customers within
each market.
Acquisition
We acquired City Gear, LLC (City Gear) on November 5, 2018 with an effective date of November 4, 2018 for approximately $88.0 million,
including $86.8 million of cash paid. (See Note 3 – Acquisition)
Principles of Consolidation
The consolidated financial statements of our Company include its accounts and the accounts of all wholly-owned subsidiaries. All
significant intercompany balances and transactions have been eliminated in consolidation. Occasionally, certain reclassifications are made to conform previously reported data to the current presentation. Such reclassifications have no impact
on total assets, total liabilities, net income or stockholders’ investment in any of the years presented.
Use of Estimates in the Preparation of Consolidated Financial Statements
The preparation of consolidated financial statements in conformity with U.S. Generally Accepted Accounting Principles (U.S. GAAP)
requires management to make certain estimates and assumptions that affect the reported amount of assets and liabilities, revenues and expenses, and the disclosure of intangible assets and intangible and contingent liabilities at the date of the
financial statements. We believe our estimates are reasonable; however, the assumptions used by management could change significantly in future estimates due to changes in circumstances and actual results could differ materially from those
estimates.
Reportable Segments
Hibbett Sports, Inc., through its subsidiaries, is a leading athletic-inspired fashion retailer with more than 1,100 stores operating
under the Hibbett Sporting Goods and City Gear banners and an omni-channel platform. We identify our operating segments according to how our business activities are managed and evaluated by our chief executive officer who is our chief
operating decision maker. Our shopping channels primarily include store locations and websites or apps. Store sales are primarily filled from the store’s inventory but may also be shipped from a different store location or our logistics
network if an item is not available at the original store. Direct-to-consumer orders are generally shipped to our customers from a store, our logistics network or some combination thereof depending on the availability of the desired item.
Given the economic similarity of the store formats, the products offered for sale, the type of customers, the methods of distribution
and how our Company is managed, our operations constitute only one reportable segment.
Vendor Arrangements
We enter into arrangements with some of our vendors that entitle us to a partial refund of the cost of merchandise purchased during the
year or reimbursement of certain costs we incur to advertise or otherwise promote their product. Volume-based rebates, supported by vendor agreements, are estimated throughout the year and reduce the cost of inventories and cost of goods sold
during the year. This estimate is regularly monitored and adjusted for current or anticipated changes in purchase levels and for sales activity.
We also receive consideration from vendors through a variety of other programs, including markdown reimbursements, vendor compliance
charges and defective merchandise credits. If the payment is a reimbursement for costs incurred, it is recognized as an offset against those related costs; otherwise, it is treated as a reduction to the cost of merchandise. Markdown
reimbursements related to merchandise that has been sold are negotiated by our merchandising teams and are credited directly to cost of goods sold in the period received. If vendor funds are received prior to merchandise being sold, they are
recorded as a reduction of merchandise cost. Vendor compliance charges and defective merchandise credits reduce the cost of inventories.
Marketing
We expense marketing costs when incurred. We participate in various marketing cooperative programs with our vendors, who, under these
programs, reimburse us for certain costs incurred. A receivable for cooperative marketing to be reimbursed is recorded as a decrease to expense as advertisements are run.
The following table presents the components of our marketing expense (in thousands):
|
Fiscal Year Ended
|
||||||||||||
|
February 2,
2019
(52 weeks) |
February 3,
2018
(53 weeks) |
January 28,
2017
(52 weeks) |
||||||||||
|
Gross marketing costs
|
$
|
17,608
|
$
|
13,356
|
$
|
10,382
|
||||||
|
Marketing reimbursements
|
(2,850
|
)
|
(3,010
|
)
|
(3,319
|
)
|
||||||
|
Net marketing costs
|
$
|
14,758
|
$
|
10,346
|
$
|
7,063
|
||||||
Cost of Goods Sold
We include merchandise costs, store occupancy costs, logistics-related occupancy and operating costs and ship-to-home freight in
cost of goods sold.
Stock Repurchase Program
In November 2018, our Board authorized the continuation of our existing Stock Repurchase Program (2018 Program) established in November
2015 (2015 Program) until January 29, 2022. The Program authorizes repurchases of our common stock in open market or negotiated transactions, with the amount and timing of repurchases dependent on market conditions and at the discretion of our
management. In addition to the 2018 Program, we also acquire shares of our common stock from holders of restricted stock unit awards to satisfy tax withholding requirements due at vesting.
Under the 2015 Program, the Board of Directors authorized up to $300.0 million to repurchase our common stock through February 2,
2019. The 2015 Program replaced an existing plan that was adopted in November 2012 (2012 Program).
Under the 2018 Program and 2015 Program, we repurchased 0.8 million shares of our common stock during Fiscal 2019 at a cost of $16.5
million, including 18,765 shares acquired from holders of restricted stock to satisfy tax withholding requirements of $0.4 million. Under the 2015 Program, we repurchased 2.8 million shares of our common stock during Fiscal 2018 at a cost of
$54.5 million, including 24,432 shares acquired from holders of restricted stock to satisfy tax withholding requirements of $0.7 million.
Historically, under all stock repurchase authorizations, we have repurchased a total of 20.7 million shares of our common stock at an
approximate cost of $609.8 million as of February 2, 2019 and had approximately $188.0 million remaining under the 2018 Program for stock repurchases. Shares acquired from holders of restricted stock unit awards to satisfy tax withholding
requirements do not reduce the authorization.
Cash and Cash Equivalents
We consider all short-term, highly liquid investments with original maturities of 90 days or less, including commercial paper and money
market funds, to be cash equivalents. Amounts due from third-party credit card processors for the settlement of debit and credit card transactions are included as cash equivalents as they are generally collected within three business days.
Cash equivalents related to credit and debit card transactions at February 2, 2019 and February 3, 2018 were $5.5 million and $3.9 million, respectively.
Investments
We hold certain trading securities as investments in trust for the Hibbett Sports, Inc. Supplemental 401(k) Plan (Supplemental Plan)
and the Hibbett Sports, Inc. Executive Voluntary Deferral Plan (Deferral Plan). At February 2, 2019, we had $2.5 million of investments of which $0.1 million was included in prepaid expenses and other and $2.4 million was included in other
assets, net. At February 3, 2018, we had $2.9 million of investments of which $0.5 million was included in prepaid expenses and other and $2.4 million was included in other assets, net. Net unrealized holding losses for Fiscal 2019 were $0.3
million and net unrealized holding gains for Fiscal 2018 were $0.3 million.
Purchase Price Allocation
For the City Gear acquisition, we allocated the purchase price to the various tangible and intangible assets acquired and liabilities
assumed, based on their estimated fair values, which are preliminary as of February 2, 2019. Determining the fair value of certain assets and liabilities is subjective in nature and often involves the use of significant estimates and
assumptions, which are inherently uncertain. We engaged third party experts to assist in the determination of fair value for complex assets and liabilities. Many of these estimates and assumptions used to determine fair value, such as those
used for intangible assets are made based on forecasted information and discount rates. In addition, the judgments made in determining the estimated fair value assigned to each class of assets acquired and liabilities assumed, as well as asset
lives, can materially impact our results of operations.
The final purchase price allocation will be completed after asset and liability valuations are finalized. This final valuation will be
based on the actual assets and liabilities of City Gear that exist as of the acquisition date and goodwill may be different than the balance reflected in the consolidated balance sheet. Any final adjustments may change the allocation of the
purchase price, which could affect the fair value assigned to the assets and liabilities and could result in significant changes to the consolidated financial data.
Goodwill represents the excess of the actual purchase price of City Gear over the estimated fair value of City Gear’s net assets as of
the date of acquisition. The computations require management to make estimates and assumptions.
Intangible assets consist of trademarks and below-market leases resulting from the acquisition of City Gear. The fair value of
trademarks was determined using the “income approach”, which requires a forecast of all expected future cash flows. The fair value of the below-market lease intangible was measured based on the present value of the difference between the
contractual amounts to be paid pursuant to the lease and an estimate of current fair market lease rates measured over the non-cancelable remaining term of the lease. Amortization of the acquired below-market lease intangible is recognized as
amortization expense within the consolidated statement of operations.
Intangible liabilities consist of above-market leases resulting from the acquisition of City Gear. The fair value of the above-market
lease intangible was measured based on the present value of the difference between the contractual amounts to be paid pursuant to the lease and an estimate of current fair market lease rates measured over the non-cancelable remaining term of
the lease. Amortization of the acquired above-market lease intangible is recognized as amortization expense within the consolidated statement of operations.
The below-market and above-market lease intangibles consist of short-term and long-term portions. Their presentation on the
consolidated balance sheet and balance (in thousands) as of February 2, 2019 are as follows:
|
Account
|
Balance Sheet Presentation
|
Balance
2/2/2019
|
||||||
|
Short-term below-market lease intangible
|
Current asset
|
Prepaid expenses and other
|
$
|
320
|
||||
|
Long-term below-market lease intangible
|
Non-current asset
|
Other assets, net
|
$
|
1,201
|
||||
|
Short-term above-market lease intangible
|
Current liability
|
Other accrued expenses
|
$
|
605
|
||||
|
Long-term above-market lease intangible
|
Non-current liability
|
Other liabilities
|
$
|
1,966
|
||||
The net amortization recognized in Fiscal 2019 was immaterial.
Receivables
Receivables consist primarily of tenant allowances due from landlords and cooperative marketing and other amounts due from vendors. We
analyze receivables for collectability based on aging of individual components, underlying contractual terms and economic conditions. Recorded amounts are deemed to be collectible.
Inventories
Inventories are valued using the lower of weighted average cost or net realizable value method. Items are removed from inventory using
the weighted average cost method.
Lower of Cost and Net Realizable Value: We
regularly review inventories to determine if the carrying value exceeds net realizable value, and we record an accrual to reduce the carrying value to net realizable value as necessary. We account for obsolescence as part of our lower of cost
and net realizable value accrual based on historical trends and specific identification. As of February 2, 2019 and February 3, 2018, the accrual was $4.5 million and $5.2 million, respectively. A determination of net realizable value
requires significant judgment.
Shrink Reserves: We accrue for inventory
shrinkage based on the actual historical results of our physical inventory counts. These estimates are compared to actual results as physical inventory counts are performed and reconciled to the general ledger. Physical inventory counts are
performed on a cyclical basis. As of February 2, 2019 and February 3, 2018, the accrual was $1.6 million and $1.4 million, respectively.
Inventory Purchase Concentration: Our business is dependent to a significant degree upon close relationships with our vendors. Our largest vendor, Nike, represented
65.4%, 57.9% and 57.0% of our purchases for Fiscal 2019, Fiscal 2018 and Fiscal 2017, respectively. Our second largest vendor, adidas, represented 10.0%, 11.0% and 5.5% of our purchases for Fiscal 2019, Fiscal 2018 and Fiscal 2017,
respectively. Our third largest vendor, Under Armour, represented 5.7%, 10.8% and 16.4% of our purchases for Fiscal 2019, Fiscal 2018 and Fiscal 2017, respectively.
Property and Equipment
Property and equipment are recorded at cost and include assets acquired through capital leases. Property and equipment as of February
2, 2019 and February 3, 2018 consists of the following (in thousands):
|
February 2,
2019
|
February 3,
2018
|
|||||||
|
Land
|
$
|
7,277
|
$
|
7,277
|
||||
|
Buildings
|
21,311
|
21,311
|
||||||
|
Buildings under capital lease
|
3,363
|
3,652
|
||||||
|
Equipment
|
96,402
|
93,163
|
||||||
|
Equipment under capital lease
|
678
|
-
|
||||||
|
Automobiles under capital lease
|
1,829
|
1,702
|
||||||
|
Furniture and fixtures
|
36,980
|
34,892
|
||||||
|
Leasehold improvements
|
101,572
|
91,218
|
||||||
|
Construction in progress
|
2,080
|
4,795
|
||||||
|
Total property and equipment
|
271,492
|
258,010
|
||||||
|
Less: accumulated depreciation and amortization
|
156,098
|
148,312
|
||||||
|
Total property and equipment, net
|
$
|
115,394
|
$
|
109,698
|
||||
Depreciation on property and equipment is principally provided using the straight-line method over the following estimated service
lives:
|
Buildings
|
39 years
|
|
Leasehold improvements
|
3 – 10 years
|
|
Furniture and fixtures
|
7 years
|
|
Equipment
|
3 – 7 years
|
In the case of leasehold improvements, we calculate depreciation using the shorter of the term of the underlying leases or the
estimated economic lives of the improvements. The term of the lease includes renewal option periods only in instances in which the exercise of the renewal option can be reasonably assured and failure to exercise such option would result in an
economic penalty. We continually reassess the remaining useful life of leasehold improvements in light of store closing plans.
Construction in progress has historically been comprised primarily of property and equipment related to unopened stores and amounts
associated with technology upgrades at period-end. At February 2, 2019, approximately 69% of the construction in progress balance was comprised of costs associated with stores. The remaining balance consisted of costs associated with our
technology initiatives.
Maintenance and repairs are charged to expense as incurred. The cost and accumulated depreciation of assets sold, retired or otherwise
disposed of are removed from property and equipment and the related gain or loss is credited or charged to net income, net of proceeds received.
Goodwill and Indefinite-Lived Intangible Assets
Goodwill and the City Gear tradename are indefinite-lived assets which are not amortized but rather tested for impairment at
least annually, or on an interim basis if events and circumstances have occurred that indicate that is more likely than not that an asset is impaired. Such events or circumstances could include, but are not limited to, significant negative
industry or economic trends, unanticipated changes in the competitive environment and a significant sustained decline in the market price of our stock. If it is more likely than not that an asset is impaired, the amount that the carrying value
exceeds the fair value is recorded as an impairment charge to current income. No impairment of these assets existed as of February 2, 2019.
Long-Lived Assets
We continually evaluate whether events and circumstances have occurred that indicate the carrying amount of long-lived assets may
be may not be recoverable. If circumstances require a long-lived asset or asset group be tested for possible impairment, our policy is to first compare undiscounted cash flows expected to be generated by that asset or asset group over its
remaining life to its carrying amount. If the carrying amount of the long-lived asset or asset group is not recoverable on an undiscounted cash flow basis, an impairment loss is recognized as a charge to current income to the extent that
the carrying amount exceeds its fair value. Fair value is determined through various valuation techniques including discounted cash flow models, quoted market values and third-party independent appraisals, as considered necessary. Assets
or asset groups to be disposed of are reported at the lower of their carrying value or fair value less any costs of disposition. Evaluation of asset impairment requires significant judgment.
Capitalized Interest
We capitalize interest on borrowed funds during the construction of certain property and equipment. No interest costs were
capitalized in Fiscal 2019, Fiscal 2018 or Fiscal 2017.
Deferred Rent
Deferred rent primarily consists of step rent and allowances from landlords related to our leased properties. Step rent represents
the difference between actual operating lease payments due and straight-line rent expense, which we record over the term of the lease, including the build-out period. This amount is recorded as deferred rent in the early years of the
lease, when cash payments are generally lower than straight-line rent expense, and reduced in the later years of the lease when payments begin to exceed the straight-line rent expense. Landlord allowances are generally comprised of amounts
received and/or promised to us by landlords and may be received in the form of cash or free rent. For the cash component, we record a receivable from the landlord in accordance with the terms of the lease and a deferred rent liability.
This deferred rent is amortized into net income (through lower rent expense) over the term (including the pre-opening build-out period) of the applicable lease, and the receivable is reduced as amounts are realized from the landlord.
In our consolidated statements of cash flows, the current and long-term portions of landlord allowances are included as changes in
cash flows from operations. The liability for the current portion of unamortized landlord allowances was $4.9 million and $5.1 million at February 2, 2019 and February 3, 2018, respectively. The liability for the long-term portion of
unamortized landlord allowances was $14.8 million and $15.1 million at February 2, 2019 and February 3, 2018, respectively. We estimate the non-cash portion of landlord allowances was $0.1 million and $1.2 million at February 2, 2019 and
February 3, 2018, respectively.
Revenue Recognition
In Fiscal 2019, we recognize revenue in accordance with Accounting Standards Codification (ASC) Topic 606, Revenue from Contracts with Customers when control of the merchandise is transferred to our customer. Sales are recorded net of expected returns at the time the customer
takes possession of the merchandise. Net sales exclude sales taxes because we are a pass-through conduit for collecting and remitting these taxes.
Retail Store Sales: For merchandise sold
in our stores, revenue is recognized at the point of sale when tender is accepted and the customer takes possession of the merchandise.
Retail Store Orders: Retail store
customers may order merchandise available in other retail store locations for pickup in the selling store at a later date. Customers make a deposit with the remaining balance due at pickup. These deposits are recorded as deferred revenue
until the transaction is completed and the customer takes possession of the merchandise. Retail store customers may also order merchandise to be shipped to home. Payment is received in full at the time of order and recorded as deferred
revenue until delivery.
Layaways: We offer a retail store
program giving customers the option of paying a deposit and placing merchandise on layaway. The customer may make further payments in installments, but the full purchase price must be received by us within 30 days. The payments are
recorded as deferred revenue until the transaction is completed and the customer takes possession of the merchandise.
Digital Channel Sales: For merchandise
shipped to home, customer payment is received when the order ships. Revenue is deferred until control passes to the customer at delivery. Shipping and handling costs billed to customers are included in net sales.
Customer Loyalty Programs: We offer two
customer loyalty programs; the Hibbett Rewards program and the City Gear Reward Points program. Upon registration and in accordance with the terms of the programs, customers earn points on certain purchases. Points convert into rewards at
defined thresholds. The short-term future performance obligation liability is estimated at each reporting period based on historical conversion and redemption patterns. The liability is included in other accrued expenses on our
consolidated balance sheets and was $2.2 million and $0.2 million at February 2, 2019 and February 3, 2018, respectively.
Gift Cards: Proceeds received from the
issuance of our non-expiring gift cards are initially recorded as deferred revenue. Revenue is subsequently recognized at the time the customer redeems the gift cards and takes possession of the merchandise. Unredeemed gift cards are
recorded in accounts payable on our consolidated balance sheet.
The net deferred revenue liability for gift cards, customer orders and layaways at February 2, 2019 and February 3, 2018 was $7.5
million and $6.2 million, respectively, recognized in accounts payable on our consolidated balance sheets. In Fiscal 2019, gift card breakage income was recognized in net sales in proportion to the redemption pattern of rights exercised by
the customer and was $0.6 million. During Fiscal 2018 and Fiscal 2017, income from unredeemed gift cards was recognized on our consolidated statements of operations as a reduction to store operating, selling and administrative expenses
when the likelihood of redemption was deemed remote. Gift card breakage was not material in Fiscal 2018 or Fiscal 2017.
During the fiscal year ended February 2, 2019, $2.1 million of gift card deferred revenue from prior periods was realized.
Return Sales: The liability for return
sales is estimated at each reporting period based on historical return patterns and is recognized at the transaction price. The liability is included in accounts payable on our consolidated balance sheets. We also recognize a return asset
and a corresponding adjustment to cost of goods sold for our right to recover the merchandise returned by the customer. This right to recover the asset is included in net inventory on our consolidated balance sheet at the former carrying
value of the merchandise less any expected recovery costs which was $0.8 million at February 2, 2019.
Revenues disaggregated by major product categories are as follows (in thousands):
|
Fiscal 2019
(52 weeks)
|
Fiscal 2018
(53 weeks)
|
Fiscal 2017
(52 weeks)
|
||||||||||
|
Footwear
|
$
|
579,766
|
$
|
531,552
|
$
|
505,939
|
||||||
|
Apparel
|
276,731
|
269,512
|
282,158
|
|||||||||
|
Equipment
|
152,185
|
167,155
|
184,862
|
|||||||||
|
$
|
1,008,682
|
$
|
968,219
|
$
|
972,960
|
|||||||
Store Opening and Closing Costs
New store opening costs, including pre-opening costs, are charged to expense as incurred. Store opening costs primarily include
payroll expenses, training costs and straight-line rent expenses. All pre-opening costs are included in store operating, selling and administrative expenses as a part of operating expenses.
We consider individual store closings to be a normal part of operations and regularly review store performance against
expectations. Costs associated with store closings are recognized at the time of closing or when a liability has been incurred. These costs were not significant in Fiscal 2018, Fiscal 2017 or Fiscal 2016.
Insurance Accrual
We are self-insured for a significant portion of our health, workers’ compensation and other business insurance. Liabilities
associated with the risks that are retained by us are estimated, in part, by considering our historical claims experience. The estimated accruals for these liabilities could be affected if future occurrences and claims differ from our
assumptions. To minimize our potential exposure, we carry stop-loss insurance that reimburses us for losses over prescribed amounts per covered person per year. As of February 2, 2019 and February 3, 2018, the accrual for these
liabilities was not material.
Sales Returns
Net sales returns were $47.7 million for Fiscal 2019, $43.8 million for Fiscal 2018 and $37.8 million for Fiscal 2017 and. The
accrual for the effect of estimated returns was not material as of February 2, 2019 and February 3, 2018.
|
Note 2.
|
Recent Accounting Pronouncements
|
Standards that were adopted
In May 2014, the Financial Accounting Standards Board (FASB) issued a new standard related to revenue recognition. Under ASU
2014-09, Revenue from Contracts with Customers (Topic 606), revenue is recognized when a customer obtains control of promised goods or services in an
amount that reflects the consideration the entity expects to receive for those goods or services. The standard requires disclosure of the nature, amount, timing and uncertainty of revenue and cash flows arising from contracts with
customers. On February 4, 2018, we adopted ASU 2014-09 using the modified retrospective transition method. Results for reporting periods beginning after February 3, 2018 are presented under Topic 606, while prior period amounts are not
adjusted and continue to be reported in accordance with our historic accounting under Topic 605.
In preparation for implementation of the standard, we identified the revenue streams that would be affected. We then designed and
implemented processes and internal controls to appropriately recognize and present the associated financial information. Based on these efforts, we determined that the adoption of ASU 2014-09 changed the recognition and presentation of:
|
·
|
The stand-alone benefit received by customers through the Hibbett Rewards customer loyalty program recorded as a separate performance
obligation,
|
|
·
|
Gift card breakage income recognized in net sales in proportion to the customer redemption pattern, and
|
|
·
|
The liability for net sales returns recognized on a gross basis including a right to recover asset measured at the former carrying value of
the inventory less any expected recovery costs.
|
We applied ASU 2014-09 only to contracts that were not completed prior to Fiscal 2019. The cumulative effect of initially applying
ASU 2014-09 was a $0.6 million decrease to the opening balance of retained earnings as of February 4, 2018. We expect the adoption to be immaterial to our financial position, results of operations and cash flows on an ongoing basis.
The effect of the adoption of ASU 2014-09 on our consolidated balance sheet as of February 2, 2019 was (in thousands):
|
As Reported
|
ASU 2014-09
Effect (1)
|
Excluding ASU
2014-09 Effect
|
||||||||||
|
Inventories, net
|
$
|
280,287
|
$
|
(130
|
)
|
$
|
280,417
|
|||||
|
Prepaid expenses and other
|
$
|
16,343
|
$
|
(252
|
)
|
$
|
16,595
|
|||||
|
Accounts payable
|
$
|
107,315
|
$
|
693
|
$
|
106,622
|
||||||
|
Other accrued expenses
|
$
|
10,174
|
$
|
(49
|
)
|
$
|
10,223
|
|||||
(1) Does not include the cumulative effect of initially adopting ASU 2014-09 to our consolidated balance sheet as adjusted as of February 4, 2018.
The effect of the adoption of ASU 2014-09 on our consolidated statement of operations for the fifty-two weeks ended February 2,
2019 was (in thousands, except per share amounts):
|
As Reported
|
ASU 2014-09
Effect
|
Excluding ASU
2014-09 Effect
|
||||||||||
|
Net sales
|
$
|
1,008,682
|
$
|
(977
|
)
|
$
|
1,009,659
|
|||||
|
Cost of goods sold
|
$
|
679,947
|
$
|
(110
|
)
|
$
|
680,057
|
|||||
|
Gross margin
|
$
|
328,735
|
$
|
(867
|
)
|
$
|
329,602
|
|||||
|
Store operating, selling and administrative expenses
|
$
|
264,142
|
$
|
(68
|
)
|
$
|
264,210
|
|||||
|
Income before provision for income taxes
|
$
|
37,558
|
$
|
(800
|
)
|
$
|
38,358
|
|||||
|
Provision for income taxes
|
$
|
9,137
|
$
|
(194
|
)
|
$
|
9,331
|
|||||
|
Net income
|
$
|
28,421
|
$
|
(606
|
)
|
$
|
29,027
|
|||||
|
Diluted earnings per share
|
$
|
1.51
|
$
|
(0.03
|
)
|
$
|
1.54
|
|||||
Standards that are not yet adopted
In February 2016, the FASB established Topic 842, Leases, by issuing ASU 2016-02, which requires lessees to recognize leases on-balance sheet and disclose key information about leasing arrangements. Topic 842 was subsequently amended by ASU 2018-01, Land Easement Practical Expedient for Transition to Topic 842; ASU 2018-10, Codification Improvements to Topic 842, Leases; and ASU 2018-11, Targeted Improvements. The new standard establishes a
right-of-use (ROU) model that requires a lessee to recognize a ROU asset and lease liability on the balance sheet for all leases with a term longer than 12 months. Leases will be classified as finance or operating, with classification
affecting the pattern and classification of expense recognition in the income statement.
The new standard is effective for us on February 3, 2019, and we will adopt it as of that date. A modified retrospective
transition approach is required, applying the new standard to all leases existing at the date of initial application. An entity may choose to use either (1) its effective date or (2) the beginning of the earliest comparative period
presented in the financial statements as its date of initial application. We will to use the effective date as our date of initial application. Consequently, financial information will not be restated, and the disclosures required under
the new standard will not be provided for dates and periods prior to February 3, 2019. We have completed the upgrade of our existing lease accounting system to facilitate the adoption.
The new standard provided for optional practical expedients in transition. We expect to elect the “package of practical
expedients”, which permits us not to reassess our prior conclusions about lease identification, lease classification and initial direct costs under the new standard. We will not elect the use-of-hindsight or the practical expedient
pertaining to land easements; the latter not being applicable to us.
On adoption, we will recognize additional operating liabilities of approximately $230.0 million, with corresponding ROU assets of
approximately $210.0 million. The new standard provides practical expedients for an entity’s ongoing accounting. We will elect the short-term lease recognition exemption for certain classes of underlying assets. In doing so, for those
leases that qualify, we will not recognize ROU assets or lease liabilities, including not recognizing ROU assets or lease liabilities for existing short-term leases of those assets in transition. We will elect to combine lease and
non-lease components for certain classes of underlying assets.
Adoption will result in the elimination of the below-market and above-market lease intangible balances acquired during Fiscal 2019,
as these amounts will be included in the ROU assets balance at implementation date.
We continuously monitor and review all current accounting pronouncements and standards from the FASB of U.S. GAAP for applicability
to our operations. As of February 2, 2019, there were no other new pronouncements or interpretations that had or were expected to have a significant impact on our operations.
|
Note 3.
|
Acquisition
|
On November 5, 2018, through our wholly-owned subsidiary, Hibbett Sporting Goods, Inc., we acquired City Gear, a Tennessee limited
liability company. Under the Purchase Agreement, which was unanimously approved by our Board of Directors, we agreed to acquire all the outstanding warrants and equity interests, other than certain preferred membership interests, of City
Gear, a privately held city specialty retailer.
The purchase price was $88.0 million (Purchase Price) in cash payable at the closing of the transaction (Closing), subject to
customary adjustments for City Gear’s cash on hand and net working capital as of the Closing date. The Purchase Agreement provided that a portion of the Purchase Price be used at Closing to pay off and redeem the outstanding preferred
membership interests in City Gear as well as certain other outstanding indebtedness. In addition, the aggregate consideration payable to the Sellers in connection with the transaction includes two contingent payments (Earnout) based on
City Gear’s achievement of certain EBITDA thresholds (as defined in the Purchase Agreement) for the 52-week periods ended February 1, 2020 and January 30, 2021, respectively. The aggregate amount of the Earnout, if any, will not exceed
$25.0 million. The preliminary fair value of the Earnout is recorded in other liabilities on our consolidated balance sheet.
With over 130 stores, the acquisition provides us with substantially greater scale in the athletic specialty market and is an
extension of our strategy to provide high demand, branded products to underserved markets. We incurred $4.3 million in acquisition-related expenses through Fiscal 2019, excluding acquisition-related interest expense, recorded in store
operating, selling and administrative expenses.
The following table summarizes the preliminary estimates of the fair values of the identifiable assets acquired and liabilities
assumed as of the acquisition date of November 4, 2018. The preliminary estimates of the fair value of identifiable assets acquired and liabilities assumed are based on estimates and assumptions and are subject to revisions, which may
result in adjustments to the preliminary values presented below, when management’s estimates are finalized (in thousands):
|
Assets Acquired:
|
||||
|
Current assets:
|
||||
|
Receivables
|
3,168
|
|||
|
Inventories
|
44,807
|
|||
|
Prepaid expense, other current and intangible assets
|
2,716
|
|||
|
Total current assets
|
50,691
|
|||
|
Goodwill
|
23,133
|
|||
|
Property and equipment
|
16,530
|
|||
|
Long-term intangible assets
|
33,601
|
|||
|
Deposits and other assets
|
567
|
|||
|
Deferred tax asset
|
24
|
|||
|
Total assets
|
$
|
124,546
|
||
|
Liabilities Assumed:
|
||||
|
Current liabilities:
|
||||
|
Accounts payable
|
$
|
23,615
|
||
|
Other accrued expenses and intangible liabilities
|
3,366
|
|||
|
Total current liabilities
|
26,981
|
|||
|
Other long-term liabilities and intangible liabilities
|
2,613
|
|||
|
Total liabilities
|
29,594
|
|||
|
Total purchase price
|
$
|
94,952
|
||
|
Cash paid at closing
|
$
|
86,837
|
||
|
Fair value of contingent earnout
|
9,200
|
|||
|
Net working capital and debt-like items adjustment
|
(1,085
|
)
|
||
|
$
|
94,952
|
|||
We are still in the process of completing our fair market valuations and the purchase price allocation. As such, the amounts above
are preliminary, pending the completion of procedures related to intangible assets and liabilities, inventory, property and equipment, contingent earnout payments, lease-related matters and the tax effect of any identified changes.
Goodwill is calculated as the excess of the purchase price over the net assets acquired and represents the value of City Gear’s
brand, our expansion in the city specialty market and expected synergies resulting from the acquisition. Goodwill is amortized for tax purposes.
Intangible assets and liabilities represent two separately identified assets and one liability. First, we identified the City Gear
tradename as an indefinite-lived intangible asset with a fair value of $32.4 million. The tradename is not subject to amortization but will be evaluated at least annually for impairment. Second, we recognized an intangible asset of $1.5
million for favorable City Gear leases and a liability of $2.6 million for unfavorable City Gear leases (as compared to prevailing markets). Under ASU Topic 842, these intangible assets and liabilities will become a component of the ROU
asset (See Note 2, Recent Accounting Pronouncements). Net amortization of $0.1 million was recognized in Fiscal 2019.
The results of operations of City Gear are included in our results of operations beginning on November 5, 2018. From November 5,
2018 through February 2, 2019, City Gear generated net sales of $49.1 million and net loss of $0.4 million. These results included $1.9 million related to the amortization of the step-up of the inventory value related to purchase
accounting.
The following unaudited consolidated pro forma summary has been prepared by adjusting the Company’s historical data to give effect
to the City Gear acquisition as if it had occurred on January 29, 2017 (the beginning of Hibbett’s fiscal year ended February 3, 2018). Both Hibbett and City Gear’s fiscal year statements of operations for the fiscal years ended February
2, 2019 and February 3, 2018 contained 52 weeks and 53 weeks of operations, respectively.
|
Pro Forma - Unaudited
Fiscal Year Ended |
||||||||
|
(in thousands, except per share data)
|
February 2,
2019
|
February 3,
2018
|
||||||
|
Net sales
|
$
|
1,152,628
|
$
|
1,158,701
|
||||
|
Net income
|
$
|
27,265
|
$
|
31,673
|
||||
|
Basic earnings per share
|
$
|
1.46
|
$
|
1.56
|
||||
|
Diluted earnings per share
|
$
|
1.45
|
$
|
1.55
|
||||
The results for Fiscal 2019 and Fiscal 2018 have been primarily adjusted to include;
|
·
|
the pro forma impact of amortization of intangible assets;
|
|
·
|
the depreciation of property and equipment, based on purchase price allocations;
|
|
·
|
the pro forma impact of additional interest expense relating to the acquisition;
|
|
·
|
the pro forma impact of acquisition-related costs incurred by the Company directly attributable to the transaction; and
|
|
·
|
the pro forma tax effect of income taxes on the above adjustments.
|
For Fiscal 2019, results have been adjusted to exclude the impact of acquisition-related expenses and purchase accounting
adjustments incurred by the Company that are directly attributable to the transaction.
The pro forma financial information has been prepared for comparative purposes only and includes certain adjustments, as noted
above. The adjustments are based on estimates based on currently available information and actual amounts may differ materially from these estimates. They do not reflect the effect of costs or synergies that would have been expected to
result from the integration of the City Gear acquisition.
|
Note 4.
|
Stock-Based Compensation
|
At February 3, 2018, we had four stock-based compensation plans:
| (a) |
The 2015 Equity Incentive Plan (EIP) provides that the Board of Directors (Board) may grant equity awards to certain employees of the Company at its discretion.
The EIP was adopted effective July 1, 2015 and authorizes grants of equity awards of up to 1,000,000 authorized but unissued shares of common stock. At February 2, 2019, there were 534,918 shares available for grant under the
EIP.
|
| (b) |
The 2015 Employee Stock Purchase Plan (ESPP) allows for qualified employees to participate in the purchase of up to 300,000 shares of our common stock at a price
equal to 85% of the lower of the closing price at the beginning or end of each quarterly stock purchase period. The ESPP was adopted effective July 1, 2015. At February 2, 2019, there were 228,718 shares available for purchase
under the ESPP.
|
| (c) |
The 2015 Director Deferred Compensation Plan (Deferred Plan) allows non-employee directors an election to defer all or a portion of their fees into stock units or
stock options. The Deferred Plan was adopted effective July 1, 2015 and authorizes grants up to 150,000 authorized but unissued shares of common stock. At February 2, 2019, there were 130,465 shares available for grant under
the Deferred Plan.
|
| (d) |
The 2012 Non-Employee Director Equity Plan (DEP) provides for grants of equity awards to non-employee directors. The DEP was adopted effective May 24, 2012 and
authorizes grants of equity awards of up to 500,000 authorized but unissued shares of common stock. At February 2, 2019, there were 262,315 shares available for grant under the DEP.
|
Our plans allow for a variety of equity awards including stock options, restricted stock awards, stock appreciation rights and
performance awards. As of February 2, 2019, we had only granted awards in the form of stock options, restricted stock units (RSUs) and performance-based units (PSUs) to our employees. The annual grants made for Fiscal 2019, Fiscal 2018
and Fiscal 2017 to employees consisted solely of RSUs. We have also awarded PSUs to our Named Executive Officers (NEOs) and expect the Compensation Committee of the Board will continue to grant PSUs to our NEOs in the future.
As of February 2, 2019, we had only granted awards in the form of stock, stock options and deferred stock units (DSUs) to our Board
members. Under the DEP, Board members currently receive an annual value of $75,000 worth of equity in the form of stock options or RSUs upon election to the Board and a value of $100,000 worth of equity in any form allowed within the DEP,
for each full year of service, pro-rated for Directors who serve less than one full year. The Chairman of the Board receives an annual value of $150,000 of equity in any form allowed within the DEP.
The terms and vesting schedules for stock-based awards vary by type of grant and generally vest upon time-based conditions. Under
the DEP, Directors have the option with certain equity forms to set vesting dates. Upon exercise, stock-based compensation awards are settled with authorized but unissued company stock. All of our awards are classified as equity awards.
The compensation cost for these plans was as follows (in thousands):
|
Fiscal Year Ended
|
||||||||||||
|
February 2,
2019
(52 weeks) |
February 3,
2018
(53 weeks) |
January 28,
2017
(52 weeks) |
||||||||||
|
Stock-based compensation expense by type:
|
||||||||||||
|
Stock options
|
$
|
185
|
$
|
224
|
$
|
384
|
||||||
|
Restricted stock units
|
3,932
|
3,536
|
4,010
|
|||||||||
|
Employee stock purchases
|
105
|
96
|
104
|
|||||||||
|
Director deferred compensation
|
94
|
24
|
94
|
|||||||||
|
Total stock-based compensation expense
|
4,316
|
3,880
|
4,592
|
|||||||||
|
Income tax benefit recognized
|
958
|
1,363
|
1,655
|
|||||||||
|
Stock-based compensation expense, net of income tax
|
$
|
3,358
|
$
|
2,517
|
$
|
2,937
|
||||||
Stock-based and deferred stock compensation expenses are included in store operating, selling and administrative expenses. There
is no capitalized stock-based compensation cost.
The income tax benefit recognized in our consolidated financial statements, as disclosed above, is based on the amount of
compensation expense recorded for book purposes. The actual income tax benefit realized in our income tax return is based on the intrinsic value, or the excess of the market value over the exercise or purchase price, of stock options
exercised and restricted stock unit awards vested during the period. The actual income tax benefit realized for the deductions considered on our income tax returns for Fiscal 2019, Fiscal 2018 and Fiscal 2017 was from option exercises and
restricted stock unit releases and totaled $0.4 million, $0.9 million and $1.2 million, respectively.
Stock Options
Stock options are granted with an exercise price equal to the closing market price of our common stock on the date of grant.
Vesting and expiration provisions vary between equity plans, but options granted to employees under the EIP typically vest over a four or five-year period in equal installments beginning on the first anniversary of the grant date and
typically expire on the eighth or tenth anniversary of the date of grant. Grants awarded to outside directors under the DEP and Deferred Plan vest immediately upon grant and expire on the tenth anniversary of the date of grant.
During Fiscal 2019, we had two stock option grants dated March 27, 2018 to directors. A total of 19,994 stock options was granted
at an exercise price of $22.55. The fair value of the grants was $7.15 which was estimated on the date of grant using the Black-Scholes pricing model assuming an expected life of 3.98 years, expected volatility of 36.09%, a risk-free
interest rate of 2.45% with no dividend yield.
We calculate the expected term for our stock options based on the historical exercise behavior of our participants. The volatility
used to value stock options is based on historical volatility. We calculate historical volatility using an average calculation methodology based on daily price intervals as measured over the expected term of the option. We have
consistently applied this methodology since our adoption of the provisions of ASC Topic 718, Stock Compensation. In accordance with ASC Topic 718,
we base the risk-free interest rate on the annual continuously compounded risk-free rate with a term equal to the option’s expected term. The dividend yield is assumed to be zero since we have no current plan to declare dividends.
Activity for our option plans during Fiscal 2019 was as follows:
|
Number of
Shares
|
Weighted
Average
Exercise
Price
|
Weighted
Average
Remaining
Contractual
Term
(Years)
|
Aggregate
Intrinsic
Value
($000’s)
|
|||||||||||||
|
Options outstanding at February 3, 2018
|
288,150
|
$
|
36.15
|
5.12
|
$
|
324
|
||||||||||
|
Granted
|
19,994
|
22.55
|
||||||||||||||
|
Exercised
|
(27,625
|
)
|
17.46
|
|||||||||||||
|
Forfeited, cancelled or expired
|
(1,097
|
)
|
20.02
|
|||||||||||||
|
Options outstanding at February 2, 2019
|
279,422
|
$
|
37.08
|
4.91
|
$
|
55
|
||||||||||
|
Exercisable at February 2, 2019
|
279,422
|
$
|
37.08
|
4.91
|
$
|
55
|
||||||||||
The weighted average grant-date fair value of options granted during Fiscal 2019, Fiscal 2018 and Fiscal 2017 was $7.15, $6.42 and
$10.56, respectively.
The total intrinsic value of stock options exercised during Fiscal 2019, Fiscal 2018 and Fiscal 2017 was $0.2 million, $0.1 million
and $0.6 million, respectively. The total cash received from these stock option exercises during Fiscal 2019, Fiscal 2018 and Fiscal 2017 was $0.5 million, $0.3 million and $0.4 million, respectively. For Fiscal 2017, excess income tax
benefits from the exercise of stock option are included in cash flows from financing activities as required by ASC Topic 230, Statement of Cash Flows.
Beginning in Fiscal 2018, with the adoption of ASU 2016-09, excess tax benefits are included in earnings. As of February 2, 2019, there was no unamortized unrecognized compensation cost related to stock options.
Restricted Stock and Performance-Based Units
RSUs and PSUs are granted with a fair value equal to the closing market price of our common stock on the date of grant. All PSUs
have been awarded in the form of restricted stock units. Compensation expense is recorded straight-line over the vesting period and, in the case of PSUs, at the estimated percentage of achievement. Restricted stock unit awards to our
employees generally cliff vest in four years from the date of grant for those awards that are not performance-based. If a Director chooses to receive their annual equity award in stock and defers the vesting date, then the form of stock is
a DSU. PSUs provide for awards based on achievement of certain predetermined corporate performance goals and cliff vest in three to five years from the date of grant after achievement of stated performance criterion and upon meeting stated
service conditions.
The following table summarizes the restricted stock unit awards activity under all our plans during Fiscal 2019:
|
RSUs
|
PSUs
|
Totals
|
||||||||||||||||||||||
|
Number of
Awards
|
Weighted
Average
Grant-Date
Fair Value
|
Number of
Awards
|
Weighted
Average
Grant-Date
Fair Value
|
Number of
Awards
|
Weighted
Average
Grant-Date
Fair Value
|
|||||||||||||||||||
|
Restricted stock unit awards outstanding at February 3, 2018
|
313,611
|
$
|
40.10
|
132,370
|
$
|
37.55
|
445,981
|
$
|
39.34
|
|||||||||||||||
|
Granted
|
174,007
|
22.55
|
44,700
|
22.55
|
218,707
|
22.55
|
||||||||||||||||||
|
PSU adjustment (1)
|
-
|
-
|
(13,725
|
)
|
29.30
|
(13,725
|
)
|
40.24
|
||||||||||||||||
|
Vested
|
(60,658
|
)
|
51.47
|
(5,025
|
)
|
54.06
|
(65,683
|
)
|
51.67
|
|||||||||||||||
|
Forfeited, cancelled or expired
|
(22,583
|
)
|
33.31
|
(14,650
|
)
|
50.48
|
(37,233
|
)
|
40.07
|
|||||||||||||||
|
Restricted stock unit awards outstanding at February 2, 2019
|
404,377
|
$
|
31.22
|
143,670
|
$
|
31.78
|
548,047
|
$
|
31.37
|
|||||||||||||||
(1) PSU adjustment represents the net RSUs awarded to our NEOs above and below their target grants resulting from the achievement
of performance goals above or below the performance targets established at grant. One grant goal was achieved at 50% and another grant goal was forfeited for performance equity awards whose final achievement was based on Fiscal 2017
through Fiscal 2019 financial results; therefore, the adjustment was negative.
The weighted average grant date fair value of our RSUs granted was $22.55, $29.60 and $35.12 for Fiscal 2019, Fiscal 2018 and
Fiscal 2017, respectively. There were 218,707, 166,690 and 163,643 RSUs awarded during Fiscal 2019, Fiscal 2018 and Fiscal 2017, respectively.
During Fiscal 2019, 65,683 RSU awards, including 5,025 PSU awards, vested with an intrinsic value of $1.4 million. The total
intrinsic value of our RSU awards outstanding and unvested at February 2, 2019, February 3, 2018 and January 28, 2017 was $8.9 million, $9.9 million and $12.9 million, respectively. As of February 2, 2019, there was approximately $5.0
million of total unamortized unrecognized compensation cost related to RSU awards. This cost is expected to be recognized over a weighted average period of 2.8 years.
Employee Stock Purchase Plan
The Company’s ESPP allows eligible employees the right to purchase shares of our common stock, subject to certain limitations, at
85% of the lesser of the market value at the end of each calendar quarter (purchase date) or the beginning of each calendar quarter. Our employee purchases of common stock and the average price per share through the ESPP were as follows:
|
Fiscal Year Ended
|
Shares
Purchased
|
Average Price
Per Share
|
||||||
|
February 2, 2019
|
26,077
|
$
|
15.96
|
|||||
|
February 3, 2018
|
23,555
|
$
|
16.36
|
|||||
|
January 28, 2017
|
14,890
|
$
|
28.48
|
|||||
The assumptions used in the option pricing model were as follows:
|
Fiscal Year Ended
|
|||||||||
|
February 2,
2019
|
February 3,
2018
|
January 28,
2017
|
|||||||
|
Weighted average fair value at date of grant
|
$4.75
|
$4.06
|
$6.98
|
||||||
|
Expected life (years)
|
0.25
|
0.25
|
0.25
|
||||||
|
Expected volatility
|
34.8% - 36.1%
|
|
30.2% - 36.2%
|
|
30.1% - 32.0%
|
|
|||
|
Risk-free interest rate
|
3.26% - 5.21%
|
|
1.19% - 2.48%
|
|
0.37% - 0.68%
|
|
|||
|
Dividend yield
|
None
|
None
|
None
|
||||||
The expense related to the ESPP was determined using the Black-Scholes option pricing model and the provisions of ASC Topic 718 as
it relates to accounting for certain employee stock purchase plans with a look-back option. The compensation expense included in store operating, selling and administrative expenses and recognized during each of Fiscal 2019, Fiscal 2018
and Fiscal 2017 was $0.1 million.
Director Deferred Compensation
Under the Deferred Plan, non-employee directors can elect to defer all or a portion of their Board and Board Committee fees into
cash, stock options or deferred stock units. Those fees deferred into stock options are subject to the same provisions as provided for in the DEP and are expensed and accounted for accordingly. Director fees deferred into stock units are
calculated and expensed each calendar quarter by taking deferred fees earned during the calendar quarter and dividing by the closing price of our common stock on the last day of the calendar quarter, rounded to the nearest whole share. The
total annual retainer, Board and Board Committee fees for non-employee directors that are not deferred into stock options, but which includes amounts deferred into stock units under the Deferred Plan, are expensed as incurred in all periods
presented. A total of 4,888, 1,195 and 2,542 stock units were deferred under this plan in Fiscal 2019, Fiscal 2018 and Fiscal 2017, respectively. Two directors have elected to defer all or a portion of their compensation into stock units
in calendar 2019.
|
Note 5.
|
Earnings Per Share
|
The computation of basic earnings per share (EPS) is based on the number of weighted average common shares outstanding during the
period. The computation of diluted EPS is based on the weighted average number of shares outstanding plus the incremental shares that would be outstanding assuming exercise of dilutive stock options and issuance of restricted stock. The
number of incremental shares is calculated by applying the treasury stock method. The following table sets forth the computation of basic and diluted earnings per share in thousands:
|
Fiscal Year Ended
|
||||||||||||
|
February 2,
2019
(52 weeks) |
February 3,
2018
(53 weeks) |
January 28,
2017
(52 weeks) |
||||||||||
|
Net income
|
$
|
28,421
|
$
|
35,030
|
$
|
61,075
|
||||||
|
Weighted average number of common shares outstanding
|
18,644
|
20,347
|
22,240
|
|||||||||
|
Dilutive stock options
|
3
|
5
|
40
|
|||||||||
|
Dilutive restricted stock units
|
179
|
98
|
147
|
|||||||||
|
Weighted average number of common shares outstanding and dilutive shares
|
18,826
|
20,450
|
22,427
|
|||||||||
|
Basic earnings per share
|
$
|
1.52
|
$
|
1.72
|
$
|
2.75
|
||||||
|
Diluted earnings per share
|
$
|
1.51
|
$
|
1.71
|
$
|
2.72
|
||||||
In calculating diluted earnings per share 260,845, 235,232 and 104,091 options to purchase shares of common stock outstanding as of
the end of the period were excluded in the computations of diluted earnings per share due to their anti-dilutive effect in Fiscal 2019, Fiscal 2018 and Fiscal 2017, respectively.
We excluded 49,800 nonvested stock awards granted to certain employees from the computation of diluted weighted average common
shares and common share equivalents outstanding, because they are subject to performance-based annual vesting conditions which had not been achieved by the end of Fiscal 2019. Assuming the performance criteria had been achieved at target
as of February 2, 2019, the incremental dilutive impact would have been 39,190 shares.
|
NOTE 6.
|
DEBT
|
In October 2018, we entered into amended agreements with Bank of America, N.A. and Regions Bank providing for an increase in the
aggregate amount of credit available to us under each line of credit from $30.0 million to $50.0 million for the purpose of financing a portion of the cash purchase price payable in the acquisition of City Gear.
The terms of the Bank of America facility allow for borrowings up to $50.0 million with an interest rate agreed upon between the
lender and us at the time a loan is made. The terms of the Regions Bank facility allow for borrowings up to $50.0 million with an interest rate at one-month LIBOR plus 1.5%. Both facilities are unsecured, due on demand and expire in
October 2021. Under the provisions of both facilities, we do not pay commitment fees. However, both are subject to negative pledge agreements that, among other things, restrict liens or transfers of assets including inventory, tangible or
intangible personal property and land and land improvements.
There were 95 days during the 52 weeks ended February 2, 2019, where we incurred borrowings against our credit facilities for an
average and maximum borrowing of $45.4 million and $75.0 million, respectively, and an average interest rate of 3.70%. At February 2, 2019, a total of $65.0 million was available to us from these facilities.
At February 3, 2018, we had two unsecured credit facilities, which were renewable in March and April 2018. The March facility
allowed for borrowings up to $30.0 million with an interest rate agreed upon between lender and borrower at the time a loan was made. The April facility allowed for borrowings up to $30.0 million at a rate of one-month LIBOR plus 2.5%.
Under the provisions of both facilities, we did not pay commitment fees and were not subject to covenant requirements. There were seven days during the 53 weeks ended February 3, 2018, where we incurred borrowings against our credit
facilities for an average and maximum borrowing of $4.1 million and $4.9 million, respectively, and an average interest rate of 2.78%. At February 3, 2018, a total of $60.0 million was available to us from these facilities.
|
NOTE 7.
|
LEASES
|
We have entered into capital leases for certain property and transportation equipment. At February 2, 2019, total capital lease
obligations were $3.0 million, of which $1.0 million was classified as a short-term liability and included in capital lease obligations and $2.0 million was classified as a long-term liability and included in capital lease obligations in
our consolidated balance sheet. At February 3, 2018, total capital lease obligations were $3.2 million, of which $0.7 million was classified as a short-term liability and included in capital lease obligations and $2.5 million was
classified as a long-term liability and included in capital lease obligations in our consolidated balance sheet. The cost basis of total assets under capital leases at February 2, 2019 and February 3, 2018 was $5.9 million and $5.4
million, respectively, with accumulated amortization at February 2, 2019 and February 3, 2018 of $3.3 million and $2.7 million, respectively. Amortization expense related to assets under capital leases was $0.7 million, $0.6 million and
$0.6 million in Fiscal 2019, Fiscal 2018 and Fiscal 2017, respectively.
We lease the majority of our stores under operating leases. The leases typically provide for terms of five to ten years with
options to extend at our discretion. Many of our leases contain scheduled increases in annual rent payments and the majority of our leases also require us to pay maintenance, insurance and real estate taxes. Additionally, many of the
lease agreements contain tenant improvement allowances, rent holidays and/or rent escalation clauses (contingent rentals) based on net sales for the location. For purposes of recognizing incentives and minimum rental expenses on a
straight-line basis over the terms of the leases, we use the date of initial possession to begin amortization, which is generally when we enter the space and begin to make improvements in preparation of our intended use.
Most of our store leases contain provisions that allow for early termination of the lease if certain pre-determined annual sales
levels are not met. Generally, these provisions allow the lease to be terminated between the third and fifth year of the lease. Should the lease be terminated under these provisions, in some cases, the unamortized portion of any landlord
allowances related to that property would be payable to the landlord.
We also lease certain office equipment and transportation equipment under operating leases having initial terms of more than one
year.
During Fiscal 2019, we acquired 136 stores, opened 32 new stores and increased our lease commitments by a net of 84 stores and one
administrative office lease. Of the new lease commitments, the initial lease termination dates were between May 2023 and March 2029. At February 2, 2019, the future minimum lease payments under capital leases and the present value of such
payments, and the future minimum lease payments under our operating leases, excluding maintenance, insurance and real estate taxes, were as follows (in thousands):
|
Capital
|
Operating
|
Total
|
||||||||||
|
Fiscal 2020
|
$
|
1,259
|
$
|
68,002
|
$
|
69,261
|
||||||
|
Fiscal 2021
|
951
|
58,666
|
59,617
|
|||||||||
|
Fiscal 2022
|
451
|
46,683
|
47,134
|
|||||||||
|
Fiscal 2023
|
408
|
34,011
|
34,419
|
|||||||||
|
Fiscal 2024
|
306
|
22,426
|
22,732
|
|||||||||
|
Thereafter
|
217
|
40,181
|
40,398
|
|||||||||
|
Total minimum lease payments
|
3,592
|
269,969
|
273,561
|
|||||||||
|
Less amount representing interest
|
581
|
-
|
581
|
|||||||||
|
$
|
3,011
|
$
|
269,969
|
$
|
272,980
|
|||||||
Rental expense for all operating leases consisted of the following (in thousands):
|
Fiscal Year Ended
|
||||||||||||
|
February 2,
2019
(52 weeks) |
February 3,
2018
(53 weeks) |
January 28,
2017
(52 weeks) |
||||||||||
|
Minimum rentals
|
$
|
55,755
|
$
|
54,337
|
$
|
54,910
|
||||||
|
Contingent rentals
|
4,397
|
4,931
|
4,744
|
|||||||||
|
$
|
60,152
|
$
|
59,268
|
$
|
59,654
|
|||||||
|
NOTE 8.
|
DEFINED CONTRIBUTION BENEFIT PLANS
|
We maintain the Hibbett Sports, Inc. 401(k) Plan (401(k) Plan) for the benefit of our employees. The 401(k) Plan covers all
employees who have completed one year of service. Participants of the 401(k) Plan may voluntarily contribute from 1% to 100% of their compensation subject to certain yearly dollar limitations as allowed by law. These elective
contributions are made under the provisions of Section 401(k) of the Internal Revenue Code which allows deferral of income taxes on the amount contributed to the 401(k) Plan. Effective Fiscal 2016, the Board adopted the Safe Harbor
provisions for our 401(k) Plan. For Fiscal 2019, Fiscal 2018 and Fiscal 2017, we matched 100% of the first 3% of eligible compensation and 50% of the next 3% of eligible compensation for a total possible match of 4.5% of the first 6% of
eligible compensation. Contribution expense incurred under the 401(k) Plan for Fiscal 2019, Fiscal 2018 and Fiscal 2017 was $1.3 million, $1.4 million and $1.4 million, respectively.
We maintain the Hibbett Sports, Inc. Supplemental 401(k) Plan (Supplemental Plan) for the purpose of supplementing the employer
matching contribution and salary deferral opportunity available to highly compensated employees whose ability to receive Company matching contributions and defer salary under the 401(k) Plan was limited because of certain restrictions
applicable to qualified plans. The non-qualified deferred compensation Supplemental Plan allows participants to defer up to 40% of their compensation. Contributions to the Supplemental Plan are not subject to matching provisions,
therefore no contribution expense was incurred under the Supplemental Plan for Fiscal 2019, Fiscal 2018 and Fiscal 2017. The Supplemental Plan is intended to comply with the requirements of Section 409A of the Internal Revenue Code of
1986, as amended.
We maintain the Hibbett Sports, Inc. Executive Voluntary Deferral Plan (Voluntary Plan) that provides key executives of the Company
an opportunity to defer, on a pre-tax basis, up to 50% of their base salary and up to 100% of any bonus earned. Participants, at election, determine the date payout is to be made with payout options as either a lump-sum payout or
installment payments over 2 to 10 years. The Voluntary Plan is subject to the Employee Retirement Income Security Act of 1974, as amended (ERISA) and was effective February 1, 2010 and is also intended to comply with the requirements of
Section 409A of the Internal Revenue Code of 1986, as amended.
We maintain a Flexible Spending Account Plan (FSA) that allows employees to set aside pre-tax amounts for out-of-pocket health care
and dependent care expenses. The health care FSA is subject to ERISA, whereas the dependent care FSA is not. Employees are eligible to participate in the FSA upon meeting eligibility requirements or upon a defined qualifying event, and
may enroll annually during an open enrollment period. Plan amounts are determined annually by the employee in advance and are subject to IRS dollar limitations. Employee elections, in general, cannot be increased, decreased or
discontinued during the election period. Under the health care FSA, participants can rollover up to $500 of unused amounts at the end of the plan year. Under the dependent care FSA, unused amounts at the end of the plan year are subject
to forfeiture and such forfeitures can be used to offset administrative expenses.
|
NOTE 9.
|
RELATED‑PARTY TRANSACTIONS
|
The Company leases one store under a lease arrangement with AL Florence Realty Holdings 2010, LLC, a wholly-owned subsidiary of
Books-A-Million, Inc., (BAMM). One of our Directors, Terrance G. Finley is an executive officer of BAMM. Minimum annual lease payments are $0.1 million, if not in co-tenancy, and the lease termination date is February 2022. In Fiscal
2019, Fiscal 2018 and Fiscal 2017, minimum lease payments were $0.1 million. Minimum lease payments remaining under this lease at February 2, 2019 were $0.3 million.
|
NOTE 10.
|
INCOME TAXES
|
A summary of the components of the provision/(benefit) for income taxes is as follows (in thousands):
|
Fiscal Year Ended
|
||||||||||||
|
February 2,
2019
(52 weeks) |
February 3,
2018
(53 weeks) |
January 28,
2017
(52 weeks) |
||||||||||
|
Federal:
|
||||||||||||
|
Current
|
$
|
7,375
|
$
|
16,154
|
$
|
31,007
|
||||||
|
Deferred
|
339
|
3,257
|
1,359
|
|||||||||
|
7,714
|
19,411
|
32,366
|
||||||||||
|
State:
|
||||||||||||
|
Current
|
1,625
|
1,668
|
3,042
|
|||||||||
|
Deferred
|
(202
|
)
|
338
|
13
|
||||||||
|
1,423
|
2,006
|
3,055
|
||||||||||
|
Provision for income taxes
|
$
|
9,137
|
$
|
21,417
|
$
|
35,421
|
||||||
A reconciliation of the statutory federal income tax rate to the effective tax rate as a percentage of income before provision for
income taxes follows:
|
Fiscal Year Ended
|
||||||||||||
|
February 2,
2019
(52 weeks) |
February 3,
2018
(53 weeks) |
January 28,
2017
(52 weeks) |
||||||||||
|
Tax provision computed at the federal statutory rate
|
21.00
|
%
|
33.72
|
%
|
35.00
|
%
|
||||||
|
Effect of state income taxes, net of federal benefits
|
2.86
|
2.50
|
2.22
|
|||||||||
|
Enactment of the Tax Cuts and Jobs Act
|
-
|
1.39
|
-
|
|||||||||
|
Federal income tax credits
|
(1.36
|
)
|
(0.32
|
)
|
(0.45
|
)
|
||||||
|
Equity compensation tax deficiencies
|
1.30
|
1.23
|
-
|
|||||||||
|
Other, net
|
0.53
|
(0.58
|
)
|
(0.06
|
)
|
|||||||
|
24.33
|
%
|
37.94
|
%
|
36.71
|
%
|
|||||||
The Tax Cuts and Jobs Act (the Act) was enacted on December 22, 2017. The Act reduced the federal corporate income tax rate to 21%
from 35%. As of the enactment date, we remeasured our deferred tax assets and liabilities based on the rates at which they were expected to reverse in the future (which was generally 21% for federal income tax purposes).
Deferred income taxes on the consolidated balance sheets result from temporary differences between the amount of assets and
liabilities recognized for financial reporting and income tax purposes. The components of the deferred income taxes, net, are as follows (in thousands):
|
February 2,
2019
(52 weeks) |
February 3,
2018
(53 weeks) |
|||||||
|
Deferred rent
|
$
|
6,333
|
$
|
6,971
|
||||
|
Inventories
|
3,442
|
3,209
|
||||||
|
Accruals
|
5,080
|
3,616
|
||||||
|
Stock-based compensation
|
3,681
|
3,714
|
||||||
|
Other
|
328
|
49
|
||||||
|
Total deferred tax assets
|
18,864
|
17,559
|
||||||
|
Accumulated depreciation and amortization
|
(15,089
|
)
|
(14,395
|
)
|
||||
|
Prepaid expenses
|
(1,420
|
)
|
(644
|
)
|
||||
|
Other
|
-
|
(224
|
)
|
|||||
|
State taxes
|
(77
|
)
|
(120
|
)
|
||||
|
Total deferred tax liabilities
|
(16,586
|
)
|
(15,383
|
)
|
||||
|
Deferred income taxes, net
|
$
|
2,278
|
$
|
2,176
|
||||
Deferred tax assets represent items that will be used as a tax deduction or credit in future tax returns or are items of income
that have not been recognized for financial statement purposes but were included in the current or prior tax returns for which we have already properly recorded the tax benefit in the consolidated statements of operations. At least
quarterly, we assess the likelihood that the deferred tax assets balance will be recovered. We take into account such factors as prior earnings history, expected future earnings, carryback and carryforward periods and tax strategies that
could potentially enhance the likelihood of a realization of a deferred tax asset. To the extent recovery is not more likely than not, a valuation allowance is established against the deferred tax asset, increasing our income tax expense
in the year such determination is made. We have determined that no such allowance is required.
We apply the provisions of ASC Subtopic 740-10 in accounting for uncertainty in income taxes. In accordance with ASC Subtopic 740-10, we recognize a tax benefit associated with an uncertain tax position when, in our judgment based on technical merits, it is more likely
than not that the position will be sustained upon examination by a taxing authority. For a tax position that meets the more-likely-than-not recognition threshold, we initially and subsequently measure the tax benefit as the largest amount
that we judge to have a greater than 50% likelihood of being realized upon ultimate settlement with a taxing authority. Our liability associated with unrecognized tax benefits is adjusted periodically due to changing circumstances, such as
the progress of tax audits, case law developments and new or emerging legislation. Such adjustments are recognized entirely in the period in which they are identified. Our effective tax rate includes the net impact of changes in the
liability for unrecognized tax benefits and subsequent adjustments as considered appropriate by management.
We file income tax returns in the U.S. federal and various state jurisdictions. A number of years may elapse before a particular
matter for which we have recorded a liability related to an unrecognized tax benefit is audited and finally resolved. Generally, we are not subject to changes in income taxes by the U.S. federal taxing jurisdiction for years prior to
Fiscal 2016 or by most state taxing jurisdictions for years prior to Fiscal 2015. While it is often difficult to predict the final outcome or the timing of resolution of any particular tax matter, we believe our liability for unrecognized
tax benefits is adequate. Favorable settlement of an unrecognized tax benefit could be recognized as a reduction in our effective tax rate in the period of resolution. Unfavorable settlement of an unrecognized tax benefit could increase
the effective tax rate and may require the use of cash in the period of resolution. Our liability for unrecognized tax benefits is generally presented as non-current. However, if we anticipate paying cash within one year to settle an
uncertain tax position, the liability is presented as current.
A reconciliation of the unrecognized tax benefit, excluding estimated interest and penalties, under ASC Subtopic 740-10 follows (in
thousands):
|
February 2,
2019
(52 weeks) |
February 3,
2018
(53 weeks) |
January 28,
2017
(52 weeks) |
||||||||||
|
Unrecognized tax benefits - beginning of year
|
$
|
1,156
|
$
|
1,267
|
$
|
1,242
|
||||||
|
Gross increases - tax positions in prior period
|
246
|
140
|
158
|
|||||||||
|
Gross decreases - tax positions in prior period
|
(10
|
)
|
(7
|
)
|
(26
|
)
|
||||||
|
Gross increases - tax positions in current period
|
107
|
70
|
121
|
|||||||||
|
Settlements
|
-
|
-
|
-
|
|||||||||
|
Lapse of statute of limitations
|
(254
|
)
|
(314
|
)
|
(228
|
)
|
||||||
|
Unrecognized tax benefits - end of year
|
$
|
1,245
|
$
|
1,156
|
$
|
1,267
|
||||||
We classify interest and penalties recognized on unrecognized tax benefits as income tax expense. We have accrued interest and
penalties in the amount of $0.2 million, $0.1 million and $0.1 million as of February 2, 2019, February 3, 2018 and January 28, 2017, respectively. During Fiscal 2019, Fiscal 2018 and Fiscal 2017, we recorded $18,000, $4,000 and $21,000,
respectively, for the accrual of interest and penalties in the consolidated statement of operations.
Of the unrecognized tax benefits as of February 2, 2019, February 3, 2018 and January 28, 2017, $1.0 million, $1.0 million and $0.9
million, respectively, if recognized, would affect our effective income tax rate.
|
NOTE 11.
|
COMMITMENTS AND CONTINGENCIES
|
Annual Bonuses and Equity Incentive Awards
Specified officers and corporate employees of our Company are entitled to annual bonuses, primarily based on measures of Company
operating performance. At February 2, 2019 and February 3, 2018, there was $3.9 million and $1.9 million, respectively, of annual bonus-related expense included in accrued payroll expenses.
In addition, the Compensation Committee (Committee) of the Board of Directors places performance criteria on awards of PSUs made in
the form of RSUs to our NEOs under the EIP. The performance criteria are tied to performance targets with respect to future sales and operating income over a specified period of time. These PSUs are expensed under the provisions of ASC
Topic 718 and are evaluated each quarter to determine the probability that the performance conditions set within will be met. We expect the Committee to continue to place performance criteria on awards of RSUs to our NEOs in the future.
Legal Proceedings and Other Contingencies
We are a party to various legal proceedings incidental to our business. Where we are able to reasonably estimate an amount of
probable loss in these matters based on known facts, we have accrued that amount as a current liability on our balance sheet. We are not able to reasonably estimate the possible loss or range of loss in excess of the amount accrued for
these proceedings based on the information currently available to us, including, among others, (i) uncertainties as to the outcome of pending proceedings (including motions and appeals) and (ii) uncertainties as to the likelihood of
settlement and the outcome of any negotiations with respect thereto. We do not believe that any of these matters will, individually or in the aggregate, have a material effect on our business or financial condition. We cannot give
assurance, however, that one or more of these proceedings will not have a material effect on our results of operations for the period in which they are resolved. At February 2, 2019 and February 3, 2018, the estimated liability is
immaterial.
The estimates of our liability for pending and unasserted potential claims do not include litigation costs. It is our policy to
accrue legal fees when it is probable that we will have to defend against known claims or allegations and we can reasonably estimate the amount of the anticipated expense.
From time to time, we enter into certain types of agreements that require us to indemnify parties against third-party claims under
certain circumstances. Generally, these agreements relate to: (a) agreements with vendors and suppliers under which we may provide customary indemnification to our vendors and suppliers in respect to actions they take at our request or
otherwise on our behalf; (b) agreements to indemnify vendors against trademark and copyright infringement claims concerning merchandise manufactured specifically for or on behalf of the Company; (c) real estate leases, under which we may
agree to indemnify the lessors from claims arising from our use of the property; and (d) agreements with our directors, officers and employees, under which we may agree to indemnify such persons for liabilities arising out of their
relationship with us. We have director and officer liability insurance, which, subject to the policy’s conditions, provides coverage for indemnification amounts payable by us with respect to our directors and officers up to specified
limits and subject to certain deductibles.
If we believe that a loss is both probable and estimable for a particular matter, the loss is accrued in accordance with the
requirements of ASC Topic 450, Contingencies. With respect to any matter, we could change our belief as to whether a loss is probable or estimable,
or its estimate of loss, at any time.
|
NOTE 12.
|
QUARTERLY FINANCIAL DATA (UNAUDITED)
|
The following tables set forth certain unaudited consolidated financial data for the quarters indicated (dollar amounts in
thousands, except per share amounts):
|
Fiscal Year Ended February 2, 2019
|
||||||||||||||||
|
First
(13 weeks)
|
Second
(13 weeks)
|
Third
(13 weeks)
|
Fourth
(13 weeks)
|
|||||||||||||
|
Net sales
|
$
|
274,707
|
$
|
211,123
|
$
|
216,888
|
$
|
305,964
|
||||||||
|
Gross margin
|
$
|
96,773
|
$
|
66,351
|
$
|
70,512
|
$
|
95,099
|
||||||||
|
Operating income (loss)
|
$
|
28,621
|
$
|
(1,885
|
)
|
$
|
1,842
|
$
|
8,963
|
|||||||
|
Net income (loss)
|
$
|
21,509
|
$
|
(1,222
|
)
|
$
|
1,499
|
$
|
6,634
|
|||||||
|
Basic earnings (loss) per share
|
$
|
1.13
|
$
|
(0.06
|
)
|
$
|
0.08
|
$
|
0.36
|
|||||||
|
Diluted earnings (loss) per share
|
$
|
1.12
|
$
|
(0.06
|
)
|
$
|
0.08
|
$
|
0.36
|
|||||||
|
Fiscal Year Ended February 3, 2018
|
||||||||||||||||
|
First
(13 weeks)
|
Second
(13 weeks)
|
Third
(13 weeks)
|
Fourth
(14 weeks)
|
|||||||||||||
|
Net sales
|
$
|
275,688
|
$
|
187,958
|
$
|
237,834
|
$
|
266,738
|
||||||||
|
Gross margin
|
$
|
98,218
|
$
|
54,408
|
$
|
76,113
|
$
|
83,977
|
||||||||
|
Operating income (loss)
|
$
|
34,168
|
$
|
(5,162
|
)
|
$
|
11,787
|
$
|
15,884
|
|||||||
|
Net income (loss)
|
$
|
20,910
|
$
|
(3,176
|
)
|
$
|
7,564
|
$
|
9,733
|
|||||||
|
Basic earnings (loss) per share
|
$
|
0.98
|
$
|
(0.15
|
)
|
$
|
0.37
|
$
|
0.51
|
|||||||
|
Diluted earnings (loss) per share
|
$
|
0.97
|
$
|
(0.15
|
)
|
$
|
0.37
|
$
|
0.51
|
|||||||
In the opinion of our management, this unaudited information has been prepared on the same basis as the audited information. The
operating results from any quarter are not necessarily indicative of the results to be expected for any future period.
|
NOTE 13.
|
FAIR VALUE MEASUREMENTS
|
ASC Topic 820, Fair Value Measurement, establishes
a three-level fair value hierarchy that prioritizes the inputs used to measure fair value. The three levels of inputs used to measure fair value are as follows:
| · |
Level I – Quoted prices in active markets for identical assets or liabilities.
|
| · |
Level II – Observable inputs other than quoted prices included in Level I.
|
| · |
Level III – Unobservable inputs that are supported by little or no market activity and that are significant to the fair value of the assets or liabilities.
|
The table below segregates all financial assets and liabilities that are measured at fair value on a recurring basis (at least
annually) into the most appropriate level within the fair value hierarchy based on the inputs used to determine the fair value (in thousands):
|
February 2, 2019
|
February 3, 2018
|
|||||||||||||||||||||||
|
Level I
|
Level II
|
Level III
|
Level I
|
Level II
|
Level III
|
|||||||||||||||||||
|
Short-term investments
|
$
|
158
|
$
|
-
|
$
|
-
|
$
|
463
|
$
|
-
|
$
|
-
|
||||||||||||
|
Long-term investments
|
2,377
|
-
|
-
|
2,418
|
-
|
-
|
||||||||||||||||||
|
Long-term contingent earnout
|
-
|
-
|
9,200
|
-
|
-
|
-
|
||||||||||||||||||
|
Total investments
|
$
|
2,535
|
$
|
-
|
$
|
9,200
|
$
|
2,881
|
$
|
-
|
$
|
-
|
||||||||||||
Short-term investments are reported in prepaid expenses and other while long-term investments are reported in other assets, net, in
our consolidated balance sheets.
The long-term contingent Earnout represents the fair value of potential additional payments outlined in the Purchase Agreement to
the members and warrant holders of City Gear if certain financial goals are achieved over the next two fiscal years (Fiscal 2020 and Fiscal 2021). The Earnout was valued using a Monte Carlo simulation analysis in a risk-neutral framework
with assumptions for volatility, risk-free rate and dividend yield. The Earnout will be re-valued each quarter and any change in valuation will flow through our statements of operations.
Not applicable.
|
(a)
|
Conclusion Regarding the Effectiveness of Disclosure Controls and Procedures
|
We maintain disclosure controls and procedures that are designed to ensure that information required to be disclosed in the reports
filed or submitted under the Exchange Act is recorded, processed, summarized and reported within the time periods specified in the SEC’s rules and forms and that such information is accumulated and communicated to our management, including
the Chief Executive Officer and President (principal executive officer) and Senior Vice President and Chief Financial Officer (principal financial officer), as appropriate, to allow timely decisions regarding the required disclosures.
As of February 2, 2019, our management, under the supervision and with the participation of our principal executive officer and
principal financial officer, performed an evaluation of the effectiveness of our disclosure controls and procedures (as such term is defined in Rule 13a and 15d-15(e) under the Exchange Act). Based upon this evaluation, our principal
executive officer and principal financial officer concluded that our disclosure controls and procedures were effective as of February 2, 2019.
|
(b)
|
Management’s Report on Internal Control Over Financial Reporting
|
Our management is responsible for establishing and maintaining adequate internal control over financial reporting (as such term is
defined in Rule 13a-15(f) under the Exchange Act). Under the supervision and with the participation of our management, including our principal executive officer and principal financial officer, we conducted an evaluation of the
effectiveness of our internal control over financial reporting as of February 2, 2019, based on the Internal Control – Integrated Framework (2013)
issued by the Committee of Sponsoring Organizations of the Treadway Commission (COSO). Based on our evaluation under the framework in Internal Control –
Integrated Framework (2013), our management concluded that our internal control over financial reporting was effective as of February 2, 2019.
On November 4, 2019, we acquired City Gear. As permitted by SEC guidance for newly acquired businesses, we excluded City Gear from
our assessment of internal control over financial reporting, which represented total assets of $123.8 million and net sales of $49.1 million for the fiscal year ended February 2, 2019. We are in the process of integrating the City Gear
operations into our internal control structure and expect that this effort will be completed in Fiscal 2020.
KPMG LLP, our independent registered public accounting firm, has issued an audit report on the Company’s internal control over
financial reporting as of February 2, 2019 included in Item 8 herein.
(c) Changes in Internal Control Over Financial Reporting
There has been no change in our internal control over financial reporting during the fourth quarter of Fiscal 2019 that has
materially affected, or is reasonably likely to materially affect, our internal control over financial reporting. Although additional controls were introduced during the fourth quarter of Fiscal 2019 related to the opening balance sheet
and consolidation of City Gear financial activity, we primarily used our existing internal control over financial reporting in connection with the consolidation of our financial statements for Fiscal 2019.
None.
With the exception of the information specifically incorporated by reference from our Proxy Statement for the 2019
Annual Meeting of Stockholders (2019 Proxy Statement) in Items 10, 11, 12, 13 and 14 of Part III of this Annual Report on Form 10-K, our 2019 Proxy Statement shall not be deemed to be a part of, or incorporated by reference into, this Form
10-K.
The following information required by this Item is incorporated by reference from the 2019 Proxy Statement, which will be filed
on or around April 23, 2019:
• Information regarding our directors is found under the heading “The Board of Directors.”
• Information regarding compliance with Section 16 of the Securities Exchange Act of 1934, as amended, is found under the
heading “Section 16(a) Beneficial Ownership Reporting Compliance.”
• Information regarding the Company’s Audit Committee financial expert(s) is found under the heading “Committees of the Board
of Directors - Audit Committee - Audit Committee Financial Experts.”
• Information regarding the members of the Audit Committee is found under the heading “Committees of the Board of Directors -
Audit Committee.”
We have adopted a Code of Business Conduct and Ethics (Code) for all Company employees, including our Named Executive Officers as
determined for our 2019 Proxy Statement. We have also adopted a set of Corporate Governance Guidelines (Guidelines) and charters for all of our Board Committees, including the Audit Committee, Compensation Committee and Nominating and
Corporate Governance Committee. We intend to make all required disclosures regarding any amendment to, or a waiver of, a provision of the Code for senior executive and financial officers as well as any change or amendments to our
Guidelines or committee charters by posting such information on our website. The Code, Guidelines and charters are posted on our website, www.hibbett.com under
“Investor Relations.”
The information concerning our executive officers required by this Item is included in Part I, Item 1 of this Form 10-K under the
heading “Our Executive Officers.” Each of our executive officers is elected annually.
The following information required by this Item is incorporated by reference from the 2019 Proxy Statement:
• Information regarding executive compensation is found under the headings “Compensation Discussion and Analysis” and “Annual
Compensation of Executive Officers.”
• Information regarding the report of the Compensation Committee on executive compensation is found under the heading
“Compensation Committee Report.”
• Information regarding Compensation Committee interlocks is found under the heading “Compensation Committee Interlocks and
Insider Participation.”
• Information regarding director compensation is found under the heading “Compensation of Non-Employee Directors.”
|
Security Ownership of Certain Beneficial Owners and Management and Related Stockholder Matters.
|
The information required by this Item regarding the stock ownership of directors, executive officers and five percent beneficial
owners is found under the heading “Security Ownership of Certain Beneficial Owners and Management” in the 2019 Proxy Statement and is incorporated herein by reference.
Equity Compensation Plan Information
The following table provides information on the equity securities of the Company that are authorized for issuance under its equity
compensation plans as of February 2, 2019:
|
(a)
|
(b)
|
(c)
|
||||||||||
|
Plan Category
|
Number of securities
to be issued upon
exercise of
outstanding options,
warrants and rights
(1)
|
Weighted
average
exercise price
of outstanding
options
|
Number of securities
remaining available for
future issuance under
equity compensation
plans (excluding
securities reflected in
column (a)) (2)
|
|||||||||
|
Equity compensation plans approved by security holders
|
837,486
|
$
|
37.11
|
1,156,416
|
||||||||
|
Equity compensation plans not approved by security holders
|
-
|
-
|
-
|
|||||||||
|
TOTAL
|
837,486
|
$
|
37.11
|
1,156,416
|
||||||||
| (1) |
Includes 404,377 RSUs and 148,200 PSUs that may be awarded if specified targets and/or service periods are met. It also includes 5,487 DSUs. The weighted average
exercise price of outstanding options does not include these awards.
|
| (2) |
Includes 228,718 shares remaining under our ESPP and 130,465 shares remaining under our Deferred Plan without consideration of shares subject to purchase in the
purchasing period ending March 31, 2019.
|
The information regarding related party transactions and director independence required by this Item is found under the headings
“Related Person Transactions” and “Our Board of Directors and Corporate Governance Matters - Director Independence” in the 2019 Proxy Statement and is incorporated herein by reference.
The information regarding principal accountant fees and services required by this Item is found under the headings “Audit Matters -
Fees Paid to KPMG LLP” and “Audit Matters - Policy on Audit Committee Pre-Approval of Audit and Permissible Non-Audit Services of Independent Registered Public Accounting Firm” in the 2019 Proxy Statement and is incorporated herein by
reference.
|
(a)
|
Documents filed as part of this report:
|
|
Number
|
Description
|
Page
|
|
|
1.
|
Financial Statements.
|
||
|
The following Consolidated Financial Statements and Supplementary Data of the Company and Independent Registered Public Accounting Firm’s
Report on such Consolidated Financial Statements are included in Part II, Item 8 of this report:
|
|||
|
41
|
|||
|
43
|
|||
|
44
|
|||
|
45
|
|||
|
46
|
|||
|
47
|
|||
|
2.
|
Financial Statement Schedules.
|
||
|
All schedules for which provision is made in the applicable accounting regulations of the Securities and Exchange Commission are not required
under the related instructions or are not applicable, and therefore have been omitted.
|
|||
|
3.
|
Exhibits.
|
||
|
The Exhibits listed below are the exhibits of Hibbett Sports, Inc. and its wholly owned subsidiaries and are filed as part of, or incorporated
by reference into, this report.
|
|||
|
Certificates of Incorporation and By-Laws
|
|||
|
3.1
|
Certificate of Incorporation of the Registrant; incorporated herein by reference to Exhibit 3.1 of the Registrant’s Form 8-K filed with the Securities and Exchange Commission on May 31, 2012.
|
||
|
3.2
|
Bylaws of the Registrant, as amended; incorporated herein by reference to Exhibit 3.2 of the Registrant’s Form 8-K filed with the Securities and Exchange Commission on May 31, 2012.
|
||
|
Form of Stock Certificate
|
|||
|
4.1
|
Form of Stock Certificate; attached as Exhibit 99.1 to the Registrant’s Current Report on Form 8-K filed on September 26, 2007.
|
||
|
Material Contracts
|
|||
|
10.1
|
Membership Interest and Warrant Purchase Agreement; incorporated herein by reference to Exhibit 2.1 of the Registrant’s Current Report on Form 8-K filed with the Securities and Exchange Commission on October
30, 2018.
|
|
Number
|
Description
|
Page
|
|
|
10.2
|
Second Amended and Restated Demand Note with Bank of America, N.A.; incorporated herein by reference to Exhibit 10.1 of the
Registrant’s Current Report on Form 8-K filed with the Securities and Exchange Commission on October 30, 2018.
|
||
|
10.3
|
Amended and Restated Demand Note with Regions Bank; incorporated herein by reference to Exhibit 10.2 of the Registrant’s Current Report on
Form 8-K filed with the Securities and Exchange Commission on October 30, 2018.
|
||
|
10.4
|
Hibbett Sports, Inc. 2012 Non-Employee Director Equity Plan; incorporated herein by reference to Exhibit 10.2 to the Registrant’s Current Report on Form 8-K filed with the Securities and Exchange Commission
on May 31, 2012.
|
||
|
10.5
|
Hibbett Sports, Inc. Non-Employee Director Non-Qualified Option Agreement (Initial Grant, Service Requirement); incorporated herein by reference to Exhibit 10.2 to the Registrant’s
Current Report on Form 8-K filed with the Securities and Exchange Commission on August 17, 2012.
|
||
|
10.6
|
Hibbett Sports, Inc. Non-Employee Director Restricted Stock Unit Award Agreement (Initial Grant, Service Requirement); incorporated herein by reference to Exhibit 10.3 to the
Registrant’s Current Report on Form 8-K filed with the Securities and Exchange Commission on August 17, 2012.
|
||
|
10.7
|
Hibbett Sports, Inc. Non-Employee Director Non-Qualified Option Agreement (Annual Grant; Fully Vested); incorporated herein by reference to Exhibit 10.4 to the Registrant’s Current
Report on Form 8-K filed with the Securities and Exchange Commission on August 17, 2012.
|
||
|
10.8
|
Hibbett Sports, Inc. Non-Employee Director Restricted Stock Unit Award Agreement (Annual Grant; Fully Vested); incorporated herein by reference to Exhibit 10.5 to the Registrant’s
Current Report on Form 8-K filed with the Securities and Exchange Commission on August 17, 2012.
|
||
|
10.9
|
Amended and Restated Agreement of Lease between Hibbett Sporting Goods, Inc. and AL Florence Realty Holdings 2010, LLC, dated October 3, 2011; incorporated herein by reference to Exhibit 10.1 to the
Registrant’s Annual Report on Form 10-K filed with the Securities and Exchange Commission on March 26, 2012.
|
||
|
10.10
|
Change in Control Severance Agreement; incorporated herein by reference to Exhibit 10.1 to the Registrant’s Current Report on Form 8-K filed with the Securities and Exchange Commission on January 24, 2008.
|
||
|
10.11
|
Executive Restricted Stock Unit Award Agreement; incorporated herein by reference to Exhibit 10.1 to the Registrant’s Current Report on Form 8-K filed with the Securities and Exchange Commission on March 11,
2008.
|
||
|
10.12
|
Hibbett Sports, Inc. 2015 Equity Incentive Plan; incorporated herein by reference to Appendix A to the Registrant’s Definitive Proxy Statement filed with the Securities and Exchange Commission of
April 23, 2015.
|
||
|
10.13
|
Hibbett Sports, Inc. 2016 Executive Officer Cash Bonus Plan; incorporated herein by reference to Appendix A to the Registrant’s Definitive Proxy Statement for the 2016 Annual Meeting of Stockholders filed
with the Securities and Exchange Commission on April 21, 2016.
|
||
|
10.14
|
Hibbett Sports, Inc. Executive Voluntary Deferral Plan; incorporated herein by reference to Exhibit 10.1 to the Registrant’s Current Report on Form 8-K filed with the Securities and Exchange Commission on
November 20, 2009.
|
||
|
10.15
|
Hibbett Sports, Inc. 2015 Employee Stock Purchase Plan; incorporated herein by reference to Appendix B to the Registrant’s Definitive Proxy Statement filed with the Securities and Exchange
Commission on April 23, 2015.
|
||
|
10.16
|
Hibbett Sports, Inc. 2015 Director Deferred Compensation Plan; incorporated herein by reference to Appendix C to the Registrant’s Definitive Proxy Statement filed with the Securities and Exchange
Commission on April 23, 2015.
|
|
Number
|
Description
|
Page
|
|
|
10.17
|
Standard Restricted Stock Unit Award Agreement; incorporated herein by reference to Exhibit 10.2 to the Registrant’s Quarterly Report on Form 10-Q filed with the Securities and Exchange Commission on December
7, 2016.
|
||
|
10.18
|
Executive Restricted Stock Unit Award Agreement; incorporated herein by reference to Exhibit 10.2 to the Registrant’s Quarterly Report on Form 10-Q filed with the Securities and Exchange Commission on June
13, 2018.
|
||
|
Subsidiaries of the Registrant
|
|||
|
21
|
List of Company’s Subsidiaries:
1) Hibbett Sporting Goods,
Inc., a Delaware Corporation
2) City Gear, LLC, a
Tennessee Limited Liability Company
3) Hibbett Digital
Management, LLC, an Alabama Limited Liability Company
4) Gift Card Services,
LLC., a Virginia Limited Liability Company
5) Hibbett Wholesale, Inc.,
an Alabama Corporation
6) Hibbett Holdings, LLC,
an Alabama Limited Liability Company
|
||
|
Consents of Experts and Counsel
|
|||
|
Consent of Independent Registered Public Accounting Firm (filed herewith)
|
76
|
||
|
Certifications
|
|||
|
Rule 13a-14(a)/15d-14(a) Certification of Principal Executive Officer (filed herewith)
|
77 | ||
|
Rule 13a-14(a)/15d-14(a) Certification of Principal Financial Officer (filed herewith)
|
78 | ||
|
Section 1350 Certification of Chief Executive Officer and Chief Financial Officer pursuant to Section 906 of the Sarbanes-Oxley Act of 2002
(filed herewith)
|
79 | ||
|
Interactive Data Files
|
|||
|
The following financial information from the Annual Report on Form 10-K for the fiscal year ended February 2, 2019, formatted in XBRL
(eXtensible Business Reporting Language) and submitted electronically herewith: (i) the Audited Consolidated Balance Sheets at February 2, 2019 and February 3, 2018; (ii) the Audited Consolidated Statements of Operations for the
fiscal years ended February 2, 2019, February 3, 2018 and January 28, 2017; (iii) the Audited Consolidated Statements of Cash Flows for the fiscal years ended February 2, 2019, February 3, 2018 and January 28, 2017; (vi) the Audited
Statements of Stockholders’ Investment for the fiscal years ended February 2, 2019, February 3, 2018 and January 28, 2017; (v) the Notes to Audited Consolidated Financial Statements.
|
|||
|
101.INS
|
* |
XBRL Instance Document
|
|
|
101.SCH
|
* |
XBRL Taxonomy Extension Schema Document
|
|
|
101.CAL
|
* |
XBRL Taxonomy Extension Calculation Linkbase Document
|
|
|
101.DEF
|
* |
XBRL Taxonomy Extension Definition Linkbase Document
|
|
|
101.LAB
|
* |
XBRL Taxonomy Extension Label Linkbase Document
|
|
|
101.PRE
|
* |
XBRL Taxonomy Extension Presentation Linkbase Document
|
|
| * |
Filed Within
|
Not applicable.
Pursuant to the requirements of Section 13 or 15(d) of the Exchange Act, the registrant has duly caused this report to be signed on
its behalf by the undersigned, thereunto duly authorized.
|
HIBBETT SPORTS, INC.
|
||
|
Date: April 18, 2019
|
By:
|
/s/ Scott J. Bowman
|
|
Scott J. Bowman
Senior Vice President and Chief Financial Officer (Principal
Financial and Accounting Officer)
|
||
Pursuant to the requirements of the Exchange Act, this report has been signed below by the following persons on behalf of the
registrant and in the capacities and on the dates indicated.
|
Signature
|
Title
|
Date
|
||
|
/s/ Jeffry O. Rosenthal
|
Chief Executive Officer, President and Director (Principal
Executive Officer)
|
April 18, 2019
|
||
|
Jeffry O. Rosenthal
|
||||
|
/s/ Scott J. Bowman
|
Senior Vice President and Chief Financial Officer (Principal
Financial and Accounting Officer)
|
April 18, 2019
|
||
|
Scott J. Bowman
|
||||
|
/s/ Michael J. Newsome
|
Chairman of the Board
|
April 18, 2019
|
||
|
Michael J. Newsome
|
||||
|
/s/ Anthony F. Crudele
|
Lead Director
|
April 18, 2019
|
||
|
Anthony F. Crudele
|
||||
|
/s/ Jane F. Aggers
|
Director
|
April 18, 2019
|
||
|
Jane F. Aggers
|
||||
|
/s/ Karen S. Etzkorn
|
Director
|
April 18, 2019
|
||
|
Karen S. Etzkorn
|
||||
|
/s/ Terrance G. Finley
|
Director
|
April 18, 2019
|
||
|
Terrance G. Finley
|
||||
|
/s/ James A. Hilt
|
Director
|
April 18, 2019
|
||
|
James A. Hilt
|
||||
|
/s/ Ralph T. Parks
|
Director
|
April 18, 2019
|
||
|
Ralph T. Parks
|
||||
|
/s/ Alton E. Yother
|
Director
|
April 18, 2019
|
||
|
Alton E. Yother
|
- 75 -