1 NASDAQ: CARV Annual Meeting of Stockholders MIST Harlem – September 24, 2015
2 Certain statements contained in this presentation are “forward-looking statements” within the meaning of Section 27A of the Securities Act of 1933 and Section 21E of the Securities Exchange Act of 1934. Such forward-looking statements which may be identified by the use of such words as “believe,” “expect,” “anticipate,” “intend,” “should,” “could,” “planned,” “estimated,” “potential” and similar terms and phrases. Forward-looking statements are subject to risks and uncertainties, including, but not limited to, those related to the economic environment, particularly in the market areas in which Carver Bancorp, Inc. (the “Company”) and Carver Federal Savings Bank (the “Bank”) operate, competitive products and pricing, fiscal and monetary policies of the U.S. Government, changes in government regulations affecting financial institutions, including regulatory fees and capital requirements, changes in prevailing interest rates, credit risk management, asset-liability management, the financial and securities markets and the availability of and costs associated with sources of liquidity. The Company wishes to caution readers not to place undue reliance on any forward-looking statements, which speak only as of the date made. The Company wishes to advise readers that the factors listed above could affect the Company’s financial performance and could cause the actual results for future periods to differ materially from any opinions or statements expressed with respect to future periods in any current statements. The Company and the Bank undertake no obligation to update these forward-looking statements to reflect events or circumstances that occur after the date on which such statements were made. Forward Looking Statements

3 The Economic Climate Agenda FY15 Accomplishments And Financial Performance Investing In Our Community Questions And Answers Path To Performance FY16 Return To Core Profitability
4 Generally, national and local economic conditions can heavily impact a bank’s financial results. Nationally, the economy continues to show signs of recovery. In the local market of NYC, the recovery has continued at a more modest pace. While the neighborhoods in Carver’s footprint are vibrant and full of potential, fueled by local construction and business and population growth, economic conditions remain challenging. The historically low interest rate environment has fueled competition for loans and deposits, causing spreads to shrink. The Economic Climate

5 The Economic Climate Agenda FY15 Accomplishments And Financial Performance Investing In Our Community Questions And Answers Path To Performance FY16 Return To Core Profitability

6 The accomplishments of the fiscal year ending March 31, 2015 position Carver for a return to sustained profitability: Regulatory Carver emerged from Cease & Desist Order in November 2014. The OCC also determined that the Bank is no longer in “troubled condition.” Earnings & Asset Quality Carver generated a modest profit of $364,000. The loan portfolio grew by $96 million (25% year over year) through: Expanding the Lending team. Emphasizing loan retention and generation of new business by the Portfolio Management team. Developing opportunities to purchase large pools of loans. Carver improved its credit quality by reducing Non-Performing Assets (“NPA”) and Non-Performing Loans (“NPL”). FY 15 Accomplishments
7 The accomplishments of FY15 position Carver for a return to profitability: New Products, Services & Technology Development of mobile and business on-line banking platforms and new retail banking products. Conversion to a new core banking platform and other vendor consolidations, resulting in substantial savings. Management Carver attracted new talent and expanded management’s roles and responsibilities, including a new Chief Executive Officer and Chief Lending Officer. Reorganization of the Credit and Lending Departments to improve operations and develop new business. FY 15 Accomplishments
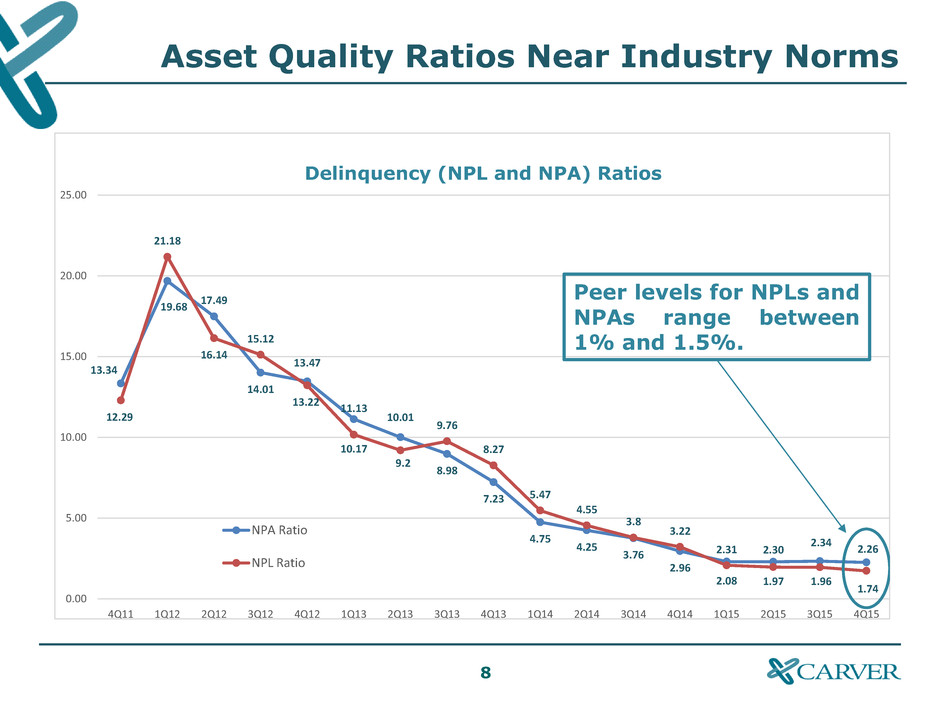
8 Asset Quality Ratios Near Industry Norms 13.34 19.68 17.49 14.01 13.47 11.13 10.01 8.98 7.23 4.75 4.25 3.76 2.96 2.31 2.30 2.34 2.26 12.29 21.18 16.14 15.12 13.22 10.17 9.2 9.76 8.27 5.47 4.55 3.8 3.22 2.08 1.97 1.96 1.74 0.00 5.00 10.00 15.00 20.00 25.00 4Q11 1Q12 2Q12 3Q12 4Q12 1Q13 2Q13 3Q13 4Q13 1Q14 2Q14 3Q14 4Q14 1Q15 2Q15 3Q15 4Q15 Delinquency (NPL and NPA) Ratios NPA Ratio NPL Ratio Peer levels for NPLs and NPAs range between 1% and 1.5%.

9 Performance: Key Operating Metrics Source: SNL Financial & public filings Net Income ($ in millions) $(39.5) $(23.4) $0.7 $(0.8) $0.4 2011 2012 2013 2014 2015 3.62% 2.99% 3.11% 3.35% 3.03% 2011 2012 2013 2014 2015 90.15% 131.43% 112.64% 104.87% 111.53% 2011 2012 2013 2014 2015 Net Interest Margin Efficiency Ratio $1.2 MM year over year improvement -5.08% -3.49% 0.11% -0.14% 0.06% 2011 2012 2013 2014 2015 Return on Average Assets All figures are for fiscal year end, March 31st

10 Capital Exceeds Regulatory Requirements At the Fiscal Year End March 31 A Tier 1 Leverage Ratio of 4% is required. 5.38% 9.83% 10.26% 10.38% 10.85% 0.00% 2.00% 4.00% 6.00% 8.00% 10.00% 12.00% 2011 2012 2013 2014 2015
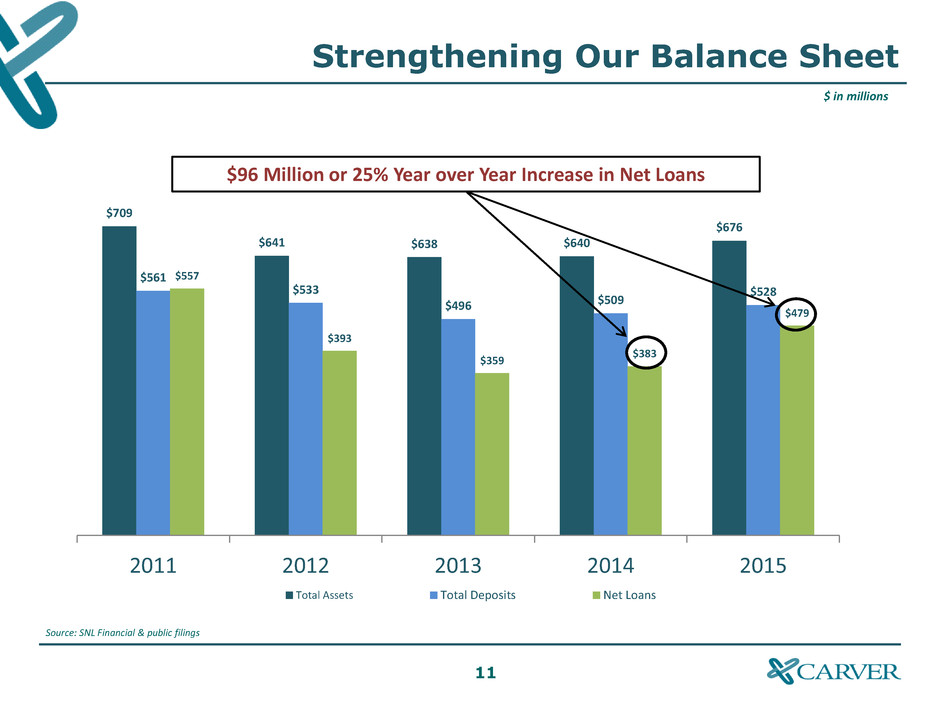
11 Strengthening Our Balance Sheet $ in millions Source: SNL Financial & public filings $709 $641 $638 $640 $676 $561 $533 $496 $509 $528 $557 $393 $359 $383 $479 2011 2012 2013 2014 2015 Total Assets Total Deposits Net Loans $96 Million or 25% Year over Year Increase in Net Loans

12 The Economic Climate Agenda FY15 Accomplishments And Financial Performance Investing In Our Community Questions And Answers Path To Performance FY16 Return To Core Profitability

13 Building a New Future: Path to Profitability Management has been focused on increasing core profits through specific division performance metrics. Lending Portfolio Management Retail Operations Increase Interest Income through Loan Growth Retain and Grow Relationships with Existing Customers New Business Development and Product Expansion Enhance Efficiency through Vendor Management and Facilities Rationalization Interest Income Non-Interest Income Expense Management

14 The Company reported its first core profitable quarter in the past three years in the first quarter of FY16 (as of June 30, 2015): – Modest profit of $178 thousand – Net interest margin of 3.14% – Tier 1 Leverage Ratio of 10.41% – Year over year comparisons for key operating metrics follow: Return to Core Profitability 0.06% 0.05% 2014 2015 Return on Average Assets 109.63% 95.14% 2014 2015 Efficiency Ratio 3.11% 3.14% 2014 2015 Net Interest Margin $173,000 $178,000 2014 2015 Net Income
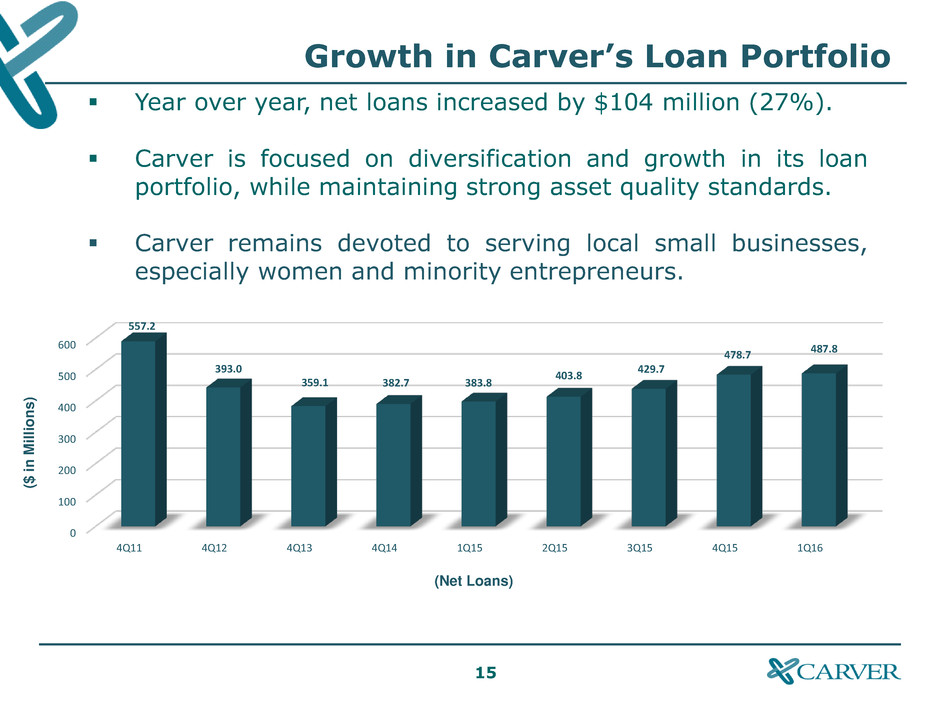
15 0 100 200 300 400 500 600 4Q11 4Q12 4Q13 4Q14 1Q15 2Q15 3Q15 4Q15 1Q16 557.2 393.0 359.1 382.7 383.8 403.8 429.7 478.7 487.8 (Net Loans) Year over year, net loans increased by $104 million (27%). Carver is focused on diversification and growth in its loan portfolio, while maintaining strong asset quality standards. Carver remains devoted to serving local small businesses, especially women and minority entrepreneurs. Growth in Carver’s Loan Portfolio ($ i n M il li o n s )

16 Lending In Communities Carver Serves 128 loans $96 MM 52 loans $24.7 MM 48 loans $23.7 MM 8 loans $2.4 MM 203 loans $161.3 MM 54 loans $51.3 MM 193 loans $69.0 MM 65 loans $29.6 MM Data as of June 30, 2015 83 cents of every dollar deposited with Carver is reinvested in the communities Carver serves. 60% of Carver’s loans are made to borrowers in low to moderate income neighborhoods.

17 Carver’s Lending Impact by Borough Borough Loans Aggregate Loan Amount Percentage of Loan Portfolio Manhattan 128 $96 million 20% Brooklyn 203 $161 million 33% Queens 65 $30 million 6% Bronx 54 $51 million 10% 69% of Carver loans are concentrated in the New York City boroughs of Manhattan, Brooklyn, Queens, and the Bronx. All figures as of June 30, 2015. At the time, Carver’s total loan portfolio was $492 million.
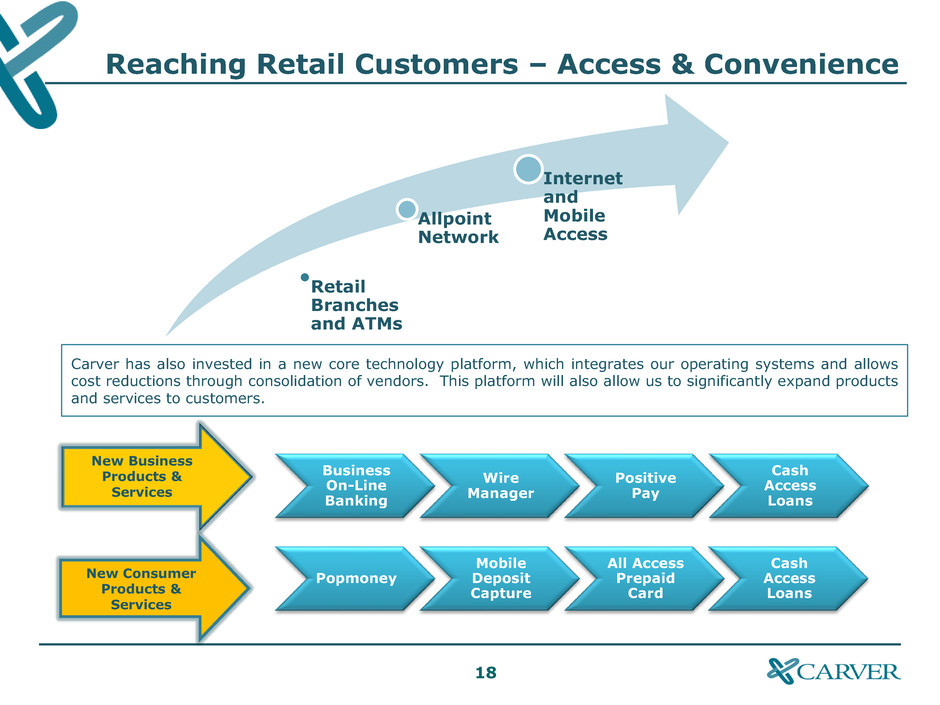
18 Retail Branches and ATMs Allpoint Network Internet and Mobile Access New Business Products & Services New Consumer Products & Services Popmoney Mobile Deposit Capture All Access Prepaid Card Cash Access Loans Carver has also invested in a new core technology platform, which integrates our operating systems and allows cost reductions through consolidation of vendors. This platform will also allow us to significantly expand products and services to customers. Reaching Retail Customers – Access & Convenience Business On-Line Banking Wire Manager Positive Pay Cash Access Loans
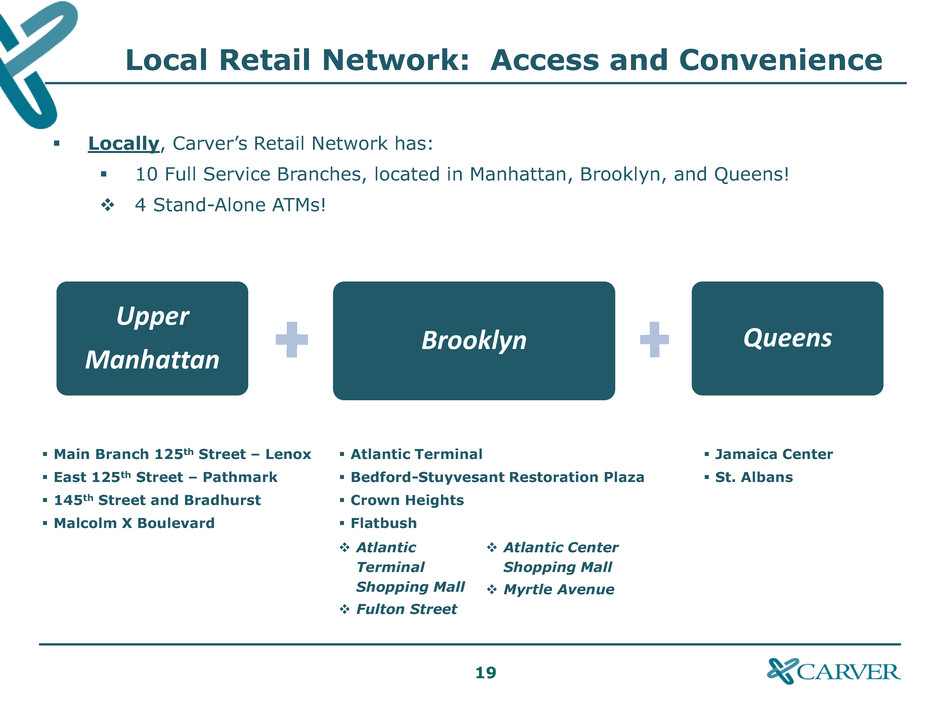
19 Local Retail Network: Access and Convenience Locally, Carver’s Retail Network has: 10 Full Service Branches, located in Manhattan, Brooklyn, and Queens! 4 Stand-Alone ATMs! Upper Manhattan Brooklyn Queens Main Branch 125th Street – Lenox East 125th Street – Pathmark 145th Street and Bradhurst Malcolm X Boulevard Atlantic Terminal Bedford-Stuyvesant Restoration Plaza Crown Heights Flatbush Jamaica Center St. Albans Atlantic Terminal Shopping Mall Fulton Street Atlantic Center Shopping Mall Myrtle Avenue
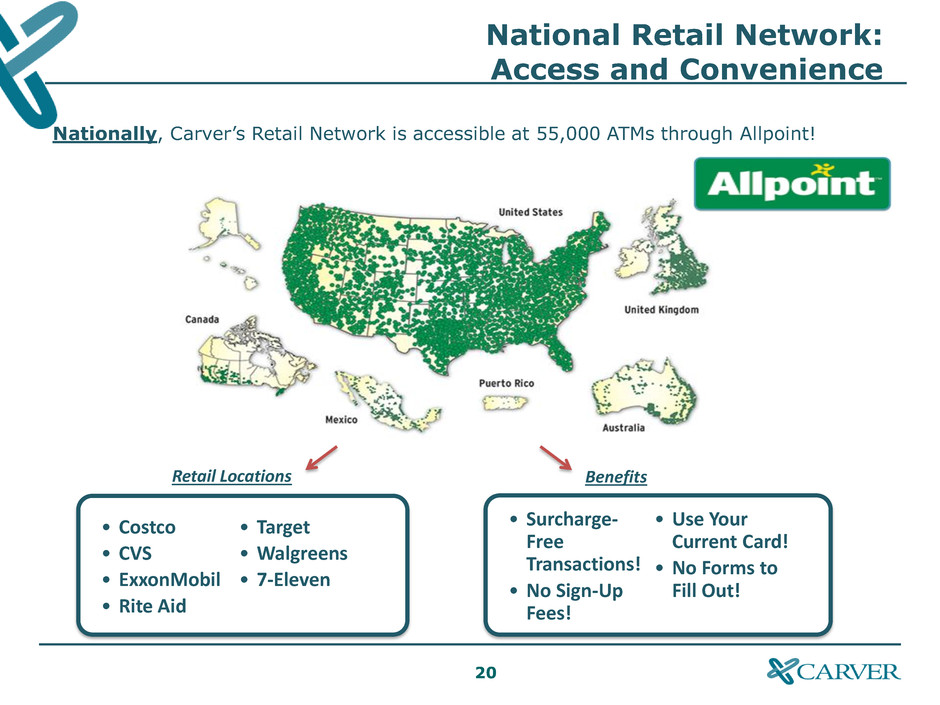
20 National Retail Network: Access and Convenience Nationally, Carver’s Retail Network is accessible at 55,000 ATMs through Allpoint! • Surcharge- Free Transactions! • No Sign-Up Fees! • Use Your Current Card! • No Forms to Fill Out! • Costco • CVS • ExxonMobil • Rite Aid • Target • Walgreens • 7-Eleven Benefits Retail Locations

21 Mobile and Online Banking: Access and Convenience Use your smart phone or tablet to access Carver from anywhere! Right at your fingertips! Carver Mobile Banking provides an easy and secure way to manage your banking needs: deposit checks or find the nearest Carver Bank location or ATM. Securely access your checking and savings accounts through Carver’s FREE Online Banking. View your balances in real time. Transfer funds between accounts. Monitor your expenses. Set up Account Alerts. Go green with e-statements. Statements online in one convenient place.
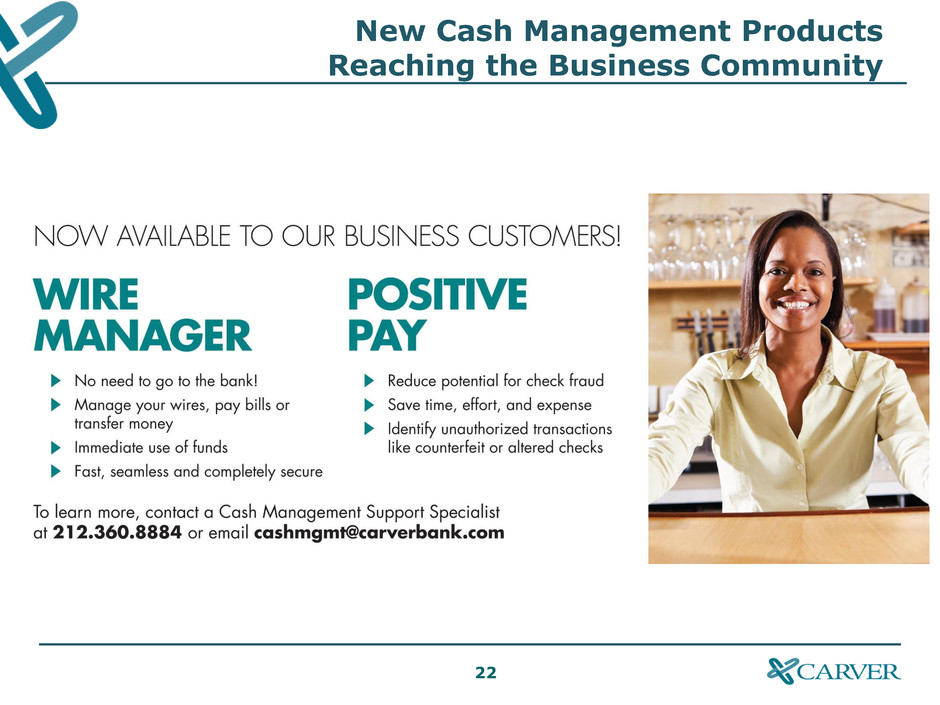
22 New Cash Management Products Reaching the Business Community
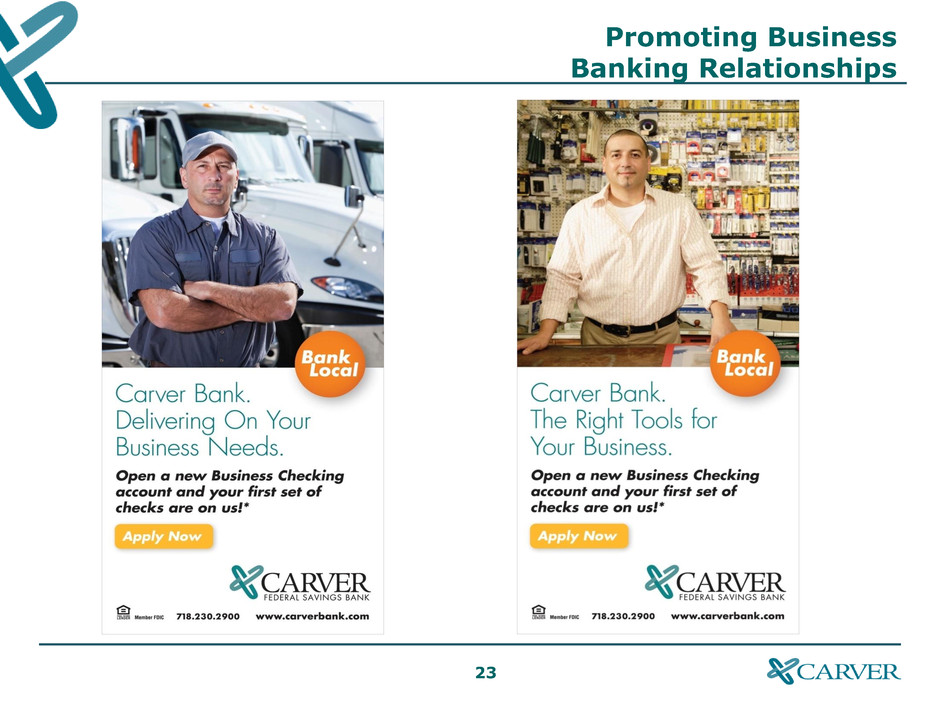
23 Promoting Business Banking Relationships
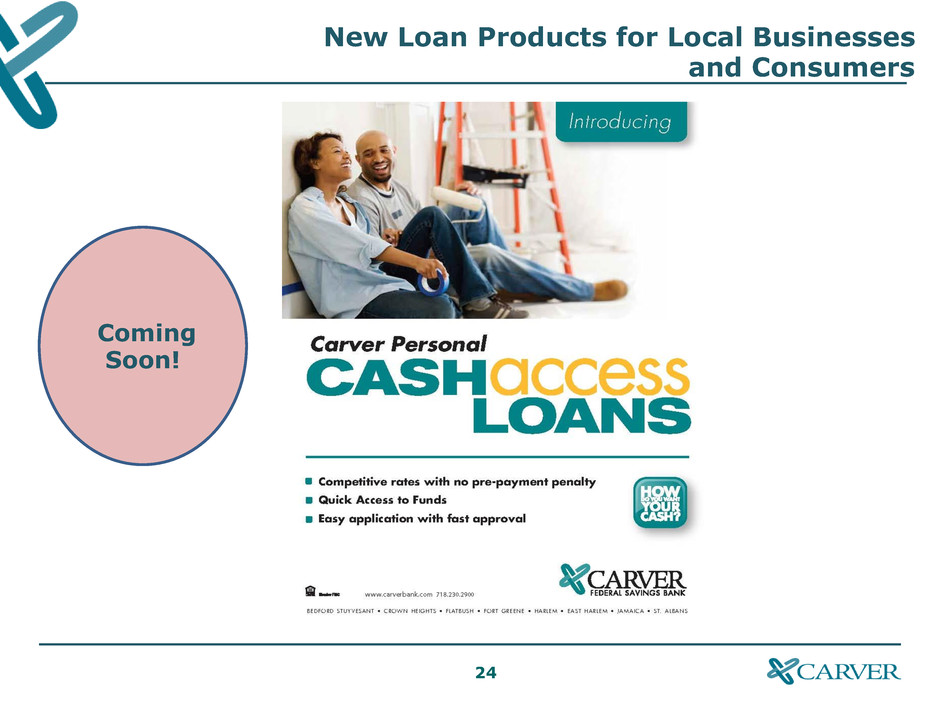
24 New Loan Products for Local Businesses and Consumers Coming Soon!
25 Overview Agenda FY15 Accomplishments And Financial Performance Investing In Our Community Questions And Answers Path To Performance FY16 Return To Core Profitability

26 Carver Community Development Corporation (CCDC) continues to provide high impact investment and financial services in local urban neighborhoods. CCDC has: $259 million in Carver loans to low and moderate income communities. Financed more than 1 million square feet of new commercial and retail space. Created and retained more than 3,900 local jobs. Provided free financial literacy to over 15,000 people. Community Development The Schomburg Harlem RBI Dream Charter School Lashay Construction

27 Small Business Skills Training Attendees Approx. 50 Local Business Owners including existing Carver customers and financial service professionals Outcomes All attendees left with a good understanding of The Seven Steps to Fiscal Fitness and the impact of sound financial management Business Results Better awareness of Carver products and services 5 business loan referrals 2 deposit accounts
28 The Economic Climate Agenda FY15 Accomplishments And Financial Performance Investing In Our Community Path To Performance FY16 Return To Core Profitability Questions And Answers
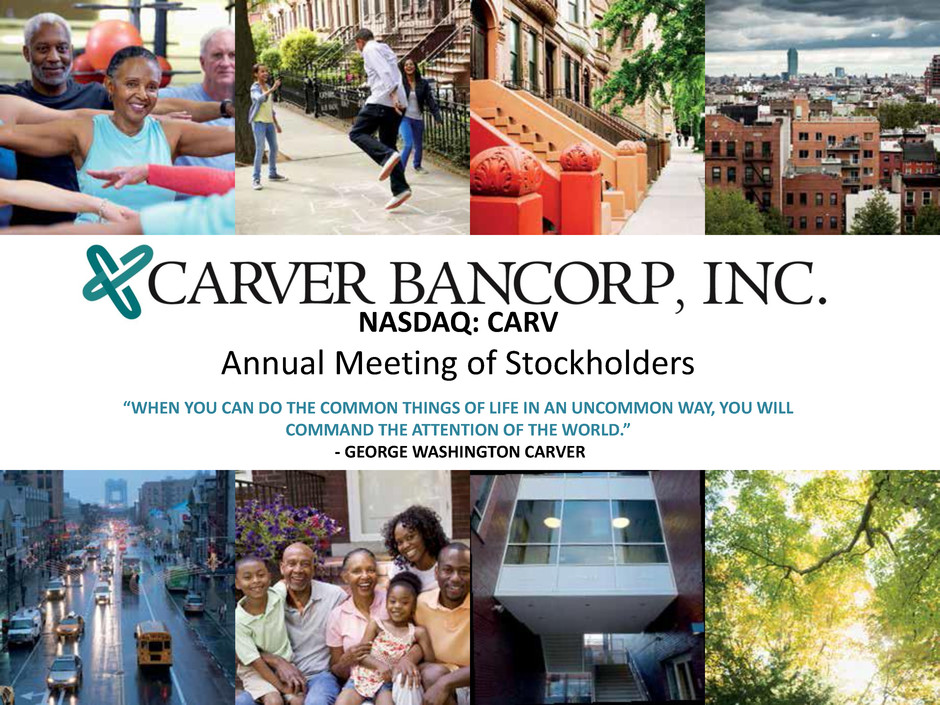
29 NASDAQ: CARV Annual Meeting of Stockholders “WHEN YOU CAN DO THE COMMON THINGS OF LIFE IN AN UNCOMMON WAY, YOU WILL COMMAND THE ATTENTION OF THE WORLD.” - GEORGE WASHINGTON CARVER