000101578012/312020Q1false19,86318,70825,92622,24686177007000.010.011,000,0001,000,000403,000403,000403,000403,0000.010.01400,000,000400,000,000221,032,420222,622,333221,032,420222,622,3330.140.1429.3829.382,650.002,650.0069,000796,00070,000756,000100,000979,00092,0002,700,00075,0001,440,00080,000897,000—————————————————————No32131.22.9520223.8020274.5020282.9520223.8020274.5020285.8754.4355.303.162020-04-222020-05-132020-05-196.6700010157802020-01-012020-03-31xbrli:shares00010157802020-04-30iso4217:USD00010157802019-01-012019-03-310001015780us-gaap:FinancialServiceMember2020-01-012020-03-310001015780us-gaap:FinancialServiceMember2019-01-012019-03-310001015780etfc:FeesAndServiceChargesMember2020-01-012020-03-310001015780etfc:FeesAndServiceChargesMember2019-01-012019-03-31iso4217:USDxbrli:shares00010157802020-03-3100010157802019-12-310001015780us-gaap:PreferredStockMember2019-12-310001015780us-gaap:CommonStockMember2019-12-310001015780us-gaap:AdditionalPaidInCapitalMember2019-12-310001015780us-gaap:RetainedEarningsMember2019-12-310001015780us-gaap:AccumulatedOtherComprehensiveIncomeMember2019-12-310001015780us-gaap:RetainedEarningsMemberus-gaap:AccountingStandardsUpdate201613Member2020-01-012020-03-310001015780us-gaap:AccountingStandardsUpdate201613Member2020-01-012020-03-310001015780us-gaap:RetainedEarningsMember2020-01-012020-03-310001015780us-gaap:AccumulatedOtherComprehensiveIncomeMember2020-01-012020-03-310001015780us-gaap:RetainedEarningsMemberus-gaap:PreferredClassAMember2020-01-012020-03-310001015780us-gaap:PreferredClassAMember2020-01-012020-03-310001015780us-gaap:RetainedEarningsMemberus-gaap:PreferredClassBMember2020-01-012020-03-310001015780us-gaap:PreferredClassBMember2020-01-012020-03-310001015780us-gaap:CommonStockMember2020-01-012020-03-310001015780us-gaap:AdditionalPaidInCapitalMember2020-01-012020-03-310001015780us-gaap:PreferredStockMember2020-03-310001015780us-gaap:CommonStockMember2020-03-310001015780us-gaap:AdditionalPaidInCapitalMember2020-03-310001015780us-gaap:RetainedEarningsMember2020-03-310001015780us-gaap:AccumulatedOtherComprehensiveIncomeMember2020-03-310001015780us-gaap:PreferredStockMember2018-12-310001015780us-gaap:CommonStockMember2018-12-310001015780us-gaap:AdditionalPaidInCapitalMember2018-12-310001015780us-gaap:RetainedEarningsMember2018-12-310001015780us-gaap:AccumulatedOtherComprehensiveIncomeMember2018-12-3100010157802018-12-310001015780us-gaap:RetainedEarningsMember2019-01-012019-03-310001015780us-gaap:AccumulatedOtherComprehensiveIncomeMember2019-01-012019-03-310001015780us-gaap:RetainedEarningsMemberus-gaap:PreferredClassAMember2019-01-012019-03-310001015780us-gaap:PreferredClassAMember2019-01-012019-03-310001015780us-gaap:RetainedEarningsMemberus-gaap:PreferredClassBMember2019-01-012019-03-310001015780us-gaap:PreferredClassBMember2019-01-012019-03-310001015780us-gaap:CommonStockMember2019-01-012019-03-310001015780us-gaap:AdditionalPaidInCapitalMember2019-01-012019-03-310001015780us-gaap:PreferredStockMember2019-03-310001015780us-gaap:CommonStockMember2019-03-310001015780us-gaap:AdditionalPaidInCapitalMember2019-03-310001015780us-gaap:RetainedEarningsMember2019-03-310001015780us-gaap:AccumulatedOtherComprehensiveIncomeMember2019-03-3100010157802019-03-310001015780etfc:Covid19Member2020-01-012020-03-310001015780us-gaap:AvailableforsaleSecuritiesMember2020-03-310001015780us-gaap:HeldtomaturitySecuritiesMember2020-03-310001015780etfc:ReceivablesFromBrokerDealersAndClearingOrganizationsMember2020-01-012020-03-310001015780etfc:MorganStanleyMember2020-01-012020-03-310001015780etfc:GradifiMember2019-12-092019-12-090001015780etfc:GradifiMemberus-gaap:TechnologyBasedIntangibleAssetsMember2019-12-092019-12-090001015780etfc:GradifiMemberus-gaap:TechnologyBasedIntangibleAssetsMember2020-01-012020-03-310001015780etfc:GradifiMember2020-01-012020-03-310001015780etfc:OptionsContractMember2019-10-070001015780etfc:ActiveTraderPricingMember2019-10-070001015780etfc:MoneyMarketFundsAndSweepDepositsRevenueMember2020-01-012020-03-310001015780etfc:OrderFlowRevenueMember2019-01-012019-03-310001015780etfc:OrderFlowRevenueMember2020-01-012020-03-310001015780etfc:MoneyMarketFundsAndSweepDepositsRevenueMember2019-01-012019-03-310001015780us-gaap:InvestmentAdvisoryManagementAndAdministrativeServiceMember2020-01-012020-03-310001015780us-gaap:InvestmentAdvisoryManagementAndAdministrativeServiceMember2019-01-012019-03-310001015780etfc:MutualFundServiceFeesMember2020-01-012020-03-310001015780etfc:MutualFundServiceFeesMember2019-01-012019-03-310001015780etfc:ForeignExchangeRevenueMember2020-01-012020-03-310001015780etfc:ForeignExchangeRevenueMember2019-01-012019-03-310001015780etfc:ReorganizationFeesMember2020-01-012020-03-310001015780etfc:ReorganizationFeesMember2019-01-012019-03-310001015780us-gaap:FinancialServiceOtherMember2020-01-012020-03-310001015780us-gaap:FinancialServiceOtherMember2019-01-012019-03-310001015780srt:ArithmeticAverageMemberus-gaap:RealEstateLoanMemberus-gaap:FairValueMeasurementsNonrecurringMemberus-gaap:MeasurementInputAppraisedValueMemberus-gaap:FairValueInputsLevel3Member2020-03-310001015780srt:ArithmeticAverageMemberus-gaap:FairValueMeasurementsNonrecurringMemberus-gaap:MeasurementInputAppraisedValueMemberus-gaap:FairValueInputsLevel3Memberus-gaap:HomeEquityMember2020-03-310001015780srt:ArithmeticAverageMemberus-gaap:FairValueMeasurementsNonrecurringMemberus-gaap:MeasurementInputAppraisedValueMemberus-gaap:FairValueInputsLevel3Member2020-03-310001015780srt:ArithmeticAverageMemberus-gaap:RealEstateLoanMemberus-gaap:FairValueMeasurementsNonrecurringMemberus-gaap:MeasurementInputAppraisedValueMemberus-gaap:FairValueInputsLevel3Member2019-12-310001015780srt:ArithmeticAverageMemberus-gaap:FairValueMeasurementsNonrecurringMemberus-gaap:MeasurementInputAppraisedValueMemberus-gaap:FairValueInputsLevel3Memberus-gaap:HomeEquityMember2019-12-310001015780srt:ArithmeticAverageMemberus-gaap:FairValueMeasurementsNonrecurringMemberus-gaap:MeasurementInputAppraisedValueMemberus-gaap:FairValueInputsLevel3Member2019-12-310001015780us-gaap:MortgageBackedSecuritiesIssuedByUSGovernmentSponsoredEnterprisesMemberus-gaap:FairValueInputsLevel2Memberus-gaap:FairValueMeasurementsRecurringMember2020-03-310001015780us-gaap:MortgageBackedSecuritiesIssuedByUSGovernmentSponsoredEnterprisesMemberus-gaap:FairValueMeasurementsRecurringMember2020-03-310001015780us-gaap:FairValueInputsLevel2Memberus-gaap:FairValueMeasurementsRecurringMemberus-gaap:USTreasuryAndGovernmentMember2020-03-310001015780us-gaap:FairValueMeasurementsRecurringMemberus-gaap:USTreasuryAndGovernmentMember2020-03-310001015780us-gaap:FairValueInputsLevel2Memberus-gaap:FairValueMeasurementsRecurringMemberus-gaap:USTreasurySecuritiesMember2020-03-310001015780us-gaap:FairValueMeasurementsRecurringMemberus-gaap:USTreasurySecuritiesMember2020-03-310001015780us-gaap:FairValueInputsLevel2Memberus-gaap:FairValueMeasurementsRecurringMemberus-gaap:AssetBackedSecuritiesMember2020-03-310001015780us-gaap:FairValueMeasurementsRecurringMemberus-gaap:AssetBackedSecuritiesMember2020-03-310001015780us-gaap:FairValueInputsLevel2Memberus-gaap:FairValueMeasurementsRecurringMemberus-gaap:CommercialMortgageBackedSecuritiesMember2020-03-310001015780us-gaap:FairValueMeasurementsRecurringMemberus-gaap:CommercialMortgageBackedSecuritiesMember2020-03-310001015780us-gaap:FairValueInputsLevel2Memberus-gaap:FairValueMeasurementsRecurringMember2020-03-310001015780us-gaap:FairValueMeasurementsRecurringMember2020-03-310001015780us-gaap:LoansReceivableMemberus-gaap:RealEstateLoanMemberus-gaap:FairValueMeasurementsNonrecurringMemberus-gaap:FairValueInputsLevel3Member2020-03-310001015780us-gaap:LoansReceivableMemberus-gaap:RealEstateLoanMemberus-gaap:FairValueMeasurementsNonrecurringMember2020-03-310001015780us-gaap:LoansReceivableMemberus-gaap:FairValueMeasurementsNonrecurringMemberus-gaap:FairValueInputsLevel3Memberus-gaap:HomeEquityMember2020-03-310001015780us-gaap:LoansReceivableMemberus-gaap:FairValueMeasurementsNonrecurringMemberus-gaap:HomeEquityMember2020-03-310001015780us-gaap:FairValueMeasurementsNonrecurringMemberus-gaap:FairValueInputsLevel3Member2020-03-310001015780us-gaap:FairValueMeasurementsNonrecurringMember2020-03-31xbrli:pure0001015780us-gaap:MortgageBackedSecuritiesIssuedByUSGovernmentSponsoredEnterprisesMemberus-gaap:FairValueInputsLevel2Memberus-gaap:FairValueMeasurementsRecurringMember2019-12-310001015780us-gaap:MortgageBackedSecuritiesIssuedByUSGovernmentSponsoredEnterprisesMemberus-gaap:FairValueMeasurementsRecurringMember2019-12-310001015780us-gaap:FairValueInputsLevel2Memberus-gaap:FairValueMeasurementsRecurringMemberus-gaap:USTreasuryAndGovernmentMember2019-12-310001015780us-gaap:FairValueMeasurementsRecurringMemberus-gaap:USTreasuryAndGovernmentMember2019-12-310001015780us-gaap:FairValueInputsLevel2Memberus-gaap:FairValueMeasurementsRecurringMemberus-gaap:USTreasurySecuritiesMember2019-12-310001015780us-gaap:FairValueMeasurementsRecurringMemberus-gaap:USTreasurySecuritiesMember2019-12-310001015780us-gaap:FairValueInputsLevel2Memberus-gaap:FairValueMeasurementsRecurringMemberus-gaap:AssetBackedSecuritiesMember2019-12-310001015780us-gaap:FairValueMeasurementsRecurringMemberus-gaap:AssetBackedSecuritiesMember2019-12-310001015780us-gaap:FairValueInputsLevel2Memberus-gaap:FairValueMeasurementsRecurringMemberus-gaap:CommercialMortgageBackedSecuritiesMember2019-12-310001015780us-gaap:FairValueMeasurementsRecurringMemberus-gaap:CommercialMortgageBackedSecuritiesMember2019-12-310001015780us-gaap:FairValueInputsLevel2Memberus-gaap:FairValueMeasurementsRecurringMember2019-12-310001015780us-gaap:FairValueMeasurementsRecurringMember2019-12-310001015780us-gaap:LoansReceivableMemberus-gaap:RealEstateLoanMemberus-gaap:FairValueMeasurementsNonrecurringMemberus-gaap:FairValueInputsLevel3Member2019-12-310001015780us-gaap:LoansReceivableMemberus-gaap:RealEstateLoanMemberus-gaap:FairValueMeasurementsNonrecurringMember2019-12-310001015780us-gaap:LoansReceivableMemberus-gaap:FairValueMeasurementsNonrecurringMemberus-gaap:FairValueInputsLevel3Memberus-gaap:HomeEquityMember2019-12-310001015780us-gaap:LoansReceivableMemberus-gaap:FairValueMeasurementsNonrecurringMemberus-gaap:HomeEquityMember2019-12-310001015780us-gaap:FairValueMeasurementsNonrecurringMemberus-gaap:FairValueInputsLevel3Member2019-12-310001015780us-gaap:FairValueMeasurementsNonrecurringMember2019-12-310001015780us-gaap:CarryingReportedAmountFairValueDisclosureMember2020-03-310001015780us-gaap:FairValueInputsLevel1Memberus-gaap:EstimateOfFairValueFairValueDisclosureMember2020-03-310001015780us-gaap:EstimateOfFairValueFairValueDisclosureMember2020-03-310001015780us-gaap:MortgageBackedSecuritiesIssuedByUSGovernmentSponsoredEnterprisesMemberus-gaap:CarryingReportedAmountFairValueDisclosureMember2020-03-310001015780us-gaap:MortgageBackedSecuritiesIssuedByUSGovernmentSponsoredEnterprisesMemberus-gaap:EstimateOfFairValueFairValueDisclosureMemberus-gaap:FairValueInputsLevel2Member2020-03-310001015780us-gaap:MortgageBackedSecuritiesIssuedByUSGovernmentSponsoredEnterprisesMemberus-gaap:EstimateOfFairValueFairValueDisclosureMember2020-03-310001015780us-gaap:CarryingReportedAmountFairValueDisclosureMemberus-gaap:USTreasuryAndGovernmentMember2020-03-310001015780us-gaap:EstimateOfFairValueFairValueDisclosureMemberus-gaap:FairValueInputsLevel2Memberus-gaap:USTreasuryAndGovernmentMember2020-03-310001015780us-gaap:EstimateOfFairValueFairValueDisclosureMemberus-gaap:USTreasuryAndGovernmentMember2020-03-310001015780us-gaap:CarryingReportedAmountFairValueDisclosureMemberetfc:AgencyDebtSecuritiesMember2020-03-310001015780us-gaap:EstimateOfFairValueFairValueDisclosureMemberus-gaap:FairValueInputsLevel2Memberetfc:AgencyDebtSecuritiesMember2020-03-310001015780us-gaap:EstimateOfFairValueFairValueDisclosureMemberetfc:AgencyDebtSecuritiesMember2020-03-310001015780us-gaap:FairValueInputsLevel2Memberus-gaap:EstimateOfFairValueFairValueDisclosureMember2020-03-310001015780us-gaap:CarryingReportedAmountFairValueDisclosureMemberus-gaap:RealEstateLoanMember2020-03-310001015780us-gaap:RealEstateLoanMemberus-gaap:EstimateOfFairValueFairValueDisclosureMemberus-gaap:FairValueInputsLevel3Member2020-03-310001015780us-gaap:RealEstateLoanMemberus-gaap:EstimateOfFairValueFairValueDisclosureMember2020-03-310001015780us-gaap:CarryingReportedAmountFairValueDisclosureMemberus-gaap:HomeEquityMember2020-03-310001015780us-gaap:EstimateOfFairValueFairValueDisclosureMemberus-gaap:FairValueInputsLevel3Memberus-gaap:HomeEquityMember2020-03-310001015780us-gaap:EstimateOfFairValueFairValueDisclosureMemberus-gaap:HomeEquityMember2020-03-310001015780us-gaap:CarryingReportedAmountFairValueDisclosureMemberetfc:SecuritiesBasedLendingMember2020-03-310001015780us-gaap:EstimateOfFairValueFairValueDisclosureMemberetfc:SecuritiesBasedLendingMemberus-gaap:FairValueInputsLevel2Member2020-03-310001015780us-gaap:EstimateOfFairValueFairValueDisclosureMemberetfc:SecuritiesBasedLendingMember2020-03-310001015780us-gaap:EstimateOfFairValueFairValueDisclosureMemberus-gaap:FairValueInputsLevel3Member2020-03-310001015780us-gaap:CarryingReportedAmountFairValueDisclosureMember2019-12-310001015780us-gaap:FairValueInputsLevel1Memberus-gaap:EstimateOfFairValueFairValueDisclosureMember2019-12-310001015780us-gaap:EstimateOfFairValueFairValueDisclosureMember2019-12-310001015780us-gaap:MortgageBackedSecuritiesIssuedByUSGovernmentSponsoredEnterprisesMemberus-gaap:CarryingReportedAmountFairValueDisclosureMember2019-12-310001015780us-gaap:MortgageBackedSecuritiesIssuedByUSGovernmentSponsoredEnterprisesMemberus-gaap:EstimateOfFairValueFairValueDisclosureMemberus-gaap:FairValueInputsLevel2Member2019-12-310001015780us-gaap:MortgageBackedSecuritiesIssuedByUSGovernmentSponsoredEnterprisesMemberus-gaap:EstimateOfFairValueFairValueDisclosureMember2019-12-310001015780us-gaap:CarryingReportedAmountFairValueDisclosureMemberus-gaap:USTreasuryAndGovernmentMember2019-12-310001015780us-gaap:EstimateOfFairValueFairValueDisclosureMemberus-gaap:FairValueInputsLevel2Memberus-gaap:USTreasuryAndGovernmentMember2019-12-310001015780us-gaap:EstimateOfFairValueFairValueDisclosureMemberus-gaap:USTreasuryAndGovernmentMember2019-12-310001015780us-gaap:CarryingReportedAmountFairValueDisclosureMemberetfc:AgencyDebtSecuritiesMember2019-12-310001015780us-gaap:EstimateOfFairValueFairValueDisclosureMemberus-gaap:FairValueInputsLevel2Memberetfc:AgencyDebtSecuritiesMember2019-12-310001015780us-gaap:EstimateOfFairValueFairValueDisclosureMemberetfc:AgencyDebtSecuritiesMember2019-12-310001015780us-gaap:FairValueInputsLevel2Memberus-gaap:EstimateOfFairValueFairValueDisclosureMember2019-12-310001015780us-gaap:CarryingReportedAmountFairValueDisclosureMemberus-gaap:RealEstateLoanMember2019-12-310001015780us-gaap:RealEstateLoanMemberus-gaap:EstimateOfFairValueFairValueDisclosureMemberus-gaap:FairValueInputsLevel3Member2019-12-310001015780us-gaap:RealEstateLoanMemberus-gaap:EstimateOfFairValueFairValueDisclosureMember2019-12-310001015780us-gaap:CarryingReportedAmountFairValueDisclosureMemberus-gaap:HomeEquityMember2019-12-310001015780us-gaap:EstimateOfFairValueFairValueDisclosureMemberus-gaap:FairValueInputsLevel3Memberus-gaap:HomeEquityMember2019-12-310001015780us-gaap:EstimateOfFairValueFairValueDisclosureMemberus-gaap:HomeEquityMember2019-12-310001015780us-gaap:CarryingReportedAmountFairValueDisclosureMemberetfc:SecuritiesBasedLendingMember2019-12-310001015780us-gaap:EstimateOfFairValueFairValueDisclosureMemberetfc:SecuritiesBasedLendingMemberus-gaap:FairValueInputsLevel2Member2019-12-310001015780us-gaap:EstimateOfFairValueFairValueDisclosureMemberetfc:SecuritiesBasedLendingMember2019-12-310001015780us-gaap:EstimateOfFairValueFairValueDisclosureMemberus-gaap:FairValueInputsLevel3Member2019-12-310001015780etfc:FullyPaidLendingProgramMember2019-12-310001015780us-gaap:RealEstateLoanMemberus-gaap:FairValueMeasurementsNonrecurringMembersrt:MinimumMemberus-gaap:MeasurementInputAppraisedValueMemberus-gaap:FairValueInputsLevel3Member2020-03-310001015780srt:MaximumMemberus-gaap:RealEstateLoanMemberus-gaap:FairValueMeasurementsNonrecurringMemberus-gaap:MeasurementInputAppraisedValueMemberus-gaap:FairValueInputsLevel3Member2020-03-310001015780us-gaap:FairValueMeasurementsNonrecurringMembersrt:MinimumMemberus-gaap:MeasurementInputAppraisedValueMemberus-gaap:FairValueInputsLevel3Memberus-gaap:HomeEquityMember2020-03-310001015780srt:MaximumMemberus-gaap:FairValueMeasurementsNonrecurringMemberus-gaap:MeasurementInputAppraisedValueMemberus-gaap:FairValueInputsLevel3Memberus-gaap:HomeEquityMember2020-03-310001015780us-gaap:FairValueMeasurementsNonrecurringMembersrt:MinimumMemberus-gaap:MeasurementInputAppraisedValueMemberus-gaap:FairValueInputsLevel3Member2020-03-310001015780srt:MaximumMemberus-gaap:FairValueMeasurementsNonrecurringMemberus-gaap:MeasurementInputAppraisedValueMemberus-gaap:FairValueInputsLevel3Member2020-03-310001015780us-gaap:RealEstateLoanMemberus-gaap:FairValueMeasurementsNonrecurringMembersrt:MinimumMemberus-gaap:MeasurementInputAppraisedValueMemberus-gaap:FairValueInputsLevel3Member2019-12-310001015780srt:MaximumMemberus-gaap:RealEstateLoanMemberus-gaap:FairValueMeasurementsNonrecurringMemberus-gaap:MeasurementInputAppraisedValueMemberus-gaap:FairValueInputsLevel3Member2019-12-310001015780us-gaap:FairValueMeasurementsNonrecurringMembersrt:MinimumMemberus-gaap:MeasurementInputAppraisedValueMemberus-gaap:FairValueInputsLevel3Memberus-gaap:HomeEquityMember2019-12-310001015780srt:MaximumMemberus-gaap:FairValueMeasurementsNonrecurringMemberus-gaap:MeasurementInputAppraisedValueMemberus-gaap:FairValueInputsLevel3Memberus-gaap:HomeEquityMember2019-12-310001015780us-gaap:FairValueMeasurementsNonrecurringMembersrt:MinimumMemberus-gaap:MeasurementInputAppraisedValueMemberus-gaap:FairValueInputsLevel3Member2019-12-310001015780srt:MaximumMemberus-gaap:FairValueMeasurementsNonrecurringMemberus-gaap:MeasurementInputAppraisedValueMemberus-gaap:FairValueInputsLevel3Member2019-12-3100010157802019-01-012019-12-310001015780us-gaap:ExchangeClearedMember2020-03-310001015780us-gaap:ExchangeClearedMember2019-12-310001015780us-gaap:MortgageBackedSecuritiesIssuedByUSGovernmentSponsoredEnterprisesMember2020-03-310001015780us-gaap:USTreasuryAndGovernmentMember2020-03-310001015780us-gaap:USTreasurySecuritiesMember2020-03-310001015780us-gaap:AssetBackedSecuritiesMember2020-03-310001015780us-gaap:CommercialMortgageBackedSecuritiesMember2020-03-310001015780etfc:AgencyDebtSecuritiesMember2020-03-310001015780us-gaap:MortgageBackedSecuritiesIssuedByUSGovernmentSponsoredEnterprisesMember2019-12-310001015780us-gaap:USTreasuryAndGovernmentMember2019-12-310001015780us-gaap:USTreasurySecuritiesMember2019-12-310001015780us-gaap:AssetBackedSecuritiesMember2019-12-310001015780us-gaap:CommercialMortgageBackedSecuritiesMember2019-12-310001015780etfc:AgencyDebtSecuritiesMember2019-12-310001015780us-gaap:CreditCardReceivablesMember2020-03-310001015780us-gaap:AutomobileLoanMember2020-03-310001015780us-gaap:StudentLoanMember2020-03-310001015780us-gaap:CreditCardReceivablesMember2019-12-310001015780us-gaap:AutomobileLoanMember2019-12-310001015780us-gaap:StudentLoanMember2019-12-3100010157802019-10-012019-12-310001015780us-gaap:CollateralPledgedMember2020-03-310001015780us-gaap:CollateralPledgedMember2019-12-310001015780us-gaap:AccountingStandardsUpdate201613Member2020-01-012020-03-310001015780etfc:Covid19Member2020-01-012020-03-310001015780us-gaap:RealEstateLoanMember2020-03-310001015780us-gaap:RealEstateLoanMemberetfc:FinancingReceivables30To89DaysPastDueMember2020-03-310001015780etfc:FinancingReceivables90To179DaysPastDueMemberus-gaap:RealEstateLoanMember2020-03-310001015780us-gaap:RealEstateLoanMemberetfc:FinancingReceivablesEqualtoGreaterthan180DaysPastDueMember2020-03-310001015780us-gaap:HomeEquityMember2020-03-310001015780etfc:FinancingReceivables30To89DaysPastDueMemberus-gaap:HomeEquityMember2020-03-310001015780etfc:FinancingReceivables90To179DaysPastDueMemberus-gaap:HomeEquityMember2020-03-310001015780etfc:FinancingReceivablesEqualtoGreaterthan180DaysPastDueMemberus-gaap:HomeEquityMember2020-03-310001015780etfc:SecuritiesBasedLendingMember2020-03-310001015780etfc:SecuritiesBasedLendingMemberetfc:FinancingReceivables30To89DaysPastDueMember2020-03-310001015780etfc:FinancingReceivables90To179DaysPastDueMemberetfc:SecuritiesBasedLendingMember2020-03-310001015780etfc:SecuritiesBasedLendingMemberetfc:FinancingReceivablesEqualtoGreaterthan180DaysPastDueMember2020-03-310001015780etfc:FinancingReceivables30To89DaysPastDueMember2020-03-310001015780etfc:FinancingReceivables90To179DaysPastDueMember2020-03-310001015780etfc:FinancingReceivablesEqualtoGreaterthan180DaysPastDueMember2020-03-310001015780us-gaap:RealEstateLoanMember2019-12-310001015780us-gaap:RealEstateLoanMemberetfc:FinancingReceivables30To89DaysPastDueMember2019-12-310001015780etfc:FinancingReceivables90To179DaysPastDueMemberus-gaap:RealEstateLoanMember2019-12-310001015780us-gaap:RealEstateLoanMemberetfc:FinancingReceivablesEqualtoGreaterthan180DaysPastDueMember2019-12-310001015780us-gaap:HomeEquityMember2019-12-310001015780etfc:FinancingReceivables30To89DaysPastDueMemberus-gaap:HomeEquityMember2019-12-310001015780etfc:FinancingReceivables90To179DaysPastDueMemberus-gaap:HomeEquityMember2019-12-310001015780etfc:FinancingReceivablesEqualtoGreaterthan180DaysPastDueMemberus-gaap:HomeEquityMember2019-12-310001015780etfc:SecuritiesBasedLendingMember2019-12-310001015780etfc:SecuritiesBasedLendingMemberetfc:FinancingReceivables30To89DaysPastDueMember2019-12-310001015780etfc:FinancingReceivables90To179DaysPastDueMemberetfc:SecuritiesBasedLendingMember2019-12-310001015780etfc:SecuritiesBasedLendingMemberetfc:FinancingReceivablesEqualtoGreaterthan180DaysPastDueMember2019-12-310001015780etfc:FinancingReceivables30To89DaysPastDueMember2019-12-310001015780etfc:FinancingReceivables90To179DaysPastDueMember2019-12-310001015780etfc:FinancingReceivablesEqualtoGreaterthan180DaysPastDueMember2019-12-310001015780etfc:EtradeLineOfCreditMember2020-03-310001015780etfc:EtradeLineOfCreditMember2019-12-310001015780us-gaap:LtvLessThan80PercentMemberus-gaap:RealEstateLoanMember2020-03-310001015780us-gaap:LtvLessThan80PercentMemberus-gaap:RealEstateLoanMember2019-12-310001015780us-gaap:LtvLessThan80PercentMemberus-gaap:HomeEquityMember2020-03-310001015780us-gaap:LtvLessThan80PercentMemberus-gaap:HomeEquityMember2019-12-310001015780us-gaap:RealEstateLoanMemberus-gaap:Ltv80To100PercentMember2020-03-310001015780us-gaap:RealEstateLoanMemberus-gaap:Ltv80To100PercentMember2019-12-310001015780us-gaap:Ltv80To100PercentMemberus-gaap:HomeEquityMember2020-03-310001015780us-gaap:Ltv80To100PercentMemberus-gaap:HomeEquityMember2019-12-310001015780etfc:LTV100To120PercentMemberus-gaap:RealEstateLoanMember2020-03-310001015780etfc:LTV100To120PercentMemberus-gaap:RealEstateLoanMember2019-12-310001015780etfc:LTV100To120PercentMemberus-gaap:HomeEquityMember2020-03-310001015780etfc:LTV100To120PercentMemberus-gaap:HomeEquityMember2019-12-310001015780us-gaap:RealEstateLoanMemberetfc:LTVGreaterThan120PercentMember2020-03-310001015780us-gaap:RealEstateLoanMemberetfc:LTVGreaterThan120PercentMember2019-12-310001015780etfc:LTVGreaterThan120PercentMemberus-gaap:HomeEquityMember2020-03-310001015780etfc:LTVGreaterThan120PercentMemberus-gaap:HomeEquityMember2019-12-310001015780etfc:FICOScoreGreaterThan720Memberus-gaap:RealEstateLoanMember2020-03-310001015780etfc:FICOScoreGreaterThan720Memberus-gaap:RealEstateLoanMember2019-12-310001015780etfc:FICOScoreGreaterThan720Memberus-gaap:HomeEquityMember2020-03-310001015780etfc:FICOScoreGreaterThan720Memberus-gaap:HomeEquityMember2019-12-310001015780us-gaap:RealEstateLoanMemberetfc:FICOScore719To700Member2020-03-310001015780us-gaap:RealEstateLoanMemberetfc:FICOScore719To700Member2019-12-310001015780etfc:FICOScore719To700Memberus-gaap:HomeEquityMember2020-03-310001015780etfc:FICOScore719To700Memberus-gaap:HomeEquityMember2019-12-310001015780etfc:FICOScore699To680Memberus-gaap:RealEstateLoanMember2020-03-310001015780etfc:FICOScore699To680Memberus-gaap:RealEstateLoanMember2019-12-310001015780etfc:FICOScore699To680Memberus-gaap:HomeEquityMember2020-03-310001015780etfc:FICOScore699To680Memberus-gaap:HomeEquityMember2019-12-310001015780etfc:FICOScore679To660Memberus-gaap:RealEstateLoanMember2020-03-310001015780etfc:FICOScore679To660Memberus-gaap:RealEstateLoanMember2019-12-310001015780etfc:FICOScore679To660Memberus-gaap:HomeEquityMember2020-03-310001015780etfc:FICOScore679To660Memberus-gaap:HomeEquityMember2019-12-310001015780etfc:FICOScore659To620Memberus-gaap:RealEstateLoanMember2020-03-310001015780etfc:FICOScore659To620Memberus-gaap:RealEstateLoanMember2019-12-310001015780etfc:FICOScore659To620Memberus-gaap:HomeEquityMember2020-03-310001015780etfc:FICOScore659To620Memberus-gaap:HomeEquityMember2019-12-310001015780etfc:FICOScoreLessThan620Memberus-gaap:RealEstateLoanMember2020-03-310001015780etfc:FICOScoreLessThan620Memberus-gaap:RealEstateLoanMember2019-12-310001015780etfc:FICOScoreLessThan620Memberus-gaap:HomeEquityMember2020-03-310001015780etfc:FICOScoreLessThan620Memberus-gaap:HomeEquityMember2019-12-310001015780srt:MaximumMemberetfc:FinancingReceivableConvertedtoAmortizingPercentageMemberetfc:OneToFourFamilyBenchmarkMember2020-01-012020-03-310001015780etfc:FinancingReceivablesStateRiskMemberstpr:CAetfc:OneToFourFamilyandHomeEquityBenchmarkMember2020-01-012020-03-310001015780etfc:FinancingReceivablesStateRiskMemberstpr:NYetfc:OneToFourFamilyandHomeEquityBenchmarkMember2020-01-012020-03-310001015780etfc:FinancingReceivablesStateRiskMemberstpr:NYetfc:OneToFourFamilyandHomeEquityBenchmarkMember2019-01-012019-12-310001015780etfc:FinancingReceivablesStateRiskMemberstpr:CAetfc:PastDueMortgageLoansMember2020-01-012020-03-310001015780etfc:FinancingReceivablesStateRiskMemberetfc:PastDueMortgageLoansMemberstpr:NY2020-01-012020-03-310001015780etfc:FinancingReceivablesStateRiskMemberstpr:CAetfc:ImpairedMortgageLoansMember2020-01-012020-03-310001015780etfc:FinancingReceivablesStateRiskMemberetfc:ImpairedMortgageLoansMemberstpr:NY2020-01-012020-03-310001015780us-gaap:RealEstateLoanMemberus-gaap:NonperformingFinancingReceivableMember2020-03-310001015780us-gaap:RealEstateLoanMemberus-gaap:NonperformingFinancingReceivableMember2019-12-310001015780us-gaap:NonperformingFinancingReceivableMemberus-gaap:HomeEquityMember2020-03-310001015780us-gaap:NonperformingFinancingReceivableMemberus-gaap:HomeEquityMember2019-12-310001015780us-gaap:NonperformingFinancingReceivableMember2020-03-310001015780us-gaap:NonperformingFinancingReceivableMember2019-12-310001015780us-gaap:RealEstateLoanMemberetfc:CollateralDependentLoansMember2020-03-310001015780etfc:CollateralDependentLoansMemberus-gaap:HomeEquityMember2020-03-310001015780us-gaap:RealEstateLoanMemberetfc:CollateralDependentLoansMember2020-01-012020-03-310001015780etfc:CollateralDependentLoansMemberus-gaap:HomeEquityMember2020-01-012020-03-310001015780etfc:FinancingReceivablesStateRiskMemberstpr:CAetfc:CollateralDependentLoansMember2020-01-012020-03-310001015780etfc:FinancingReceivablesStateRiskMemberstpr:NYetfc:CollateralDependentLoansMember2020-01-012020-03-310001015780us-gaap:RealEstateLoanMember2020-01-012020-03-310001015780us-gaap:HomeEquityMember2020-01-012020-03-310001015780us-gaap:RealEstateLoanMember2018-12-310001015780us-gaap:HomeEquityMember2018-12-310001015780us-gaap:AutomobileLoanMember2018-12-310001015780us-gaap:RealEstateLoanMember2019-01-012019-03-310001015780us-gaap:HomeEquityMember2019-01-012019-03-310001015780us-gaap:AutomobileLoanMember2019-01-012019-03-310001015780us-gaap:RealEstateLoanMember2019-03-310001015780us-gaap:HomeEquityMember2019-03-310001015780us-gaap:AutomobileLoanMember2019-03-310001015780us-gaap:RealEstateLoanMember2020-01-010001015780us-gaap:HomeEquityMember2020-01-01etfc:loan0001015780us-gaap:RealEstateLoanMemberetfc:ReAgeExtensionorInterestCapitalizationwithInterestRateReductionMember2020-01-012020-03-310001015780etfc:OtherwithoutInterestRateReductionMemberus-gaap:RealEstateLoanMember2020-01-012020-03-310001015780etfc:ReAgeExtensionorInterestCapitalizationwithInterestRateReductionMemberus-gaap:HomeEquityMember2020-01-012020-03-310001015780etfc:OtherwithoutInterestRateReductionMemberus-gaap:HomeEquityMember2020-01-012020-03-310001015780etfc:ReAgeExtensionorInterestCapitalizationwithInterestRateReductionMember2020-01-012020-03-310001015780etfc:OtherwithoutInterestRateReductionMember2020-01-012020-03-310001015780us-gaap:RealEstateLoanMemberetfc:ReAgeExtensionorInterestCapitalizationwithInterestRateReductionMember2019-01-012019-03-310001015780etfc:OtherwithoutInterestRateReductionMemberus-gaap:RealEstateLoanMember2019-01-012019-03-310001015780etfc:ReAgeExtensionorInterestCapitalizationwithInterestRateReductionMemberus-gaap:HomeEquityMember2019-01-012019-03-310001015780etfc:OtherwithoutInterestRateReductionMemberus-gaap:HomeEquityMember2019-01-012019-03-310001015780etfc:ReAgeExtensionorInterestCapitalizationwithInterestRateReductionMember2019-01-012019-03-310001015780etfc:OtherwithoutInterestRateReductionMember2019-01-012019-03-310001015780etfc:FinancingReceivablesStateRiskMemberstpr:CAetfc:OneToFourFamilyandHomeEquityBenchmarkMember2019-01-012019-12-310001015780us-gaap:DesignatedAsHedgingInstrumentMemberus-gaap:FairValueHedgingMember2020-03-310001015780us-gaap:DesignatedAsHedgingInstrumentMemberus-gaap:FairValueHedgingMember2019-12-310001015780us-gaap:FairValueHedgingMember2020-01-012020-03-310001015780us-gaap:InterestIncomeMember2020-01-012020-03-310001015780us-gaap:InterestIncomeMember2019-01-012019-03-310001015780us-gaap:InterestIncomeMemberus-gaap:USTreasuryAndGovernmentMember2020-01-012020-03-310001015780us-gaap:InterestIncomeMemberus-gaap:USTreasuryAndGovernmentMember2019-01-012019-03-310001015780us-gaap:MortgageBackedSecuritiesIssuedByUSGovernmentSponsoredEnterprisesMemberus-gaap:InterestIncomeMember2020-01-012020-03-310001015780us-gaap:MortgageBackedSecuritiesIssuedByUSGovernmentSponsoredEnterprisesMemberus-gaap:InterestIncomeMember2019-01-012019-03-310001015780srt:ParentCompanyMemberetfc:MaturingInJune2024Memberus-gaap:RevolvingCreditFacilityMember2020-03-310001015780etfc:FhlbSecuredCreditFacilityMemberetfc:ETradeBankMemberus-gaap:MaturityOnDemandMember2020-03-310001015780etfc:ETradeBankMemberetfc:FederalReserveBankDiscountWindowMemberus-gaap:MaturityOvernightMember2020-03-310001015780etfc:MaturingInJuneNextYearMemberetfc:ETradeSecuritiesMemberus-gaap:RevolvingCreditFacilityMember2020-03-310001015780etfc:SecuredCommittedLineofCreditMemberetfc:MaturingInJuneNextYearMemberetfc:ETradeSecuritiesMember2020-03-310001015780etfc:UnsecuredUncommittedLineofCreditMemberetfc:MaturingInJuneNextYearMemberetfc:ETradeSecuritiesMember2020-03-310001015780etfc:UnsecuredUncommittedLineofCreditMemberetfc:ETradeSecuritiesMember2020-03-310001015780etfc:SecuredUncommittedLineofCreditMemberetfc:ETradeSecuritiesMember2020-03-310001015780etfc:SeniorNotesInterestBearingTwoAndNineFivePercentMemberus-gaap:CorporateDebtSecuritiesMember2020-03-310001015780etfc:SeniorNotesInterestBearingThreeandEightPercentMemberus-gaap:CorporateDebtSecuritiesMember2020-03-310001015780etfc:SeniorNotesInterestBearingFourandFivePercentMemberus-gaap:CorporateDebtSecuritiesMember2020-03-310001015780us-gaap:CorporateDebtSecuritiesMember2020-03-310001015780etfc:SeniorNotesInterestBearingTwoAndNineFivePercentMemberus-gaap:CorporateDebtSecuritiesMember2019-12-310001015780etfc:SeniorNotesInterestBearingThreeandEightPercentMemberus-gaap:CorporateDebtSecuritiesMember2019-12-310001015780etfc:SeniorNotesInterestBearingFourandFivePercentMemberus-gaap:CorporateDebtSecuritiesMember2019-12-310001015780us-gaap:CorporateDebtSecuritiesMember2019-12-310001015780etfc:SeniorNotesInterestBearingTwoAndNineFivePercentMemberus-gaap:CorporateDebtSecuritiesMember2020-01-012020-03-310001015780etfc:SeniorNotesInterestBearingThreeandEightPercentMemberus-gaap:CorporateDebtSecuritiesMember2020-01-012020-03-310001015780etfc:SeniorNotesInterestBearingFourandFivePercentMemberus-gaap:CorporateDebtSecuritiesMember2020-01-012020-03-310001015780etfc:SeniorNotesInterestBearingTwoAndNineFivePercentMemberus-gaap:CorporateDebtSecuritiesMember2019-01-012019-12-310001015780etfc:SeniorNotesInterestBearingThreeandEightPercentMemberus-gaap:CorporateDebtSecuritiesMember2019-01-012019-12-310001015780etfc:SeniorNotesInterestBearingFourandFivePercentMemberus-gaap:CorporateDebtSecuritiesMember2019-01-012019-12-310001015780us-gaap:PreferredStockMember2020-01-012020-03-310001015780us-gaap:SeriesAPreferredStockMember2020-03-310001015780us-gaap:SeriesAPreferredStockMember2019-12-310001015780us-gaap:SeriesBPreferredStockMember2020-03-310001015780us-gaap:SeriesBPreferredStockMember2019-12-310001015780us-gaap:SeriesAPreferredStockMember2020-01-012020-03-310001015780us-gaap:SeriesBPreferredStockMember2020-01-012020-03-310001015780us-gaap:SeriesAPreferredStockMember2019-01-012019-03-310001015780us-gaap:SeriesBPreferredStockMember2019-01-012019-03-310001015780us-gaap:CommonStockMember2020-01-012020-03-310001015780us-gaap:CommonStockMember2019-01-012019-03-310001015780us-gaap:SubsequentEventMemberus-gaap:CommonStockMember2020-04-012020-06-300001015780us-gaap:CommonStockMemberetfc:CurrentShareRepurchaseProgramMember2019-07-310001015780us-gaap:CommonStockMemberetfc:CurrentShareRepurchaseProgramMember2020-01-012020-03-310001015780us-gaap:AccumulatedNetUnrealizedInvestmentGainLossMember2019-12-310001015780us-gaap:AccumulatedNetUnrealizedInvestmentGainLossMember2018-12-310001015780us-gaap:AccumulatedNetUnrealizedInvestmentGainLossMember2020-01-012020-03-310001015780us-gaap:AccumulatedNetUnrealizedInvestmentGainLossMember2019-01-012019-03-310001015780us-gaap:AccumulatedNetUnrealizedInvestmentGainLossMember2020-03-310001015780us-gaap:AccumulatedNetUnrealizedInvestmentGainLossMember2019-03-310001015780us-gaap:AccumulatedNetUnrealizedInvestmentGainLossMemberus-gaap:ReclassificationOutOfAccumulatedOtherComprehensiveIncomeMember2020-01-012020-03-310001015780us-gaap:AccumulatedNetUnrealizedInvestmentGainLossMemberus-gaap:ReclassificationOutOfAccumulatedOtherComprehensiveIncomeMember2019-01-012019-03-310001015780us-gaap:LondonInterbankOfferedRateLIBORMemberus-gaap:SeriesAPreferredStockMember2020-03-310001015780us-gaap:SeriesBPreferredStockMemberus-gaap:LondonInterbankOfferedRateLIBORMember2020-03-310001015780etfc:ETradeSecuritiesMember2020-03-310001015780etfc:ETradeFuturesMembersrt:MinimumMember2020-03-310001015780etfc:ETradeFuturesMember2020-03-310001015780etfc:ETradeSecuritiesMember2019-12-310001015780etfc:ETradeFuturesMember2019-12-310001015780etfc:ETradeSecuritiesMember2020-01-012020-03-310001015780srt:ParentCompanyMember2020-03-310001015780srt:ParentCompanyMember2019-12-310001015780etfc:ETradeBankMember2020-03-310001015780etfc:ETradeBankMember2019-12-310001015780etfc:EtradeSavingsBankMember2020-03-310001015780etfc:EtradeSavingsBankMember2019-12-310001015780etfc:CapitalConservationBufferMembersrt:MinimumMember2020-03-310001015780etfc:AxajoComplaintMember2003-01-012003-12-31
UNITED STATES
SECURITIES AND EXCHANGE COMMISSION
Washington, D.C. 20549
FORM 10-Q
| | | | | |
| ☒ | QUARTERLY REPORT PURSUANT TO SECTION 13 OR 15(d) OF THE SECURITIES EXCHANGE ACT OF 1934 |
For the quarterly period ended March 31, 2020
| | | | | |
| ☐ | TRANSITION REPORT PURSUANT TO SECTION 13 OR 15(d) OF THE SECURITIES EXCHANGE ACT OF 1934 |
For the transition period from _____ to _____
Commission File Number 1-11921
E TRADE Financial Corporation
 E*TRADE Financial Corporation
(Exact Name of Registrant as Specified in its Charter)
| | | | | | | | |
| Delaware | | 94-2844166 |
(State or other jurisdiction
of incorporation or organization) | | (I.R.S. Employer
Identification Number) |
671 N. Glebe Road, Arlington, Virginia 22203
(Address of principal executive offices and Zip Code)
(646) 521-4340
(Registrant’s telephone number, including area code)
Securities Registered Pursuant to Section 12(b) of the Act:
| | | | | | | | |
| Title of Each Class | Trading Symbol | Name of Each Exchange on Which Registered |
| Common Stock, par value $0.01 per share | ETFC | The NASDAQ Stock Market LLC |
| | NASDAQ Global Select Market |
_____________________________________
Indicate by check mark whether the registrant (1) has filed all reports required to be filed by Section 13 or 15(d) of the Securities Exchange Act of 1934 during the preceding 12 months (or for such shorter period that the registrant was required to file such reports) and (2) has been subject to such filing requirements for the past 90 days. Yes x No ¨
Indicate by check mark whether the registrant has submitted electronically every Interactive Data File required to be submitted pursuant to Rule 405 of Regulation S-T during the preceding 12 months (or for such shorter period that the registrant was required to submit such files). Yes x No ¨
Indicate by check mark whether the registrant is a large accelerated filer, an accelerated filer, a non-accelerated filer, a smaller reporting company or an emerging growth company. See the definitions of "large accelerated filer," "accelerated filer," "smaller reporting company" and "emerging growth company" in Rule 12b-2 of the Exchange Act.
| | | | | | | | | | | | | | | | | |
| Large accelerated filer | x | | Accelerated filer | | ☐ |
Non-accelerated filer ¨ | | | Smaller reporting company | | ☐ |
| | | Emerging growth company | | ☐ |
| | | | | |
If an emerging growth company, indicate by check mark if the registrant has elected not to use the extended transition period for complying with any new or revised financial accounting standards provided pursuant to Section 13(a) of the Exchange Act. ¨
Indicate by check mark whether the registrant is a shell company (as defined in Rule 12b-2 of the Exchange Act). Yes ☐ No x
Indicate the number of shares outstanding of each of the issuer’s classes of common stock, as of the latest practicable date:
As of April 30, 2020, there were 221,046,419 shares of common stock outstanding.
E*TRADE FINANCIAL CORPORATION
FORM 10-Q QUARTERLY REPORT
For the Quarter Ended March 31, 2020
TABLE OF CONTENTS
| | | | | | | | |
| PART I | FINANCIAL INFORMATION | |
| | |
| Item 1. |
| |
| | |
| | |
| | |
| | |
| | |
| | |
| | |
| | |
| | |
| | |
| | |
| | |
| | |
| | |
| | |
| | |
| | |
| | |
| | |
| | |
| | |
| Item 2. | | |
| | |
| | |
| | |
| | |
| | |
| | |
| | |
| Item 3. | | |
| | |
| Item 4. | | |
| PART II | | |
| Item 1. | | |
| Item 1A. | | |
| Item 2. | | |
| Item 3. | | |
| Item 4. | | |
| Item 5. | | |
| Item 6. | | |
| | |
E*TRADE Q1 2020 10-Q | Page i
Unless otherwise indicated, references to "the Company," "we," "us," "our," "E*TRADE" and "E*TRADE Financial" mean E*TRADE Financial Corporation and its subsidiaries, and references to the parent company mean E*TRADE Financial Corporation but not its subsidiaries.
E*TRADE, E*TRADE Financial, E*TRADE Bank, E*TRADE Savings Bank, the Converging Arrows logo, Power E*TRADE, Equity Edge Online, E*TRADE Advisor Services, E*TRADE Advisor Network, Liberty and Gradifi are trademarks or registered trademarks of E*TRADE Financial Corporation in the United States and in other countries. All other trademarks are the property of their respective owners.
E*TRADE Q1 2020 10-Q | Page ii
PART I
FORWARD-LOOKING STATEMENTS
This report contains forward-looking statements, within the meaning of the Private Securities Litigation Reform Act of 1995, that involve risks and uncertainties. These statements discuss, among other things:
•our future plans, objectives, outlook, strategies, expectations and intentions relating to our business and future financial and operating results and the assumptions that underlie these matters
•our capital plan initiatives
•the timing and payment of dividends on our common and preferred stock
•the payment of dividends from our subsidiaries to our parent company
•the management of our legacy mortgage loan portfolio
•our ability to comply with future changes to government regulations
•our ability to maintain required regulatory capital ratios
•our ability to meet upcoming debt obligations
•the integration and related restructuring costs of past and any future acquisitions
•the expected outcome of existing or new litigation
•our ability to execute our business plans and manage risk
•future sources of revenue, expense and liquidity
•the ability of our technology solution and referral program for advisors to attract and retain customers seeking specialized services and sophisticated advice
•the expected impact of the adoption of the amended accounting guidance governing the accounting for credit losses
•the expected impact from and responses to the elimination of retail commissions for online US listed stock, exchange-traded funds (ETF), and options trades
•the consummation of the proposed merger with Morgan Stanley and the anticipated benefits thereof
•the current and expected impact of the coronavirus (COVID-19) pandemic, and the measures taken by governmental authorities in response thereto
•any other statement that is not historical in nature
These statements may be identified by the use of words such as "assume," "expect," "believe," "may," "will," "should," "anticipate," "intend," "plan," "estimate," "continue" and similar expressions.
We caution that actual results could differ materially from those discussed in these forward-looking statements. Important factors that could contribute to our actual results differing materially from any forward-looking statements include, but are not limited to:
•changes in business, economic or political conditions
•performance, volume and volatility in the equity and capital markets
•changes in interest rates or interest rate volatility
•our ability to manage our balance sheet size and capital levels
•disruptions or failures of our information technology systems or those of our third-party service providers
•cyber security threats, system disruptions and other potential security breaches or incidents
•customer demand for financial products and services
•our ability to continue to compete effectively and respond to aggressive competition within our industry, such as through the elimination of retail commissions for online US listed stock, ETF and options trades
E*TRADE Q1 2020 10-Q | Page 1
•our ability to participate in consolidation opportunities in our industry, to complete consolidation transactions and to realize synergies or implement integration plans
•our ability to manage our significant risk exposures effectively
•the occurrence of risks associated with our advisory services
•our ability to manage credit risk with customers and counterparties
•our ability to service our corporate debt and, if necessary, to raise additional capital
•changes in government regulation, including interpretations, or actions by our regulators, including those that may result from the implementation and enforcement of regulatory reform legislation
•adverse developments in any existing or new investigations, disciplinary actions or litigation
•changes in actual or forecasted assumptions impacting the measurement of expected credit losses
•the consummation of the proposed merger with Morgan Stanley and the anticipated benefits thereof
•the scope and duration of the COVID-19 pandemic and actions taken by governmental authorities to contain the financial and economic impact of the outbreak
By their nature forward-looking statements are not guarantees of future performance or results and are subject to risks, uncertainties and assumptions that are difficult to predict or quantify. Actual future results may vary materially from expectations expressed or implied in this report or any of our prior communications. Investors should also consider the risks and uncertainties described elsewhere in this report, including under Part II. Item 1A. Risk Factors and Part I. Item 2. Management’s Discussion and Analysis of Financial Condition and Results of Operations and Part I. Item 1A. Risk Factors of our Annual Report on Form 10-K for the year ended December 31, 2019, filed with the Securities and Exchange Commission (SEC), which are incorporated herein by reference. The forward-looking statements contained in this report reflect our expectations only as of the date of this report. Investors should not place undue reliance on forward-looking statements, as we do not undertake to update or revise forward-looking statements, except as required by law.
E*TRADE Q1 2020 10-Q | Page 2
ITEM 2. MANAGEMENT’S DISCUSSION AND ANALYSIS OF FINANCIAL CONDITION AND RESULTS OF OPERATIONS (MD&A)
The following discussion should be read in conjunction with the consolidated financial statements and the related notes that appear elsewhere in this document and with the Annual Report on Form 10-K for the year ended December 31, 2019. Company Overview
E*TRADE is a financial services company that provides brokerage and related products and services for traders, investors, stock plan administrators and participants, and registered investment advisors (RIAs). Founded on the principle of innovation, we aim to enhance the financial independence of customers through a powerful digital offering that includes tools and educational materials, complemented by professional advice and support, catering to the complex and unique needs of customers to help meet their near- and long-term investing goals. We provide these services through our digital platforms and network of industry-licensed customer service representatives and financial consultants, over the phone, by email and online via two national financial centers, and in-person at 30 regional financial centers across the United States. We also operate federally chartered savings banks with the primary purpose of maximizing the value of deposits generated through our brokerage business.
We operate directly and through several subsidiaries, many of which are overseen by governmental and self-regulatory organizations (SROs). Our most important subsidiaries are described below:
•E*TRADE Securities LLC (E*TRADE Securities) is a registered broker-dealer that clears and settles customer transactions
•E*TRADE Bank is a federally chartered savings bank that provides Federal Deposit Insurance Corporation (FDIC) insurance on certain qualifying amounts of customer deposits and provides other banking and cash management capabilities
•E*TRADE Savings Bank, a subsidiary of E*TRADE Bank, is a federally chartered savings bank that provides FDIC insurance on certain qualifying amounts of customer deposits and provides custody solutions for RIAs
•E*TRADE Financial Corporate Services, Inc. (E*TRADE Financial Corporate Services) is a provider of software and services for managing equity compensation plans and student loan and financial wellness benefits to our corporate clients
•E*TRADE Futures LLC (E*TRADE Futures) is a registered non-clearing Futures Commission Merchant (FCM) that provides retail futures transaction capabilities for our customers
•E*TRADE Capital Management LLC (E*TRADE Capital Management) is an RIA that provides investment advisory services for our customers
E*TRADE Q1 2020 10-Q | Page 3
Delivering a powerful digital offering for our customers is a core pillar of our business strategy and we believe our focus on being a digital leader in the financial services industry is a competitive advantage. We offer a broad range of products and services to customers through the following channels:
•Retail: Our retail channel services individual brokerage and banking customers that utilize our web, mobile and/or active trading platforms to meet trading, investing and/or banking needs.
•Institutional: Our institutional channels include Corporate Services and Advisor Services. We provide stock plan, student loan and financial wellness solutions for public and private companies globally through our corporate services channel. We provide custody services to independent RIAs through our advisor services channel.
Our business strategy is focused on leveraging our brand, hybrid support model, and technology to grow our retail and institutional channels while generating robust earnings growth and maximizing shareholder returns.
Leverage our brand, hybrid support model, and leading technology for scale and growth
E*TRADE's unrivaled and tech-forward brand is synonymous with digital brokerage and drives outsized awareness and consideration among business-to-customer and business-to-business audiences. Our customers benefit from digitally led experiences, complemented by professional advice and support. We cater to the complex and unique needs of traders, investors, stock plan administrators and participants, and independent RIAs. We are able to serve peak volumes across channels with capacity for growth through our strong and scalable infrastructure.
Empower self-directed retail customers through a powerful digital offering and professional guidance
E*TRADE has three core digital offerings for the retail investor—trading, investing, and banking. We maintain a leading position among active and derivatives traders through the Power E*TRADE web-based platform and support model. We connect customers with a range of easy to use wealth management solutions. We are also advancing digital banking capabilities to complement our existing product set and increase engagement with customers and prospects.
Capitalize on symbiotic institutional channels to drive growth
E*TRADE's corporate services and advisor services channels are critical for growth. We aim to expand on our #1 position in stock plan administration through innovative digital solutions, complementary service offerings and expert support—driving growth in retail and institutional relationships. We plan to leverage the power of E*TRADE's brand, digital ethos, and our broad customer base to grow the advisor services channel. We also plan to connect retail customers and stock plan participants seeking higher touch services to top-tier advisors through our referral network—driving asset growth and retention.
Generate robust earnings growth and shareholder returns
We aim to deliver superior returns on customer assets by capturing the full value of our retail and institutional relationships and leveraging E*TRADE's highly scalable model to generate robust earnings growth and maximize shareholder returns.
E*TRADE Q1 2020 10-Q | Page 4
PRODUCTS AND SERVICES
Our hybrid delivery model is available through the following award-winning digital platforms which are complemented by professional advice and support.
| | | | | | | | | | | |
Platforms for Retail Channel(1) | | Platforms for Institutional Channels(1) | |
| Web | | Equity Edge Online(2) |
| Our easy to use site is the primary channel to interact with customers and prospects | | Equity Edge Online is the #1 rated platform in the stock plan administration industry that offers automation and flexibility |
| | | |
| | | |
| | | |
| Mobile | | Gradifi |
| Our industry leading mobile applications include integrations with leading mobile artificial intelligence assistants | | Gradifi is a scalable, streamlined platform that offers student loan and financial wellness benefits |
| | | |
| | | |
| | | |
| Active Trading Platforms | | Liberty |
| Active derivatives trading platforms include sophisticated trading tools, advanced portfolio and market tracking, and idea generation and analysis | | Liberty is intuitive technology built for RIAs that simplifies the investment and management of client assets |
| | | |
| | | |
| | | |
| Complemented by professional advice and support | | | |
| Customer Service | | Financial Consultants |
| Customer service is available 24/7 via phone, email or chat from industry licensed representatives. White glove service is available for our highest-tiered customers | | Financial consultants are available by phone or at branches to provide one-on-one investing advice |
| | | |
| | | |
| | | |
| Active Trader Services | | Corporate Services |
| Active trader services includes specialized support for sophisticated customers with advanced knowledge and skill
| | Corporate services support includes personalized service on a global scale driven by dedicated relationship and service managers backed by comprehensive training and education |
| | | |
| | | |
| | | |
| | | Advisor Services |
| | | Advisor services support includes dedicated relationship managers who act as a single point of contact for specialized support |
| | | |
| | | |
(1)In August 2019, E*TRADE was rated the #1 online broker in Kiplinger's 2019 Best Online Brokers Review. In the current year, we maintained our #1 ranking for Mobile Trading, Options Trading, and Web-based Platform (Power E*TRADE) in Stockbrokers.com's 2020 review of Best Online Brokers for Stock Trading. We also finished Best in Class for research, education, active trading, futures trading, and IRA accounts. In March 2020, E*TRADE was also named Best Broker for ease of trading and beginning options traders in Investopedia's 2020 Online Broker review.
(2)In September 2019, Equity Edge Online was rated #1 in Loyalty and Overall Satisfaction for the eighth consecutive year in the Group Five Stock Plan Administration Benchmark Study.
E*TRADE Q1 2020 10-Q | Page 5
We deliver a broad range of products and services through our retail and institutional channels across the following five product areas: Trading, Investing, Banking and Cash Management, Corporate Services and Advisor Services.
Trading
The Company delivers automated trade order placement and execution services, offering our customers a full range of investment vehicles, including US equities, ETFs, options, bonds, futures, American depositary receipts and non-proprietary mutual funds. We also offer margin accounts, enabling qualifying customers to borrow against their securities, supported by robust customer tools to analyze positions and understand collateral requirements. The Company also offers a fully paid lending program which allows customers to earn income on certain securities when they permit us to lend these securities.
The Company markets trading products and services to active traders and self-directed investors. Products and services are delivered through web, mobile, and active trading platforms. Trading tools are supported by guidance, including options, futures and fixed income specialists available on-call for customers. Other tools and resources include independent research and analytics, live and on-demand education, market commentary, trading ideas, strategies, and screeners for major asset classes.
Investing
The Company endeavors to help investors build wealth and address their long-term investing needs through a suite of managed products, asset allocation models, and other services. These include our Core Portfolios, Blend Portfolios, Dedicated Portfolios, and Fixed Income Portfolios. The Company offers self-directed digital tools across web and mobile platforms, including mutual fund and ETF screeners, All-Star Lists, a collection of pre-built ETF or mutual fund portfolios based on time frame and risk tolerance, an assortment of planning and allocation tools, thematic investing opportunities, education and editorial content. Investors also have access to a wide selection of ETFs and mutual funds, including approximately 2,300 ETFs and more than 4,600 no-load, no-transaction fee mutual funds.
The Company also offers guidance through a team of licensed financial consultants and Chartered Retirement Planning CounselorsSM at our 30 regional financial centers and through our two national financial centers by phone, email and online. Customers can also receive complimentary portfolio reviews and personalized investment recommendations.
Banking and Cash Management
The Company's banking and cash management capabilities include deposit accounts insured by the FDIC, which are fully integrated into customer brokerage accounts. E*TRADE Bank's deposit account offerings include the Premium Savings Account, which provides a higher yield to savings account customers as compared to our other deposit products. Among other features, E*TRADE Bank's customers can transfer to and from accounts at E*TRADE and elsewhere for free, and checking account customers have access to debit cards with ATM fee refunds, online and mobile bill pay, and mobile check deposits. We also offer the E*TRADE Line of Credit, a securities-based lending program, which allows customers to borrow against the market value of securities pledged as collateral.
E*TRADE Q1 2020 10-Q | Page 6
Corporate Services
Through our industry-leading platform, Equity Edge Online, the Company offers fully-automated employee stock plan and employee stock purchase plan administration, as well as comprehensive accounting, reporting and scenario modeling tools. The integrated stock plan solutions include multi-currency settlement and delivery, and streamlined tax calculation. Additionally, corporate clients are offered 10b5-1 plan design and implementation, along with SEC filing assistance and automated solutions. Participants have full access to E*TRADE's robust investing and trading capabilities, including tailored education and planning tools, and dedicated stock plan service representatives. Comprehensive financial wellness and student loan solutions have been introduced to complement our existing corporate services offering with the acquisition of Gradifi, Inc. (Gradifi) in December 2019. Refer to Note 2—Acquisitions and Restructuring for further details.
Corporate Services is an important driver of account and asset growth, serving as a conduit to the retail channel. Over the trailing 12 months, there were $101 billion of gross inflows into our corporate services channel, primarily driven by new corporate client implementations and new grants and employee stock purchase plan transactions. Over this same period, domestic stock plan participants generated $38 billion of net proceeds through transactions of vested assets. These participant proceeds represent a key source of net new assets for the retail customer channel.
Advisor Services
Through our proprietary technology platform, Liberty, the Company offers sophisticated modeling, rebalancing, reporting, and practice management capabilities that are fully customizable for the RIA. E*TRADE's financial consultants can refer retail customers to pre-qualified RIAs on our custody platform through our referral program, the E*TRADE Advisor Network, which is offered through our two national and 30 regional financial centers. We expect the E*TRADE Advisor Network will improve the Company's ability to drive asset growth and retain customers seeking specialized services and sophisticated advice.
Significant Events
Proposed merger with Morgan Stanley
On February 20, 2020, the Company entered into an Agreement and Plan of Merger (the Merger Agreement) with Morgan Stanley under which Morgan Stanley agreed to acquire the Company in an all-stock transaction. The acquisition is subject to customary closing conditions, including regulatory approvals and approval by the Company's shareholders, and is expected to close in the fourth quarter of 2020. Please refer to Note 2—Acquisitions and Restructuring for additional details.
Global economy disrupted as COVID-19 declared a pandemic
In March 2020, the World Health Organization declared the outbreak of COVID-19 a pandemic. The Company responded by executing its business continuity plan and transitioning nearly all of its workforce to a remote working environment to prioritize the safety of its employees and customers. The pandemic, and actions taken by governmental authorities to contain its financial and economic impact, has resulted in significant market volatility, with the Chicago Board Options Exchange Volatility Index (VIX) setting record levels and major indices entering bear market territory for the first time in over a decade, driving lower equity market valuations and a significant reduction in interest rates. As a result, the Company experienced lower margin balances and sequential declines in net interest margin, net interest income and other related revenues. While these decreases were offset by increased trading-based revenues resulting from record customer engagement, we cannot be certain that such levels will persist should the scope and duration of the disruption be prolonged.
E*TRADE Q1 2020 10-Q | Page 7
Financial Performance
Our net revenue is generated primarily from net interest income, commissions and fees and service charges:
•Net interest income is largely impacted by the size of our balance sheet, our balance sheet mix, and average yields on our assets and liabilities. Net interest income is driven primarily from interest earned on investment securities, margin receivables, securities lending, and our legacy loan portfolio, less interest incurred on interest-bearing liabilities, including deposits, customer payables, corporate debt and other borrowings.
•Commissions revenue is generated by customer trades and is largely impacted by trade volume and trade type, specifically options contract charges.
•Fees and service charges revenue is primarily impacted by order flow revenue, fees earned from customer cash held by third parties, advisor management and custody fees, and mutual fund service fees.
Our net revenue is offset by non-interest expenses, the largest of which are compensation and benefits and advertising and market development.
E*TRADE Q1 2020 10-Q | Page 8
Key Performance Metrics
Management monitors customer activity and corporate metrics to evaluate the Company’s performance. The most significant of these are displayed below.
Customer Activity Metrics
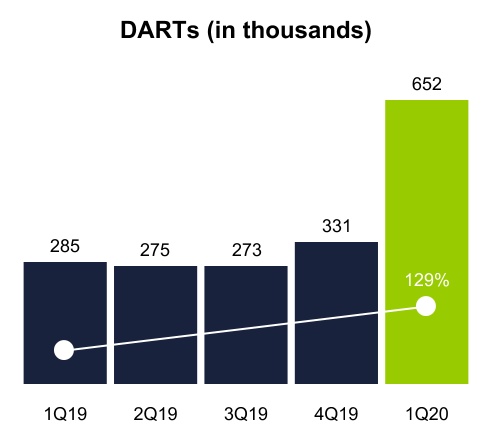
Daily Average Revenue Trades (DARTs) is an important measure of customer trading activity and is a key driver of trading-based revenue. DARTs were 651,746 and 285,004 for the three months ended March 31, 2020 and 2019, respectively. DARTs volume is impacted by market sentiment as well as volatility of the equity markets.
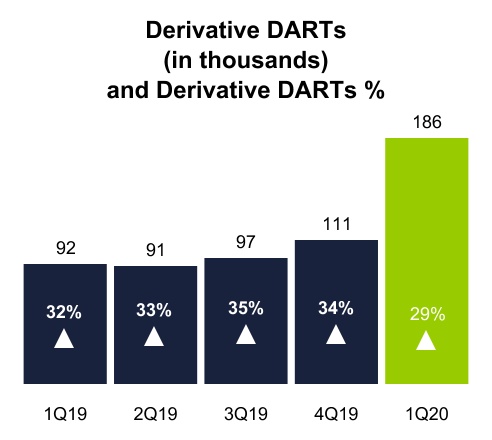
Derivative DARTs, a key component of overall DARTs that represents advanced trading activities by our customers, is the daily average number of options and futures trades, and Derivative DARTs percentage is the mix of options and futures trades as a component of total DARTs. We expect that options trades will be the primary driver of commissions revenue in future periods. Derivative DARTs were 186,065 and 91,940 for the three months ended March 31, 2020 and 2019, respectively. Derivative DARTs represented 29% and 32% of total DARTs for the three months ended March 31, 2020 and 2019, respectively.
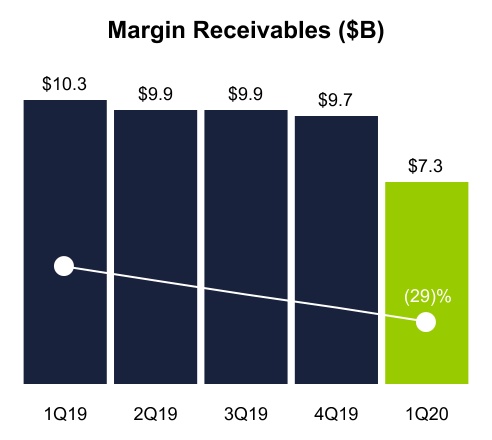
Margin receivables represent credit extended to customers to finance their purchases of securities by borrowing against securities they own and is a key driver of net interest income. Margin receivables were $7.3 billion and $10.3 billion at March 31, 2020 and 2019, respectively, contracting meaningfully in late March 2020 as equity market valuations decreased. Average margin receivables balances are significant drivers of net interest income. Average margin receivables were $9.4 billion and $9.8 billion for the three months ended March 31, 2020 and 2019, respectively.
E*TRADE Q1 2020 10-Q | Page 9
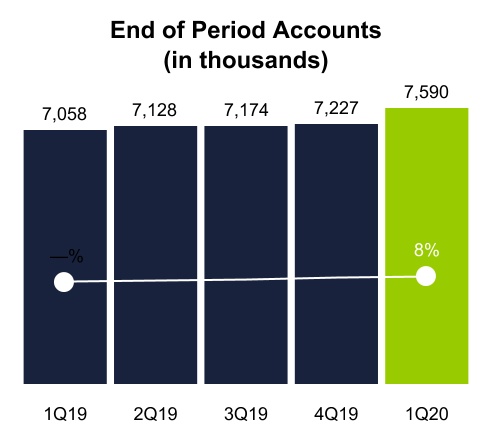
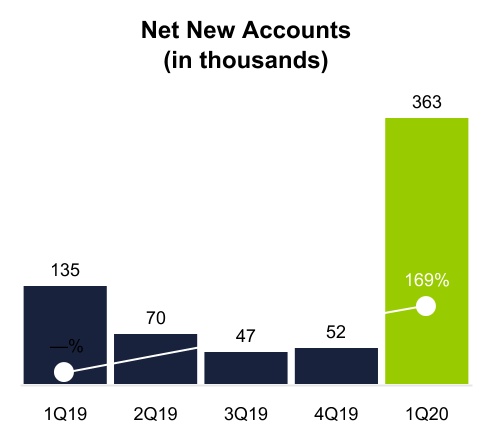
End of period accounts and net new accounts are indicators of our ability to attract and retain customers. Net new accounts represent gross new accounts less accounts attrited during the period. The following table presents end of period accounts by channel:
| | | | | | | | | | | | | | | | | | | | | | | | | | | | | | | | | | |
| | | | | | | 1Q 2020 | | 4Q 2019 | | 3Q 2019 | | 2Q 2019 | | 1Q 2019 |
| End of period retail accounts | | | | | | 5,498,596 | | | 5,169,757 | | | 5,130,138 | | | 5,122,669 | | | 5,088,597 | |
| End of period advisor services accounts | | | | | | 144,453 | | | 148,198 | | | 150,401 | | | 151,275 | | | 151,222 | |
| End of period corporate services accounts | | | | | | 1,946,956 | | | 1,908,836 | | | 1,893,881 | | | 1,853,875 | | | 1,817,983 | |
| End of period accounts | | | | | | 7,590,005 | | | 7,226,791 | | | 7,174,420 | | | 7,127,819 | | | 7,057,802 | |
The following table presents net new accounts and annualized growth rates by channel:
| | | | | | | | | | | | | | | | | | | | | | | | | | | | | | | | | | |
| | | | | | | 1Q 2020 | | 4Q 2019 | | 3Q 2019 | | 2Q 2019 | | 1Q 2019 |
| Net new retail accounts | | | | | | 328,839 | | 39,619 | | 7,469 | | 34,072 | | 80,830 |
| Net new advisor services accounts | | | | | | (3,745) | | (2,203) | | (874) | | 53 | | (19) |
| Net new corporate services accounts | | | | | | 38,120 | | 14,955 | | 40,006 | | 35,892 | | 54,154 |
| Net new accounts | | | | | | 363,214 | | 52,371 | | 46,601 | | 70,017 | | 134,965 |
| | | | | | | | | | | | | | |
| Net new retail account growth rate | | | | | | 25.4 | % | | 3.1 | % | | 0.6 | % | | 2.7 | % | | 6.5 | % |
| Net new advisor services account growth rate | | | | | | (10.1) | % | | (5.9) | % | | (2.3) | % | | 0.1 | % | | (0.1) | % |
| Net new corporate services account growth rate | | | | | | 8.0 | % | | 3.2 | % | | 8.6 | % | | 7.9 | % | | 12.3 | % |
| Net new total account growth rate | | | | | | 20.1 | % | | 2.9 | % | | 2.6 | % | | 4.0 | % | | 7.8 | % |
E*TRADE Q1 2020 10-Q | Page 10
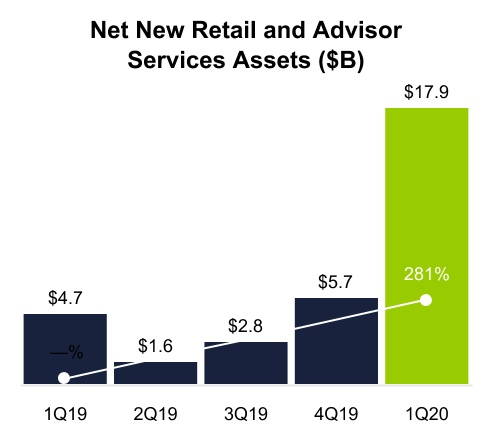
Net new retail and advisor services assets equals total inflows to new and existing retail and advisor services accounts less total outflows from closed and existing retail and advisor services accounts. The net new retail and advisor services assets metric is a general indicator of the use of our products and services by new and existing retail and advisor services customers. Net new retail and advisor services assets exclude the effects of market movements in the value of retail and advisor services assets. Net new retail and advisor services assets were $17.9 billion and $4.7 billion for the three months ended March 31, 2020 and 2019, respectively, as we experienced record customer engagement during the three months ended March 31, 2020. The following table presents annualized net new retail and advisor services assets growth rates:
| | | | | | | | | | | | | | | | | | | | | | | | | | | | | | | | | | |
| | | | | | | 1Q 2020 | | 4Q 2019 | | 3Q 2019 | | 2Q 2019 | | 1Q 2019 |
| Net new retail assets growth rate | | | | | | 20.2 | % | | 7.0 | % | | 3.4 | % | | 2.1 | % | | 6.8 | % |
| Net new advisor services assets growth rate | | | | | | (7.1) | % | | (2.3) | % | | 0.8 | % | | (1.2) | % | | (3.5) | % |
| Net new retail and advisor services assets growth rate | | | | | | 18.8 | % | | 6.5 | % | | 3.2 | % | | 1.9 | % | | 6.2 | % |
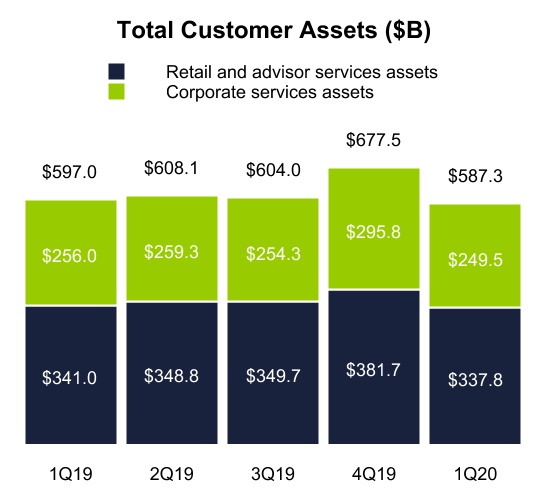
Total customer assets is an indicator of the value of our relationship with our customers. An increase generally indicates that the use of our products and services is expanding. Changes in this metric are also driven by changes in the valuations of our customers' underlying securities. The net decrease in customer assets during the three months ended March 31, 2020 was driven by the decline in equity market valuations in the second half of the quarter. The following table presents the significant components of total customer assets (dollars in billions):
| | | | | | | | | | | | | | | | | | | | | | | | | | | | | | | | | | |
| | | | | | | 1Q 2020 | | 4Q 2019 | | 3Q 2019 | | 2Q 2019 | | 1Q 2019 |
| Security holdings | | | | | | $ | 253.2 | | | $ | 310.7 | | | $ | 284.7 | | | $ | 286.6 | | | $ | 279.3 | |
| Cash and deposits | | | | | | 84.6 | | | 71.0 | | | 65.0 | | | 62.2 | | | 61.7 | |
| Retail and advisor services assets | | | | | | 337.8 | | | 381.7 | | | 349.7 | | | 348.8 | | | 341.0 | |
| Corporate services vested assets | | | | | | 135.8 | | | 159.1 | | | 138.9 | | | 142.3 | | | 140.6 | |
| Retail, advisor services, and corporate services vested assets | | | | | | 473.6 | | | 540.8 | | | 488.6 | | | 491.1 | | | 481.6 | |
| Corporate services unvested holdings | | | | | | 113.7 | | | 136.7 | | | 115.4 | | | 117.0 | | | 115.4 | |
| Total customer assets | | | | | | $ | 587.3 | | | $ | 677.5 | | | $ | 604.0 | | | $ | 608.1 | | | $ | 597.0 | |
E*TRADE Q1 2020 10-Q | Page 11
Customer cash and deposits is a significant component of total customer assets and is a key driver of net interest income as well as fees and service charges revenue, which includes fees earned on customer cash held by third parties. The following table presents the significant components of total customer cash and deposits (dollars in billions):
| | | | | | | | | | | | | | | | | | | | | | | | | | | | | | | | | | |
| | | | | | | 1Q 2020 | | 4Q 2019 | | 3Q 2019 | | 2Q 2019 | | 1Q 2019 |
| Sweep deposits: | | | | | | | | | | | | | | |
| Brokerage sweep deposits | | | | | | $ | 38.1 | | | $ | 27.9 | | | $ | 30.8 | | | $ | 31.7 | | | $ | 38.6 | |
Bank sweep deposits(1) | | | | | | 0.7 | | | 6.4 | | | — | | | | — | | | — | |
| Customer payables | | | | | | 16.0 | | | 12.8 | | | 11.2 | | | 10.6 | | | 10.6 | |
Savings, checking, and other banking assets(2) | | | | | | 3.3 | | | 4.3 | | | 9.6 | | | 8.6 | | | 7.7 | |
| Total on-balance sheet customer cash and deposits | | | | | | 58.1 | | | 51.4 | | | 51.6 | | | 50.9 | | | 56.9 | |
| Brokerage sweep deposits at unaffiliated financial institutions | | | | | | 15.4 | | | 16.9 | | | 11.7 | | | 9.6 | | | 3.0 | |
Bank sweep deposits at unaffiliated financial institutions(1) | | | | | | 9.1 | | | 0.8 | | | — | | | | — | | | | — | |
| Money market funds and other | | | | | | 2.0 | | | 1.9 | | | 1.7 | | | 1.7 | | | 1.8 | |
Total customer cash held by third parties(3) | | | | | | 26.5 | | | 19.6 | | | 13.4 | | | 11.3 | | | 4.8 | |
| Total customer cash and deposits | | | | | | $ | 84.6 | | | $ | 71.0 | | | $ | 65.0 | | | $ | 62.2 | | | $ | 61.7 | |
(1)Beginning in Q4 2019, bank sweep deposits include Premium Savings Accounts participating in the newly established bank sweep deposit account program. Refer to MD&A—Balance Sheet Overview for additional information.
(2)Savings, checking, and other banking assets include $1.0 billion, $6.3 billion, $5.1 billion, and $3.8 billion of deposits at December 31, 2019, September 30, 2019, June 30, 2019, and March 31, 2019, respectively in our Premium Savings Account product. These balances were converted to our bank sweep deposit account program beginning in Q4 2019 and during the three months ended March 31, 2020, with all new Premium Savings Accounts now automatically enrolled in the program.
(3)Customer cash held by third parties is held outside E*TRADE and includes sweep deposit accounts and money market funds at unaffiliated financial institutions, net of deposit balances from unaffiliated institutions held on-balance sheet. Customer cash held by third parties is not reflected in the Company's consolidated balance sheet and is not immediately available for liquidity purposes.
The following table presents the average balances and net fees earned on brokerage and bank sweep deposits held at unaffiliated financial institutions (dollars in billions, fees in basis points):
| | | | | | | | | | | | | | | | | | | | | | | | | | | | | |
| 1Q 2020 | | 4Q 2019 | | 3Q 2019 | | 2Q 2019 | | 1Q 2019 |
| | | | | | | | | |
| Brokerage sweep deposits at unaffiliated financial institutions | $ | 15.4 | | | $ | 14.7 | | | $ | 11.0 | | | $ | 3.7 | | | $ | 3.4 | |
Brokerage sweep deposit fees(1) | 148 | | | 179 | | | 218 | | | 221 | | | 221 | |
| Bank sweep deposits at unaffiliated financial institutions | $ | 5.5 | | | $ | 0.3 | | | $ | — | | | $ | — | | | $ | — | |
Bank sweep deposit fees(1) | 8 | | | 6 | | | — | | | — | | | — | |
(1)Fees are net of interest paid.
E*TRADE Q1 2020 10-Q | Page 12
Corporate Metrics:
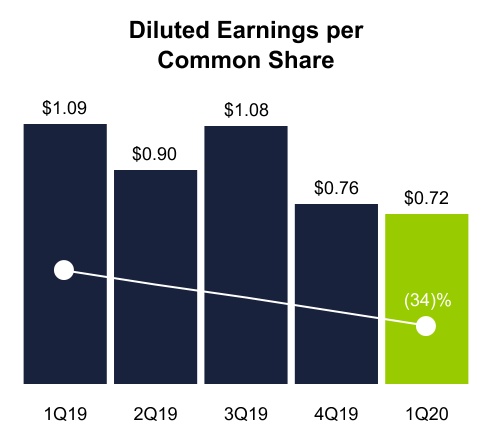
Diluted earnings per common share is the portion of a company's profit allocated to each diluted share of common stock and is a key indicator of the Company's profitability. Diluted earnings per common share was $0.72 and $1.09 for the three months ended March 31, 2020 and 2019, respectively. See MD&A—Earnings Overview for further details.
Operating margin is the percentage of net revenue that results in income before income taxes and is an indicator of the Company's profitability. Operating margin was 36% and 52% for the three months ended March 31, 2020 and 2019, respectively.
Adjusted operating margin is a non-GAAP measure that provides useful information about our ongoing operating performance by excluding the provision (benefit) for credit losses, which is not viewed as key factor governing our investment in the business and is excluded by management when evaluating operating margin performance. Adjusted operating margin was 37% and 50% for the three months ended March 31, 2020 and 2019, respectively. See MD&A—Earnings Overview for a reconciliation of adjusted operating margin to operating margin.
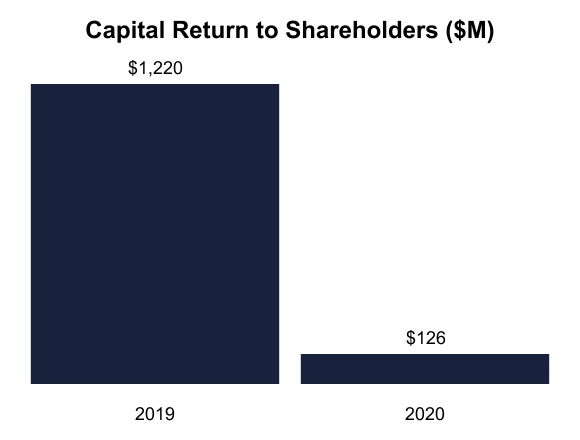

Capital return to shareholders represents the amount of earnings returned to shareholders through share repurchases and common stock dividends and Capital return percentage to shareholders is capital returned to shareholders as a percentage of net income available to common shareholders. Capital return to shareholders was $126 million and $1.2 billion for the three months ended March 31, 2020 and the year ended December 31, 2019, respectively, and included common stock dividends of $31 million and $135 million, respectively, for the same periods. Capital return percentage to shareholders was 78% and 133% for the same periods. The Company repurchased 2.1 million shares for $95 million during the three months
E*TRADE Q1 2020 10-Q | Page 13
ended March 31, 2020 prior to suspending share repurchases in connection with the proposed merger with Morgan Stanley. The Company also returned capital to shareholders in the form of shares withheld for taxes of $13 million and $20 million for the three months ended March 31, 2020 and the year ended December 31, 2019, respectively.
Return on common equity is calculated by dividing net income available to common shareholders by average common shareholders' equity, which excludes preferred stock. Return on common equity was 11% and 19% for the three months ended March 31, 2020 and 2019, respectively.
Adjusted return on common equity is a non-GAAP measure calculated by dividing adjusted net income available to common shareholders by average common shareholders' equity, which excludes preferred stock. Adjusted net income available to common shareholders is a non-GAAP measure which excludes the provision (benefit) for credit losses, which is not viewed as key factor governing our investment in the business and is excluded by management when evaluating return on common equity performance. Adjusted return on common equity was 12% and 18% for the three months ended March 31, 2020 and 2019, respectively. See MD&A—Earnings Overview for a reconciliation of adjusted net income available to common shareholders to net income and adjusted return on common equity to return on common equity.
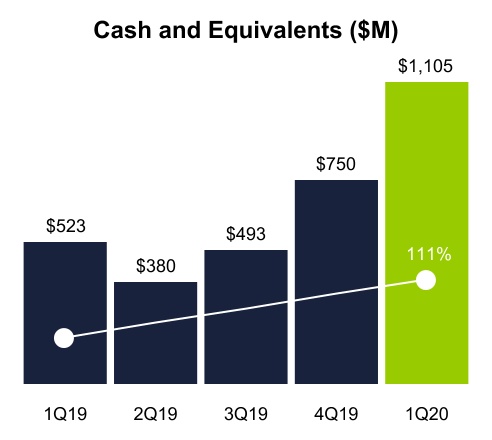

Corporate cash, a non-GAAP measure, is a component of cash and equivalents and represents the primary source of capital above and beyond the capital deployed in our regulated subsidiaries. Cash and equivalents was $1.1 billion and $523 million at March 31, 2020 and 2019, respectively, while corporate cash was $438 million and $329 million for the same periods. See MD&A—Liquidity and Capital Resources for a reconciliation of corporate cash to cash and equivalents.
E*TRADE Q1 2020 10-Q | Page 14
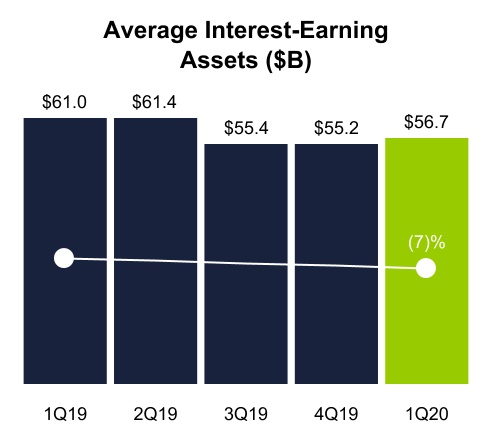
Average interest-earning assets, along with net interest margin, are indicators of our ability to generate net interest income. Average interest-earning assets were $56.7 billion and $61.0 billion for the three months ended March 31, 2020 and 2019, respectively.
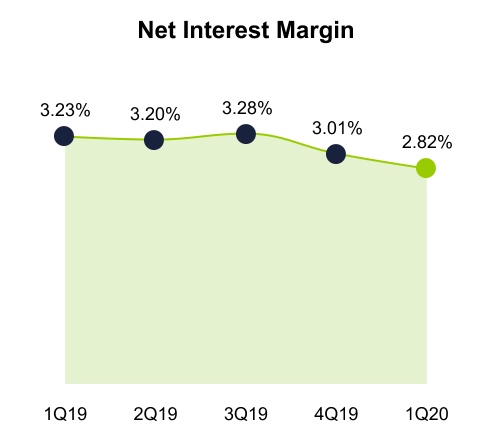
Net interest margin is a measure of the net yield on our average interest-earning assets. Net interest margin is calculated for a given period by dividing the annualized sum of net interest income by average interest-earning assets. Net interest margin was 2.82% and 3.23% for the three months ended March 31, 2020 and 2019, respectively.
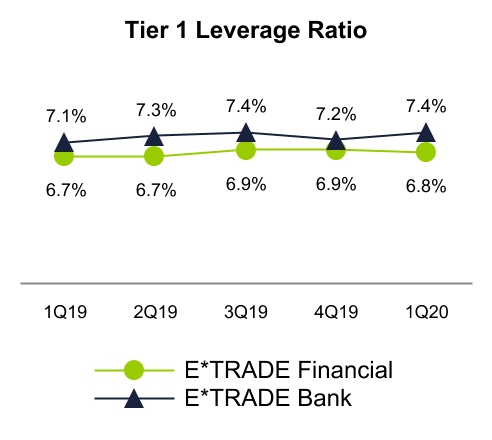
Tier 1 leverage ratio is an indicator of capital adequacy for E*TRADE Financial and E*TRADE Bank. Tier 1 leverage ratio is Tier 1 capital divided by adjusted average assets for leverage capital purposes. E*TRADE Financial's Tier 1 leverage ratio was 6.8% and 6.7% at March 31, 2020 and 2019, respectively. E*TRADE Bank's Tier 1 leverage ratio was 7.4% and 7.1% at March 31, 2020 and 2019, respectively. The internal threshold for E*TRADE Financial's Tier 1 leverage ratio is 6.5% and the internal threshold for E*TRADE Bank's Tier 1 leverage ratio is 7.0%. See MD&A—Liquidity and Capital Resources for additional information, including the calculation of regulatory capital ratios.
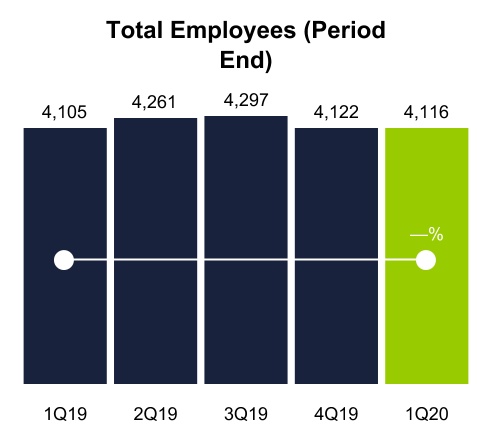
Total employees is the key driver of compensation and benefits expense, our largest non-interest expense category. Total employees were 4,116 and 4,105 at March 31, 2020 and 2019, respectively.
E*TRADE Q1 2020 10-Q | Page 15
We generated net income of $181 million on total net revenue of $707 million for the three months ended March 31, 2020. The following chart presents a reconciliation of net income for the three months ended March 31, 2019 to net income for the three months ended March 31, 2020 (dollars in millions):
(1)Includes advertising and market development, professional services, depreciation and amortization, FDIC insurance premiums, amortization of other intangibles and other non-interest expenses.
E*TRADE Q1 2020 10-Q | Page 16
The following table presents significant components of the consolidated statements of income (dollars in millions, except per share amounts):
| | | | | | | | | | | | | | | | | | | | | | | | | | | | | | | | | | | |
| | | | | | | | | | Three Months Ended March 31, | | | | Variance | | | | | | |
| | | | | | | | | | | | | | 2020 vs. 2019 | | | | | | |
| | | | | | | | | | 2020 | | 2019 | | Amount | | % | | | | |
| Net interest income | | | | | | | | | $ | 400 | | | $ | 492 | | | $ | (92) | | | (19) | % | | | | |
| Total non-interest income | | | | | | | | | 307 | | | 263 | | | 44 | | | 17 | % | | | | |
| Total net revenue | | | | | | | | | 707 | | | 755 | | | (48) | | | (6) | % | | | | |
| Provision (benefit) for credit losses | | | | | | | | | 6 | | | (12) | | | 18 | | | * | | | | | |
| Total non-interest expense | | | | | | | | | 445 | | | 375 | | | 70 | | | 19 | % | | | | |
| Income before income tax expense | | | | | | | | | 256 | | | 392 | | | (136) | | | (35) | % | | | | |
| Income tax expense | | | | | | | | | 75 | | | 102 | | | (27) | | | (26) | % | | | | |
| Net income | | | | | | | | | $ | 181 | | | $ | 290 | | | $ | (109) | | | (38) | % | | | | |
| Preferred stock dividends | | | | | | | | | 20 | | | 20 | | | — | | | — | % | | | | |
| Net income available to common shareholders | | | | | | | | | $ | 161 | | | $ | 270 | | | $ | (109) | | | (40) | % | | | | |
| Diluted earnings per common share | | | | | | | | | $ | 0.72 | | | $ | 1.09 | | | $ | (0.37) | | | (34) | % | | | | |
* Percentage not meaningful.
Net income decreased 38% to $181 million or $0.72 per diluted share, for the three months ended March 31, 2020 compared to the same period in 2019. Net income available to common shareholders was $161 million and $270 million for the three months ended March 31, 2020 and 2019, respectively, which includes preferred stock dividends of $20 million in both periods. The decrease in net income was the result of lower net revenues, higher provision for credit losses and higher non-interest expense due to increases in clearing and servicing expense, communications, restructuring and acquisition-related activities, and other non-interest expense compared to the three months ended March 31, 2019.
Net Revenue
The following table presents the significant components of total net revenue (dollars in millions):
| | | | | | | | | | | | | | | | | | | | | | | | | | | | | | | | | | | | | |
| | | | | | | | | | Three Months Ended March 31, | | | | | | Variance | | | | | | |
| | | | | | | | | | | | | | | | 2020 vs. 2019 | | | | | | |
| | | | | | | | | | 2020 | | 2019 | | | | Amount | | % | | | | |
| Net interest income | | | | | | | | | $ | 400 | | | $ | 492 | | | | | $ | (92) | | | (19) | % | | | | |
| Commissions | | | | | | | | | 71 | | | 122 | | | | | (51) | | | (42) | % | | | | |
| Fees and service charges | | | | | | | | | 203 | | | 118 | | | | | 85 | | | 72 | % | | | | |
| Gains on securities and other, net | | | | | | | | | 20 | | | 11 | | | | | 9 | | | 82 | % | | | | |
| Other revenue | | | | | | | | | 13 | | | 12 | | | | | 1 | | | 8 | % | | | | |
| Total non-interest income | | | | | | | | | 307 | | | 263 | | | | | 44 | | | 17 | % | | | | |
| Total net revenue | | | | | | | | | $ | 707 | | | $ | 755 | | | | | $ | (48) | | | (6) | % | | | | |
E*TRADE Q1 2020 10-Q | Page 17
Net Interest Income
Net interest income decreased 19% to $400 million for the three months ended March 31, 2020 compared to the same period in 2019. Net interest income is earned primarily through investment securities, margin receivables, securities lending, and our legacy loan portfolio, offset by funding costs.
The following tables present average balance sheet data and interest income and expense data, as well as related net interest margin, yields, and rates (dollars in millions):
| | | | | | | | | | | | | | | | | | | | | | | | | | | | | | | | | | | | | | | | | |
| | Three Months Ended March 31, | | | | | | | | | | | | | | | | |
| | 2020 | | | | | | 2019 | | | | | | | | | | |
| | Average Balance | | Interest Inc./Exp. | | Average Yield/
Cost | | Average Balance | | Interest Inc./Exp. | | Average Yield/
Cost | | | | | | |
| Cash and equivalents | $ | 767 | | | $ | 2 | | | 1.01 | % | | $ | 607 | | | $ | 3 | | | 2.31 | % | | | | | | |
| Cash segregated under federal or other regulations | 2,586 | | | 8 | | | 1.26 | % | | 986 | | | 6 | | | 2.63 | % | | | | | | |
| Investment securities | 41,033 | | | 285 | | | 2.78 | % | | 46,968 | | | 365 | | | 3.10 | % | | | | | | |
| Margin receivables | 9,361 | | | 94 | | | 4.04 | % | | 9,766 | | | 126 | | | 5.24 | % | | | | | | |
Loans(1) | 1,564 | | | 21 | | | 5.36 | % | | 2,058 | | | 28 | | | 5.48 | % | | | | | | |
| Broker-related receivables and other | 1,351 | | | 4 | | | 1.24 | % | | 632 | | | 4 | | | 2.24 | % | | | | | | |
| Total interest-earning assets | 56,662 | | | 414 | | | 2.93 | % | | 61,017 | | | 532 | | | 3.50 | % | | | | | | |
Other interest revenue(2) | — | | | 29 | | | | | — | | | 23 | | | | | | | | | |
| Total interest-earning assets | 56,662 | | | 443 | | | 3.13 | % | | 61,017 | | | 555 | | | 3.65 | % | | | | | | |
| Total non-interest-earning assets | 6,673 | | | | | | | 4,991 | | | | | | | | | | | |
| Total assets | $ | 63,335 | | | | | | | $ | 66,008 | | | | | | | | | | | |
| | | | | | | | | | | | | | | | | |
| Sweep deposits: | | | | | | | | | | | | | | | | | |
| Brokerage sweep deposits | $ | 31,641 | | | $ | 5 | | | 0.06 | % | | $ | 38,433 | | | $ | 20 | | | 0.21 | % | | | | | | |
Bank sweep deposits(3) | 3,307 | | | 13 | | | 1.63 | % | | — | | | — | | | — | % | | | | | | |
| Savings deposits | 2,234 | | | 3 | | | 0.45 | % | | 4,968 | | | 15 | | | 1.22 | % | | | | | | |
| Other deposits | 1,603 | | | — | | | 0.02 | % | | 1,785 | | | — | | | 0.03 | % | | | | | | |
| Customer payables | 14,076 | | | 4 | | | 0.13 | % | | 10,462 | | | 9 | | | 0.34 | % | | | | | | |
| Broker-related payables and other | 836 | | | — | | | 0.03 | % | | 999 | | | 1 | | | 0.49 | % | | | | | | |
| Other borrowings | 5 | | | 1 | | | * | | | 269 | | | 2 | | | 3.81 | % | | | | | | |
| Corporate debt | 1,411 | | | 14 | | | 3.86 | % | | 1,409 | | | 14 | | | 3.91 | % | | | | | | |
| Total interest-bearing liabilities | 55,113 | | | 40 | | | 0.29 | % | | 58,325 | | | 61 | | | 0.42 | % | | | | | | |
Other interest expense(4) | — | | | 3 | | | | | — | | | 2 | | | | | | | | | |
| Total interest-bearing liabilities | 55,113 | | | 43 | | | 0.31 | % | | 58,325 | | | 63 | | | 0.44 | % | | | | | | |
| Total non-interest-bearing liabilities | 1,861 | | | | | | | 1,183 | | | | | | | | | | | |
| Total liabilities | 56,974 | | | | | | | 59,508 | | | | | | | | | | | |
| Total shareholders' equity | 6,361 | | | | | | | 6,500 | | | | | | | | | | | |
| Total liabilities and shareholders' equity | $ | 63,335 | | | | | | | $ | 66,008 | | | | | | | | | | | |
| Excess interest earning assets over interest bearing liabilities/net interest income/net interest margin | $ | 1,549 | | | $ | 400 | | | 2.82 | % | | $ | 2,692 | | | $ | 492 | | | 3.23 | % | | | | | | |
| | | | | | | | | | | | | | | | | |
| | | | | | | | | | | | | | | | | |
| | | | | | | | | | | | | | | | | |
* Percentage not meaningful.
(1)Nonaccrual loans are included in the average loan balances. Interest payments received on nonaccrual loans are recognized on a cash basis in interest income until it is doubtful that full payment will be collected, at which point payments are applied to principal.
(2)Other interest revenue is earned on certain securities loaned balances. Interest expense incurred on other securities loaned balances is presented on the broker-related payables and other line item above.
(3)Beginning in Q4 2019, bank sweep deposits include Premium Savings Accounts participating in the newly established bank sweep deposit account program. Refer to MD&A—Balance Sheet Overview for additional information.
(4)Other interest expense is incurred on certain securities borrowed balances. Interest income earned on other securities borrowed balances is presented on the broker-related receivables and other line item above.
E*TRADE Q1 2020 10-Q | Page 18
Average interest-earning assets decreased 7% to $56.7 billion for the three months ended March 31, 2020 compared to the same period in 2019. The fluctuation in average interest-earning assets is generally driven by changes in average interest-bearing liabilities, primarily deposits and customer payables. Average interest-bearing liabilities decreased 6% to $55.1 billion for the three months ended March 31, 2020 compared to the same period in 2019 due to the following:
•Deposits and customer payables: The decrease in sweep deposits was primarily driven by the balance sheet repositioning during the second quarter of 2019, as we moved $6.6 billion of deposits to third-party banks. The decrease in savings deposits was primarily driven by the conversion of Premium Savings Accounts into the bank sweep deposit program beginning in Q4 2019. These decreases were partially offset by increased customer payables as a result of increased customer engagement during the three months ended March 31, 2020. Refer to MD&A—Balance Sheet Overview for additional information.
•Other interest-bearing liabilities: The decrease in broker-related payables and other borrowings was driven by customer activity and short-term liquidity needs at E*TRADE Bank and E*TRADE Securities.
Net interest margin decreased 41 basis points to 2.82% for the three months ended March 31, 2020 compared to the same period in 2019. Net interest margin is driven by the mix of average asset and liability balances and the interest rates earned or paid on those balances. The decrease during the three months ended March 31, 2020 is due to a lower interest rate environment, including the impact of actions taken by the Federal Reserve to contain the financial and economic impact of the COVID-19 pandemic. The decrease in interest income for the three months ended March 31, 2020 is primarily the result of lower average interest earning assets, asset mix, and the lower interest rate environment compared to the same period in 2019.
Commissions
Commissions revenue decreased 42% to $71 million for the three months ended March 31, 2020 compared to the same period in 2019. The decrease was primarily related to the elimination of retail commissions in October 2019. The primary factors that affect commissions revenue are DARTs, derivative DARTs, trade type, and the number of trading days. We expect the majority of commissions revenue in future periods will be driven from options contract charges. For additional information see MD&A—Overview.
DARTs volume increased 129% to 651,746 for the three months ended March 31, 2020 compared to the same period in 2019. DARTs volume is impacted by market sentiment as well as volatility of the equity markets, which increased during the three months ended March 31, 2020. Derivative DARTs volume increased 102% to 186,065 for the three months ended March 31, 2020 compared to the same period in 2019.
E*TRADE Q1 2020 10-Q | Page 19
Fees and Service Charges
The following table presents the significant components of fees and service charges (dollars in millions):
| | | | | | | | | | | | | | | | | | | | | | | | | | | | | | | | | | | | | |
| | | | | | | | | | Three Months Ended March 31, | | | | | | Variance | | | | | | |
| | | | | | | | | | | | | | | | 2020 vs. 2019 | | | | | | |
| | | | | | | | | | 2020 | | 2019 | | | | Amount | | % | | | | |
| Order flow revenue | | | | | | | | | $ | 85 | | | $ | 43 | | | | | $ | 42 | | | 98 | % | | | | |
Money market funds and sweep deposits revenue(1) | | | | | | | | | 60 | | | 21 | | | | | 39 | | | 186 | % | | | | |
| Advisor management and custody fees | | | | | | | | | 19 | | | 18 | | | | | 1 | | | 6 | % | | | | |
| Mutual fund service fees | | | | | | | | | 13 | | | 12 | | | | | 1 | | | 8 | % | | | | |
| Foreign exchange revenue | | | | | | | | | 9 | | | 8 | | | | | 1 | | | 13 | % | | | | |
| Reorganization fees | | | | | | | | | 4 | | | 6 | | | | | (2) | | | (33) | % | | | | |
| Other fees and service charges | | | | | | | | | 13 | | | 10 | | | | | 3 | | | 30 | % | | | | |
| Total fees and service charges | | | | | | | | | $ | 203 | | | $ | 118 | | | | | $ | 85 | | | 72 | % | | | | |
(1)Includes revenue earned on average customer cash held by third parties based on the federal funds rate or LIBOR plus a negotiated spread or other contractual arrangements with the third-party institutions.
Fees and service charges increased 72% to $203 million for the three months ended March 31, 2020 compared to the same period in 2019. The increase was primarily driven by higher order flow revenue, due to market volatility and record customer engagement, and higher money market funds and sweep deposits revenue, due to higher average customer cash held by third parties resulting from the balance sheet repositioning in Q2 2019 and customer cash growth during the three months ended March 31, 2020, offset by lower net yields earned on customer cash due to the lower interest rate environment.
Gains on Securities and Other, Net
The following table presents the significant components of gains on securities and other, net (dollars in millions):
| | | | | | | | | | | | | | | | | | | | | | | | | | | | | | | | | | | | | |
| | | | | | | | | Three Months Ended March 31, | | | | | | Variance | | | | | | |
| | | | | | | | | | | | | | | 2020 vs. 2019 | | | | | | |
| | | | | | | | | 2020 | | 2019 | | | | Amount | | % | | | | |
| | | | | | | | | | | | | | | | | | | | | |
| Gains on available-for-sale securities | | | | | | | | | $ | 19 | | | $ | 11 | | | | | $ | 8 | | | 73 | % | | | | |
| | | | | | | | | | | | | | | | | | | | | |
| | | | | | | | | | | | | | | | | | | | | |
| Equity method investment income and other | | | | | | | | | 1 | | | — | | | | | 1 | | | 100 | % | | | | |
| Gains on securities and other, net | | | | | | | | | $ | 20 | | | $ | 11 | | | | | $ | 9 | | | 82 | % | | | | |
Provision (Benefit) for Credit Losses
We recognized a provision for credit losses of $6 million for the three months ended March 31, 2020 as compared to a benefit for credit losses of ($12) million for the three months ended March 31, 2019. The Company adopted amended accounting guidance related to accounting for credit losses on January 1, 2020. The timing and magnitude of the provision (benefit) for credit losses is affected by many factors that could result in variability. Changes in management's reasonable and supportable forecasts of estimated credit losses and collateral valuations, as well as the impact of actual charge-offs net of recoveries, will drive variability in provision (benefit) for credit losses in future periods. For additional information on management's estimate of the allowance for credit losses, see Note 7—Loans Receivable and Allowance for Credit Losses.
E*TRADE Q1 2020 10-Q | Page 20
Non-Interest Expense
The following table presents the significant components of non-interest expense (dollars in millions):
| | | | | | | | | | | | | | | | | | | | | | | | | | | | | | | | | | | |
| | | | | | | | | Three Months Ended March 31, | | | | Variance | | | | | | |
| | | | | | | | | | | | | | 2020 vs. 2019 | | | | | | |
| | | | | | | | | | 2020 | | 2019 | | Amount | | % | | | | |
| Compensation and benefits | | | | | | | | | $ | 168 | | | $ | 164 | | | $ | 4 | | | 2 | % | | | | |
| Advertising and market development | | | | | | | | | 56 | | | 54 | | | 2 | | | 4 | % | | | | |
| Clearing and servicing | | | | | | | | | 44 | | | 30 | | | 14 | | | 47 | % | | | | |
| Professional services | | | | | | | | | 23 | | | 22 | | | 1 | | | 5 | % | | | | |
| Occupancy and equipment | | | | | | | | | 36 | | | 32 | | | 4 | | | 13 | % | | | | |
| Communications | | | | | | | | | 29 | | | 15 | | | 14 | | | 93 | % | | | | |
| Depreciation and amortization | | | | | | | | | 23 | | | 21 | | | 2 | | | 10 | % | | | | |
| FDIC insurance premiums | | | | | | | | | 4 | | | 4 | | | — | | | — | % | | | | |
| Amortization of other intangibles | | | | | | | | | 15 | | | 15 | | | — | | | — | % | | | | |
| Restructuring and acquisition-related activities | | | | | | | | | 16 | | | — | | | 16 | | | 100 | % | | | | |
| | | | | | | | | | | | | | | | | | | |
| Other non-interest expenses | | | | | | | | | 31 | | | 18 | | | 13 | | | 72 | % | | | | |
| Total non-interest expense | | | | | | | | | $ | 445 | | | $ | 375 | | | $ | 70 | | | 19 | % | | | | |
Clearing and Servicing
Clearing and servicing expense increased 47% to $44 million for the three months ended March 31, 2020 compared to the same period in 2019. This increase was related primarily to increased customer engagement and trading volume resulting from the market volatility experienced during the three months ended March 31, 2020.
Communications
Communications expense increased 93% to $29 million for the three months ended March 31, 2020, compared to the same period in 2019. The increase was primarily driven by a $14 million benefit related to a change in estimate for previous market data usage during the three months ended March 31, 2019.
Restructuring and Acquisition-Related Activities
Restructuring and acquisition-related activities expense increased 100% to $16 million for the three months ended March 31, 2020 as compared to the same period in 2019. Restructuring and acquisition-related activities expense for the three months ended March 31, 2020 was driven primarily by costs incurred in connection with the proposed merger with Morgan Stanley. Refer to Note 2—Acquisitions and Restructuring for additional information.
Other Non-Interest Expenses
Other non-interest expenses increased 72% to $31 million for the three months ended March 31, 2020, compared to the same period in 2019. The increase was primarily driven by impairment of certain technology assets as a result of project cancellations.
E*TRADE Q1 2020 10-Q | Page 21
Operating Margin
Operating margin was 36% for the three months ended March 31, 2020 compared to 52% for the same period in 2019. Adjusted operating margin, a non-GAAP measure, was 37% for the three months ended March 31, 2020 compared to 50% for the same period in 2019.
Adjusted operating margin is calculated by dividing adjusted income before income tax expense by total net revenue. Adjusted income before income tax expense, a non-GAAP measure, excludes provision (benefit) for credit losses. The following table presents a reconciliation of adjusted income before income tax expense and adjusted operating margin, non-GAAP measures, to the most directly comparable GAAP measures (dollars in millions):
| | | | | | | | | | | | | | | | | | | | | | | | | | | | | | | | | | | |
| | | | | | | | | Three Months Ended March 31, | | | | | | | | | | |
| | | | | | | | | 2020 | | | | 2019 | | | | | | |
| | | | | | | | | Amount | | Operating Margin % | | Amount | | Operating Margin % | | | | |
| Income before income tax expense / operating margin | | | | | | | | | $ | 256 | | | 36 | % | | $ | 392 | | | 52 | % | | | | |
| Provision (benefit) for credit losses | | | | | | | | | 6 | | | | | (12) | | | | | | | |
| Adjusted income before income tax expense / adjusted operating margin | | | | | | | | | $ | 262 | | | 37 | % | | $ | 380 | | | 50 | % | | | | |
Return on Common Equity
Return on common equity was 11% for the three months ended March 31, 2020 compared to 19% for the same period in 2019. Adjusted return on common equity, a non-GAAP measure, was 12% for the three months ended March 31, 2020 compared to 18% for the same period in 2019.
Adjusted return on common equity is calculated by dividing adjusted net income available to common shareholders by average common shareholders' equity, which excludes preferred stock. Adjusted net income available to common shareholders, a non-GAAP measure, excludes the after-tax impact of the provision (benefit) for credit losses. The following table provides a reconciliation of GAAP net income available to common shareholders and return on common equity percentage to non-GAAP adjusted net income available to common shareholders and adjusted return on common equity percentage (dollars in millions):
| | | | | | | | | | | | | | | | | | | | | | | | | | | | | | | | | | | |
| | | | | | | | | Three Months Ended March 31, | | | | | | | | | | |
| | | | | | | | | 2020 | | | | 2019 | | | | | | |
| | | | | | | | | Amount | | Return on Common Equity % | | Amount | | Return on Common Equity % | | | | |
| Net income available to common shareholders and return on common equity | | | | | | | | | $ | 161 | | | 11% | | $ | 270 | | | 19 | % | | | | |
| Add back impact of the following items: | | | | | | | | | | | | | | | | | | | |
| Provision (benefit) for credit losses | | | | | | | | | 6 | | | | | (12) | | | | | | | |
| Income tax impact | | | | | | | | | (2) | | | | | 3 | | | | | | | |
| Net of tax | | | | | | | | | 4 | | | | | | (9) | | | | | | | | |
| Adjusted net income available to common shareholders and return on common equity | | | | | | | | | $ | 165 | | | 12% | | $ | 261 | | | 18 | % | | | | |
Income Tax Expense
Income tax expense was $75 million and $102 million for the three months ended March 31, 2020 and 2019, respectively. The effective tax rate was 29% and 26% respectively, for the same periods. The increase in the effective tax rate for the three months ended March 31, 2020 related primarily to discrete state tax expenses recognized during the period.
E*TRADE Q1 2020 10-Q | Page 22
The following table presents the significant components of the consolidated balance sheets (dollars in millions):
| | | | | | | | | | | | | | | | | | | | | | | |
| | | | | | Variance | | |
| | | | | | | |
| | March 31, | | December 31, | | 2020 vs. 2019 | | |
| | 2020 | | 2019 | | Amount | | % |
| Assets: | | | | | | | |
| Cash and equivalents | $ | 1,105 | | | $ | 750 | | | $ | 355 | | | 47 | % |
| Segregated cash | 5,730 | | | 1,879 | | | 3,851 | | | 205 | % |
| Investment securities | 46,530 | | | 41,470 | | | 5,060 | | | 12 | % |
| Margin receivables | 7,251 | | | 9,675 | | | (2,424) | | | (25) | % |
| Loans receivable, net | 1,634 | | | 1,595 | | | 39 | | | 2 | % |
| Receivables from brokers, dealers and clearing organizations | 1,124 | | | 1,395 | | | (271) | | | (19) | % |
| Property and equipment, net | 339 | | | 339 | | | — | | | — | % |
| Goodwill and other intangibles, net | 2,928 | | | 2,943 | | | (15) | | | (1) | % |
| Other assets | 1,215 | | | 1,370 | | | (155) | | | (11) | % |
| Total assets | $ | 67,856 | | | $ | 61,416 | | | $ | 6,440 | | | 10 | % |
| Liabilities and shareholders’ equity: | | | | | | | |
| Deposits | $ | 42,146 | | | $ | 38,606 | | | $ | 3,540 | | | 9 | % |
| Customer payables | 15,960 | | | 12,849 | | | 3,111 | | | 24 | % |
| Payables to brokers, dealers and clearing organizations | 776 | | | 893 | | | (117) | | | (13) | % |
| | | | | | | |
| Corporate debt | 1,411 | | | 1,410 | | | 1 | | | — | % |
| Other liabilities | 1,044 | | | 1,115 | | | (71) | | | (6) | % |
| Total liabilities | 61,337 | | | 54,873 | | | 6,464 | | | 12 | % |
| Shareholders’ equity | 6,519 | | | 6,543 | | | (24) | | | — | % |
| Total liabilities and shareholders’ equity | $ | 67,856 | | | $ | 61,416 | | | $ | 6,440 | | | 10 | % |
Cash and Equivalents
Cash and equivalents increased 47% to $1.1 billion during the three months ended March 31, 2020. Cash and equivalents will fluctuate based on a variety of factors, including, among other drivers, liquidity needs at the parent, customer activity at our regulated subsidiaries, and the timing of investments at E*TRADE Bank. For additional information on our use of cash and equivalents, see MD&A—Liquidity and Capital Resources and the Consolidated Statements of Cash Flows.
Segregated Cash
Cash segregated under federal or other regulations increased 205% to $5.7 billion during the three months ended March 31, 2020. The level of segregated cash is driven primarily by customer payables and securities lending balances we hold as liabilities compared with the amount of margin receivables and securities borrowed balances we hold as assets. The excess represents customer cash that we segregate for the exclusive benefit of our brokerage customers. Segregated cash can also be impacted by the level of securities purchased under agreements to resell between E*TRADE Securities and E*TRADE Bank, representing investments that were also segregated under federal or other regulations by E*TRADE Securities and eliminated in consolidation, which increased $2.1 billion to $4.0 billion as of March 31, 2020.
E*TRADE Q1 2020 10-Q | Page 23
Investment Securities
The following table presents the significant components of investment securities (dollars in millions):
| | | | | | | | | | | | | | | | | | | | | | | |
| | | | | | Variance | | |
| | | | | | | |
| | March 31, | | December 31, | | 2020 vs. 2019 | | |
| | 2020 | | 2019 | | Amount | | % |
| Available-for-sale securities: | | | | | | | |
| Agency mortgage-backed securities | $ | 17,449 | | | $ | 17,035 | | | $ | 414 | | | 2 | % |
| Other agency debt securities | 965 | | | 659 | | | 306 | | | 46 | % |
| US Treasuries | 1,343 | | | 1,227 | | | 116 | | | 9 | % |
Non-agency debt securities(1) | 1,683 | | | 580 | | | 1,103 | | | 190 | % |
| Total available-for-sale securities | $ | 21,440 | | | $ | 19,501 | | | $ | 1,939 | | | 10 | % |
| Held-to-maturity securities: | | | | | | | |
| Agency mortgage-backed securities | $ | 23,531 | | | $ | 20,085 | | | $ | 3,446 | | | 17 | % |
| Other agency debt securities | 1,559 | | | 1,884 | | | (325) | | | (17) | % |
| Total held-to-maturity securities | $ | 25,090 | | | $ | 21,969 | | | $ | 3,121 | | | 14 | % |
| Total investment securities | $ | 46,530 | | | $ | 41,470 | | | $ | 5,060 | | | 12 | % |
(1)Includes non-agency asset-backed securities (ABS) and non-agency commercial mortgage-backed securities.
Investment securities increased 12% to $46.5 billion during the three months ended March 31, 2020 consistent with growth of on balance sheet customer cash and deposits during the period. The non-agency portfolio increased 190% to $1.7 billion during the period as the Company made advantageous purchases given market volatility. Securities represented 69% and 68% of total assets at March 31, 2020 and December 31, 2019, respectively. We classify debt securities as available-for-sale or held-to-maturity based on our investment strategy and management’s assessment of our intent and ability to hold the debt securities until maturity.
Margin Receivables
Margin receivables decreased 25% to $7.3 billion during the three months ended March 31, 2020. Margin receivables contracted meaningfully in late March 2020 as a result of lower equity market valuations.
E*TRADE Q1 2020 10-Q | Page 24
Loans Receivable, Net
The following table presents the significant components of loans receivable, net (dollars in millions):
| | | | | | | | | | | | | | | | | | | | | | | |
| | | | | | Variance | | |
| | | | | | | |
| | March 31, | | December 31, | | 2020 vs. 2019 | | |
| | 2020 | | 2019 | | Amount | | % |
| One- to four-family | $ | 755 | | | $ | 803 | | | $ | (48) | | | (6) | % |
| Home equity | 594 | | | 635 | | | (41) | | | (6) | % |
| | | | | | | |
Securities-based lending(1) | 195 | | | 169 | | | 26 | | | 15 | % |
| Total loans receivable | 1,544 | | | 1,607 | | | (63) | | | (4) | % |
| Unamortized premiums, net | 4 | | | 5 | | | (1) | | | (20) | % |
| Subtotal | 1,548 | | | 1,612 | | | (64) | | | (4) | % |
Allowance for credit losses(2) | 86 | | | (17) | | | 103 | | | * | |
| Total loans receivable, net | $ | 1,634 | | | $ | 1,595 | | | $ | 39 | | | 2 | % |
* Percentage not meaningful.
(1)E*TRADE Line of Credit is a securities-based lending product where customers can borrow against the market value of their securities pledged as collateral. The unused credit line amount totaled $569 million and $431 million as of March 31, 2020 and December 31, 2019, respectively.
(2)The Company adopted amended accounting guidance related to accounting for credit losses on January 1, 2020. Prior year amounts related to the allowance for loan losses were not restated as the amended accounting guidance was adopted on a modified retrospective basis. See Note 1—Organization, Basis of Presentation and Summary of Significant Accounting Policies for further details.
Loans receivable decreased 4% to $1.5 billion during the three months ended March 31, 2020 due to runoff in our mortgage loan portfolio offset by increased securities-based lending. The allowance for credit losses was an $86 million "negative allowance," which reflects the Company's adoption of the amended accounting guidance effective January 1, 2020. For additional information on management's estimate of the allowance for credit losses, see Note 1—Organization, Basis of Presentation and Summary of Significant Accounting Policies and Note 7—Loans Receivable and Allowance for Credit Losses.
We expect the remaining legacy mortgage loan portfolio to continue its run-off for the foreseeable future. As our portfolio has seasoned and substantially all interest-only loans have converted to amortizing, we continue to assess underlying performance, the economic environment, and the value of the portfolio in the marketplace. While it is our intention to continue to hold these loans, our strategy could change subject to market conditions.
E*TRADE Q1 2020 10-Q | Page 25
Receivables from and Payables to Brokers, Dealers and Clearing Organizations
The following table presents the significant components of receivables from and payables to brokers, dealers and clearing organizations (dollars in millions):
| | | | | | | | | | | | | | | | | | | | | | | |
| | | | | | Variance | | |
| | | | | | | |
| | March 31, | | December 31, | | 2020 vs. 2019 | | |
| | 2020 | | 2019 | | Amount | | % |
| Receivables: | | | | | | | |
| Securities borrowed | $ | 507 | | | $ | 1,003 | | | $ | (496) | | | (49) | % |
| Receivables from clearing organizations | 499 | | | 297 | | | 202 | | | 68 | % |
| Other | 118 | | | 95 | | | 23 | | | 24 | % |
| Total | $ | 1,124 | | | $ | 1,395 | | | $ | (271) | | | (19) | % |
| | | | | | | |
| Payables: | | | | | | | |
| Securities loaned | $ | 696 | | | $ | 838 | | | $ | (142) | | | (17) | % |
| Payables to clearing organizations | 23 | | | 10 | | | 13 | | | 130 | % |
| Other | 57 | | | 45 | | | 12 | | | 27 | % |
| Total | $ | 776 | | | $ | 893 | | | $ | (117) | | | (13) | % |
Securities borrowed decreased 49% to $507 million during the three months ended March 31, 2020. The decrease was primarily driven by decreased demand for cash from our counterparties. The 68% increase in receivables from clearing organizations during the three months ended March 31, 2020 to $499 million was primarily driven by higher collateral requirements as a result of increased customer trading activity.
Securities loaned decreased 17% to $696 million during the three months ended March 31, 2020. The decrease was primarily driven by lower demand for securities from our counterparties. For additional information on E*TRADE Securities liquidity, see MD&A—Liquidity and Capital Resources.
Deposits
The following table presents the significant components of deposits (dollars in millions):
| | | | | | | | | | | | | | | | | | | | | | | |
| | | | | | Variance | | |
| | | | | | | |
| | March 31, | | December 31, | | 2020 vs. 2019 | | |
| | 2020 | | 2019 | | Amount | | % |
| Sweep deposits: | | | | | | | |
| Brokerage sweep deposits | $ | 38,095 | | | $ | 27,949 | | | $ | 10,146 | | | 36 | % |
Bank sweep deposits(1) | 680 | | | 6,355 | | | (5,675) | | | (89) | % |
Savings deposits(2) | 1,667 | | | 2,592 | | | (925) | | | (36) | % |
| Other deposits | 1,704 | | | 1,710 | | | (6) | | | — | % |
| Total deposits | $ | 42,146 | | | $ | 38,606 | | | $ | 3,540 | | | 9 | % |
(1)Beginning Q4 2019, bank sweep deposits include Premium Savings Accounts participating in the newly established bank sweep deposit account program.
(2)Savings deposits include $1.0 billion of deposits at December 31, 2019 in our Premium Savings Account product that were subsequently converted to the bank sweep deposit account program. All new Premium Savings Accounts are now automatically enrolled in the program.
Deposits represented 69% and 70% of total liabilities at March 31, 2020 and December 31, 2019, respectively. Deposits increased by 9% to $42.1 billion during the three months ended March 31, 2020. This net increase was due primarily to an increase in brokerage sweep deposits as a result of increased customer engagement during the period, offset by a decrease in bank sweep deposits due to a planned
E*TRADE Q1 2020 10-Q | Page 26
movement to third parties and a decrease in savings deposits as a result of the conversion of $1.0 billion of Premium Savings Account balances into the bank sweep deposit account program during the period.
We offer the following sweep deposit account programs to customers which utilize our bank subsidiaries, in combination with additional third-party program banks, as applicable:
•Extended insurance sweep deposit account (ESDA) program
•Retirement sweep deposit account (RSDA) program for retirement plan customers
•Cash balance program offered by E*TRADE Savings Bank for uninvested cash held in eligible custodial accounts as part of the advisor services offering
•Bank sweep deposit account program offered by E*TRADE Bank for Premium Savings Account holders
Our sweep deposit programs are designed to offer up to $1.25 million in FDIC coverage for individual accounts ($2.5 million for joint accounts). The bank sweep deposit program, which launched in Q4 2019, provides the Company with the ability to transfer amounts held on deposit in E*TRADE Bank Premium Savings Accounts to an FDIC-insured account at one or more participating banks if desired. As the bank sweep deposit program was established to allow for reciprocal deposits, E*TRADE Bank may also accept deposits from customers of the participating third-party banks. Bank sweep deposits included $1.0 billion of reciprocal deposits received from third-party banks at December 31, 2019. As of March 31, 2020, the Company has no such deposits. See MD&A—Earnings Overview and Note 9—Deposits for additional information.
As of March 31, 2020, approximately 98% of sweep deposits were in these programs. Sweep deposits on balance sheet are held at bank subsidiaries and are included in the deposits line item on our consolidated balance sheets.
| | |
| LIQUIDITY AND CAPITAL RESOURCES |
We have established liquidity and capital policies to support the successful execution of our business strategy, while maintaining ongoing and sufficient liquidity through the business cycle. We believe liquidity is of critical importance to the Company and especially important for E*TRADE Bank and E*TRADE Securities. The objective of our policies is to ensure that we can meet our corporate, banking and broker-dealer liquidity needs under both normal operating conditions and under periods of stress in the financial markets.
Liquidity
Our liquidity needs are primarily driven by capital needs at E*TRADE Bank and E*TRADE Securities, interest due on our corporate debt, dividend payments on our preferred stock and other capital returns to holders of our common stock. Our banking and brokerage subsidiaries' liquidity needs are driven primarily by the level and volatility of our customer activity. Management maintains a set of liquidity sources and monitors certain business trends and market metrics closely in an effort to ensure we have sufficient liquidity. Potential loans by E*TRADE Bank or E*TRADE Savings Bank to the parent company or the parent company's other non-bank subsidiaries are subject to various quantitative, arm’s length, collateralization, capital and other requirements.
E*TRADE Q1 2020 10-Q | Page 27
Parent Company Liquidity
The parent company's primary source of liquidity is corporate cash. Corporate cash, a non-GAAP measure, is a component of cash and equivalents; see the Consolidated Statements of Cash Flows for information on cash and equivalents activity. We define corporate cash as cash held at the parent company and subsidiaries, excluding bank, broker-dealer, and FCM subsidiaries that require regulatory approval or notification prior to the payment of certain dividends to the parent company. Corporate cash includes the parent company's deposits placed with E*TRADE Bank. E*TRADE Bank may use these deposits for investment purposes; however, these investments are not included in consolidated cash and equivalents.
We believe corporate cash is a useful measure of the parent company’s liquidity as it is the primary source of capital above and beyond the capital deployed in our regulated subsidiaries. Corporate cash is monitored as part of our liquidity risk management. Our current corporate cash target is $300 million and covers approximately 18 months of parent company fixed costs, which include corporate overhead costs, preferred stock dividends, corporate debt interest, and, as applicable, contractual corporate debt maturities over the next 12 months. Parent company fixed costs are defined as minimum expenditures required to operate the business and exclude controllable, or variable costs. The Company maintains additional liquidity through a $300 million unsecured committed revolving credit facility. The parent has the ability to borrow against the credit facility for working capital and general corporate purposes. Dividends from our operating subsidiaries, including E*TRADE Bank and E*TRADE Securities, are additional sources of corporate cash. Subject to regulatory approval or notification, capital generated by these subsidiaries could be distributed to the parent company to the extent the excess capital levels exceed both regulatory capital requirements and internal capital thresholds. As of March 31, 2020, our subsidiaries maintained excess regulatory capital over internal thresholds and paid dividends of $50 million to the parent company during the three months ended March 31, 2020.
E*TRADE Q1 2020 10-Q | Page 28
The following chart presents the key activities impacting corporate cash and provides a roll forward of corporate cash from December 31, 2019 to March 31, 2020 (dollars in millions):
The following table presents a reconciliation of consolidated cash and equivalents to corporate cash, a non-GAAP measure (dollars in millions):
| | | | | | | | | | | | | |
| | | | | |
| | | | | |
| | March 31, 2020 | | December 31, 2019 | | |
| Consolidated cash and equivalents | $ | 1,105 | | | $ | 750 | | | |
| Less: Cash at regulated subsidiaries | (1,094) | | | (716) | | | |
Add: Cash on deposit at E*TRADE Bank(1) | 427 | | | 611 | | | |
| Corporate cash | $ | 438 | | | $ | 645 | | | |
(1)Corporate cash includes the parent company's deposits placed with E*TRADE Bank. E*TRADE Bank may use these deposits for investment purposes; however, these investments are not included in consolidated cash and equivalents.
E*TRADE Q1 2020 10-Q | Page 29
Corporate cash decreased $207 million to $438 million during the three months ended March 31, 2020 due to the following:
•$50 million of dividends received from our brokerage subsidiary
•$12 million received from tax refunds, net of payments and subsidiary reimbursements
•$107 million used primarily for parent company overhead, including both fixed and variable costs, less reimbursements from subsidiaries under cost sharing arrangements and the impact of cash activity at other non-regulated subsidiaries
•$95 million used for share repurchases
•$51 million used for dividends, including $31 million in common stock dividends and $20 million in preferred stock dividends
•$16 million used for interest on corporate debt
E*TRADE Bank Liquidity
E*TRADE Bank, including its subsidiary E*TRADE Savings Bank, relies primarily on deposits for liquidity needs. Management believes that within deposits, sweep deposits are of particular importance as they are a stable source of liquidity for E*TRADE Bank. The vast majority of E*TRADE Bank's liquidity is invested in securities backed by the US government or its agencies, representing highly liquid securities with low credit risk.
We may also utilize wholesale funding sources for short-term liquidity and contingency funding requirements. Our ability to borrow these funds is dependent upon the continued availability of funding in the wholesale borrowings market. In addition, we can borrow from the Federal Reserve Bank of Richmond's discount window to meet short-term liquidity requirements, although it is not viewed as a primary source of funding.
E*TRADE Securities Liquidity
E*TRADE Securities relies primarily on customer payables and securities lending to provide liquidity and to fund margin lending. E*TRADE Securities maintains additional liquidity through external lines of credit totaling approximately $1.3 billion. E*TRADE Securities also maintains lines of credit with the parent company and E*TRADE Bank.
E*TRADE Q1 2020 10-Q | Page 30
External Liquidity Sources
The following table presents the Company's external lines of credit at March 31, 2020 (dollars in millions):
| | | | | | | | | | | | | | |
| Description | Maturity Date | Borrower | Outstanding | Available |
Senior unsecured, committed revolving credit facility(1) | June 2024 | ETFC | $ | — | | $ | 300 | |
| FHLB secured credit facility | Determined at trade | ETB | $ | — | | $ | 6,430 | |
| Federal Reserve Bank discount window | Overnight | ETB | $ | — | | $ | 1,245 | |
Senior unsecured, committed revolving credit facility(2) | June 2020 | ETS | $ | — | | $ | 600 | |
| Secured, committed lines of credit | June 2020 | ETS | $ | — | | $ | 175 | |
| Unsecured, uncommitted lines of credit | June 2020 | ETS | $ | — | | $ | 50 | |
| Unsecured, uncommitted lines of credit | None | ETS | $ | — | | $ | 75 | |
| Secured, uncommitted lines of credit | None | | ETS | $ | — | | $ | 425 | |
(1)The senior unsecured committed revolving credit facility contains certain covenants, including maintenance covenants related to the Company's interest coverage, leverage and regulatory net capital ratios with which the Company was in compliance at March 31, 2020.
(2)The senior unsecured committed revolving credit facility contains certain covenants, including maintenance covenants related to E*TRADE Securities' minimum consolidated tangible net worth and regulatory net capital ratio with which the Company was in compliance at March 31, 2020.
Capital Resources
The Company seeks to manage capital levels in support of our business strategy of generating and effectively deploying capital, governed by the Company's risk management framework. For additional information on our bank and brokerage capital requirements, refer to Note 13—Regulatory Requirements.
E*TRADE Q1 2020 10-Q | Page 31
Bank Capital Requirements
At March 31, 2020, our regulatory capital ratios for E*TRADE Financial and E*TRADE Bank were above the minimum ratios required to be "well capitalized." Currently, the internal threshold for E*TRADE Financial's Tier 1 leverage ratio is 6.5% and the internal threshold for E*TRADE Bank's Tier 1 leverage ratio is 7.0%. For additional information on bank regulatory requirements refer to Note 13—Regulatory Requirements.
The following table presents E*TRADE Financial and E*TRADE Bank's capital ratios (dollars in millions):
| | | | | | | | | | | | | | | | | | | | | | | |
| E*TRADE Financial | | | | E*TRADE Bank | | |
| March 31, 2020 | | December 31, 2019 | | March 31, 2020 | | December 31, 2019 |
| Shareholders’ equity | $ | 6,519 | | | $ | 6,543 | | | $ | 3,529 | | | $ | 3,488 | |
| Deduct: | | | | | | | |
| Preferred stock | (689) | | | (689) | | | — | | | — | |
| Common Equity Tier 1 capital before regulatory adjustments | $ | 5,830 | | | $ | 5,854 | | | $ | 3,529 | | | $ | 3,488 | |
| Add: | | | | | | | |
| Losses in other comprehensive income on available-for-sale debt securities, net of tax | 168 | | | 28 | | | 168 | | | 28 | |
| Deduct: | | | | | | | |
| Goodwill and other intangible assets, net of deferred tax liabilities | (2,456) | | | (2,466) | | | (273) | | | (276) | |
| Disallowed deferred tax assets | (52) | | | (70) | | | (4) | | | — | |
| Common Equity Tier 1 capital | $ | 3,490 | | | $ | 3,346 | | | $ | 3,420 | | | $ | 3,240 | |
| Add: | | | | | | | |
| Preferred stock | 689 | | | 689 | | | — | | | — | |
| | | | | | | |
| | | | | | | |
| Tier 1 capital | $ | 4,179 | | | $ | 4,035 | | | $ | 3,420 | | | $ | 3,240 | |
| Add: | | | | | | | |
| | | | | | | |
| Other | — | | | 25 | | | — | | | 17 | |
| Total capital | $ | 4,179 | | | $ | 4,060 | | | $ | 3,420 | | | $ | 3,257 | |
| | | | | | | |
| Average assets for leverage capital purposes | $ | 63,515 | | | $ | 60,968 | | | $ | 46,544 | | | $ | 45,320 | |
| Deduct: | | | | | | | |
| Goodwill and other intangible assets, net of deferred tax liabilities | (2,456) | | | (2,466) | | | (273) | | | (276) | |
| Disallowed deferred tax assets | (52) | | | (70) | | | (4) | | | — | |
| Adjusted average assets for leverage capital purposes | $ | 61,007 | | | $ | 58,432 | | | $ | 46,267 | | | $ | 45,044 | |
| | | | | | | |
Total risk-weighted assets(1) | $ | 11,920 | | | $ | 10,635 | | | $ | 9,554 | | | $ | 8,872 | |
| | | | | | | |
| Tier 1 leverage ratio (Tier 1 capital / Adjusted average assets for leverage capital purposes) | 6.8 | % | | 6.9 | % | | 7.4 | % | | 7.2 | % |
Common Equity Tier 1 capital / Total risk-weighted assets(1) | 29.3 | % | | 31.5 | % | | 35.8 | % | | 36.5 | % |
| Tier 1 capital / Total risk-weighted assets | 35.1 | % | | 37.9 | % | | 35.8 | % | | 36.5 | % |
| Total capital / Total risk-weighted assets | 35.1 | % | | 38.2 | % | | 35.8 | % | | 36.7 | % |
(1)Under the regulatory guidelines for risk-based capital, on-balance sheet assets and credit equivalent amounts of derivatives and off-balance sheet items are assigned to one of several broad risk categories according to the obligor or, if relevant, the guarantor or the nature of any collateral. The aggregate dollar amount in each risk category is then multiplied by the risk weight associated with that category. The resulting weighted values from each of the risk categories are aggregated for determining total risk-weighted assets.
Broker-Dealer and FCM Capital Requirements
Our broker-dealer and FCM subsidiaries are subject to capital requirements determined by their respective regulators. At March 31, 2020, these subsidiaries met their minimum net capital requirements. We continually assess our ability to distribute excess net capital to the parent while maintaining adequate capital at the broker-dealer and FCM subsidiaries. For additional information on our broker-dealer and FCM capital requirements, refer to Note 13—Regulatory Requirements.
E*TRADE Q1 2020 10-Q | Page 32
Off-Balance Sheet Arrangements
We enter into various off-balance sheet arrangements in the ordinary course of business, primarily to meet the needs of our customers and to reduce our own exposure to interest rate risk. These arrangements include firm commitments to extend credit. Additionally, we enter into guarantees and other similar arrangements as part of transactions in the ordinary course of business. For additional information on these arrangements, refer to Note 14—Commitments, Contingencies and Other Regulatory Matters.
The identification, mitigation and management of existing and potential risks is critical to effective enterprise risk management. There are certain risks inherent to our industry and certain risks that will surface through the conduct of our business operations. We seek to monitor and manage our significant risk exposures by operating under a set of Board-approved limits and by monitoring certain risk indicators. Our governance framework is designed to comply with applicable requirements and requires regular reporting on metrics and significant risks and exposures to senior management and the Board of Directors.
We face the following key types of risks: credit, liquidity, market, operational, strategic, reputational, as well as legal and regulatory. We have a Board-approved Enterprise Risk Appetite Statement (RAS) that specifies significant risk exposures and addresses the Company's tolerance for these risks, which are described in further detail within Part II. Item 7. Management's Discussion and Analysis of Financial Condition and Results of Operations of our Annual Report on Form 10-K for the year ended December 31, 2019. We are also subject to other risks that could affect our business, financial condition, results of operations or cash flows in future periods. For additional information see Part II. Item 1A. — Risk Factors.
E*TRADE Q1 2020 10-Q | Page 33
| | |
| CONCENTRATIONS OF CREDIT RISK |
Credit risk is the risk of loss arising from the inability or failure of a borrower or counterparty to meet its credit obligations. Our mortgage loan portfolio represents our most significant credit risk exposure.
•One- to Four-Family Interest-Only Loans and Home Equity Loans: One- to four-family loans include loans with a five to ten-year interest-only period, followed by an amortizing period ranging from 20 to 25 years. The home equity loan portfolio consists of home equity installment loans (HEILs) and home equity lines of credit (HELOCs) and is primarily second lien loans on residential real estate properties that have a higher level of credit risk than first lien mortgage loans. HEILs are primarily fixed rate and fixed term, fully amortizing loans that do not offer the option of an interest-only payment. The majority of HELOCs had an interest-only draw period at origination and converted to amortizing loans at the end of the draw period, which typically ranged from five to ten years. At March 31, 2020, all of the one-to four-family loans were amortizing and substantially all of the HELOC portfolio had converted from the interest-only draw period. These conversions mitigate the risk associated with these loans; however, the Company is still exposed to the risk if the borrowers fail to perform or if prolonged disruption to the global economy as a result of the COVID-19 pandemic impairs our customers’ ability to fulfill their credit obligations.
The Coronavirus Aid, Relief, and Economic Security Act (CARES Act) was enacted on March 27, 2020 to provide stimulus to the US economy in the form of financial aid to individuals and businesses, among other groups. The CARES Act includes provisions for housing assistance, including mortgage forbearance and foreclosure relief to eligible individuals. The Company is currently evaluating these provisions, working with its third-party servicers to respond to customer requests and assessing the potential impact to the Company’s exposure to credit risk in future periods.
•Securities: We focus primarily on security type and credit rating to monitor credit risk in our securities portfolios. We consider securities backed by the US government or its agencies to have low credit risk as the long-term debt rating of the US government is AA+ by S&P and Aaa by Moody’s at March 31, 2020. The amortized cost of these securities accounted for 96% of our total securities portfolio at March 31, 2020. We review the remaining debt securities that were not backed by the US government or its agencies according to their credit ratings from S&P and Moody’s where available, and all such debt securities were rated investment grade at March 31, 2020.
E*TRADE Q1 2020 10-Q | Page 34
| | |
| SUMMARY OF CRITICAL ACCOUNTING POLICIES AND ESTIMATES |
The discussion and analysis of our financial condition and results of operations are based on our consolidated financial statements, which have been prepared in conformity with accounting principles generally accepted in the United States of America (GAAP). Note 1—Organization, Basis of Presentation and Summary of Significant Accounting Policies in Part II. Item 8. Financial Statements and Supplementary Data in our Annual Report on Form 10-K for the year ended December 31, 2019 contains a summary of our significant accounting policies. The discussion below and in Note 1—Organization, Basis of Presentation and Summary of Significant Accounting Policies includes updates for newly adopted GAAP. Many of the significant accounting policies require the use of estimates and assumptions that affect the amounts reported in the consolidated financial statements and related notes for the periods presented. We believe that, of our significant accounting policies, the following are critical because they are based on estimates and assumptions that require complex and subjective judgments by management: allowance for credit losses; valuation and impairment of goodwill and acquired intangible assets; and income taxes. Changes in these estimates or assumptions could materially impact our financial condition and results of operations, and actual results could differ from our estimates. Our critical accounting policies are more fully described in Part II. Item 7. Management's Discussion and Analysis of Financial Condition and Results of Operations—Summary of Critical Accounting Policies and Estimates in our Annual Report on Form 10-K for the year ended December 31, 2019. Valuation and Impairment of Goodwill and Acquired Intangible Assets
The valuation of goodwill and acquired intangible assets requires significant judgment and estimates by management. Management also applies judgment in conducting impairment testing for goodwill and finite lived intangible assets, including in making estimates of fair value based on the income or market approach and estimates required to determine the useful lives of finite lived intangible assets. The Company evaluated its goodwill and finite lived intangible assets for impairment as a result of the decline in its share price related to actions taken by the Federal Reserve to contain the financial and economic impact of the COVID-19 pandemic. No impairment was indicated at March 31, 2020 as a result of this analysis. Prolonged disruption to the economy as a result of the pandemic, and any resulting volatility in the market, could continue to put pressure on equity market valuations, including our own, which could result in impairment of goodwill in future periods.
Adoption of New Accounting Standards
Accounting for Credit Losses
In June 2016, the Financial Accounting Standards Board (FASB) amended the guidance on accounting for credit losses, requiring measurement of an allowance for credit losses for financial instruments, including loans and debt securities, and other commitments to extend credit held at the reporting date. The FASB has subsequently issued clarifications and improvements, including clarification that the current expected credit losses (CECL) standard allows for subsequent increases in the fair value of collateral for collateral-dependent loans to be recognized up to the amount previously charged-off. The amended guidance became effective for the Company beginning January 1, 2020.
The Company recognized an after-tax benefit related to mortgage loans of $84 million as an adjustment to opening retained earnings at adoption on January 1, 2020. The benefit primarily related to appreciation of fair value of the underlying collateral for mortgage loans that had been determined to be collateral-dependent and charged-off to the fair value of the underlying collateral in prior periods. See Note 1—Organization, Basis of Presentation and Summary of Significant Accounting Policies for additional information.
E*TRADE Q1 2020 10-Q | Page 35
Determining the CECL allowance is complex and requires judgment by management about the effect of matters that are inherently uncertain. The CECL allowance is based on assumptions about quantitative and qualitative factors, and changes to the allowance may result if future conditions differ from these assumptions. For example, in the event the cash received through liquidation or other form of recovery for collateral-dependent loans is less than the fair value of collateral less estimated costs to sell, additional losses may be recognized. Subsequent evaluations of the loan portfolio, in light of the factors then prevailing, may result in significant changes in the CECL allowance in future periods. Our underlying assumptions and judgments could prove to be inaccurate, which could impact our regulatory capital position and results of operations in future periods.
ITEM 3. QUANTITATIVE AND QUALITATIVE DISCLOSURES ABOUT MARKET RISK
The following discussion about market risk includes forward-looking statements. Actual results could differ materially from those projected in the forward-looking statements as a result of certain factors, including, but not limited to, those set forth in Part I. Forward Looking Statements and Part II. Item 1A. Risk Factors in this Quarterly Report and Part I. Item 1A. Risk Factors in the Annual Report on Form 10-K for the year ended December 31, 2019. Interest Rate Risk
Our exposure to interest rate risk is related primarily to interest-earning assets and interest-bearing liabilities. Managing interest rate risk is essential to profitability. The primary objective of interest rate risk management is to control exposure to interest rates within the Board-approved limits and with limited exposure to earnings volatility resulting from interest rate fluctuations. Our general strategies to manage interest rate risk include balancing variable-rate and fixed-rate assets and liabilities and utilizing derivatives to help manage exposures to changes in interest rates. Exposure to interest rate risk requires management to make complex assumptions regarding maturities, market interest rates and customer behavior. Changes in interest rates, including the following, could impact interest income and expense:
•Interest-earning assets and interest-bearing liabilities may re-price at different times or by different amounts, creating a mismatch.
•The yield curve may steepen, flatten or otherwise change shape, which could affect the spread between short- and long-term rates. Widening or narrowing spreads could impact net interest income.
•Market interest rates may influence prepayments, resulting in maturity mismatches. In addition, prepayments could impact yields as premiums and discounts amortize.
Exposure to interest rate risk is dependent upon the distribution and composition of interest-earning assets, interest-bearing liabilities and derivatives. The differing risk characteristics of each product are managed to mitigate our exposure to interest rate fluctuations. At March 31, 2020, 91% of our total assets were interest-earning assets and we had no securities classified as trading.
At March 31, 2020, 61% of total assets were available-for-sale and held-to-maturity mortgage-backed securities and residential real estate loans. The values of these assets are sensitive to changes in interest rates as well as expected prepayment levels. As interest rates increase, fixed-rate residential mortgages and mortgage-backed securities tend to exhibit lower prepayments. The inverse is true in a falling rate environment.
When real estate loans or mortgage-backed securities are prepaid, unamortized premiums and/or discounts are recognized immediately in interest income. Depending on the timing of the prepayment, these adjustments to income would impact anticipated yields. The Company reviews estimates of the impact of changing market rates on prepayments. This information is incorporated into our interest rate risk management strategy.
E*TRADE Q1 2020 10-Q | Page 36
Our liability structure consists of two central sources of funding: deposits and customer payables, both of which re-price at management’s discretion. We may utilize securities lending and wholesale funding sources as needed for short-term liquidity and contingency funding requirements.
Derivative Instruments
We use derivative instruments to help manage interest rate risk using designated hedge relationships. Interest rate swaps involve the exchange of fixed-rate and variable-rate interest payments between two parties based on a contractual underlying notional amount, but do not involve the exchange of the underlying notional amounts. See Note 8—Derivative Instruments and Hedging Activities for additional information about our use of derivative contracts.
Scenario Analysis
Scenario analysis is an advanced approach to estimating interest rate risk exposure. The Company monitors interest rate risk using the Economic Value of Equity (EVE) approach and the Earnings-at-Risk (EAR) approach.
Under the EVE approach, the present value of expected cash flows of all existing interest-earning assets, interest-bearing liabilities, derivatives and forward commitments are estimated and combined to produce an EVE figure. The change in EVE is a long-term sensitivity measure of interest rate risk. The approach values only the current balance sheet in which the most significant assumptions are the prepayment rates of the loan and mortgage-backed securities portfolios and the repricing of deposits. This approach does not incorporate assumptions related to business growth, or liquidation and reinvestment of instruments. This approach provides an indicator of future earnings and capital levels because changes in EVE indicate the anticipated change in the value of future cash flows. The sensitivity of this value to changes in interest rates is then determined by applying alternative interest rate scenarios. The change in EVE amounts fluctuate based on instantaneous parallel shifts in interest rates primarily due to the change in timing of cash flows, which considers prepayment estimates, in the Company’s residential loan and mortgage-backed securities portfolios.
EAR is a short-term sensitivity measure of interest rate risk and illustrates the impact of alternative interest rate scenarios on net interest income, including corporate interest expense, over a twelve month time frame. In measuring the sensitivity of net interest income to changes in interest rates, we assume instantaneous parallel interest rate shocks applied to the forward curve. In addition, we assume that cash flows from loan payoffs are reinvested in mortgage-backed securities, we exclude revenue from off-balance sheet customer cash and we assume no balance sheet growth.
The following table presents the sensitivity of EVE and EAR at the consolidated E*TRADE Financial level (dollars in millions):
| | | | | | | | | | | | | | | | | | | | | | | | | | | | | | | | | | | | | | | | | | | | | | | | | | |
Instantaneous Parallel Change in Interest Rates
(basis points) | | Economic Value of Equity | | | | | | | | Earnings-at-Risk | | | | | | |
| | | | | | | | | | | | | | | | |
| | | | | | | | | | | | | | | | |
| | March 31, 2020 | | | | December 31, 2019 | | | | March 31, 2020 | | | | December 31, 2019 | | |
| | Amount | | Percentage | | Amount | | Percentage | | Amount | | Percentage | | Amount | | Percentage |
| +200 | | $ | 767 | | | 14.9 | % | | $ | (217) | | | (3.6) | % | | $ | 355 | | | 26.0 | % | | $ | 246 | | | 15.8 | % |
| +100 | | $ | 691 | | | 13.5 | % | | $ | 39 | | | 0.6 | % | | $ | 198 | | | 14.5 | % | | $ | 140 | | | 9.0 | % |
| +50 | | $ | 398 | | | 7.8 | % | | $ | 96 | | | 1.6 | % | | $ | 105 | | | 7.7 | % | | $ | 83 | | | 5.3 | % |
| -50 | | $ | (346) | | | (6.7) | % | | $ | (200) | | | (3.3) | % | | $ | (65) | | | (4.8) | % | | $ | (103) | | | (6.6) | % |
We actively manage interest rate risk. As interest rates change, we will adjust our strategy and mix of assets, liabilities and derivatives to optimize our interest rate risk position. For example, a 100 basis points increase in rates may not result in a change in value as indicated above. We compare the instantaneous parallel interest rate changes in EVE and EAR to the established limits set by the board of directors in order to assess interest rate risk. In the event that the percentage change in EVE or EAR exceeds the Board limits, our Chief Executive Officer, Chief Risk Officer, Chief Financial Officer and Treasurer must all be
E*TRADE Q1 2020 10-Q | Page 37
promptly notified in writing and decide upon a plan of remediation. In addition, the board of directors must be notified of the exception and the planned resolution. At March 31, 2020 the EVE and EAR percentage changes were within our Board limits.
Market Risk
Equity Securities Risk
We are indirectly exposed to equity securities risk in connection with securities collateralizing margin receivables and amounts borrowed under our E*TRADE Line of Credit, a securities-based lending product, as well as risk related to our securities lending and borrowing activities. We manage risk on margin and securities-based lending by requiring customers to maintain collateral in compliance with internal and, as applicable, regulatory guidelines. We monitor required margin levels daily and require our customers to deposit additional collateral, or to reduce positions, when necessary. We continuously monitor customer accounts to detect excessive concentration, large orders or positions, and other activities that indicate increased risk to us. We manage risks associated with our securities lending and borrowing activities by requiring credit approvals for counterparties, by monitoring the market value of securities loaned and collateral values for securities borrowed on a daily basis and requiring additional cash as collateral for securities loaned or return of collateral for securities borrowed when necessary, and by participating in a risk-sharing program offered through the Options Clearing Corporation.
Non-Agency Debt Securities Risk
During the fourth quarter of 2018, we expanded our RAS and updated our investment policies to permit investments in high-credit quality non-agency securities that include commercial mortgage-backed securities and ABS. We are exposed to risk in connection with the investments in non-agency commercial mortgage-backed and non-agency ABS, the latter of which are collateralized by credit card, automobile loan and student loan receivables at March 31, 2020. While our current non-agency investments are limited to senior classes, we may be exposed to a higher level of credit risk in the future if we purchase non-senior classes of notes. We manage risk with respect to non-agency securities by performing pre-purchase due diligence to assess collateral quality, transaction structure, cash flow sensitivity, and overall transaction risk. The results of the due diligence are reviewed and approved prior to purchase and the related investment performance is monitored monthly to assess any risk or other trends that emerge.
E*TRADE Q1 2020 10-Q | Page 38
KEY TERMS
Active trader—Customers that execute 30 or more trades per quarter.
Adjusted operating margin—A non-GAAP measure calculated by dividing adjusted income before income tax expense by total net revenue. Adjusted income before income tax expense, a non-GAAP measure, excludes provision (benefit) for credit losses and losses on early extinguishment of debt, as applicable.
Adjusted return on common equity—A non-GAAP measure calculated by dividing adjusted net income available to common shareholders, a non-GAAP measure which excludes the provision (benefit) for credit losses and losses on early extinguishment of debt, as applicable, by average common shareholders' equity, which excludes preferred stock.
Agency—US Government sponsored enterprises and federal government and other agencies, such as the Federal National Mortgage Association, Federal Home Loan Mortgage Corporation, Government National Mortgage Association, the Small Business Administration, the Export-Import Bank, Federal Home Loan Bank and the Federal Farm Credit Bank.
Asset-backed securities (ABS)—Debt securities backed by financial assets such as credit cards, automobile loans, student loans or other receivables.
Basel III—Global regulatory standards for bank capital adequacy and liquidity as issued by the international Basel Committee on Banking Supervision.
Basis point—One one-hundredth of a percentage point.
Capital return percentage to shareholders—Represents the amount of earnings returned to shareholders through share repurchases and common stock dividends as a percentage of net income available to common shareholders.
CECL—Current expected credit losses.
CFTC—Commodity Futures Trading Commission.
Charge-off—The result of removing a loan or portion of a loan from the Company's balance sheet because the loan is considered to be uncollectible, for example, when a loan balance is reduced to its collateral value, less estimated costs to sell, or fully charged-off.
CLTV—Combined loan-to-value ratio.
Collateral-dependent—A loan for which foreclosure is probable or a loan where repayment is expected to be provided substantially through the sale of the underlying collateral when the borrower is experiencing financial difficulty.
Common Equity Tier 1 capital—A measurement of the Company's core equity capital used in the calculation of capital adequacy ratios. Common Equity Tier 1 capital equals: total shareholders' equity, less preferred stock and related surplus, plus/(less) unrealized losses (gains) on certain available-for-sale securities, less goodwill and certain other intangible assets, less certain disallowed deferred tax assets and subject to certain other applicable adjustments.
Consolidated financial statements—Refers to the consolidated financial statements prepared in accordance with GAAP as included in the Company's Annual Report on Form 10-K and the condensed consolidated financial statements included in the Company's Quarterly Reports on Form 10-Q. Corporate cash—Cash held at the parent company as well as cash held in certain subsidiaries that can distribute cash to the parent company without any regulatory approval or notification.
E*TRADE Q1 2020 10-Q | Page 39
Customer account—Retail and advisor services accounts are defined as those with a minimum balance of $25 or a trade within the prior six months. Corporate services accounts are defined as those holding any type of vested or unvested securities from a corporate services client company or with a trade in the prior six months.
Customer assets—Market value of all customer assets held by the Company including security holdings, customer cash and deposits, and corporate services vested and unvested equity and option holdings.
Customer-directed trades—Includes all customer-directed trades, including trades associated with no-transaction-fee mutual funds, options trades through the Dime Buyback Program, and all ETF transactions (including those formerly classified as commission-free).
Daily average revenue trades (DARTs)—Total customer-directed trades in a period divided by the number of trading days during that period.
Derivative—A financial instrument or other contract which includes one or more underlying securities, notional amounts, or payment provisions. The contract generally requires no initial net investment and is settled on a net basis.
Derivative DARTs—Customer-directed options and futures trades in a period divided by the number of trading days during that period.
Dime Buyback Program—A program that allows customers to manage and protect capital by allowing them to close short options without commissions or contract fees.
Earnings at risk (EAR)—The sensitivity of net interest income to changes in interest rates over a twelve month horizon. It is a short-term measurement of interest rate risk and does not consider risks beyond the simulation time horizon. In addition, it requires reinvestment, funding, and hedging assumptions for the horizon.
Economic value of equity (EVE)—The sensitivity of the value of existing assets and liabilities, including derivatives and forward commitments, to changes in interest rates. It is a long-term measurement of interest rate risk and requires assumptions that include prepayment rates on the loan portfolio and mortgage-backed securities and the repricing of deposits.
ESDA—Extended insurance sweep deposit accounts.
ETB—E*TRADE Bank.
ETFC—E*TRADE Financial Corporation.
ETS—E*TRADE Securities.
Fair value—The price that would be received to sell an asset or paid to transfer a liability in an orderly transaction between market participants at the measurement date.
Fair value hedge—A derivative instrument designated in a hedging relationship that mitigates exposure to changes in the fair value of a recognized asset or liability or a firm commitment.
FASB—Financial Accounting Standards Board.
FCM—Futures Commission Merchant.
FDIC—Federal Deposit Insurance Corporation.
Federal Reserve—Federal Reserve System, including the Board of Governors of the Federal Reserve System and the twelve regional Federal Reserve Banks.
E*TRADE Q1 2020 10-Q | Page 40
FHLB—Federal Home Loan Bank.
FICO—Fair Isaac Credit Organization.
FINRA—Financial Industry Regulatory Authority.
Generally accepted accounting principles (GAAP)—Accounting principles generally accepted in the United States of America.
HEIL—Home equity installment loan.
HELOC—Home equity line of credit.
Interest-bearing liabilities—Liabilities such as deposits, customer payables, other borrowings, corporate debt and certain customer credit balances and securities lending balances on which the Company pays interest; excludes customer cash held by third parties.
Interest-earning assets—Assets such as available-for-sale securities, held-to-maturity securities, margin receivables, loans, securities borrowed balances and segregated cash that earn interest for the Company.
Interest rate swaps—Contracts that are entered into primarily as an asset/liability management strategy to reduce interest rate risk. Interest rate swap contracts are exchanges of interest rate payments, such as fixed-rate payments for floating-rate payments, based on notional amounts.
Investment grade—Defined as a rating equivalent to a Moody’s Investors Service (Moody’s) rating of “Baa3” or higher or an S&P rating of “BBB-” or higher.
LIBOR—London Interbank Offered Rate. LIBOR is the interest rate at which banks borrow funds from other banks in the London wholesale money market (or interbank market).
LLC—Limited liability company.
LTV—Loan-to-value ratio.
NASDAQ—National Association of Securities Dealers Automated Quotations.
Net interest income—A measure of interest revenue, net interest income is equal to interest income less interest expense.
Net interest margin—A measure of the net yield on our average interest-earning assets. Net interest margin is calculated for a given period by dividing the annualized sum of net interest income by average interest-earning assets.
NFA—National Futures Association.
Notional amount—The specified dollar amount underlying a derivative on which the calculated payments are based.
NYSE—The New York Stock Exchange.
OCC—Office of the Comptroller of the Currency.
Options—Contracts that grant the purchaser, for a premium payment, the right, but not the obligation, to either purchase or sell the associated financial instrument at a set price during a period or at a specified date in the future.
Probability of Default and Loss Given Default Model—Model used to determine the CECL allowance for mortgage loans that share similar risk characteristics and expected cash flows for cash-flow dependent
E*TRADE Q1 2020 10-Q | Page 41
loans. Expected credit losses are calculated by multiplying the probability that the loan will default during its remaining contractual term, adjusted for prepayments, by the expected losses given default.
Provision for credit losses—Expense or benefit resulting from changes in the allowance for credit losses as a result of updated credit loss assumptions, changes in the fair value of collateral for collateral-dependent loans, changes in the present value of expected cash flows for cash-flow dependent loans, or actual charge-offs or recoveries.
RAS—Risk Appetite Statement.
Real estate owned and repossessed assets—Ownership or physical possession of real property by the Company, generally acquired as a result of foreclosure or repossession.
Recovery—Represents cash proceeds received on a loan that had been previously charged off, for example, from a sale or other settlement on the charged off loan. Recoveries may also include benefits resulting from principal paydowns or payoffs on previously charged-off loans if these exceed charge-offs for the period.
Repurchase agreement—An agreement giving the transferor of an asset the right or obligation to repurchase the same or similar securities at a specified price on a given date from the transferee. These agreements are generally collateralized by mortgage-backed or investment-grade securities. From the transferee's perspective the arrangement is referred to as a reverse repurchase agreement.
RIA—Registered Investment Advisor.
Risk-weighted assets—Primarily computed by the assignment of specific risk-weightings to assets and off-balance sheet instruments for capital adequacy calculations.
RSDA—Retirement sweep deposit account.
S&P—Standard & Poor’s.
SEC—US Securities and Exchange Commission.
Sweep deposit accounts—Accounts with the functionality to transfer customer cash balances to and from an FDIC insured account.
Tier 1 capital—Adjusted equity capital used in the calculation of capital adequacy ratios. Tier 1 capital equals: Common Equity Tier 1 capital plus qualifying preferred stock and related surplus, subject to certain other applicable adjustments.
Troubled debt restructuring (TDR)—A loan modification that involves granting an economic concession to a borrower who is experiencing financial difficulty, and loans that have been charged-off due to bankruptcy notification.
VIE—Variable interest entity.
Wholesale borrowings—Borrowings that consist of repurchase agreements and FHLB advances.
E*TRADE Q1 2020 10-Q | Page 42
ITEM 1. CONDENSED CONSOLIDATED FINANCIAL STATEMENTS (UNAUDITED)
| | | | | |
| Condensed Consolidated Statements of Income | |
| Condensed Consolidated Statements of Comprehensive Income | |
| Condensed Consolidated Balance Sheets | |
| Condensed Consolidated Statements of Shareholders’ Equity | |
| Condensed Consolidated Statements of Cash Flows | |
| Notes to Condensed Consolidated Financial Statements (Unaudited) | |
| Note 1—Organization, Basis of Presentation and Summary of Significant Accounting Policies | |
| Note 2—Acquisitions and Restructuring | |
| Note 3—Net Revenue | |
| Note 4—Fair Value Disclosures | |
| Note 5—Offsetting Assets and Liabilities | |
| Note 6—Available-for-Sale and Held-to-Maturity Securities | |
| Note 7—Loans Receivable and Allowance for Credit Losses | |
| Note 8—Derivative Instruments and Hedging Activities | |
| Note 9—Deposits | |
| Note 10—Other Borrowings and Corporate Debt | |
| Note 11—Shareholders' Equity | |
| Note 12—Earnings Per Share | |
| Note 13—Regulatory Requirements | |
| Note 14—Commitments, Contingencies and Other Regulatory Matters | |
E*TRADE Q1 2020 10-Q | Page 43
E*TRADE FINANCIAL CORPORATION
CONDENSED CONSOLIDATED STATEMENTS OF INCOME
(In millions, except share data and per share amounts)
(Unaudited)
| | | | | | | | | | | | | | | | | |
| Three Months Ended March 31, | | | | | | | | |
| | 2020 | | 2019 | | | | | | |
| Revenue: | | | | | | | | | |
| Interest income | $ | 443 | | | $ | 555 | | | | | | | |
| Interest expense | (43) | | | (63) | | | | | | | |
| Net interest income | 400 | | | 492 | | | | | | | |
| Commissions | 71 | | | 122 | | | | | | | |
| Fees and service charges | 203 | | | 118 | | | | | | | |
| Gains on securities and other, net | 20 | | | 11 | | | | | | | |
| Other revenue | 13 | | | 12 | | | | | | | |
| Total non-interest income | 307 | | | 263 | | | | | | | |
| Total net revenue | 707 | | | 755 | | | | | | | |
| Provision (benefit) for credit losses | 6 | | | (12) | | | | | | | |
| Non-interest expense: | | | | | | | | | |
| Compensation and benefits | 168 | | | 164 | | | | | | | |
| Advertising and market development | 56 | | | 54 | | | | | | | |
| Clearing and servicing | 44 | | | 30 | | | | | | | |
| Professional services | 23 | | | 22 | | | | | | | |
| Occupancy and equipment | 36 | | | 32 | | | | | | | |
| Communications | 29 | | | 15 | | | | | | | |
| Depreciation and amortization | 23 | | | 21 | | | | | | | |
| FDIC insurance premiums | 4 | | | 4 | | | | | | | |
| Amortization of other intangibles | 15 | | | 15 | | | | | | | |
| Restructuring and acquisition-related activities | 16 | | | — | | | | | | | |
| | | | | | | | | |
| Other non-interest expenses | 31 | | | 18 | | | | | | | |
| Total non-interest expense | 445 | | | 375 | | | | | | | |
| Income before income tax expense | 256 | | | 392 | | | | | | | |
| Income tax expense | 75 | | | 102 | | | | | | | |
| Net income | $ | 181 | | | $ | 290 | | | | | | | |
| Preferred stock dividends | 20 | | | 20 | | | | | | | |
| Net income available to common shareholders | $ | 161 | | | $ | 270 | | | | | | | |
| Basic earnings per common share | $ | 0.73 | | | $ | 1.10 | | | | | | | |
| Diluted earnings per common share | $ | 0.72 | | | $ | 1.09 | | | | | | | |
| Weighted average common shares outstanding: | | | | | | | | | |
| Basic (in thousands) | 222,295 | | | 246,252 | | | | | | | |
| Diluted (in thousands) | 222,742 | | | 246,934 | | | | | | | |
See accompanying notes to the condensed consolidated financial statements (unaudited)
E*TRADE Q1 2020 10-Q | Page 44
E*TRADE FINANCIAL CORPORATION
CONDENSED CONSOLIDATED STATEMENTS OF COMPREHENSIVE INCOME
(In millions)
(Unaudited)
| | | | | | | | | | | | | |
| Three Months Ended March 31, | | | | |
| | 2020 | | 2019 | | |
| Net income | $ | 181 | | | $ | 290 | | | |
| Other comprehensive (loss) income, net of tax | | | | | |
| Available-for-sale securities: | | | | | |
| Unrealized (losses) gains, net | (126) | | | 112 | | | |
| Reclassification into earnings, net | (14) | | | (7) | | | |
| Net change from available-for-sale securities | (140) | | | 105 | | | |
| Other comprehensive (loss) income | (140) | | | 105 | | | |
| Comprehensive income | $ | 41 | | | $ | 395 | | | |
See accompanying notes to the condensed consolidated financial statements (unaudited)
E*TRADE Q1 2020 10-Q | Page 45
E*TRADE FINANCIAL CORPORATION
CONDENSED CONSOLIDATED BALANCE SHEETS
(In millions, except share data)
(Unaudited)
| | | | | | | | | | | |
| | March 31, | | December 31, |
| | | |
| | 2020 | | 2019 |
| ASSETS | | | |
| Cash and equivalents | $ | 1,105 | | | $ | 750 | |
| Cash segregated under federal or other regulations | 5,730 | | | 1,879 | |
Available-for-sale securities (amortized cost of $19,863 and $18,708 at March 31, 2020 and December 31, 2019, respectively) | 21,440 | | | 19,501 | |
| Held-to-maturity securities (fair value of $25,926 and $22,246 at March 31, 2020 and December 31, 2019, respectively) | 25,090 | | | 21,969 | |
| Margin receivables | 7,251 | | | 9,675 | |
| Loans receivable, net (net of allowance for credit losses of $86 and ($17) at March 31, 2020 and December 31, 2019, respectively) | 1,634 | | | 1,595 | |
| Receivables from brokers, dealers and clearing organizations | 1,124 | | | 1,395 | |
| Property and equipment, net | 339 | | | 339 | |
| Goodwill | 2,509 | | | 2,510 | |
| Other intangibles, net | 419 | | | 433 | |
| Other assets | 1,215 | | | 1,370 | |
| Total assets | $ | 67,856 | | | $ | 61,416 | |
| LIABILITIES AND SHAREHOLDERS’ EQUITY | | | |
| Liabilities: | | | |
| Deposits | $ | 42,146 | | | $ | 38,606 | |
| Customer payables | 15,960 | | | 12,849 | |
| Payables to brokers, dealers and clearing organizations | 776 | | | 893 | |
| | | |
| Corporate debt | 1,411 | | | 1,410 | |
| Other liabilities | 1,044 | | | 1,115 | |
| Total liabilities | 61,337 | | | 54,873 | |
| Commitments and contingencies (see Note 14) | | | |
| Shareholders’ equity: | | | |
| Preferred stock, $0.01 par value, 1,000,000 shares authorized, 403,000 shares issued and outstanding at both March 31, 2020 and December 31, 2019, respectively; aggregate liquidation preference of $700 at both March 31, 2020 and December 31, 2019, respectively | 689 | | | 689 | |
| Common stock, $0.01 par value, 400,000,000 shares authorized, 221,032,420 and 222,622,333 shares issued and outstanding at March 31, 2020 and December 31, 2019, respectively | 2 | | | 2 | |
| Additional paid-in-capital | 4,318 | | | 4,416 | |
| Retained earnings | 1,678 | | | 1,464 | |
| Accumulated other comprehensive loss | (168) | | | (28) | |
| Total shareholders’ equity | 6,519 | | | 6,543 | |
| Total liabilities and shareholders’ equity | $ | 67,856 | | | $ | 61,416 | |
See accompanying notes to the condensed consolidated financial statements (unaudited)
E*TRADE Q1 2020 10-Q | Page 46
E*TRADE FINANCIAL CORPORATION
CONDENSED CONSOLIDATED STATEMENTS OF SHAREHOLDERS’ EQUITY
(In millions)
(Unaudited)
| | | | | | | | | | | | | | | | | | | | | | | | | | | | | | | | | | | | | | | | | | | |
| | | | | | | | | | Additional
Paid-in
Capital | | Retained Earnings | | Accumulated
Other
Comprehensive
Loss | | Total
Shareholders’
Equity |
| | | | Preferred Stock | | Common Stock | | | | | | | | | | |
| | | | Amount | | Shares | | Amount | | | | | | | | |
| | | | | | | | | | | | | | | |
| | | | | | | | | | | | | | | |
| | | | | | | | | | | | | | | |
| | | | | | | | | | | | | | | |
| | | | | | | | | | | | | | | |
| | | | | | | | | | | | | | | |
| | | | | | | | | | | | | | | |
| | | | | | | | | | | | | | | |
| | | | | | | | | | | | | | | |
| | | | | | | | | | | | | | | |
| | | | | | | | | | | | | | | |
| | | | | | | | | | | | | | | |
| | | | | | | | | | | | | | | |
| | | | | | | | | | | | | | | |
| | | | | | | | | | | | | | | |
| | | | | | | | | | | | | | | |
| | | | | | | | | | | | | | | |
| | | | | | | | | | | | | | | |
| | | | | | | | | | | | | | | |
| | | | | | | | | | | | | | | |
| Balance at December 31, 2019 | | | $ | 689 | | | 223 | | | $ | 2 | | | $ | 4,416 | | | $ | 1,464 | | | $ | (28) | | | $ | 6,543 | |
| Cumulative effect of CECL adoption | | | — | | | — | | | — | | | — | | | 84 | | | — | | | 84 | |
| Net income | | | — | | | — | | | — | | | — | | | 181 | | | — | | | 181 | |
Other comprehensive loss | | | — | | | — | | | — | | | — | | | — | | | (140) | | | (140) | |
| Common stock dividends ($0.14 per share) | | | — | | | — | | | — | | | — | | | (31) | | | — | | | (31) | |
| Preferred stock dividends - Series A ($29.38 per share) | | | — | | | — | | | — | | | — | | | (12) | | | — | | | (12) | |
| Preferred stock dividends - Series B ($2,650.00 per share) | | | — | | | — | | | — | | | — | | | (8) | | | — | | | (8) | |
Repurchases of common stock | | | — | | | (2) | | | — | | | (95) | | | — | | | — | | | (95) | |
| Share-based compensation | | | — | | | — | | | — | | | 8 | | | — | | | — | | | 8 | |
Other common stock activity | | | — | | | — | | | — | | | (11) | | | — | | | — | | | (11) | |
| Balance at March 31, 2020 | | | $ | 689 | | | 221 | | | $ | 2 | | | $ | 4,318 | | | $ | 1,678 | | | $ | (168) | | | $ | 6,519 | |
| | | | | | | | | Additional
Paid-in
Capital | | Retained Earnings | | Accumulated
Other
Comprehensive
Loss | | Total
Shareholders’
Equity |
| | | Preferred Stock | | Common Stock | | | | | | | | | | |
| | | Amount | | Shares | | Amount | | | | | | | | |
| Balance at December 31, 2018 | | | $ | 689 | | | 246 | | | $ | 2 | | | $ | 5,462 | | | $ | 684 | | | $ | (275) | | | $ | 6,562 | |
| Net income | | | — | | | — | | | — | | | — | | | 290 | | | — | | | 290 | |
Other comprehensive income | | | — | | | — | | | — | | | — | | | — | | | 105 | | | 105 | |
| Common stock dividends ($0.14 per share) | | | — | | | — | | | — | | | — | | | (35) | | | — | | | (35) | |
| Preferred stock dividends - Series A ($29.38 per share) | | | — | | | — | | | — | | | — | | | (12) | | | — | | | (12) | |
| Preferred stock dividends - Series B ($2,650.00 per share) | | | — | | | — | | | — | | | — | | | (8) | | | — | | | (8) | |
Repurchases of common stock | | | — | | | (2) | | | — | | | (120) | | | — | | | — | | | (120) | |
| Share-based compensation | | | — | | | — | | | — | | | 13 | | | — | | | — | | | 13 | |
Other common stock activity | | | — | | | 1 | | | — | | | (13) | | | — | | | — | | | (13) | |
| Balance at March 31, 2019 | | | $ | 689 | | | 245 | | | $ | 2 | | | $ | 5,342 | | | $ | 919 | | | $ | (170) | | | $ | 6,782 | |
| | | | | | | | | | | | | | | |
| | | | | | | | | | | | | | | |
| | | | | | | | | | | | | | | |
| | | | | | | | | | | | | | | |
| | | | | | | | | | | | | | | |
| | | | | | | | | | | | | | | |
| | | | | | | | | | | | | | | |
| | | | | | | | | | | | | | | |
| | | | | | | | | | | | | | | |
| | | | | | | | | | | | | | | |
| | | | | | | | | | | | | | | |
| | | | | | | | | | | | | | | |
| | | | | | | | | | | | | | | |
| | | | | | | | | | | | | | | |
| | | | | | | | | | | | | | | |
| | | | | | | | | | | | | | | |
| | | | | | | | | | | | | | | |
| | | | | | | | | | | | | | | |
| | | | | | | | | | | | | | | |
| | | | | | | | | | | | | | | |
| | | | | | | | | | | | | | | |
| | | | | | | | | | | | | | | |
| | | | | | | | | | | | | | | |
| | | | | | | | | | | | | | | |
| | | | | | | | | | | | | | | |
| | | | | | | | | | | | | | | |
| | | | | | | | | | | | | | | |
| | | | | | | | | | | | | | | |
| | | | | | | | | | | | | | | |
| | | | | | | | | | | | | | | |
| | | | | | | | | | | | | | | |
| | | | | | | | | | | | | | | |
| | | | | | | | | | | | | | | |
| | | | | | | | | | | | | | | |
| | | | | | | | | | | | | | | |
| | | | | | | | | | | | | | | |
| | | | | | | | | | | | | | | |
| | | | | | | | | | | | | | | |
| | | | | | | | | | | | | | | |
| | | | | | | | | | | | | | | |
| | | | | | | | | | | | | | | |
See accompanying notes to the condensed consolidated financial statements (unaudited)
E*TRADE Q1 2020 10-Q | Page 47
E*TRADE FINANCIAL CORPORATION
CONDENSED CONSOLIDATED STATEMENTS OF CASH FLOWS
(In millions)
(Unaudited)
| | | | | | | | | | | | | |
| Three Months Ended March 31, | | | | |
| | 2020 | | 2019 | | |
| Cash flows from operating activities: | | | | | |
| Net income | $ | 181 | | | $ | 290 | | | |
Adjustments to reconcile net income to net cash provided by operating activities: | | | | | |
| Provision (benefit) for credit losses | 6 | | | (12) | | | |
| Depreciation and amortization (including amortization and accretion on investment securities) | 57 | | | 54 | | | |
| Gains on securities and other, net | (20) | | | (11) | | | |
| | | | | |
| Share-based compensation | 8 | | | 13 | | | |
| Deferred tax expense | (11) | | | 93 | | | |
| Other | 11 | | | (3) | | | |
| Net effect of changes in assets and liabilities: | | | | | |
| | | | | |
| Decrease in receivables from brokers, dealers and clearing organizations | 271 | | | 163 | | | |
| Decrease (increase) in margin receivables | 2,424 | | | (707) | | | |
| Increase in other assets | (103) | | | (183) | | | |
| (Decrease) increase in payables to brokers, dealers and clearing organizations | (117) | | | 214 | | | |
| Increase in customer payables | 3,111 | | | 483 | | | |
| Decrease in other liabilities | (997) | | | (209) | | | |
| Net cash provided by operating activities | 4,821 | | | 185 | | | |
| Cash flows from investing activities: | | | | | |
| Purchases of available-for-sale securities | (3,479) | | | (3,589) | | | |
| Proceeds from sales of available-for-sale securities | 2,102 | | | 1,760 | | | |
| Proceeds from maturities of and principal payments on available-for-sale securities | 368 | | | 361 | | | |
| Purchases of held-to-maturity securities | (4,367) | | | (3,084) | | | |
| Proceeds from maturities of and principal payments on held-to-maturity securities | 1,235 | | | 1,034 | | | |
| | | | | |
| Decrease in loans receivable | 65 | | | 145 | | | |
| Capital expenditures for property and equipment | (34) | | | (38) | | | |
| Net decrease in securities purchased under agreements to resell | 200 | | | — | | | |
| Proceeds from sale of real estate owned and repossessed assets | 3 | | | 4 | | | |
| | | | | |
| Net cash flow from derivative contracts | (89) | | | (29) | | | |
| Other | (1) | | | (18) | | | |
| Net cash used in investing activities | (3,997) | | | (3,454) | | | |
| | | | | |
E*TRADE Q1 2020 10-Q | Page 48
| | | | | | | | | | | | | |
| Three Months Ended March 31, | | | | |
| | 2020 | | 2019 | | |
| Cash flows from financing activities: | | | | | |
| Increase in deposits | $ | 3,540 | | | $ | 1,015 | | | |
| Common stock dividends | (31) | | | (35) | | | |
| Preferred stock dividends | (20) | | | (20) | | | |
| | | | | |
| Net increase in advances from FHLB | — | | | 300 | | | |
| | | | | |
| | | | | |
| | | | | |
| | | | | |
| Repurchases of common stock | (95) | | | (120) | | | |
| Other | (12) | | | (15) | | | |
| Net cash provided by financing activities | 3,382 | | | 1,125 | | | |
| Increase (decrease) in cash, cash equivalents and segregated cash | 4,206 | | | (2,144) | | | |
| Cash, cash equivalents and segregated cash, beginning of period | 2,629 | | | 3,344 | | | |
| Cash, cash equivalents and segregated cash, end of period | $ | 6,835 | | | $ | 1,200 | | | |
| | | | | |
| Cash and equivalents, end of period | $ | 1,105 | | | $ | 523 | | | |
| Segregated cash, end of period | 5,730 | | | 677 | | | |
| Cash, cash equivalents and segregated cash, end of period | $ | 6,835 | | | $ | 1,200 | | | |
| | | | | |
| Supplemental disclosures: | | | | | |
| Cash paid for interest | $ | 46 | | | $ | 65 | | | |
| (Refund received) cash paid for income taxes, net | $ | (22) | | | $ | 3 | | | |
| Right-of-use assets recognized upon adoption of new lease standard | $ | — | | | $ | 193 | | | |
| Right-of-use assets obtained during the period | $ | 4 | | | $ | 13 | | | |
| Cash paid for amounts included in the measurement of lease liabilities | $ | 9 | | | $ | 7 | | | |
| Non-cash investing and financing activities: | | | | | |
| | | | | |
| Transfers from loans to other real estate owned and repossessed assets | $ | 4 | | | $ | 4 | | | |
| | | | | |
| | | | | |
| | | | | |
See accompanying notes to the condensed consolidated financial statements (unaudited)
E*TRADE Q1 2020 10-Q | Page 49
E*TRADE FINANCIAL CORPORATION
NOTES TO THE CONDENSED CONSOLIDATED FINANCIAL STATEMENTS (UNAUDITED)
| | |
| NOTE 1—ORGANIZATION, BASIS OF PRESENTATION AND SUMMARY OF SIGNIFICANT ACCOUNTING POLICIES |
Organization
E*TRADE Financial Corporation is a financial services company that provides brokerage and related products and services for traders, investors, stock plan administrators and participants, and RIAs. The Company also provides investor-focused banking products, including sweep deposit accounts insured by the FDIC, to customers. The Company's most significant, wholly-owned subsidiaries are described below:
•E*TRADE Securities is a registered broker-dealer that clears and settles customer transactions
•E*TRADE Bank is a federally chartered savings bank that provides FDIC insurance on certain qualifying amounts of customer deposits and provides other banking and cash management capabilities
•E*TRADE Savings Bank, a subsidiary of E*TRADE Bank, is a federally chartered savings bank that provides FDIC insurance on certain qualifying amounts of customer deposits and provides custody solutions for RIAs
•E*TRADE Financial Corporate Services is a provider of software and services for managing equity compensation plans and student loan and financial wellness benefits to our corporate clients
•E*TRADE Futures is a registered non-clearing FCM that provides retail futures transaction capabilities for our customers
•E*TRADE Capital Management is an RIA that provides investment advisory services for our customers
Basis of Presentation
The condensed consolidated financial statements, also referred to herein as the consolidated financial statements include the accounts of the Company and its majority-owned subsidiaries as determined under the voting interest model. Entities in which the Company has the ability to exercise significant influence but in which the Company does not possess control are generally accounted for by the equity method. Entities in which the Company does not have the ability to exercise significant influence are generally carried at cost. The Company also evaluates its initial and continuing involvement with certain entities to determine if the Company is required to consolidate the entities under the variable interest entity (VIE) model. This evaluation is based on a qualitative assessment of whether the Company is the primary beneficiary of a VIE, which requires the Company to possess both: 1) the power to direct the activities that most significantly impact the economic performance of the VIE; and 2) the obligation to absorb losses or the right to receive benefits of the VIE that could potentially be significant to the VIE. There are no investments in which the Company represents the primary beneficiary of a VIE; therefore, there are no consolidated VIEs included for all periods presented.
The Company's consolidated financial statements are prepared in accordance with GAAP. Intercompany accounts and transactions are eliminated in consolidation. These consolidated financial statements reflect all adjustments, which are normal and recurring in nature, necessary to present fairly the financial position, results of operations and cash flows for the periods presented and should be read in conjunction with our Annual Report on Form 10-K for the year ended December 31, 2019.
E*TRADE Q1 2020 10-Q | Page 50
E*TRADE FINANCIAL CORPORATION
NOTES TO THE CONDENSED CONSOLIDATED FINANCIAL STATEMENTS (UNAUDITED)
Use of Estimates
Preparing the Company's consolidated financial statements in accordance with GAAP requires management to make estimates and assumptions that affect the amounts reported in the consolidated financial statements and related notes for the periods presented. Actual results could differ from management’s estimates. Certain significant accounting policies are critical because they are based on estimates and assumptions that require complex and subjective judgments by management including the allowance for credit losses, valuation and impairment of goodwill and acquired intangible assets, and income taxes. Management also makes estimates in recognizing accrued operating expenses and other liabilities. These liabilities are impacted by estimates for litigation and regulatory matters as well as estimates related to general operating expenses, such as incentive compensation. Management estimates reflect the liabilities deemed probable at the balance sheet date as determined as part of the Company's ongoing evaluations based on available information.
The Company evaluated its goodwill and finite lived intangible assets for impairment as a result of the decline in its share price related to actions taken by the Federal Reserve to contain the financial and economic impact of the COVID-19 pandemic. This analysis included a quantitative impairment test for its goodwill and a review of the recoverability of its finite lived intangible assets. No impairment of goodwill or finite lived intangible assets was indicated at March 31, 2020 as a result of this analysis.
Adoption of New Accounting Standards
Accounting for Credit Losses
In June 2016, the FASB amended the guidance on accounting for credit losses and subsequently issued clarifications and improvements. The amended guidance requires measurement of an allowance for credit losses for financial instruments, including loans and debt securities, and other commitments to extend credit held at the reporting date. For financial assets measured at amortized cost, factors such as historical performance, prepayment expectations, current conditions, and reasonable and supportable forecasts, including expected recoveries, are used to estimate expected credit losses over the contractual life of the underlying assets. The amended guidance also requires credit losses on impaired available-for-sale debt securities to be recorded through an allowance for credit losses.
The CECL standard allows for subsequent increases in the fair value of collateral for collateral-dependent loans to be recognized up to the amount previously charged-off. A loan is considered to be collateral-dependent when foreclosure is probable or when repayment is expected to be provided substantially through the sale of the underlying collateral when the borrower is experiencing financial difficulty.
The Company adopted the new standard on its effective date of January 1, 2020 using a modified retrospective approach and recognized an after-tax benefit related to mortgage loans of $84 million as an adjustment to opening retained earnings. The benefit primarily related to appreciation of fair value of the underlying collateral for mortgage loans that had been determined to be collateral-dependent and charged-off to the fair value of the underlying collateral in prior periods. This adoption impact is presented on the balance sheet as a “negative allowance” associated with the mortgage loans. Current expected credit losses on the Company’s investment security portfolio, margin receivables, securities-based lending and other financial assets held at amortized cost were not material. Adoption of the standard did not have an impact on the Company’s cash flows. See Note 7—Loans Receivable and Allowance for Credit Losses for further details.
E*TRADE Q1 2020 10-Q | Page 51
E*TRADE FINANCIAL CORPORATION
NOTES TO THE CONDENSED CONSOLIDATED FINANCIAL STATEMENTS (UNAUDITED)
In March 2020, the World Health Organization declared the outbreak of COVID-19 a pandemic. The pandemic, and actions taken by governmental authorities to contain its financial and economic impact, resulted in significant market volatility during March 2020. The Company's allowance for credit losses on its mortgage loan portfolio as of March 31, 2020 includes the estimated financial impacts of the pandemic on its expected credit losses and resulted in an increase to the allowance for credit losses of $5 million as compared to January 1, 2020. See Note 7—Loans Receivable and Allowance for Credit Losses for further details.
The Company's estimate of expected credit losses and related allowance for credit losses for its margin receivables, trade receivables, securities-based lending, securities lending, and agency debt securities were not directly impacted by the pandemic. The Company's analysis of its non-agency portfolio continued to indicate no expectation of credit losses as a result of credit enhancements associated with the investments, including the value of underlying collateral and the ability of subordinated interests to absorb estimated losses. As a result, no allowance for credit losses was recorded related to these portfolios as of March 31, 2020. Management will continue to evaluate conditions related to this and other significant events and their impacts on the factors used to estimate expected credit losses.
Loans Receivable, Net
Loans receivable, net consists of mortgage and securities-based lending loans that management has the intent and ability to hold for the foreseeable future or until maturity, also known as loans held-for-investment. The related allowance for credit losses is determined in accordance with the amended CECL guidance.
Mortgage Loans
Mortgage loans consist of the Company’s one- to- four-family and home equity loans. Current expected credit losses for mortgage loans that share similar risk characteristics, including loans that are performing in accordance with their contractual terms, are determined on a collective basis. Current expected credit losses for mortgage loans that do not share similar risk characteristics, including loans modified as troubled debt restructurings (TDRs) and loans that are collateral-dependent, are determined individually based on the characteristics of each loan. The Company’s accounting policies and practices for evaluating the risk characteristics of its mortgage loan portfolio were not impacted by the adoption of the new guidance.
The Company’s accounting policies and practices for determining that a loan should be placed on nonaccrual status or that a loan has become delinquent or uncollectible, including the policies for discontinuing accrual of interest, recording payments received, and resuming accrual of interest were not impacted by the adoption of the new guidance. See Note 1—Organization, Basis of Presentation and Summary of Significant Accounting Policies in Part II. Item 8. Financial Statements and Supplementary Data of our Annual Report on Form 10-K for the year ended December 31, 2019 for a description of these policies. The Company uses a probability of default and loss given default model for determining the allowance for credit losses for its mortgage loans that are evaluated collectively. A probability of default and loss given default model utilizes prepayment forecasts, loan amortization calculations, and other internally derived and externally sourced data and assumptions to determine the likelihood that the Company’s mortgage loans will experience a default and determine the expected loss given default. The Company also utilizes an externally provided macroeconomic forecast over the remaining life of the loans. The model parameters are adjusted to reflect past events, including general default data for loans with similar vintages and the Company's historical experience with borrower defaults, prepayments, losses, and charge-offs over the past 12 months.
E*TRADE Q1 2020 10-Q | Page 52
E*TRADE FINANCIAL CORPORATION
NOTES TO THE CONDENSED CONSOLIDATED FINANCIAL STATEMENTS (UNAUDITED)
The Company utilizes a qualitative factor framework whereby, on a quarterly basis, the risk associated with the following three primary sets of factors are evaluated: external factors, internal factors, and portfolio specific factors. The uncertainty related to these factors may expand over time, temporarily impacting the qualitative component in advance of the more precise identification of these expected credit losses within the modeled credit losses. Management’s estimate of expected credit losses includes qualitative adjustments for model weaknesses, macroeconomic forecast uncertainty, and recoveries. The Company’s forecast includes a forward-looking view of macroeconomic factors over the next two to five years, after which the macroeconomic factors revert to externally provided long-term equilibrium values, rates, or patterns that do not include specific predictions for the economy. Key inputs for the forecast include US home prices and unemployment data.
Loan modifications accounted for as TDRs that are not collateral-dependent are considered to be cash-flow dependent as the Company expects repayment to come from the loan principal and interest. The Company uses a discounted cash flow method to discount expected cash flows for these loans using the loan’s effective interest rate immediately prior to modification, which is consistent with the policy used for estimating the impact at adoption. Assumptions utilized in the discounted cash flow model are based on pools of loans that had modifications completed under the Company's loss mitigation program in which an economic concession was granted to the borrower experiencing financial difficulties. The Company does not adjust the effective interest rate for estimated prepayment assumptions. The allowance for credit losses reflects the difference between the amortized cost basis and the present value of the expected cash flows. Changes in the present value of expected cash flows are presented as credit loss expense or a reversal of credit loss expense.
A mortgage loan is considered collateral-dependent when repayment is expected to be provided substantially through sale of the collateral when the borrower is experiencing financial difficulty or where foreclosure is probable. The Company uses the fair value of the collateral at the reporting date when measuring the net carrying amount of the asset and determining the allowance for credit losses. The fair value of the collateral is adjusted for estimated costs to sell. When the fair value of the collateral less costs to sell at the reporting date exceeds the recorded investment in the loan, the Company adjusts the allowance for credit losses such that the net carrying value equals the fair value of the collateral, less costs to sell. Such instances will result in a “negative allowance,” or increase to the carrying value of the loan receivable; however, any such amount cannot exceed amounts previously charged-off.
If the fair value of the collateral less estimated costs to sell subsequently declines, the Company will adjust the carrying value of the mortgage loan by first reversing any negative allowance previously recorded. When applicable, the Company will further adjust the recorded investment of the mortgage loan by recording an incremental charge-off. Changes in the fair value of the collateral less costs to sell are recorded as a provision (benefit) for credit losses.
The Company does not measure an allowance for credit losses for accrued interest receivable on mortgage loans because the Company reverses accrued interest receivable on loans that have principal or interest that is 90 days or greater past due, TDRs that are placed on nonaccrual status for all classes of loans (including loans in bankruptcy), and certain junior liens that have a delinquent senior lien. The Company reverses accrued interest through interest income.
Securities-based Lending
Securities-based lending includes the E*TRADE Line of Credit product, which allows customers to borrow against the market value of their securities pledged as collateral, and securities lending, which includes deposits paid for securities borrowed that are recorded at the amount of cash collateral advanced. The
E*TRADE Q1 2020 10-Q | Page 53
E*TRADE FINANCIAL CORPORATION
NOTES TO THE CONDENSED CONSOLIDATED FINANCIAL STATEMENTS (UNAUDITED)
E*TRADE Line of Credit portfolio is included within the Loans receivable, net line item on the consolidated balance sheets. Deposits paid for securities borrowed are included within the Receivables from brokers, dealers, and clearing organizations line item while deposits paid for securities borrowed under the fully paid lending program are included in the Other assets line item on the consolidated balance sheets.
Securities-based lending is fully collateralized by cash and securities with fair values in excess of the amount borrowed. The borrowers are contractually required to continually adjust the amount of the collateral as a result of changes in its fair value such that the collateral can be replenished on a daily basis. The Company expects the borrowers will continually replenish the collateral and elected the practical expedient which permits it to compare the amortized cost basis of the loaned amount with the fair value of collateral received at the reporting date to estimate of expected credit losses. As a result of this election, and the fully collateralized nature of these arrangements, the Company has no expectation of credit losses on its securities-based lending loans. The Company fully reserves for unsecured securities-based lending and related accrued interest receivable when they become 90 days past due.
Margin Receivables
Margin receivables represent credit extended to customers to finance their purchases of securities by borrowing against securities they own and are fully collateralized by these securities in customer accounts. Similar to securities-based lending, the borrowers of a margin loan are contractually required to continually adjust the amount of the collateral as a result of changes in its fair value such that the collateral can be replenished on a daily basis. The Company expects the borrowers will continually replenish the collateral as necessary because the Company subjects the borrowers to an internal qualification process and an interview to align investing objectives and risk appetite in addition to monitoring customer activity. The Company elected the practical expedient which permits it to compare the amortized cost basis of the loaned amount with the fair value of collateral received at the reporting date to measure the estimate of expected credit losses.
The Company has no expectation of credit losses for margin loans where the fair value of the collateral securing the loans is equal to or in excess of the loaned amount. In cases where the fair value of the collateral is less than the amortized cost basis of the loan, for example, in times of severe or prolonged market volatility, the Company recognizes an allowance for credit losses in the amount of the difference, or unsecured balance. The Company fully reserves for unsecured margin balances and related accrued interest receivable when they become 90 days past due. The allowance for credit losses on margin receivables and the related accrued interest was not material and is presented within the Other assets line of the consolidated balance sheets, and provision for credit losses is presented within the Other non-interest expenses line of the consolidated statements of income.
Debt Securities
The Company’s available-for-sale securities are composed primarily of agency mortgage-backed and agency debt securities, and also include non-agency asset-backed and mortgage-backed securities. The Company’s held-to-maturity securities consist of debt securities, primarily agency mortgage-backed securities and agency debt securities. The Company monitors the credit quality of the agencies and has no expectation of credit losses on investment securities, or the related accrued interest receivable, that are backed by the US government or its agencies because of the credit profiles of those entities and our historical loss experience for such investments. Accrued interest receivable on debt securities is excluded from both the fair value and the amortized cost basis for purposes of identifying and measuring an impairment. All accrued and uncollected interest is reversed against interest income when it is considered uncollectible. As of March 31, 2020, accrued interest receivable for available-for-sale and held-to-maturity
E*TRADE Q1 2020 10-Q | Page 54
E*TRADE FINANCIAL CORPORATION
NOTES TO THE CONDENSED CONSOLIDATED FINANCIAL STATEMENTS (UNAUDITED)
securities was $51 million and $67 million, respectively, and is included within the Other assets line of the consolidated balance sheets.
The Company's non-agency asset-backed and mortgage-backed securities include senior classes of commercial mortgage-backed securities and ABS collateralized by credit card, automobile loan and student loan receivables. The Company applies a variety of stress case scenarios based on forecasts to determine expected credit losses in the non-agency portfolio. If an expected credit loss is identified, the Company uses a discounted cash flow method to determine the allowance for credit losses. The discounted cash flow method utilizes the effective interest rate implicit at the acquisition date and contractual cash flows adjusted for expected prepayments and default assumptions. If a security is impaired and the present value of expected cash flows is less than the amortized cost basis of the security, then an allowance for credit loss is recognized, limited to the difference between the fair value and amortized cost of the security. If the Company intends to sell the security, or it is more likely than not that the Company will be required to sell the security before the recovery of the security’s amortized cost basis, the Company writes down the security’s amortized cost basis to its fair value. There were no expected credit losses on the Company's non-agency available-for-sale securities or related accrued interest receivable as of March 31, 2020. See Note 6—Available-for-Sale and Held-to-Maturity Securities for further details.
Receivables from Brokers, Dealers, and Other Clearing Organizations
The Receivables from brokers, dealers, and clearing organizations line item includes deposits paid for securities borrowed as well as receivables from clearing organizations and other brokerage receivables which are in scope of the amended guidance. The Company continually reviews the credit quality of its counterparties and has not experienced a default. As a result, the Company has zero expectation of credit losses for these arrangements.
Codification Improvements Related to Credit Losses, Financial Instruments, Derivatives and Hedging
In April 2019, the FASB clarified recently released guidance related to credit losses, financial instruments, derivatives and hedging. The FASB has an ongoing project on its agenda for improving the FASB's Accounting Standards Codification or correcting its unintended application. The Company adopted all new guidance related to credit losses on January 1, 2020 using a modified retrospective approach. The new guidance related to financial instruments was applied on January 1, 2020; however, there was no impact to the Company. The Company applied the new guidance related to derivatives and hedging on a prospective basis effective January 1, 2020 and enhanced its derivatives disclosures accordingly. See Note 8—Derivative Instruments and Hedging Activities for further details.
Simplifying the Test for Goodwill Impairment
In January 2017, the FASB amended the guidance to simplify the test for goodwill impairment by eliminating Step 2 from the goodwill impairment test. The amended guidance requires the Company to perform its annual goodwill impairment test by comparing the fair value of a reporting unit to its carrying amount. An impairment charge would be recognized at the amount by which the carrying amount exceeds the fair value of the reporting unit; however, the loss recognized should not exceed the total amount of goodwill allocated to that reporting unit. Income tax effects resulting from any tax deductible goodwill should be considered when measuring the goodwill impairment loss, if applicable. The Company has the option to perform a qualitative assessment to conclude whether it is more likely than not that the carrying amount of the Company exceeds its fair value. The Company adopted the new standard on its effective date of January 1, 2020 and applied the standard prospectively.
E*TRADE Q1 2020 10-Q | Page 55
E*TRADE FINANCIAL CORPORATION
NOTES TO THE CONDENSED CONSOLIDATED FINANCIAL STATEMENTS (UNAUDITED)
Implementation Costs Incurred in a Cloud Computing Arrangement that is a Service Contract
In August 2018, the FASB amended the guidance on accounting for implementation costs incurred in a cloud computing arrangement that is a service contract. The amended guidance aligns the requirements for capitalizing implementation costs incurred in a hosting arrangement that is a service contract with the requirements for capitalizing implementation costs incurred to develop or obtain internal-use software. The Company adopted the new standard on its effective date of January 1, 2020 and applied the standard prospectively. Implementation costs incurred on and after January 1, 2020 in a cloud computing arrangement that is a service contract are capitalized or expensed in accordance with the accounting guidance, and capitalized costs are amortized over the term of the hosting arrangement.
New Accounting Standards Not Yet Adopted
Simplifying the Accounting for Income Taxes
In December 2019, the FASB amended the guidance to simplify the accounting for income taxes as part of its initiative to reduce complexity in accounting standards. The amendments remove certain exceptions to the general income tax accounting principles and provide for consistent application of and simplify GAAP for other areas by clarifying and amending existing guidance. The guidance will be effective for interim and annual periods beginning January 1, 2021 and each amendment will be applied on either a retrospective basis, modified retrospective basis, or prospective basis as required in accordance with the new standard. The Company is currently evaluating the impact of these clarifications on the Company's financial condition, results of operations and cash flows.
Clarifying the Interactions Between Accounting for Investments in Equity Securities, Investments in Equity Method and Joint Ventures, and Derivatives and Hedging
In January 2020, the FASB amended the guidance to clarify the interaction of the accounting for equity securities and investments accounted for under the equity method of accounting and the accounting for certain forward contracts and purchased options. The amended guidance clarifies that an entity should consider observable transactions that require it to either apply or discontinue the equity method of accounting for the purposes of applying the measurement alternative immediately before applying or upon discontinuing the equity method. The amended guidance also clarifies how a forward contract or purchased option to purchase securities that, upon settlement of the forward contract or exercise of the purchased option, would be accounted for under the equity method of accounting or the fair value option. The guidance will be effective for interim and annual periods beginning January 1, 2021, and must be applied prospectively. Early adoption is permitted. The Company is currently evaluating the impact of these clarifications on the Company's financial condition, results of operations and cash flows.
E*TRADE Q1 2020 10-Q | Page 56
E*TRADE FINANCIAL CORPORATION
NOTES TO THE CONDENSED CONSOLIDATED FINANCIAL STATEMENTS (UNAUDITED)
Facilitation of the Effects of Reference Rate Reform on Financial Reporting
In March 2020, the FASB amended the guidance to provide optional expedients and exceptions for applying GAAP to contracts, hedging relationships, and other transactions affected by reference rate reform if certain criteria are met. The amendments apply only to contracts, hedging relationships, and other transactions that reference LIBOR or another reference rate expected to be discontinued because of reference rate reform. The guidance is effective for hedges in place as of March 12, 2020 through December 31, 2022. The Company is currently evaluating the timing of adoption and the impact of these amendments, which when adopted, could have a material impact on the Company's financial condition and results of operations. For example, any changes in the designated benchmark rate affecting the cumulative fair value hedge basis adjustment as a result of an anticipated discontinuance of LIBOR would be recognized in current earnings in the period of adoption.
| | |
| NOTE 2—ACQUISITIONS AND RESTRUCTURING |
Proposed Merger with Morgan Stanley
On February 20, 2020, the Company entered into the Merger Agreement with Morgan Stanley under which Morgan Stanley will acquire the Company in an all-stock transaction. Under the terms of the agreement, E*TRADE common stockholders will receive 1.0432 Morgan Stanley common shares for each E*TRADE common share. The acquisition is subject to customary closing conditions, including regulatory approvals and approval by the Company's shareholders.
During the three months ended March 31, 2020, the Company incurred $16 million of restructuring and acquisition-related activities expenses in connection with the proposed merger. These costs related primarily to investment banking and legal fees. There were no restructuring and acquisition-related activities expenses during the three months ended March 31, 2019.
Gradifi Acquisition
On December 9, 2019, the Company completed its acquisition of Gradifi, a student loan and financial wellness provider, for a purchase price of $30 million. The Company recorded goodwill of $25 million, which includes synergies expected to result from combining operations with Gradifi to enhance the Company's existing product offerings. The Company also recorded technology intangible assets of $3 million, which are subject to amortization over an estimated useful life of 6 years. During the three months ended March 31, 2020, the Company recorded purchase accounting adjustments which resulted in a net increase in technology intangible assets of $1 million and a corresponding decrease of $1 million to the recorded goodwill.
E*TRADE Q1 2020 10-Q | Page 57
E*TRADE FINANCIAL CORPORATION
NOTES TO THE CONDENSED CONSOLIDATED FINANCIAL STATEMENTS (UNAUDITED)
The following table presents the significant components of total net revenue (dollars in millions):
| | | | | | | | | | | | | | | | | |
| | | | | | Three Months Ended March 31, | | | | |
| | | | | | 2020 | | 2019 | | |
| Net interest income | | | | | $ | 400 | | | $ | 492 | | | |
| Commissions | | | | | 71 | | | 122 | | | |
| Fees and service charges | | | | | 203 | | | 118 | | | |
| Gains on securities and other, net | | | | | 20 | | | 11 | | | |
| Other revenue | | | | | 13 | | | 12 | | | |
Total net revenue (1) | | | | | $ | 707 | | | $ | 755 | | | |
(1)Contract balances and transaction price allocated to remaining performance obligations were not material for the periods presented.
Effective October 7, 2019, the Company eliminated retail commissions for online US listed stock, ETF, and options trades. We also reduced the options contract charge to $0.65 per contract for all traders while maintaining our active trader pricing at $0.50 per contract.
E*TRADE Q1 2020 10-Q | Page 58
E*TRADE FINANCIAL CORPORATION
NOTES TO THE CONDENSED CONSOLIDATED FINANCIAL STATEMENTS (UNAUDITED)
Interest Income and Interest Expense
The following table presents the significant components of interest income and interest expense (dollars in millions):
| | | | | | | | | | | | | | | | | |
| | | | | Three Months Ended March 31, | | | | |
| | | | | | 2020 | | 2019 | | |
| Interest income: | | | | | | | | | |
| Cash and equivalents | | | | | $ | 2 | | | $ | 3 | | | |
| Cash segregated under federal or other regulations | | | | | 8 | | | 6 | | | |
| Investment securities | | | | | 285 | | | 365 | | | |
| Margin receivables | | | | | 94 | | | 126 | | | |
| Loans | | | | | 21 | | | 28 | | | |
| Broker-related receivables and other | | | | | 4 | | | 4 | | | |
| Subtotal interest income | | | | | 414 | | | 532 | | | |
Other interest revenue(1) | | | | | 29 | | | 23 | | | |
| Total interest income | | | | | 443 | | | 555 | | | |
| Interest expense: | | | | | | | | | |
| Sweep deposits: | | | | | | | | | |
| Brokerage sweep deposits | | | | | 5 | | | 20 | | | |
Bank sweep deposits(2) | | | | | 13 | | | — | | | |
| Savings deposits | | | | | 3 | | | 15 | | | |
| Customer payables | | | | | 4 | | | 9 | | | |
| Broker-related payables and other | | | | | — | | | 1 | | | |
| Other borrowings | | | | | 1 | | | 2 | | | |
| Corporate debt | | | | | 14 | | | 14 | | | |
| Subtotal interest expense | | | | | 40 | | | 61 | | | |
Other interest expense(3) | | | | | 3 | | | 2 | | | |
| Total interest expense | | | | | 43 | | | 63 | | | |
| Net interest income | | | | | $ | 400 | | | $ | 492 | | | |
(1)Other interest revenue is earned on certain securities loaned balances. Interest expense incurred on other securities loaned balances is presented on the broker-related payables and other line item above.
(2)Beginning in Q4 2019, bank sweep deposits include Premium Savings Accounts participating in the newly established bank sweep deposit account program. Refer to Note 9—Deposits for additional information.
(3)Other interest expense is incurred on certain securities borrowed balances. Interest income earned on other securities borrowed balances is presented on the broker-related receivables and other line item above.
E*TRADE Q1 2020 10-Q | Page 59
E*TRADE FINANCIAL CORPORATION
NOTES TO THE CONDENSED CONSOLIDATED FINANCIAL STATEMENTS (UNAUDITED)
Fees and Service Charges
The following table presents the significant components of fees and service charges (dollars in millions):
| | | | | | | | | | | | | | | | | |
| | | | | | Three Months Ended March 31, | | | | |
| | | | | | 2020 | | 2019 | | |
| Fees and service charges: | | | | | | | | | |
| Order flow revenue | | | | | $ | 85 | | | $ | 43 | | | |
| Money market funds and sweep deposits revenue | | | | | 60 | | | 21 | | | |
| Advisor management and custody fees | | | | | 19 | | | 18 | | | |
| Mutual fund service fees | | | | | 13 | | | 12 | | | |
| Foreign exchange revenue | | | | | 9 | | | 8 | | | |
| Reorganization fees | | | | | 4 | | | 6 | | | |
| Other fees and service charges | | | | | 13 | | | 10 | | | |
| Total fees and service charges | | | | | $ | 203 | | | $ | 118 | | | |
| | |
| NOTE 4—FAIR VALUE DISCLOSURES |
Fair value is defined as the price that would be received to sell an asset or paid to transfer a liability in an orderly transaction between market participants at the measurement date. In determining fair value, the Company may use various valuation approaches, including market, income and/or cost approaches. The fair value hierarchy requires the Company to maximize the use of observable inputs and minimize the use of unobservable inputs when measuring fair value. Fair value is a market-based measure considered from the perspective of a market participant. Accordingly, even when market assumptions are not readily available, the Company’s own assumptions reflect those that market participants would use in pricing the asset or liability at the measurement date. The fair value measurement accounting guidance describes the following three levels used to classify fair value measurements:
•Level 1 - unadjusted quoted prices in active markets for identical assets or liabilities that are accessible by the Company
•Level 2 - quoted prices for similar assets and liabilities in an active market, quoted prices in markets that are not active or for which all significant inputs are observable, either directly or indirectly
•Level 3 - unobservable inputs that are significant to the fair value of the assets or liabilities
The availability of observable inputs can vary and in certain cases, the inputs used to measure fair value may fall into different levels of the fair value hierarchy. In such cases, the level within the fair value hierarchy is based on the lowest level of input that is significant to the fair value measurement. The Company’s assessment of the significance of a particular input to a fair value measurement requires judgment and consideration of factors specific to the asset or liability.
E*TRADE Q1 2020 10-Q | Page 60
E*TRADE FINANCIAL CORPORATION
NOTES TO THE CONDENSED CONSOLIDATED FINANCIAL STATEMENTS (UNAUDITED)
Recurring Fair Value Measurement Techniques
Agency Debt and Mortgage-backed Securities
The Company’s agency mortgage-backed securities portfolio is comprised of debt securities which are guaranteed by US government sponsored enterprises and federal agencies. The fair value of agency mortgage-backed securities was determined using a market approach with quoted market prices, recent transactions and spread data for identical or similar instruments. Agency mortgage-backed securities were categorized in Level 2 of the fair value hierarchy.
The fair value measurements of agency debentures and other agency debt securities were determined using market and income approaches along with the Company’s own trading activities for identical or similar instruments and were categorized in Level 2 of the fair value hierarchy.
US Treasuries
The Company's fair value level classification of US Treasuries is based on the original maturity dates of the securities and whether the securities are the most recent issuances of a given maturity. US Treasuries with original maturities less than one year are classified as Level 1. US Treasuries with original maturities greater than one year are classified as Level 1 if they represent the most recent issuance of a given maturity; otherwise, these securities are classified as Level 2.
Non-agency Debt Securities
The Company's non-agency debt securities include senior classes of commercial mortgage-backed securities and ABS collateralized by credit card, automobile loan and student loan receivables. The fair value of non-agency debt securities was determined using a market approach with recent transactions and spread data for identical or similar instruments. Non-agency debt securities were categorized in Level 2 of the fair value hierarchy.
Nonrecurring Fair Value Measurement Techniques
Certain other assets are recorded at fair value on a nonrecurring basis: 1) one- to four-family and home equity loans in which the amount of the loan balance in excess of the estimated current value of the underlying property less estimated selling costs has been charged-off; and 2) real estate owned that is carried at the lower of the property’s carrying value or fair value less estimated selling costs.
Loans Receivable
Loans that have been delinquent for 180 days or that are in bankruptcy and certain TDR loan modifications are charged-off based on the estimated current value of the underlying property less estimated selling costs. Property valuations for these one- to four-family and home equity loans are based on the most recent "as is" property valuation data available, which may include appraisals, broker price opinions, automated valuation models or updated values using home price indices.
E*TRADE Q1 2020 10-Q | Page 61
E*TRADE FINANCIAL CORPORATION
NOTES TO THE CONDENSED CONSOLIDATED FINANCIAL STATEMENTS (UNAUDITED)
Real Estate Owned
Property valuations for real estate owned are based on the lowest value of the most recent property valuation data available, which may include appraisals, listing prices or approved offer prices. Nonrecurring fair value measurements on one- to four-family loans, home equity loans and real estate owned were classified as Level 3 of the fair value hierarchy as the valuations included unobservable inputs that were significant to the fair value. The following table presents additional information about significant unobservable inputs used in the valuation of assets measured at fair value on a nonrecurring basis that were categorized in Level 3 of the fair value hierarchy:
| | | | | | | | | | | | | | | | | |
| Unobservable Inputs | | Average | | Range |
| March 31, 2020: | | | | | |
| Loans receivable: | | | | | |
| One- to four-family | Appraised value | | $ | 402,200 | | | $69,000 - $796,000 |
| Home equity | Appraised value | | $ | 295,900 | | | $70,000 - $756,000 |
| Real estate owned | Appraised value | | $ | 407,000 | | | $100,000 - $979,000 |
| | | | | |
| December 31, 2019: | | | | | |
| Loans receivable: | | | | | |
| One- to four-family | Appraised value | | $ | 815,900 | | | $92,000 - $2,700,000 |
| Home equity | Appraised value | | $ | 437,300 | | | $75,000 - $1,440,000 |
| Real estate owned | Appraised value | | $ | 391,700 | | | $80,000 - $897,000 |
E*TRADE Q1 2020 10-Q | Page 62
E*TRADE FINANCIAL CORPORATION
NOTES TO THE CONDENSED CONSOLIDATED FINANCIAL STATEMENTS (UNAUDITED)
Recurring and Nonrecurring Fair Value Measurements
The following tables present the significant components of assets and liabilities measured at fair value (dollars in millions):
| | | | | | | | | | | | | | | | | | | | | | | |
| Level 1 | | Level 2 | | Level 3 | | Total
Fair Value |
| March 31, 2020: | | | | | | | |
| Recurring fair value measurements: | | | | | | | |
| Assets | | | | | | | |
| Available-for-sale securities: | | | | | | | |
| Agency mortgage-backed securities | $ | — | | | $ | 17,449 | | | $ | — | | | $ | 17,449 | |
| Agency debentures | — | | | 965 | | | — | | | 965 | |
| US Treasuries | — | | | 1,343 | | | — | | | 1,343 | |
| Non-agency asset-backed securities | — | | | 1,411 | | | — | | | 1,411 | |
| Non-agency mortgage-backed securities | — | | | 272 | | | — | | | 272 | |
| | | | | | | |
| Total available-for-sale securities | — | | | 21,440 | | | — | | | 21,440 | |
Total assets measured at fair value on a recurring basis(1) | $ | — | | | $ | 21,440 | | | $ | — | | | $ | 21,440 | |
| Nonrecurring fair value measurements: | | | | | | | |
| Loans receivable, net: | | | | | | | |
| One- to four-family | $ | — | | | $ | — | | | $ | 3 | | | $ | 3 | |
| Home equity | — | | | — | | | 2 | | | 2 | |
| Total loans receivable | — | | | — | | | 5 | | | 5 | |
| Other assets: | | | | | | | |
| Real estate owned | — | | | — | | | 8 | | | 8 | |
Total assets measured at fair value on a nonrecurring basis(2) | $ | — | | | $ | — | | | $ | 13 | | | $ | 13 | |
(1)Assets measured at fair value on a recurring basis represented 32% of the Company’s total assets at March 31, 2020.
(2)Represents the fair value of assets prior to deducting estimated selling costs that were carried on the consolidated balance sheets at March 31, 2020, and for which a fair value measurement was recorded during the period.
E*TRADE Q1 2020 10-Q | Page 63
E*TRADE FINANCIAL CORPORATION
NOTES TO THE CONDENSED CONSOLIDATED FINANCIAL STATEMENTS (UNAUDITED)
| | | | | | | | | | | | | | | | | | | | | | | |
| Level 1 | | Level 2 | | Level 3 | | Total
Fair Value |
| December 31, 2019: | | | | | | | |
| Recurring fair value measurements: | | | | | | | |
| Assets | | | | | | | |
| Available-for-sale securities: | | | | | | | |
| Agency mortgage-backed securities | $ | — | | | $ | 17,035 | | | $ | — | | | $ | 17,035 | |
| Agency debentures | — | | | 659 | | | — | | | 659 | |
| US Treasuries | — | | | 1,227 | | | — | | | 1,227 | |
Non-agency asset-backed securities
| — | | | 417 | | | — | | | 417 | |
Non-agency mortgage-backed securities
| — | | | 163 | | | — | | | 163 | |
| Total available-for-sale securities | — | | | 19,501 | | | — | | | 19,501 | |
| | | | | | | |
Total assets measured at fair value on a recurring basis(1) | $ | — | | | $ | 19,501 | | | $ | — | | | $ | 19,501 | |
| Nonrecurring fair value measurements: | | | | | | | |
| Loans receivable, net: | | | | | | | |
| One- to four-family | $ | — | | | $ | — | | | $ | 14 | | | $ | 14 | |
| Home equity | — | | | — | | | 4 | | | 4 | |
| Total loans receivable | — | | | — | | | 18 | | | 18 | |
| Other assets: | | | | | | | |
| Real estate owned | — | | | — | | | 12 | | | 12 | |
Total assets measured at fair value on a nonrecurring basis(2) | $ | — | | | $ | — | | | $ | 30 | | | $ | 30 | |
(1)Assets measured at fair value on a recurring basis represented 32% of the Company’s total assets at December 31, 2019.
(2)Represents the fair value of assets prior to deducting estimated selling costs that were carried on the consolidated balance sheets at December 31, 2019, and for which a fair value measurement was recorded during the period.
Gains and losses on assets measured at fair value on a nonrecurring basis were not material for the periods presented.
Recurring Fair Value Measurements Categorized within Level 3
For the periods presented, no assets or liabilities measured at fair value on a recurring basis were categorized within Level 3 of the fair value hierarchy. The Company had no transfers between levels during the periods presented.
E*TRADE Q1 2020 10-Q | Page 64
E*TRADE FINANCIAL CORPORATION
NOTES TO THE CONDENSED CONSOLIDATED FINANCIAL STATEMENTS (UNAUDITED)
Fair Value of Financial Instruments Not Carried at Fair Value
The following tables present the carrying values, fair values and fair value hierarchy level classification of financial instruments that are not carried at fair value on the consolidated balance sheets (dollars in millions):
| | | | | | | | | | | | | | | | | | | | | | | | | | | | | |
| | March 31, 2020 | | | | | | | | |
| | Carrying
Value | | Level 1 | | Level 2 | | Level 3 | | Total
Fair Value |
| Assets | | | | | | | | | |
| Cash and equivalents | $ | 1,105 | | | $ | 1,105 | | | $ | — | | | $ | — | | | $ | 1,105 | |
| Cash segregated under federal or other regulations | $ | 5,730 | | | $ | 5,730 | | | $ | — | | | $ | — | | | $ | 5,730 | |
| Held-to-maturity securities: | | | | | | | | | |
| Agency mortgage-backed securities | $ | 23,531 | | | $ | — | | | $ | 24,297 | | | $ | — | | | $ | 24,297 | |
| Agency debentures | 108 | | | — | | | 121 | | | — | | | 121 | |
| Other agency debt securities | 1,451 | | | — | | | 1,508 | | | — | | | 1,508 | |
| Total held-to-maturity securities | $ | 25,090 | | | $ | — | | | $ | 25,926 | | | $ | — | | | $ | 25,926 | |
Margin receivables(1) | $ | 7,251 | | | $ | — | | | $ | 7,251 | | | $ | — | | | $ | 7,251 | |
| Loans receivable, net: | | | | | | | | | |
| One- to four-family | $ | 794 | | | $ | — | | | $ | — | | | $ | 751 | | | $ | 751 | |
| Home equity | 645 | | | — | | | — | | | 599 | | | 599 | |
| | | | | | | | | |
| Securities-based lending | 195 | | | — | | | 195 | | | — | | | 195 | |
Total loans receivable, net(2) | $ | 1,634 | | | $ | — | | | $ | 195 | | | $ | 1,350 | | | $ | 1,545 | |
Receivables from brokers, dealers and clearing organizations(1) | $ | 1,124 | | | $ | — | | | $ | 1,124 | | | $ | — | | | $ | 1,124 | |
Other assets(1)(3) | $ | 97 | | | $ | — | | | $ | 97 | | | $ | — | | | $ | 97 | |
| Liabilities | | | | | | | | | |
| Deposits | $ | 42,146 | | | $ | — | | | $ | 42,146 | | | $ | — | | | $ | 42,146 | |
| Customer payables | $ | 15,960 | | | $ | — | | | $ | 15,960 | | | $ | — | | | $ | 15,960 | |
| Payables to brokers, dealers and clearing organizations | $ | 776 | | | $ | — | | | $ | 776 | | | $ | — | | | $ | 776 | |
| Corporate debt | $ | 1,411 | | | $ | — | | | $ | 1,400 | | | $ | — | | | $ | 1,400 | |
(1)The fair value of securities that the Company received as collateral in connection with margin receivables and securities borrowing activities, including the fully paid lending program, where the Company is permitted to sell or re-pledge the securities, was $10.1 billion at March 31, 2020. Of this amount, $3.0 billion had been pledged or sold in connection with securities loaned and deposits with clearing organizations at March 31, 2020.
(2)The carrying value of loans receivable, net includes the net "negative allowance" for credit losses of $86 million and loans that are recorded at fair value on a nonrecurring basis at March 31, 2020.
(3)Represents securities borrowing from customers under the fully paid lending program.
E*TRADE Q1 2020 10-Q | Page 65
E*TRADE FINANCIAL CORPORATION
NOTES TO THE CONDENSED CONSOLIDATED FINANCIAL STATEMENTS (UNAUDITED)
| | | | | | | | | | | | | | | | | | | | | | | | | | | | | |
| | December 31, 2019 | | | | | | | | |
| | Carrying
Value | | Level 1 | | Level 2 | | Level 3 | | Total
Fair Value |
| Assets | | | | | | | | | |
| Cash and equivalents | $ | 750 | | | $ | 750 | | | $ | — | | | $ | — | | | $ | 750 | |
| Cash segregated under federal or other regulations | $ | 1,879 | | | $ | 1,879 | | | $ | — | | | $ | — | | | $ | 1,879 | |
| Held-to-maturity securities: | | | | | | | | | |
| Agency mortgage-backed securities | $ | 20,085 | | | $ | — | | | $ | 20,329 | | | $ | — | | | $ | 20,329 | |
| Agency debentures | 267 | | | — | | | 271 | | | — | | | 271 | |
| Other agency debt securities | 1,617 | | | — | | | 1,646 | | | — | | | 1,646 | |
| Total held-to-maturity securities | $ | 21,969 | | | $ | — | | | $ | 22,246 | | | $ | — | | | $ | 22,246 | |
Margin receivables(1) | $ | 9,675 | | | $ | — | | | $ | 9,675 | | | $ | — | | | $ | 9,675 | |
| Loans receivable, net: | | | | | | | | | |
| One- to four-family | $ | 802 | | | $ | — | | | $ | — | | | $ | 835 | | | $ | 835 | |
| Home equity | 624 | | | — | | | — | | | 659 | | | 659 | |
| | | | | | | | | |
| Securities-based lending | 169 | | | — | | | 169 | | | — | | | 169 | |
Total loans receivable, net(2) | $ | 1,595 | | | $ | — | | | $ | 169 | | | $ | 1,494 | | | $ | 1,663 | |
Receivables from brokers, dealers and clearing organizations(1) | $ | 1,395 | | | $ | — | | | $ | 1,395 | | | $ | — | | | $ | 1,395 | |
Other assets(1)(3) | $ | 313 | | | $ | — | | | $ | 313 | | | $ | — | | | $ | 313 | |
| Liabilities | | | | | | | | | |
| Deposits | $ | 38,606 | | | $ | — | | | $ | 38,605 | | | $ | — | | | $ | 38,605 | |
| Customer payables | $ | 12,849 | | | $ | — | | | $ | 12,849 | | | $ | — | | | $ | 12,849 | |
| Payables to brokers, dealers and clearing organizations | $ | 893 | | | $ | — | | | $ | 893 | | | $ | — | | | $ | 893 | |
| Corporate debt | $ | 1,410 | | | $ | — | | | $ | 1,485 | | | $ | — | | | $ | 1,485 | |
(1)The fair value of securities that the Company received as collateral in connection with margin receivables and securities borrowing activities, including the fully paid lending program, where the Company is permitted to sell or re-pledge the securities, was $14.0 billion at December 31, 2019. Of this amount, $2.1 billion had been pledged or sold in connection with securities loaned and deposits with clearing organizations at December 31, 2019.
(2)The carrying value of loans receivable, net includes the allowance for loan losses of ($17) million and loans that are recorded at fair value on a nonrecurring basis at December 31, 2019.
(3)Includes $200 million of securities purchased under agreements to resell and $113 million of securities borrowing from customers under the fully paid lending program. The fair value of the securities that the Company received as collateral for securities purchased under agreements to resell was $206 million at December 31, 2019.
Fair Value of Commitments and Contingencies
In the normal course of business, the Company makes various commitments to extend credit and incur contingent liabilities that are not reflected in the consolidated balance sheets. Changes in the economy or interest rates may influence the impact that these commitments and contingencies have on the Company in the future. The Company does not estimate the fair value of those commitments. Information related to such commitments and contingent liabilities is included in Note 14—Commitments, Contingencies and Other Regulatory Matters.
E*TRADE Q1 2020 10-Q | Page 66
E*TRADE FINANCIAL CORPORATION
NOTES TO THE CONDENSED CONSOLIDATED FINANCIAL STATEMENTS (UNAUDITED)
| | |
| NOTE 5—OFFSETTING ASSETS AND LIABILITIES |
Securities Purchased Under Agreements to Resell
Securities purchased under agreements to resell are treated as collateralized financing transactions and are recorded at their contractual amounts plus accrued interest. For financial statement purposes, the Company does not offset securities purchased under agreements to resell transactions with securities sold under agreements to repurchase. The Company obtains securities as collateral from the counterparty with a market value in excess of the principal amount loaned. This activity could result in losses if the counterparty fails to repurchase the securities held as collateral for the cash advanced and the market value of the securities declines. The Company continuously monitors the collateral value and obtains additional collateral from the counterparty in an effort to ensure full collateralization.
Securities Lending Transactions
Securities borrowed and securities loaned transactions are recorded at the amount of cash collateral delivered to or received from the counterparty plus accrued interest. For financial statement purposes, the Company does not offset securities borrowing and securities lending transactions. These activities are generally transacted under master agreements that are widely used by counterparties and that may allow for net settlements of payments in the normal course, as well as offsetting of all contracts with a given counterparty in the event of bankruptcy or default of one of the two parties to the transaction.
The Company is required to deliver cash to the lender for securities borrowed whereas the Company receives collateral in the form of cash for securities loaned. These activities both require cash in an amount generally in excess of the market value of the securities and have overnight or continuous remaining contractual maturities. Securities lending transactions expose the Company to counterparty credit risk and market risk. To manage the counterparty risk, the Company maintains internal standards for approving counterparties, reviews and analyzes the credit rating of each counterparty, and monitors its positions with each counterparty on an ongoing basis. In addition, for certain of the Company's securities lending transactions, the Company uses a program with a clearing organization that guarantees the return of collateral. The Company monitors the market value of the securities borrowed and loaned using collateral arrangements that require additional collateral to be obtained from or excess collateral to be returned to the counterparties based on changes in market value, in an effort to maintain specified collateral levels.
E*TRADE Q1 2020 10-Q | Page 67
E*TRADE FINANCIAL CORPORATION
NOTES TO THE CONDENSED CONSOLIDATED FINANCIAL STATEMENTS (UNAUDITED)
The following table presents information about these transactions to enable the users of the Company’s consolidated financial statements to evaluate the potential effect of rights of set-off between these recognized assets and liabilities (dollars in millions):
| | | | | | | | | | | | | | | | | | | | | | | | | | | | | | | | | | | | | | |
| | | | | | | | | | Gross Amounts Not Offset in the Consolidated Balance Sheets | | | | |
| | | | Gross Amounts of Recognized Assets and Liabilities | | Gross Amounts Offset in the Consolidated Balance Sheets | | Net Amounts Presented in the Consolidated Balance Sheets(1) | | Financial Instruments | | Collateral Received or Pledged (Including Cash) | | Net Amount |
| | | March 31, 2020: | | | | | | | | | | | |
| | | Assets: | | | | | | | | | | | |
| | | | | | | | | | | | | | |
| | | Securities borrowed(2) | $ | 604 | | | $ | — | | | $ | 604 | | | $ | (68) | | | $ | (510) | | | $ | 26 | |
| | | | | | | | | | | | | | |
| | | Total | $ | 604 | | | $ | — | | | $ | 604 | | | $ | (68) | | | $ | (510) | | | $ | 26 | |
| | | | | | | | | | | | | | |
| | | | | | | | | | | | | | |
| | | Liabilities: | | | | | | | | | | | |
| | | Securities loaned(3) | $ | 696 | | | $ | — | | | $ | 696 | | | $ | (68) | | | $ | (535) | | | $ | 93 | |
| | | Total | $ | 696 | | | $ | — | | | $ | 696 | | | $ | (68) | | | $ | (535) | | | $ | 93 | |
| | | | | | | | | | | | | | |
| | | | | | | | | | | | | | |
| | | December 31, 2019: | | | | | | | | | | | |
| | | Assets: | | | | | | | | | | | |
| | | Securities purchased under agreements to resell(4) | $ | 200 | | | $ | — | | | $ | 200 | | | $ | — | | | $ | (200) | | | $ | — | |
| | | Securities borrowed(2) | 1,116 | | | — | | | 1,116 | | | (83) | | | (1,003) | | | 30 | |
| | | Total | $ | 1,316 | | | $ | — | | | $ | 1,316 | | | $ | (83) | | | $ | (1,203) | | | $ | 30 | |
| | | | | | | | | | | | | | |
| | | Liabilities: | | | | | | | | | | | |
| | | | | | | | | | | | | | |
| | | Securities loaned(3) | $ | 838 | | | $ | — | | | $ | 838 | | | $ | (83) | | | $ | (699) | | | $ | 56 | |
| | | Total | $ | 838 | | | $ | — | | | $ | 838 | | | $ | (83) | | | $ | (699) | | | $ | 56 | |
| | | | | | | | | | | | | | |
| | | | | | | | | | | | | | |
(1)The vast majority of the net amount of cash collateral paid for securities borrowed are reflected in the receivables from brokers, dealers and clearing organizations line item while the cash collateral paid for securities borrowed under the fully paid lending program are reflected in other assets. Cash collateral received for securities loaned are reflected in the payables to brokers, dealers and clearing organizations line item in the consolidated balance sheets.
(2)Included in the gross amounts of cash collateral paid for securities borrowed was $208 million and $757 million at March 31, 2020 and December 31, 2019, respectively, transacted through a program with a clearing organization, which guarantees the return of cash to the Company. For presentation purposes, these amounts presented are based on the counterparties under the Company’s master securities loan agreements.
(3)Included in the gross amounts of cash collateral received for securities loaned was $357 million and $401 million at March 31, 2020 and December 31, 2019, respectively, transacted through a program with a clearing organization, which guarantees the return of securities to the Company. For presentation purposes, these amounts presented are based on the counterparties under the Company’s master securities loan agreements.
(4)Securities purchased under agreements to resell were over-collateralized at December 31, 2019, as the market value of the securities received by the Company was $206 million, and were included in the other assets line item in the consolidated balance sheets.
E*TRADE Q1 2020 10-Q | Page 68
E*TRADE FINANCIAL CORPORATION
NOTES TO THE CONDENSED CONSOLIDATED FINANCIAL STATEMENTS (UNAUDITED)
Derivative Transactions
At March 31, 2020, all of the derivatives that the Company utilized in its hedging activities were subject to derivatives clearing agreements (centrally cleared derivatives contracts). These cleared derivatives contracts enable clearing by a derivatives clearing organization through a clearing member. Under the contracts, the clearing member typically has a one-way right to offset all contracts in the event of the Company's default or bankruptcy. Collateral exchanged under these contracts is not included in the preceding table as the contracts may not qualify as master netting agreements. For financial statement purposes, the Company does not offset derivatives assets and derivative liabilities. See Note 8—Derivative Instruments and Hedging Activities for additional information.
E*TRADE Q1 2020 10-Q | Page 69
E*TRADE FINANCIAL CORPORATION
NOTES TO THE CONDENSED CONSOLIDATED FINANCIAL STATEMENTS (UNAUDITED)
| | |
| NOTE 6—AVAILABLE-FOR-SALE AND HELD-TO-MATURITY SECURITIES |
The following table presents the amortized cost and fair value of available-for-sale and held-to-maturity securities (dollars in millions):
| | | | | | | | | | | | | | | | | | | | | | | |
| Amortized
Cost | | Gross
Unrealized /
Unrecognized
Gains | | Gross
Unrealized /
Unrecognized
Losses | | Fair Value |
| March 31, 2020: | | | | | | | |
| Available-for-sale securities: | | | | | | | |
| Agency mortgage-backed securities | $ | 16,130 | | | $ | 1,367 | | | $ | (48) | | | $ | 17,449 | |
| Agency debentures | 910 | | | 55 | | | — | | | 965 | |
| US Treasuries | 1,122 | | | 221 | | | — | | | 1,343 | |
Non-agency asset-backed securities(1) | 1,428 | | | 5 | | | (22) | | | 1,411 | |
| | | | | | | |
| Non-agency mortgage-backed securities | 273 | | | 3 | | | (4) | | | 272 | |
| | | | | | | |
| Total available-for-sale securities | $ | 19,863 | | | $ | 1,651 | | | $ | (74) | | | $ | 21,440 | |
| Held-to-maturity securities: | | | | | | | |
| Agency mortgage-backed securities | $ | 23,531 | | | $ | 812 | | | $ | (46) | | | $ | 24,297 | |
| Agency debentures | 108 | | | 13 | | | — | | | 121 | |
| Other agency debt securities | 1,451 | | | 58 | | | (1) | | | 1,508 | |
| Total held-to-maturity securities | $ | 25,090 | | | $ | 883 | | | $ | (47) | | | $ | 25,926 | |
| | | | | | | |
| December 31, 2019: | | | | | | | |
Available-for-sale securities:(2) | | | | | | | |
| Agency mortgage-backed securities | $ | 16,267 | | | $ | 836 | | | $ | (68) | | | $ | 17,035 | |
| Agency debentures | 632 | | | 27 | | | — | | | 659 | |
| US Treasuries | 1,233 | | | 34 | | | (40) | | | 1,227 | |
Non-agency asset-backed securities(1) | 417 | | | 2 | | | (2) | | | 417 | |
| Non-agency mortgage-backed securities | 159 | | | 4 | | | — | | | 163 | |
| Total available-for-sale securities | $ | 18,708 | | | $ | 903 | | | $ | (110) | | | $ | 19,501 | |
Held-to-maturity securities:(2) | | | | | | | |
| Agency mortgage-backed securities | $ | 20,085 | | | $ | 293 | | | $ | (49) | | | $ | 20,329 | |
| Agency debentures | 267 | | | 4 | | | — | | | 271 | |
| Other agency debt securities | 1,617 | | | 31 | | | (2) | | | 1,646 | |
| Total held-to-maturity securities | $ | 21,969 | | | $ | 328 | | | $ | (51) | | | $ | 22,246 | |
(1)Non-agency ABS collateralized by credit card, automobile loan and student loan receivables represented approximately 41%, 34% and 25% respectively, of the amortized cost of the non-agency ABS held at March 31, 2020 and approximately 54%, 18% and 28%, respectively, of the amortized cost of the non-agency ABS held at December 31, 2019.
(2)Securities with a fair value of $744 million were transferred from available-for-sale to held-to-maturity based on a change in intent and demonstrated ability to hold these to maturity in December 2019.
E*TRADE Q1 2020 10-Q | Page 70
E*TRADE FINANCIAL CORPORATION
NOTES TO THE CONDENSED CONSOLIDATED FINANCIAL STATEMENTS (UNAUDITED)
Contractual Maturities
The following table presents the contractual maturities of all available-for-sale and held-to-maturity debt securities (dollars in millions):
| | | | | | | | | | | |
| March 31, 2020 | | |
| Amortized Cost | | Fair Value |
| Available-for-sale debt securities: | | | |
| Due within one year | $ | 253 | | | $ | 256 | |
| Due within one to five years | 962 | | | 967 | |
| Due within five to ten years | 9,464 | | | 10,610 | |
| Due after ten years | 9,184 | | | 9,607 | |
| Total available-for-sale debt securities | $ | 19,863 | | | $ | 21,440 | |
| Held-to-maturity debt securities: | | | |
| Due within one year | $ | 68 | | | $ | 69 | |
| Due within one to five years | 2,047 | | | 2,123 | |
| Due within five to ten years | 2,921 | | | 3,090 | |
| Due after ten years | 20,054 | | | 20,644 | |
| Total held-to-maturity debt securities | $ | 25,090 | | | $ | 25,926 | |
At March 31, 2020 and December 31, 2019, the Company had pledged $6.9 billion and $7.4 billion, respectively, of held-to-maturity debt securities, and $616 million and $456 million, respectively, of available-for-sale securities, as collateral for FHLB advances, derivatives and other purposes.
E*TRADE Q1 2020 10-Q | Page 71
E*TRADE FINANCIAL CORPORATION
NOTES TO THE CONDENSED CONSOLIDATED FINANCIAL STATEMENTS (UNAUDITED)
Investments with Unrealized or Unrecognized Losses
The following table presents the fair value and unrealized or unrecognized losses on available-for-sale and held-to-maturity securities, and the length of time that individual securities have been in a continuous unrealized or unrecognized loss position (dollars in millions):
| | | | | | | | | | | | | | | | | | | | | | | | | | | | | | | | | | | |
| | Less than 12 Months | | | | 12 Months or More | | | | Total | | |
| | Fair Value | | Unrealized /
Unrecognized
Losses | | Fair Value | | Unrealized /
Unrecognized
Losses | | Fair Value | | Unrealized /
Unrecognized
Losses |
| March 31, 2020: | | | | | | | | | | | |
| Available-for-sale securities: | | | | | | | | | | | |
| Agency mortgage-backed securities | $ | 735 | | | $ | (12) | | | $ | 1,275 | | | $ | (36) | | | $ | 2,010 | | | $ | (48) | |
| Non-agency mortgage-backed securities | 160 | | | (4) | | | — | | | — | | | 160 | | | (4) | |
| Non-agency asset-backed securities | 1,136 | | | (22) | | | — | | | — | | | 1,136 | | | (22) | |
| | | | | | | | | | | |
| | | | | | | | | | | |
| | | | | | | | | | | |
| Total temporarily impaired available-for-sale securities | $ | 2,031 | | | $ | (38) | | | $ | 1,275 | | | $ | (36) | | | $ | 3,306 | | | $ | (74) | |
| Held-to-maturity securities: | | | | | | | | | | | |
| Agency mortgage-backed securities | $ | 1,219 | | | $ | (15) | | | $ | 1,141 | | | $ | (31) | | | $ | 2,360 | | | $ | (46) | |
| | | | | | | | | | | |
| Other agency debt securities | — | | | — | | | 93 | | | (1) | | | 93 | | | (1) | |
| Total temporarily impaired held-to-maturity securities | $ | 1,219 | | | $ | (15) | | | $ | 1,234 | | | $ | (32) | | | $ | 2,453 | | | $ | (47) | |
| | | | | | | | | | | |
| December 31, 2019: | | | | | | | | | | | |
| Available-for-sale securities: | | | | | | | | | | | |
| Agency mortgage-backed securities | $ | 2,045 | | | $ | (32) | | | $ | 1,916 | | | $ | (36) | | | $ | 3,961 | | | $ | (68) | |
| Non-agency mortgage-backed securities | 50 | | | — | | | — | | | — | | | 50 | | | — | |
| US Treasuries | 402 | | | (40) | | | — | | | — | | | 402 | | | (40) | |
| Non-agency asset-backed securities | 251 | | | (2) | | | — | | | — | | | 251 | | | (2) | |
| | | | | | | | | | | |
| Total temporarily impaired available-for-sale securities | $ | 2,748 | | | | $ | (74) | | | | $ | 1,916 | | | | $ | (36) | | | | $ | 4,664 | | | | $ | (110) | |
| Held-to-maturity securities: | | | | | | | | | | | |
| Agency mortgage-backed securities | $ | 1,337 | | | $ | (4) | | | $ | 3,600 | | | $ | (45) | | | $ | 4,937 | | | $ | (49) | |
| Other agency debt securities | 181 | | | (1) | | | 135 | | | (1) | | | 316 | | | (2) | |
| Total temporarily impaired held-to-maturity securities | $ | 1,518 | | | $ | (5) | | | $ | 3,735 | | | $ | (46) | | | $ | 5,253 | | | $ | (51) | |
The Company does not believe that any individual unrealized loss in the available-for-sale portfolio or unrecognized loss in the held-to-maturity portfolio as of March 31, 2020 represents a credit loss. Investment securities backed by the US government or its agencies comprised 96% and 99%, respectively, of the amortized cost basis of the Company's portfolio at March 31, 2020 and December 31, 2019. The Company has no expectation of credit losses for these securities based on the credit profiles of those entities and our historical loss experience for such investments. See Note 1—Organization, Basis of Presentation and Summary of Significant Accounting Policies for additional details.
E*TRADE Q1 2020 10-Q | Page 72
E*TRADE FINANCIAL CORPORATION
NOTES TO THE CONDENSED CONSOLIDATED FINANCIAL STATEMENTS (UNAUDITED)
For the non-agency portfolio, the Company applied stressed cash flow scenarios and no credit losses were indicated. Unrealized losses on the non-agency securities reflect non-credit related factors such as changing interest rates and market liquidity. Further, the Company does not intend to sell any of its debt securities in an unrealized or unrecognized loss position as of the balance sheet date and it is not more likely than not that the Company will be required to sell the debt securities before the anticipated recovery of its remaining amortized cost of the debt securities in an unrealized or unrecognized loss position.
There were no impairment losses recognized in earnings on available-for-sale or held-to-maturity securities during the three months ended March 31, 2020 and 2019.
Gains on Securities and Other, Net
The following table presents the components of gains on securities and other, net (dollars in millions):
| | | | | | | | | | | | | | | | | |
| | | | | | | | | |
| | | | | Three Months Ended March 31, | | | | |
| | | | | 2020 | | 2019 | | |
| Gains on available-for-sale securities | | | | | $ | 19 | | | $ | 11 | | | |
| Equity method investment income and other | | | | | 1 | | | — | | | |
| Gains on securities and other, net | | | | | $ | 20 | | | $ | 11 | | | |
| | | | | | | | | |
E*TRADE Q1 2020 10-Q | Page 73
E*TRADE FINANCIAL CORPORATION
NOTES TO THE CONDENSED CONSOLIDATED FINANCIAL STATEMENTS (UNAUDITED)
| | |
| NOTE 7—LOANS RECEIVABLE AND ALLOWANCE FOR CREDIT LOSSES |
The Company adopted amended accounting guidance related to accounting for credit losses on January 1, 2020 and recognized an after-tax benefit related to mortgage loans of $84 million as an adjustment to opening retained earnings. The benefit primarily related to the increases in fair value of the underlying collateral for mortgage loans determined to be collateral-dependent compared to prior period charge-offs associated with these loans. This appreciation resulted in a net “negative allowance” associated with the mortgage loans.
Loans receivable decreased 4% to $1.5 billion during the three months ended March 31, 2020 as a result of runoff in our mortgage loan portfolio offset by increased securities-based lending. Loans receivable, net increased 2% to $1.6 billion during the three months ended March 31, 2020. This increase related primarily to the $114 million pre-tax benefit associated with the adoption of the amended guidance. This pre-tax benefit, offset by the provision expense and net recoveries, was the primary driver of the $86 million net "negative allowance" for credit losses at March 31, 2020. The "negative allowance" for credit losses represented 5.6% of total loans receivable as of March 31, 2020. The allowance for credit losses was ($17) million, or (1.1)% of total loans receivable, as of December 31, 2019.
The provision for credit losses was $6 million for the three months ended March 31, 2020. The timing and magnitude of the provision (benefit) for credit losses is affected by many factors that could result in variability. Changes in management's reasonable and supportable forecasts of estimated credit losses and collateral valuations, offset by actual charge-offs net of recoveries, will drive variability in provision (benefit) for credit losses in future periods.
In March 2020, the World Health Organization declared the outbreak of COVID-19 a pandemic. The pandemic, and actions taken by governmental authorities to contain its financial and economic impact, resulted in significant market volatility during March 2020. The Company's allowance for credit losses as of March 31, 2020 includes the estimated financial impacts of the pandemic on its expected credit losses resulting in an increase to the allowance for credit losses of $5 million as of March 31, 2020 compared to January 1, 2020.
E*TRADE Q1 2020 10-Q | Page 74
E*TRADE FINANCIAL CORPORATION
NOTES TO THE CONDENSED CONSOLIDATED FINANCIAL STATEMENTS (UNAUDITED)
The following table presents loans receivable disaggregated by delinquency status (dollars in millions):
| | | | | | | | | | | | | | | | | | | | | | | | | | | | | | | | | | | | | | | | | | | | | | | | | | |
| | | | Days Past Due | | | | | | | | | | | | |
| | Current | | 30-89 | | 90-179 | | 180+ | | Total | | Unamortized Premiums, Net | | Allowance for Credit Losses(1) | | Loans Receivable, Net |
| March 31, 2020: | | | | | | | | | | | | | | | | |
| One- to four-family | | $ | 673 | | | $ | 40 | | | $ | 9 | | | $ | 33 | | | $ | 755 | | | $ | 4 | | | $ | 35 | | | $ | 794 | |
| Home equity | | 550 | | | 22 | | | 8 | | | 14 | | | 594 | | | — | | | 51 | | | 645 | |
| | | | | | | | | | | | | | | | |
Securities-based lending(2) | | 195 | | | — | | | — | | | — | | | 195 | | | — | | | — | | | 195 | |
| Total loans receivable | | $ | 1,418 | | | $ | 62 | | | $ | 17 | | | $ | 47 | | | $ | 1,544 | | | $ | 4 | | | $ | 86 | | | $ | 1,634 | |
| | | | | | | | | | | | | | | | |
| | | | Days Past Due | | | | | | | | | | | | |
| | Current | | 30-89 | | 90-179 | | 180+ | | Total | | Unamortized Premiums, Net | | Allowance for Loan Losses(1) | | Loans Receivable, Net |
| December 31, 2019: | | | | | | | | | | | | | | | | |
| One- to four-family | | $ | 718 | | | $ | 39 | | | $ | 11 | | | $ | 35 | | | $ | 803 | | | $ | 5 | | | $ | (6) | | | $ | 802 | |
| Home equity | | 590 | | | 21 | | | 7 | | | 17 | | | 635 | | | — | | | (11) | | | 624 | |
Securities-based lending(2) | | 169 | | | — | | | — | | | — | | | 169 | | | — | | | — | | | 169 | |
| Total loans receivable | | $ | 1,477 | | | $ | 60 | | | $ | 18 | | | $ | 52 | | | $ | 1,607 | | | $ | 5 | | | $ | (17) | | | $ | 1,595 | |
(1)The Company adopted amended accounting guidance related to accounting for credit losses on January 1, 2020. Prior year amounts related to the allowance for loan losses were not restated as the amended accounting guidance was adopted on a modified retrospective basis. See Note 1—Organization, Basis of Presentation and Summary of Significant Accounting Policies for further details.
(2)E*TRADE Line of Credit is a securities-based lending product where customers can borrow against the market value of their securities pledged as collateral. The Company has no expectation of credit losses for these loans as they are fully collateralized by cash and securities with fair values in excess of borrowings at both March 31, 2020 and December 31, 2019, respectively. The unused credit line amount totaled $569 million and $431 million as of March 31, 2020 and December 31, 2019, respectively, and were unconditionally cancellable by the Company.
The Company pledged $1.2 billion of loans as collateral to the FHLB at both March 31, 2020 and December 31, 2019.
Credit Quality and Concentrations of Credit Risk
The Company tracks and reviews factors to predict and monitor credit risk in its mortgage loan portfolio on an ongoing basis. Property values, FICO scores, and loan balances are updated quarterly. The Company has not originated a mortgage loan since 2008 when it exited direct retail lending, which was the last remaining origination channel after the Company’s exit from the wholesale mortgage lending channel in 2007.
E*TRADE Q1 2020 10-Q | Page 75
E*TRADE FINANCIAL CORPORATION
NOTES TO THE CONDENSED CONSOLIDATED FINANCIAL STATEMENTS (UNAUDITED)
The following tables present the distribution of the Company’s mortgage loan portfolios by credit quality indicator (dollars in millions):
| | | | | | | | | | | | | | | | | | | | | | | |
| | One- to Four-Family | | | | Home Equity | | |
| | | | | | | |
| March 31, | | December 31, | | March 31, | | December 31, |
Current LTV/CLTV(1) | 2020 | | 2019 | | 2020 | | 2019 |
| <=80% | $ | 624 | | | $ | 661 | | | $ | 350 | | | $ | 377 | |
| 80%-100% | 88 | | | 97 | | | 143 | | | 154 | |
| 100%-120% | 28 | | | 26 | | | 69 | | | 68 | |
| >120% | 15 | | | 19 | | | 32 | | | 36 | |
| Total mortgage loans receivable | $ | 755 | | | $ | 803 | | | $ | 594 | | | $ | 635 | |
Average estimated current LTV/CLTV (2) | 61 | % | | 61 | % | | 77 | % | | 76 | % |
Average LTV/CLTV at loan origination (3) | 70 | % | | 70 | % | | 82 | % | | 82 | % |
(1)Current CLTV calculations for home equity loans are based on the maximum available line for HELOCs and outstanding principal balance for HEILs. For home equity loans in the second lien position, the original balance of the first lien loan at origination date and updated valuations on the property underlying the loan are used to calculate CLTV. Current property value estimates are updated on a quarterly basis.
(2)The average estimated current LTV/CLTV ratio reflects the outstanding balance at the balance sheet date and the maximum available line for HELOCs, divided by the estimated current value of the underlying property.
(3)Average LTV/CLTV at loan origination calculations are based on LTV/CLTV at time of purchase for one- to four-family purchased loans, HEILs and the maximum available line for HELOCs.
| | | | | | | | | | | | | | | | | | | | | | | |
| | One- to Four-Family | | | | Home Equity | | |
| March 31, | | December 31, | | March 31, | | December 31, |
| Current FICO | 2020 | | 2019 | | 2020 | | 2019 |
| >=720 | $ | 423 | | | $ | 462 | | | $ | 309 | | | $ | 333 | |
| 719 - 700 | 65 | | | 77 | | | 56 | | | 61 | |
| 699 - 680 | 52 | | | 55 | | | 49 | | | 54 | |
| 679 - 660 | 44 | | | 40 | | | 42 | | | 43 | |
| 659 - 620 | 66 | | | 63 | | | 54 | | | 59 | |
| <620 | 105 | | | 106 | | | 84 | | | 85 | |
| Total mortgage loans receivable | $ | 755 | | | $ | 803 | | | $ | 594 | | | $ | 635 | |
E*TRADE Q1 2020 10-Q | Page 76
E*TRADE FINANCIAL CORPORATION
NOTES TO THE CONDENSED CONSOLIDATED FINANCIAL STATEMENTS (UNAUDITED)
One- to four-family loans include loans with an interest-only period, followed by an amortizing period. At March 31, 2020, 100% of these loans were amortizing. The home equity loan portfolio consists of HEILs and HELOCs. HEILs are primarily fully amortizing loans that do not offer the option of an interest-only payment. The majority of HELOCs had an interest only draw period at origination and converted to amortizing loans at the end of the draw period. At March 31, 2020, substantially all of the HELOC portfolio had converted from the interest-only draw period.
The weighted average age of our mortgage loans receivable was 14.0 years and 13.7 years at March 31, 2020 and December 31, 2019, respectively. Approximately 32% of the Company’s mortgage loans receivable were concentrated in California at both March 31, 2020 and December 31, 2019, respectively. Approximately 11% and 10% of the Company's mortgage loans receivable were concentrated in New York at March 31, 2020 and December 31, 2019. No other state had concentrations of mortgage loans that represented 10% or more of the Company’s mortgage loans receivable at March 31, 2020 or December 31, 2019.
At March 31, 2020, 24% and 21% of the Company’s past-due mortgage loans were concentrated in California and New York, respectively. No other state had concentrations of past-due mortgage loans that represented 10% or more of the Company's past-due mortgage loans. At March 31, 2020, 41% and 10% of the Company’s impaired mortgage loans were concentrated in California and New York, respectively. No other state had concentrations of impaired mortgage loans that represented 10% or more of the Company's impaired mortgage loans.
Nonperforming Loans
The Company classifies loans as nonperforming when they are no longer accruing interest. The following table presents nonperforming loans by loan portfolio (dollars in millions):
| | | | | | | | | | | |
| | | |
| March 31, 2020 | | December 31, 2019 |
| One- to four-family | $ | 104 | | | $ | 114 | |
| Home equity | 51 | | | 54 | |
| Total nonperforming loans receivable | $ | 155 | | | $ | 168 | |
Interest income recognized on nonaccrual loans was not material for the three months ended March 31, 2020. There were no nonaccrual loans for which the Company had not recognized an allowance for credit losses at March 31, 2020. There were no loans that were 90 days or more past due, but were not on nonaccrual status at March 31, 2020.
At both March 31, 2020 and December 31, 2019, the Company held $13 million of real estate owned that was acquired through foreclosure or through a deed in lieu of foreclosure or similar legal agreement. The Company held $31 million and $32 million of loans for which formal foreclosure proceedings were in process at March 31, 2020 and December 31, 2019, respectively.
E*TRADE Q1 2020 10-Q | Page 77
E*TRADE FINANCIAL CORPORATION
NOTES TO THE CONDENSED CONSOLIDATED FINANCIAL STATEMENTS (UNAUDITED)
Collateral-Dependent Loans
The Company's collateral-dependent loans were a significant driver of the net benefit recognized upon CECL adoption. The benefit primarily related to the appreciation in fair value of the underlying collateral as compared to prior period charge-offs associated with these loans. The fair value of the underlying collateral, less estimated selling costs, are based on the most recent "as is" property valuation data available, which may include appraisals, broker price opinions, automated valuation models or updated values using home price indices, all of which are categorized within Level 3 of the fair value hierarchy. See Note 4—Fair Value Disclosures for further details.
The following table presents credit quality characteristics of the collateral-dependent loan population (dollars in millions):
| | | | | | | | | | | | | | |
| March 31, 2020 | | | |
| One- to Four-Family | | | Home Equity | |
| Unpaid principal balance | $ | 184 | | | | $ | 154 | | |
| Recorded investment | $ | 136 | | | | $ | 57 | | |
| Negative allowance for credit losses | $ | 37 | | | | $ | 65 | | |
| Average estimated current LTV/CLTV | 71 | % | | | 76 | % | |
| Average loan amount (dollars in thousands) | $ | 361 | | | | $ | 63 | | |
| | | | |
| | | | |
| | | | |
| | | | |
| | | | |
Approximately 36% and 15% of the Company's collateral-dependent loans were concentrated in California and New York, respectively at March 31, 2020. No other state had concentrations of mortgage loans that represented 10% or more of the Company's collateral-dependent loans. All of these loans were amortizing at March 31, 2020.
Allowance for Credit Losses
The allowance for credit losses is management’s estimate of expected credit losses over the life of the loan portfolio at the balance sheet date, as well as the forecasted losses, including economic concessions to borrowers, over the estimated remaining life of loans modified as TDRs. The allowance for credit losses on mortgage loans evaluated collectively includes a qualitative component to account for a variety of factors that present additional uncertainty that may not be fully considered in the quantitative loss model but are factors we believe may impact the level of credit losses. Expected recoveries of amounts previously charged-off and expected to be charged-off are included in the allowance and do not exceed the aggregate of amounts previously charged-off and expected to be charged-off. The Company recognizes a credit loss expense in the amount necessary to adjust the allowance for credit losses for management’s current estimate of expected credit losses on mortgage loans receivable.
E*TRADE Q1 2020 10-Q | Page 78
E*TRADE FINANCIAL CORPORATION
NOTES TO THE CONDENSED CONSOLIDATED FINANCIAL STATEMENTS (UNAUDITED)
The following table presents a roll forward by loan portfolio of the allowance for credit losses (dollars in millions):
| | | | | | | | | | | | | | | | | |
| Three Months Ended March 31, 2020 | | | | |
| One- to Four-Family | | Home Equity | | Total(2) |
Allowance for loan losses, beginning of period(1) | $ | (6) | | | $ | (11) | | | $ | (17) | |
Impact of CECL adoption(1)(3) | 43 | | | 71 | | | 114 | |
| (Provision) benefit for credit losses | (1) | | | (5) | | | (6) | |
Charge-offs(4) | — | | | — | | | — | |
Recoveries(4) | (1) | | | (4) | | | (5) | |
| Net charge-offs (recoveries) | (1) | | | (4) | | | (5) | |
Allowance for credit losses, end of period(1) | $ | 35 | | | $ | 51 | | | $ | 86 | |
| | | | | | | | | | | | | | | | | | | | | | | |
| Three Months Ended March 31, 2019 | | | | | | |
| One- to Four-Family | | Home Equity | | Consumer | | Total(2) |
Allowance for loan losses, beginning of period(1) | $ | (9) | | | $ | (26) | | | $ | (2) | | | $ | (37) | |
| (Provision) benefit for loan losses | 2 | | | 10 | | | — | | | 12 | |
Charge-offs(4) | — | | | — | | | 1 | | | 1 | |
Recoveries(4) | (2) | | | (5) | | | (1) | | | (8) | |
| Net charge-offs (recoveries) | (2) | | | (5) | | | — | | | (7) | |
Allowance for loan losses, end of period(1) | $ | (9) | | | $ | (21) | | | $ | (2) | | | $ | (32) | |
(1)The Company adopted amended accounting guidance related to accounting for credit losses on January 1, 2020. Prior year amounts related to the allowance for loan losses were not restated as the amended accounting guidance was adopted on a modified retrospective basis. At January 1, 2020, the Company had a net "negative allowance" for credit losses of $37 million for its one-to-four-family portfolio and a net "negative allowance" of $60 million for its home equity portfolio. See Note 1—Organization, Basis of Presentation and Summary of Significant Accounting Policies for further details.
(2)Securities-based lending loans were fully collateralized by cash and securities with fair values in excess of borrowings for the three months ended March 31, 2020 and 2019, respectively, and were unconditionally cancellable by the Company.
(3)The benefit recognized as a "negative allowance" at adoption is primarily related to the increases in fair value of the underlying collateral for mortgage loans determined to be collateral-dependent compared to prior period charge-offs associated with these loans. This fair value appreciation resulted in a benefit of $39 million for the one- to four-family portfolio and a benefit of $70 million for the home equity portfolio at adoption.
(4)Includes benefits resulting from recoveries of partial charge-offs due to principal paydowns or payoffs for the periods presented. The benefits included in the charge-offs line item exceeded other charge-offs for both one-to-four family and home equity loans in both periods presented.
E*TRADE Q1 2020 10-Q | Page 79
E*TRADE FINANCIAL CORPORATION
NOTES TO THE CONDENSED CONSOLIDATED FINANCIAL STATEMENTS (UNAUDITED)
Troubled Debt Restructurings
The Company considers a loan to be impaired when it meets the definition of a TDR. Delinquency status is the primary measure the Company uses to evaluate the performance of loans modified as TDRs. The Company classifies loans as nonperforming when they are no longer accruing interest. The recorded investment in loans modified as TDRs includes the charge-offs related to certain loans that were written down to the estimated current value of the underlying property less estimated selling costs.
The Company had $270 million of recorded investment in loans that had been modified as TDRs at March 31, 2020, including $163 million of one-to-four family loans and $107 million of home equity loans, respectively. This compared to $280 million of recorded investment in TDRs at December 31, 2019, including $168 million of one-to-four family loans and $112 million of home equity loans, respectively.
The following table presents the number of loans and post-modification balances immediately after being modified by major class (dollars in millions):
| | | | | | | | | | | | | | | | | | | | | | | | | |
| Three Months Ended | | | | | | | | |
| | | | Interest Rate Reduction | | | | | | |
| | Number of
Loans | | Re-age/
Extension/
Interest
Capitalization | | | | Other(1) | | Total |
| March 31, 2020: | | | | | | | | | |
| One- to four-family | 4 | | $ | 2 | | | | | $ | — | | | $ | 2 | |
| Home equity | 8 | | 1 | | | | | — | | | 1 | |
| Total | 12 | | $ | 3 | | | | | $ | — | | | $ | 3 | |
| | | | | | | | | |
| March 31, 2019: | | | | | | | | | |
| One- to four-family | 9 | | $ | 1 | | | | | $ | 1 | | | $ | 2 | |
| Home equity | 11 | | 1 | | | | | — | | | 1 | |
| Total | 20 | | $ | 2 | | | | | $ | 1 | | | $ | 3 | |
| | | | | | | | | |
| | | | | | | | | |
| | | | | | | | | |
| | | | | | | | | |
| | | | | | | | | |
(1)Amounts represent loans whose terms were modified in a manner that did not result in an interest rate reduction, including re-aged loans, extensions, and loans with capitalized interest.
E*TRADE Q1 2020 10-Q | Page 80
E*TRADE FINANCIAL CORPORATION
NOTES TO THE CONDENSED CONSOLIDATED FINANCIAL STATEMENTS (UNAUDITED)
| | |
| NOTE 8—DERIVATIVE INSTRUMENTS AND HEDGING ACTIVITIES |
Presentation on the Consolidated Balance Sheets
Hedging Instruments
The Company utilizes fair value hedges to offset exposure to changes in value of certain fixed-rate assets. All derivative contracts were designated as hedging instruments at March 31, 2020 and December 31, 2019, and the notional amount associated with these fair value hedge contracts was $11.3 billion and $10.1 billion for the same periods, respectively. The Company had no bilateral derivative contracts at March 31, 2020 or December 31, 2019. The consolidated balance sheets exclude derivative assets of $6 million and $52 million at March 31, 2020 and December 31, 2019, respectively, and derivative liabilities of $1.4 billion and $457 million for the same periods. These contracts were executed through central clearing organizations and were settled by variation margin payments.
Credit Risk
As all of the derivatives that the Company utilizes in its hedging activities at March 31, 2020 are subject to derivatives clearing agreements (cleared derivatives contracts), the credit risk associated with these cleared derivatives contracts is largely mitigated by the daily variation margin exchanged with counterparties.
E*TRADE Q1 2020 10-Q | Page 81
E*TRADE FINANCIAL CORPORATION
NOTES TO THE CONDENSED CONSOLIDATED FINANCIAL STATEMENTS (UNAUDITED)
Hedged Assets
The following table presents the cumulative basis adjustments related to the amortized cost basis or carrying amount of hedged assets in fair value hedging relationships (dollars in millions):
| | | | | | | | | | | | | | | | | | | | | | | |
| | | Cumulative Amount of Fair Value Hedging Basis Adjustment of Hedged Assets(2) | | | | |
| Amortized Cost of Hedged Assets(1) | | Total | | Active | | Discontinued |
| March 31, 2020: | | | | | | | |
Available-for-sale securities(3) | $ | 14,144 | | | $ | 1,561 | | | $ | 1,785 | | | $ | (224) | |
| | | | | | | | | | | | | | | | | | | | | | | |
| | | | | | | |
| | | | | | | |
| | | | | | | |
| | | | | | | |
| | | | | | | |
| | | Cumulative Amount of Fair Value Hedging Basis Adjustment Included in Carrying Amount of Hedged Assets(2) | | | | |
| Carrying Amount of Hedged Assets(4) | | Total | | Active | | Discontinued |
| December 31, 2019: | | | | | | | |
Available-for-sale securities(3) | $ | 12,480 | | | $ | 583 | | | $ | 810 | | | $ | (227) | |
(1)The Company adopted amended accounting guidance related to derivatives and hedging on a prospective basis on January 1, 2020. Prior year amounts were not restated. Refer to Note 1—Organization, Basis of Presentation and Summary of Significant Accounting Policies for further details. Amortized cost includes the initial acquisition price and the cost basis adjustments relating to discontinued fair value hedges, net of accumulated amortization or accretion.
(2)Represents the increase (decrease) to the amortized cost or carrying amount of hedged assets. If fair value hedge accounting is discontinued, the previously hedged item is no longer adjusted for changes in fair value through the consolidated statements of income and the cumulative net gain or loss on the hedged item is amortized to net interest income using the effective interest method over the contractual life of the hedged item adjusted to reflect actual prepayments.
(3)Includes the amortized cost basis and carrying value of closed portfolios of prepayable securities designated in hedging relationships in which the hedged item is the last layer of principal expected to be remaining throughout the hedge term as of March 31, 2020 and December 31, 2019. As of March 31, 2020 and December 31, 2019, respectively, the amortized cost basis of this portfolio was $410 million and $162 million, the amount of the designated hedged items was $316 million and $148 million and the cumulative amount of fair value hedging basis adjustments associated with these hedges was a loss of $19 million and a gain of $1 million.
(4)The carrying amount includes the amortized cost and the impact of basis adjustments on active fair value hedges.
E*TRADE Q1 2020 10-Q | Page 82
E*TRADE FINANCIAL CORPORATION
NOTES TO THE CONDENSED CONSOLIDATED FINANCIAL STATEMENTS (UNAUDITED)
Presentation on the Consolidated Statements of Income
The following table presents the effects of fair value hedge accounting on the consolidated statements of income (dollars in millions):
| | | | | | | | | | | | | | | | | | | |
| | | | | Interest Income | | | | | | |
| | | | | Three Months Ended March 31, | | | | | | |
| | | | | 2020 | | 2019 | | | | |
| | | | | | | | | | | |
| Total interest income | | | | | $ | 443 | | | $ | 555 | | | | | |
| | | | | | | | | | | |
Effects of fair value hedging on total interest income(1)(2) | | | | | | | | | | | |
| Agency debentures: | | | | | | | | | | | |
| | | | | | | | | | | |
| | | | | | | | | | | |
| Changes in fair value of hedged items | | | | | 215 | | | 7 | | | | | |
| Changes in fair value of derivatives | | | | | (215) | | | (7) | | | | | |
| Net loss on fair value hedging relationships - agency debentures | | | | | — | | | — | | | | | |
| | | | | | | | | | | |
| Agency mortgage-backed securities: | | | | | | | | | | | |
| Amounts recognized as interest accruals on derivatives | | | | | (12) | | | 3 | | | | | |
| Amortization of basis adjustments from discontinued hedges | | | | | 8 | | | 10 | | | | | |
| Changes in fair value of hedged items | | | | | 855 | | | 274 | | | | | |
| Changes in fair value of derivatives | | | | | (866) | | | (273) | | | | | |
| Net (loss) gain on fair value hedging relationships - agency mortgage-backed securities | | | | | (15) | | | 14 | | | | | |
| Total net (loss) gain on fair value hedging relationships | | | | | $ | (15) | | | $ | 14 | | | | | |
(1)Excludes interest income accruals on hedged items and amounts recognized upon the sale of securities attributable to fair value hedge accounting.
(2)Excludes interest on variation margin related to centrally cleared derivative contracts.
The following table presents the significant components of deposits (dollars in millions):
| | | | | | | | | | | | | | | |
| | | | | | | |
| | | | | | | |
| | March 31, 2020 | | December 31, 2019 | | | | |
| Sweep deposits: | | | | | | | |
| Brokerage sweep deposits | $ | 38,095 | | | $ | 27,949 | | | | | |
Bank sweep deposits(1) | 680 | | | 6,355 | | | | | |
Savings deposits(2) | 1,667 | | | 2,592 | | | | | |
Other deposits(3) | 1,704 | | | 1,710 | | | | | |
| Total deposits | $ | 42,146 | | | $ | 38,606 | | | | | |
(1)Beginning in Q4 2019, bank sweep deposits include Premium Savings Accounts participating in the newly established bank sweep deposit account program.
(2)Savings deposits include $1.0 billion of deposits at December 31, 2019 in our Premium Savings Account product that were subsequently converted to the bank sweep deposit account program. All new Premium Savings Accounts are now automatically enrolled in the program.
(3)Includes checking deposits, money market deposits and certificates of deposit. As of March 31, 2020 and December 31, 2019, the Company had $220 million and $197 million in non-interest bearing deposits, respectively.
E*TRADE Q1 2020 10-Q | Page 83
E*TRADE FINANCIAL CORPORATION
NOTES TO THE CONDENSED CONSOLIDATED FINANCIAL STATEMENTS (UNAUDITED)
| | |
| NOTE 10—OTHER BORROWINGS AND CORPORATE DEBT |
Other Borrowings
The following table presents the Company's external lines of credit at March 31, 2020 (dollars in millions):
| | | | | | | | | | | | | | |
| Description | Maturity Date | Borrower | Outstanding | Available |
Senior unsecured, committed revolving credit facility(1) | June 2024 | ETFC | $ | — | | $ | 300 | |
| FHLB secured credit facility | Determined at trade | ETB | $ | — | | $ | 6,430 | |
| Federal Reserve Bank discount window | Overnight | ETB | $ | — | | $ | 1,245 | |
Senior unsecured, committed revolving credit facility(2) | June 2020 | ETS | $ | — | | $ | 600 | |
| Secured, committed lines of credit | June 2020 | ETS | $ | — | | $ | 175 | |
| Unsecured, uncommitted lines of credit | June 2020 | ETS | $ | — | | $ | 50 | |
| Unsecured, uncommitted lines of credit | None | ETS | $ | — | | $ | 75 | |
| Secured, uncommitted lines of credit | None | | ETS | $ | — | | $ | 425 | |
| | | | |
(1)The senior unsecured committed revolving credit facility contains certain covenants, including maintenance covenants related to the Company's interest coverage, leverage and regulatory net capital ratios with which the Company was in compliance at March 31, 2020.
(2)The senior unsecured committed revolving credit facility contains certain covenants, including maintenance covenants related to E*TRADE Securities' minimum consolidated tangible net worth and regulatory net capital ratio with which the Company was in compliance at March 31, 2020.
Corporate Debt
The following tables present the significant components of E*TRADE Financial's corporate debt (dollars in millions):
| | | | | | | | | | | | | | | | | |
| Face Value | | Discount | | Net |
| March 31, 2020: | | | | | |
| Interest-bearing notes: | | | | | |
| 2.95% Senior Notes, due 2022 | $ | 600 | | | $ | (3) | | | $ | 597 | |
| 3.80% Senior Notes, due 2027 | 400 | | | (3) | | | 397 | |
| 4.50% Senior Notes, due 2028 | 420 | | | (3) | | | 417 | |
| Total corporate debt | $ | 1,420 | | | $ | (9) | | | $ | 1,411 | |
| | | | | | | | | | | | | | | | | |
| December 31, 2019: | | | | | |
| Interest-bearing notes: | | | | | |
| 2.95% Senior Notes, due 2022 | $ | 600 | | | $ | (3) | | | $ | 597 | |
| 3.80% Senior Notes, due 2027 | 400 | | | (3) | | | 397 | |
| 4.50% Senior Notes, due 2028 | 420 | | | (4) | | | 416 | |
| Total corporate debt | $ | 1,420 | | | $ | (10) | | | $ | 1,410 | |
E*TRADE Q1 2020 10-Q | Page 84
E*TRADE FINANCIAL CORPORATION
NOTES TO THE CONDENSED CONSOLIDATED FINANCIAL STATEMENTS (UNAUDITED)
| | |
| NOTE 11—SHAREHOLDERS' EQUITY |
Preferred Stock
The following table presents the preferred stock outstanding (in millions except total shares outstanding and per share data):
| | | | | | | | | | | | | | | | | | | | | | | | | | | | | | | | | | | | | | |
| | | | | | | | | | Carrying Value at | | |
| Description | | Issuance Date | | Per Annum Dividend Rate | | Total Shares Outstanding | | Liquidation Preference per Share | | March 31, 2020 | | December 31, 2019 |
| Series A | | | | | | | | | | | | |
| Fixed-to-Floating Rate Non-Cumulative | | 8/25/2016 | | 5.875% to, but excluding, 9/15/2026; 3-mo LIBOR + 4.435% thereafter | | 400,000 | | | $ | 1,000 | | | $ | 394 | | | $ | 394 | |
| Series B | | | | | | | | | | | | |
| Fixed-to-Floating Rate Non-Cumulative | | 12/6/2017 | | 5.30% to, but excluding, 3/15/2023; 3-mo LIBOR + 3.16% thereafter | | 3,000 | | | $ | 100,000 | | | 295 | | | 295 | |
| Total | | | | | | 403,000 | | | | | $ | 689 | | | $ | 689 | |
Dividend on Preferred Stock
The following table presents the cash dividends paid on preferred stock (in millions except per share data):
| | | | | | | | | | | | | | | | | | | | | | | | | | |
| Three Months Ended March 31, 2020 | | | | | | | | |
| Declaration Date | | Record Date | | Payment Date | | Dividend per Share | | Dividend Paid |
Series A (1) | | | | | | | | |
| 2/6/2020 | | 3/2/2020 | | 3/16/2020 | | $ | 29.38 | | | $ | 12 | |
Series B (1) | | | | | | | | |
| 2/6/2020 | | 3/2/2020 | | 3/16/2020 | | $ | 2,650.00 | | | 8 | |
| Total | | | | | | | | $ | 20 | |
| | | | | | | | |
| Three Months Ended March 31, 2019 | | | | | | | | |
| Declaration Date | | Record Date | | Payment Date | | Dividend per Share | | Dividend Paid |
Series A (1) | | | | | | | | |
| 2/7/2019 | | 2/28/2019 | | 3/15/2019 | | $ | 29.38 | | | $ | 12 | |
Series B (1) | | | | | | | | |
| 2/7/2019 | | 2/28/2019 | | 3/15/2019 | | $ | 2,650.00 | | | 8 | |
| Total | | | | | | | | $ | 20 | |
| | | | | | | | |
| | | | | | | | |
| | | | | | | | |
| | | | | | | | |
| | | | | | | | |
| | | | | | | | |
| | | | | | | | |
(1)Dividends are non-cumulative and payable semi-annually, if declared.
E*TRADE Q1 2020 10-Q | Page 85
E*TRADE FINANCIAL CORPORATION
NOTES TO THE CONDENSED CONSOLIDATED FINANCIAL STATEMENTS (UNAUDITED)
Common Stock
Dividend on Common Stock
The following table presents the cash dividends paid on common stock (in millions except per share data):
| | | | | | | | | | | | | | | | | | | | | | | | | | | | | | | | | | | | |
| Three Months Ended March 31, 2020 | | | | | | | | | | | | | | | | | | |
| Declaration Date | | Record Date | | Payment Date | | Dividend per Share | | Dividend Paid | | | | | | | | | | |
| 1/22/2020 | | 2/25/2020 | | 3/2/2020 | | $ | 0.14 | | | $ | 31 | | | | | | | | | | | |
| Total | | | | | | | | $ | 31 | | | | | | | | | | | |
| | | | | | | | | | | | | | | | | | |
| Three Months Ended March 31, 2019 | | | | | | | | | | | | | | | | | | |
| Declaration Date | | Record Date | | Payment Date | | Dividend per Share | | Dividend Paid | | | | | | | | | | |
| 1/23/2019 | | 2/1/2019 | | 2/15/2019 | | $ | 0.14 | | | $ | 35 | | | | | | | | | | | |
| Total | | | | | | | | $ | 35 | | | | | | | | | | | |
On April 22, 2020, the Company declared a cash dividend for the second quarter of $0.14 per share on its outstanding shares of common stock. The dividend will be payable on May 19, 2020 to shareholders of record as of the close of business on May 13, 2020.
Share Repurchases
In July 2019, the Company announced that its board of directors authorized a $1.5 billion share repurchase program. During February 2020, the Company repurchased 2.1 million shares of common stock for a total of $95 million prior to suspending share repurchases in connection with the proposed merger with Morgan Stanley. See Note 2—Acquisitions and Restructuring for further details. The Company accounts for share repurchases retired after repurchase by allocating the excess repurchase price over par to additional paid-in-capital.
Other Common Stock Activity
Other common stock activity includes shares withheld to pay taxes for share-based compensation, employee stock purchase plan and other activity.
Accumulated Other Comprehensive Loss
The following table presents after-tax changes in each component of accumulated other comprehensive loss (dollars in millions):
| | | | | | | | | | | |
| Three Months Ended March 31, | | |
| 2020 | | 2019 |
Accumulated other comprehensive loss, beginning of period(1) | $ | (28) | | | $ | (275) | |
| Other comprehensive (loss) income before reclassifications | (126) | | | 112 | |
| Amounts reclassified from accumulated other comprehensive loss | (14) | | | (7) | |
| Net change | (140) | | | 105 | |
Accumulated other comprehensive loss, end of period(1) | $ | (168) | | | $ | (170) | |
(1)The accumulated other comprehensive loss balances and activities were related to available-for-sale securities in both periods.
E*TRADE Q1 2020 10-Q | Page 86
E*TRADE FINANCIAL CORPORATION
NOTES TO THE CONDENSED CONSOLIDATED FINANCIAL STATEMENTS (UNAUDITED)
The following table presents other comprehensive (loss) income activity and the related tax effect (dollars in millions):
| | | | | | | | | | | | | | | | | | | | | | | | | | | | | | | | | | | | | | | |
| Three Months Ended March 31, | | | | | | | | | | | | | | |
| | 2020 | | | | | | 2019 | | | | | | | | |
| Before Tax | | Tax Effect | | After Tax | | Before Tax | | Tax Effect | | After Tax | | | | |
| Other comprehensive (loss) income | | | | | | | | | | | | | | | |
| Available-for-sale securities: | | | | | | | | | | | | | | | |
| Unrealized (losses) gains, net | $ | (172) | | | $ | 46 | | | $ | (126) | | | $ | 150 | | | $ | (38) | | | $ | 112 | | | | | |
| Reclassification into earnings, net | (19) | | | 5 | | | (14) | | | (10) | | | 3 | | | (7) | | | | | |
| Net change from available-for-sale securities | (191) | | | 51 | | | (140) | | | 140 | | | (35) | | | 105 | | | | | |
| Other comprehensive (loss) income | $ | (191) | | | $ | 51 | | | $ | (140) | | | $ | 140 | | | $ | (35) | | | $ | 105 | | | | | |
The following table presents the consolidated statements of income line items impacted by reclassifications out of accumulated other comprehensive loss (dollars in millions):
| | | | | | | | | | | | | | | | | | | | |
| Accumulated Other Comprehensive Loss Components | | Amounts Reclassified from Accumulated Other Comprehensive Loss | | | | Affected Line Items in the Consolidated Statements of Income |
| | Three Months Ended March 31, | | | | |
| | 2020 | | 2019 | | |
| Available-for-sale securities: | | $ | 20 | | | $ | 11 | | | Gains on securities and other, net |
| | (1) | | | (1) | | | Interest income |
| | 19 | | | 10 | | | Reclassification into earnings, before tax |
| | (5) | | | (3) | | | Income tax expense |
| | $ | 14 | | | $ | 7 | | | Reclassification into earnings, net |
| | |
| NOTE 12—EARNINGS PER SHARE |
Net income available to common shareholders, or net income less preferred stock dividends, represents the numerator used in the computation of basic and diluted earnings per common share. The denominators used in the computation of basic and diluted earnings per common share are basic and diluted weighted average common shares outstanding, respectively.
Basic weighted average common shares outstanding were 222.3 million and 246.3 million for the three months ended March 31, 2020 and 2019, respectively. The difference between basic and diluted weighted average common shares outstanding includes the weighted-average dilutive impact of securities, including restricted stock units and awards, dividend equivalent units, employee stock purchase plan shares and stock options, as well as the weighted-average dilutive impact of convertible debentures. This activity represented 0.4 million and 0.6 million shares for the three months ended March 31, 2020 and 2019, respectively. This resulted in diluted weighted average common shares outstanding of 222.7 million and 246.9 million for the three months ended March 31, 2020 and 2019, respectively. The amount of certain restricted stock and options excluded from the calculations of diluted earnings per common share due to the anti-dilutive effect was not material for the three months ended March 31, 2020 and 2019.
E*TRADE Q1 2020 10-Q | Page 87
E*TRADE FINANCIAL CORPORATION
NOTES TO THE CONDENSED CONSOLIDATED FINANCIAL STATEMENTS (UNAUDITED)
| | |
| NOTE 13—REGULATORY REQUIREMENTS |
Broker-Dealer and FCM Capital Requirements
The Company's US broker-dealer, E*TRADE Securities, is subject to the Uniform Net Capital Rule under the Securities Exchange Act of 1934 administered by the SEC and FINRA, which requires the maintenance of minimum net capital. The minimum net capital requirements can be met under either the Aggregate Indebtedness method or the Alternative method. Under the Aggregate Indebtedness method, a broker-dealer is required to maintain net capital equal to or in excess of the greater of 6 2/3% of its aggregate indebtedness, as defined, or a minimum dollar amount. E*TRADE Securities has elected the Alternative method, under which it is required to maintain net capital equal to the greater of $250,000 or 2% of aggregate debit balances arising from customer transactions.
The Company's FCM, E*TRADE Futures, is subject to CFTC net capital requirements, including the maintenance of adjusted net capital equal to or in excess of the greater of (1) $1,000,000, (2) the FCM's risk-based capital requirement, computed as 8% of the total risk margin requirements for all positions carried in customer and non-customer accounts, or (3) the amount of adjusted net capital required by the NFA.
At March 31, 2020 and December 31, 2019, all of the Company’s broker-dealer and FCM subsidiaries met applicable minimum net capital requirements. The following table presents a summary of the minimum net capital requirements and excess capital for the Company’s broker-dealer and FCM subsidiaries (dollars in millions):
| | | | | | | | | | | | | | | | | |
| Required Net
Capital | | Net Capital | | Excess Net
Capital |
| March 31, 2020: | | | | | |
E*TRADE Securities(1) | $ | 179 | | | $ | 1,360 | | | $ | 1,181 | |
| E*TRADE Futures | 3 | | | 29 | | | 26 | |
| Total | $ | 182 | | | $ | 1,389 | | | $ | 1,207 | |
| | | | | |
| December 31, 2019: | | | | | |
| E*TRADE Securities | $ | 223 | | | $ | 1,251 | | | $ | 1,028 | |
| E*TRADE Futures | 3 | | | 28 | | | 25 | |
| Total | $ | 226 | | | $ | 1,279 | | | $ | 1,053 | |
(1)E*TRADE Securities paid dividends of $50 million to the parent company during the three months ended March 31, 2020.
Bank Capital Requirements
E*TRADE Financial and its bank subsidiaries, E*TRADE Bank and E*TRADE Savings Bank, are subject to various regulatory capital requirements administered by federal banking agencies. Failure to meet minimum capital requirements can trigger certain mandatory and possibly additional discretionary actions by regulators that, if undertaken, could have a direct material effect on the financial condition and results of operations of these entities. Under capital adequacy guidelines and the regulatory framework for prompt corrective action, these entities must meet specific capital guidelines that involve quantitative measures of assets, liabilities and certain off-balance sheet items as calculated under regulatory accounting practices. In addition, the Company's bank subsidiaries may not pay dividends to the parent company without the non-objection, or in certain cases the approval, of their regulators, and any loans by the bank subsidiaries to the
E*TRADE Q1 2020 10-Q | Page 88
E*TRADE FINANCIAL CORPORATION
NOTES TO THE CONDENSED CONSOLIDATED FINANCIAL STATEMENTS (UNAUDITED)
parent company or its other non-bank subsidiaries are subject to various quantitative, arm’s length, collateralization and other requirements. The capital amounts and classifications of these entities are also subject to qualitative judgments by the regulators about components, risk weightings and other factors.
Quantitative measures established by regulation to ensure capital adequacy require these entities to meet minimum Tier 1 leverage, Common Equity Tier 1 capital, Tier 1 risk-based capital and Total risk-based capital ratios. Events beyond management's control, such as deterioration in credit markets, could adversely affect future earnings and their ability to meet future capital requirements. E*TRADE Financial, E*TRADE Bank and E*TRADE Savings Bank were categorized as "well capitalized" under the regulatory framework for prompt corrective action for the periods presented in the following table (dollars in millions):
| | | | | | | | | | | | | | | | | | | | | | | | | | | | | | | | | | | | | | | | | | | | | | | | | | | | | | | | | | | |
| March 31, 2020 | | | | | | | | | | December 31, 2019 | | | | | | | | |
| | Actual | | | | Well Capitalized Minimum Capital | | | | Excess Capital | | Actual | | | | Well Capitalized Minimum Capital | | | | Excess Capital |
| | Amount | | Ratio | | Amount | | Ratio | | Amount | | Amount | | Ratio | | Amount | | Ratio | | Amount |
E*TRADE Financial(1) | | | | | | | | | | | | | | | | | | | |
| Tier 1 leverage | $ | 4,179 | | | 6.8 | % | | $ | 3,051 | | | 5.0 | % | | $ | 1,128 | | | $ | 4,035 | | | 6.9 | % | | $ | 2,922 | | | 5.0 | % | | $ | 1,113 | |
| Common Equity Tier 1 | $ | 3,490 | | | 29.3 | % | | $ | 775 | | | 6.5 | % | | $ | 2,715 | | | $ | 3,346 | | | 31.5 | % | | $ | 692 | | | 6.5 | % | | $ | 2,654 | |
| Tier 1 risk-based | $ | 4,179 | | | 35.1 | % | | $ | 954 | | | 8.0 | % | | $ | 3,225 | | | $ | 4,035 | | | 37.9 | % | | $ | 852 | | | 8.0 | % | | $ | 3,183 | |
| Total risk-based | $ | 4,179 | | | 35.1 | % | | $ | 1,192 | | | 10.0 | % | | $ | 2,987 | | | $ | 4,060 | | | 38.2 | % | | $ | 1,064 | | | 10.0 | % | | $ | 2,996 | |
E*TRADE Bank(1) | | | | | | | | | | | | | | | | | | | |
| Tier 1 leverage | $ | 3,420 | | | 7.4 | % | | $ | 2,314 | | | 5.0 | % | | $ | 1,106 | | | $ | 3,240 | | | 7.2 | % | | $ | 2,253 | | | 5.0 | % | | $ | 987 | |
| Common Equity Tier 1 | $ | 3,420 | | | 35.8 | % | | $ | 621 | | | 6.5 | % | | $ | 2,799 | | | $ | 3,240 | | | 36.5 | % | | $ | 577 | | | 6.5 | % | | $ | 2,663 | |
| Tier 1 risk-based | $ | 3,420 | | | 35.8 | % | | $ | 764 | | | 8.0 | % | | $ | 2,656 | | | $ | 3,240 | | | 36.5 | % | | $ | 710 | | | 8.0 | % | | $ | 2,530 | |
| Total risk-based | $ | 3,420 | | | 35.8 | % | | $ | 956 | | | 10.0 | % | | $ | 2,464 | | | $ | 3,257 | | | 36.7 | % | | $ | 888 | | | 10.0 | % | | $ | 2,369 | |
E*TRADE Savings Bank(1) | | | | | | | | | | | | | | | | | | | |
| Tier 1 leverage | $ | 1,492 | | | 38.5 | % | | $ | 193 | | | 5.0 | % | | $ | 1,299 | | | $ | 1,480 | | | 40.7 | % | | $ | 182 | | | 5.0 | % | | $ | 1,298 | |
| Common Equity Tier 1 | $ | 1,492 | | | 200.4 | % | | $ | 48 | | | 6.5 | % | | $ | 1,444 | | | $ | 1,480 | | | 224.7 | % | | $ | 43 | | | 6.5 | % | | $ | 1,437 | |
| Tier 1 risk-based | $ | 1,492 | | | 200.4 | % | | $ | 59 | | | 8.0 | % | | $ | 1,433 | | | $ | 1,480 | | | 224.7 | % | | $ | 53 | | | 8.0 | % | | $ | 1,427 | |
| Total risk-based | $ | 1,492 | | | 200.4 | % | | $ | 74 | | | 10.0 | % | | $ | 1,418 | | | $ | 1,480 | | | 224.7 | % | | $ | 66 | | | 10.0 | % | | $ | 1,414 | |
(1)Basel III includes a capital conservation buffer that limits a banking organization’s ability to make capital distributions and discretionary bonus payments to executive officers if a banking organization fails to maintain a Common Equity Tier 1 capital conservation buffer of more than 2.5%, on a fully phased-in basis, of total risk-weighted assets above each of the following minimum risk-based capital ratio requirements: Common Equity Tier 1 capital (4.5%), Tier 1 risk-based capital (6.0%), and Total risk-based capital (8.0%).
| | |
| NOTE 14—COMMITMENTS, CONTINGENCIES AND OTHER REGULATORY MATTERS |
The Company reviews its lawsuits, regulatory inquiries and other legal proceedings on an ongoing basis and provides disclosure and records loss contingencies in accordance with the loss contingencies accounting guidance. The Company establishes an accrual for losses at management's best estimate when it assesses that it is probable that a loss has been incurred and the amount of the loss can be reasonably estimated. The Company monitors these matters for developments that would affect the likelihood of a loss and the accrued amount, if any, and adjusts the amount as appropriate.
E*TRADE Q1 2020 10-Q | Page 89
E*TRADE FINANCIAL CORPORATION
NOTES TO THE CONDENSED CONSOLIDATED FINANCIAL STATEMENTS (UNAUDITED)
Litigation Matters
On October 27, 2000, Ajaxo, Inc. (Ajaxo) filed a complaint in the Superior Court for the State of California, County of Santa Clara. Ajaxo sought damages and certain non-monetary relief for the Company’s alleged breach of a non-disclosure agreement with Ajaxo pertaining to certain wireless technology that Ajaxo offered the Company as well as damages and other relief against the Company for their alleged misappropriation of Ajaxo’s trade secrets. Following a jury trial, a judgment was entered in 2003 in favor of Ajaxo against the Company for $1 million for breach of the Ajaxo non-disclosure agreement. The trial court subsequently denied Ajaxo’s requests for additional damages and relief following which Ajaxo appealed. Although the Company paid Ajaxo the full amount due on the above-described judgment, the case was remanded back to the trial court by the California Court of Appeals, and on May 30, 2008, a jury returned a verdict in favor of the Company denying all claims raised and demands for damages against the Company. After various appeals the case was again remanded back to the trial court. Following the third trial in this matter, in a Judgment and Statement of Decision filed September 16, 2015, the Court denied all claims for royalties by Ajaxo. Ajaxo’s post-trial motions were denied. Ajaxo has appealed to the Court of Appeals, Sixth District. On April 23, 2020, the California Court of Appeals upheld the trial Court's judgment and denied all appeals by Ajaxo. The Company will continue to defend itself vigorously in this matter.
On May 13, 2019, a FINRA Dispute Resolution Statement of Claim was received on behalf of an E*TRADE customer and the customer's limited liability company. The Statement of Claim alleges that E*TRADE Securities and E*TRADE Capital Management violated Section 10(b) of the Securities Exchange Act, committed common law fraud, breached fiduciary duties, breached contractual duties, failed to supervise, and were negligent in the maintenance of the LLC’s accounts. The claim relates to margin liquidations from the LLC's accounts in February 2018. The Company intends to defend itself vigorously in this matter.
Several shareholders have filed federal lawsuits alleging that the Company violated Sections 14 and 20(a) of the Securities Exchange Act by failing to disclose material information in connection with the proxy statement / prospectus that Morgan Stanley filed on Form S-4 with the SEC on April 17, 2020. The Company believes that the claims made in these lawsuits are without merit.
In addition to the matters described above, the Company is subject to various legal proceedings and claims that arise in the normal course of business. In each pending matter, the Company contests liability or the amount of claimed damages. In view of the inherent difficulty of predicting the outcome of such matters, particularly in cases where claimants seek substantial or indeterminate damages, or where investigation or discovery have yet to be completed, the Company is unable to estimate a range of reasonably possible losses on its remaining outstanding legal proceedings; however, the Company believes any losses, both individually or in the aggregate, should not be reasonably likely to have a material adverse effect on the consolidated financial condition or results of operations of the Company.
An unfavorable outcome in any matter could have a material adverse effect on the Company’s business, financial condition, results of operations or cash flows. In addition, even if the ultimate outcomes are resolved in the Company’s favor, the defense of such litigation could entail considerable cost or the diversion of the efforts of management, either of which could have a material adverse effect on the Company’s business, financial condition, results of operations or cash flows.
Regulatory Matters
The securities, futures, foreign currency and banking industries are subject to extensive regulation under federal, state and applicable international laws. From time to time, the Company has been threatened with or named as a defendant in lawsuits, arbitrations and administrative claims involving securities, banking and other matters. The Company is also subject to periodic regulatory examinations and inspections.
E*TRADE Q1 2020 10-Q | Page 90
E*TRADE FINANCIAL CORPORATION
NOTES TO THE CONDENSED CONSOLIDATED FINANCIAL STATEMENTS (UNAUDITED)
Compliance and trading problems that are reported to regulators, such as the SEC, FINRA, NASDAQ, CFTC, NFA, FDIC, Federal Reserve Bank of Richmond, OCC, or the CFPB by dissatisfied customers or others are investigated by such regulators, and may, if pursued, result in formal claims being filed against the Company by customers or disciplinary action being taken against the Company or its employees by regulators. Any such claims or disciplinary actions that are decided against the Company could have a material impact on the financial results of the Company or any of its subsidiaries.
Insurance
The Company maintains insurance coverage that management believes is reasonable and prudent. The principal insurance coverage it maintains covers commercial general liability; property damage; hardware/software damage; cyber liability; directors and officers; employment practices liability; certain criminal acts against the Company; and errors and omissions. The Company believes that such insurance coverage is adequate for the purpose of its business. The Company’s ability to maintain this level of insurance coverage in the future, however, is subject to the availability of affordable insurance in the marketplace.
Commitments
In the normal course of business, the Company makes various commitments to extend credit and incur contingent liabilities that are not reflected in the consolidated balance sheets. Significant changes in the economy or interest rates may influence the impact that these commitments and contingencies have on the Company in the future.
The Company’s equity method investments, investments measured at cost and other investments are generally limited liability investments in partnerships, companies and other similar entities, including tax credit partnerships and community development entities, which are not required to be consolidated. The Company had $41 million in unfunded contingent investment commitments with respect to these investments at March 31, 2020.
At March 31, 2020, the Company had $13 million of certificates of deposit scheduled to mature in less than one year.
Guarantees
In prior periods when the Company sold loans, the Company provided guarantees to investors purchasing mortgage loans, which are considered standard representations and warranties within the mortgage industry. The primary guarantees are that: the mortgage and the mortgage note have been duly executed and each is the legal, valid and binding obligation of the Company, enforceable in accordance with its terms; the mortgage has been duly acknowledged and recorded and is valid; and the mortgage and the mortgage note are not subject to any right of rescission, set-off, counterclaim or defense, including, without limitation, the defense of usury, and no such right of rescission, set-off, counterclaim or defense has been asserted with respect thereto. The Company is responsible for the guarantees on loans sold. If these claims prove to be untrue, the investor can require the Company to repurchase the loan and return all loan purchase and servicing release premiums. Management does not believe the potential liability exposure will have a material impact on the Company’s results of operations, cash flows or financial condition due to the nature of the standard representations and warranties, which have resulted in a minimal amount of loan repurchases.
E*TRADE Q1 2020 10-Q | Page 91
ITEM 4. CONTROLS AND PROCEDURES
(a)Based on an evaluation under the supervision and with the participation of our management, our Chief Executive Officer and our Chief Financial Officer have concluded that the Company's disclosure controls and procedures, as defined in Rules 13a-15(e) and 15d-15(e) under the Securities Exchange Act of 1934, as amended (the Exchange Act), were effective as of the end of the period covered by this report to provide reasonable assurance that information required to be disclosed by the Company in reports that it files or submits under the Exchange Act is (i) recorded, processed, summarized and reported within the time periods specified in the Securities and Exchange Commission rules and forms and (ii) accumulated and communicated to the Company’s management, including our Chief Executive Officer and Chief Financial Officer, as appropriate to allow timely decisions regarding required disclosure.
(b)There were no changes in the Company’s internal control over financial reporting during the quarter ended March 31, 2020, identified in connection with management's evaluation required by paragraph (d) of Exchange Act Rules 13a-15 and 15d-15, that have materially affected, or are reasonably likely to materially affect, the Company’s internal control over financial reporting. We have not experienced any material impact to our internal controls over financial reporting despite transitioning nearly all of our workforce to a remote working environment as a result of the COVID-19 pandemic. We are continually monitoring and assessing the impact of COVID-19 on our internal controls to minimize the impact to their design and operating effectiveness.
E*TRADE Q1 2020 10-Q | Page 92
PART II
ITEM 1. LEGAL PROCEEDINGS
Information in response to this item can be found under the heading Litigation Matters in Note 14—Commitments, Contingencies and Other Regulatory Matters to Part I. Item 1. Condensed Consolidated Financial Statements (Unaudited) in this Quarterly Report and is incorporated by reference into this item.
ITEM 1A. RISK FACTORS
In addition to the other information set forth in this report, you should carefully consider the factors discussed in Part I. Item 1A. Risk Factors in our Annual Report on Form 10-K for the year ended December 31, 2019, as updated and supplemented below, which could materially affect our business, financial condition or future results. The risks described in this report and in our Annual Report on Form 10-K are not the only risks facing the Company. Additional risks and uncertainties not currently known to us or that we currently deem to be immaterial also may materially adversely affect our business, financial condition or future results.
Risks Related to the Proposed Merger with Morgan Stanley
On February 20, 2020, E*TRADE Financial Corporation entered into a Merger Agreement with Morgan Stanley, a Delaware corporation (Morgan Stanley), and Moon-Eagle Merger Sub, Inc., a Delaware corporation and a wholly owned subsidiary of Morgan Stanley (Merger Sub), pursuant to which Merger Sub will merge with and into the Parent Company, with the Parent Company surviving as a wholly-owned subsidiary of Morgan Stanley (Merger), subject to the terms and conditions set forth therein. The parties also intend, and Morgan Stanley has agreed to take such actions as are necessary to cause, immediately following the effective time of the Merger, the surviving corporation in the Merger to merge with and into a newly established Delaware limited liability company which is a direct, wholly owned subsidiary of Morgan Stanley (Second Merger Sub) with Second Merger Sub surviving as a direct, wholly owned subsidiary of Morgan Stanley. There are a number of risks and uncertainties relating to the Merger. Because of these risks and uncertainties, we have supplemented the risk factors previously disclosed in our Annual Report on Form 10-K for the year ended December 31, 2019, to add the below risk factors. For more information regarding the Proposed Merger, E*TRADE stockholders are encouraged to read the proxy statement / prospectus filed on Form S-4 by Morgan Stanley on April 17, 2020. Because the exchange ratio pursuant to the Merger Agreement is fixed and the market price of Morgan Stanley common stock has fluctuated and will continue to fluctuate, E*TRADE stockholders cannot be sure of the value of the consideration they will receive upon completion of the Merger or the value of the E*TRADE common stock they will give up.
Upon completion of the Merger, (i) each share of E*TRADE common stock outstanding immediately prior to the Merger (except for shares of E*TRADE common stock held by E*TRADE as treasury stock or by Morgan Stanley (other than any fiduciary shares) which will be cancelled without consideration) will automatically be converted into the right to receive 1.0432 shares of Morgan Stanley common stock (Common Merger Consideration) and (ii) each share of E*TRADE Series A Preferred Stock and E*TRADE Series B Preferred Stock outstanding immediately prior to the Merger (except for shares of E*TRADE Series A Preferred Stock and E*TRADE Series B Preferred Stock held by E*TRADE as treasury stock or by Morgan Stanley (other than any fiduciary shares) which will be cancelled without consideration) will automatically be converted into the right to receive one share of New Morgan Stanley Replacement Series A Preferred Stock or New Morgan Stanley Replacement Series B Preferred Stock, as applicable, having the
E*TRADE Q1 2020 10-Q | Page 93
terms set forth in the Merger Agreement. Because the exchange ratio is fixed, the value of the Common Merger Consideration will depend on the market price of Morgan Stanley common stock at the time the Merger is completed. The value of the Common Merger Consideration has fluctuated since the date of the announcement of the Merger Agreement and will continue to fluctuate from the date of this filing to the date of the E*TRADE special meeting and the date the Merger is completed and thereafter. Accordingly, at the time of the E*TRADE special meeting, E*TRADE stockholders will not know or be able to determine the market value of the Common Merger Consideration they would receive upon completion of the Merger. Stock price changes may result from a variety of factors, including, among others, general market and economic conditions, changes in Morgan Stanley’s and E*TRADE’s respective businesses, operations and prospects, market assessments of the likelihood that the Merger will be completed, the timing of the Merger, regulatory considerations and COVID-19. Many of these factors are beyond Morgan Stanley’s and E*TRADE’s control. You are urged to obtain current market quotations for Morgan Stanley’s common stock traded on the NYSE (trading symbol “MS”) and E*TRADE’s common stock traded on the NASDAQ (trading symbol “ETFC”).
The market price of Morgan Stanley common stock after the Merger may be affected by factors different from those affecting the market price of E*TRADE common stock.
Upon completion of the Merger, holders of shares of E*TRADE common stock will become holders of shares of Morgan Stanley common stock. The businesses of Morgan Stanley differ from those of E*TRADE in important respects, and, accordingly, the results of operations of Morgan Stanley after the Merger, as well as the market price of Morgan Stanley common stock, may be affected by factors different from those currently affecting the results of operations of E*TRADE. For further information on the respective businesses of Morgan Stanley and E*TRADE and certain factors to consider in connection with those businesses, see the documents incorporated by reference into the proxy statement / prospectus filed on Form S-4 by Morgan Stanley on April 17, 2020 and referred to in the “Where You Can Find More Information” section of the same document. Additionally, the market price of Morgan Stanley common stock may fluctuate significantly following completion of the Merger, and holders of E*TRADE common stock could lose the value of their investment in Morgan Stanley common stock. The issuance of shares of Morgan Stanley common stock in the Merger could on its own have the effect of depressing the market price for Morgan Stanley common stock. In addition, many E*TRADE stockholders may decide not to hold the shares of Morgan Stanley common stock they receive as a result of the Merger. Other E*TRADE stockholders, such as funds with limitations on their permitted holdings of stock in individual issuers, may be required to sell the shares of Morgan Stanley common stock they receive as a result of the Merger. Any such sales of Morgan Stanley common stock could have the effect of depressing the market price for Morgan Stanley common stock. Moreover, general fluctuations in stock markets could have a material adverse effect on the market for, or liquidity of, the Morgan Stanley common stock, regardless of Morgan Stanley’s actual operating performance.
After completion of the Merger, Morgan Stanley may fail to realize the anticipated benefits and cost savings of the Merger, which could adversely affect the value of Morgan Stanley common stock.
The success of the Merger will depend, in significant part, on Morgan Stanley’s ability to realize the anticipated benefits and cost savings from combining the businesses of Morgan Stanley and E*TRADE. The ability of Morgan Stanley to realize these anticipated benefits and cost savings is subject to certain risks including:
•Morgan Stanley’s ability to successfully combine the businesses of Morgan Stanley and E*TRADE
•whether the combined business will perform as expected
•the possibility that Morgan Stanley paid more for E*TRADE than the value Morgan Stanley will derive from the acquisition
E*TRADE Q1 2020 10-Q | Page 94
•the assumption of known and unknown liabilities of E*TRADE
If Morgan Stanley is not able to successfully combine the businesses of Morgan Stanley and E*TRADE within the anticipated time frame, or at all, the anticipated cost savings and other benefits of the Merger may not be realized fully, or at all, or may take longer to realize than expected, the combined business may not perform as expected and the value of the Morgan Stanley common shares (including the Common Merger Consideration) may be adversely affected.
Morgan Stanley and E*TRADE have operated and, until completion of the Merger, will continue to operate, independently, and there can be no assurances that their businesses can be integrated successfully. It is possible that the integration process could result in the loss of key Morgan Stanley or E*TRADE employees, the loss of clients, the disruption of either company's or both companies’ ongoing businesses or in unexpected integration issues, higher than expected integration costs and an overall post-completion integration process that takes longer than originally anticipated. Specifically, the following issues, among others, must be addressed in integrating the operations of Morgan Stanley and E*TRADE in order to realize the anticipated benefits of the Merger so the combined business performs as expected:
•combining certain of the companies’ operations, financial, reporting and corporate functions
•integrating the companies’ technologies
•integrating and unifying the product offerings and services available to clients
•identifying and eliminating redundant and underperforming functions and assets
•harmonizing the companies’ operating practices, employee development and compensation programs, internal controls and other policies, procedures and processes
•maintaining existing agreements with commercial counterparties and avoiding delays in entering into new agreements with prospective commercial counterparties
•addressing possible differences in business backgrounds, corporate cultures and management philosophies
•consolidating the companies’ administrative and information technology infrastructure
•coordinating sales, distribution and marketing efforts
•managing the movement of certain businesses and positions to different locations
•coordinating geographically dispersed organizations
•consolidating offices of Morgan Stanley and E*TRADE that are currently in or near the same location
•effecting potential actions that may be required in connection with obtaining regulatory approvals
In addition, at times, the attention of certain members of either company’s or both companies’ management and resources may be focused on completion of the Merger and the integration of the businesses of the two companies and diverted from day-to-day business operations, which may disrupt each company’s ongoing business and the business of the combined company.
E*TRADE Q1 2020 10-Q | Page 95
E*TRADE may have difficulty attracting, motivating and retaining executives and other employees in light of the Merger.
Uncertainty about the effect of the Merger on E*TRADE employees may impair E*TRADE’s ability to attract, retain and motivate personnel prior to and following the Merger. Employee retention may be particularly challenging during the pendency of the Merger, as employees of E*TRADE may experience uncertainty about their future roles with the combined business. If employees of E*TRADE depart, the integration of the companies may be more difficult and the combined business following the Merger may be harmed, and the anticipated benefits of the Merger may be adversely affected.
Completion of the Merger is subject to many conditions and if these conditions are not satisfied or waived, the Merger will not be completed.
The obligation of each of Morgan Stanley, E*TRADE and Merger Sub to complete the Merger is subject to the satisfaction (or, to the extent permitted by applicable law, waiver) of a number of conditions, including, among others: (i) the affirmative vote of the holders of a majority of the shares of E*TRADE common stock outstanding and entitled to vote at the E*TRADE special meeting approving and adopting the Merger Agreement (which condition described in this clause (i) may not be waived), (ii) (A) the expiration or termination of any applicable waiting period, or any extension thereof, under the Hart-Scott-Rodino Antitrust Improvements Act of 1976 (HSR Act) and (B) certain governmental filings and/or approvals having been made, obtained or received (or the waiting periods with respect thereto having expired or been terminated), as applicable (in the case of Morgan Stanley and Merger Sub’s obligations to complete the Merger, without the imposition of a Burdensome Condition (as defined in the Merger Agreement)) and there being no pending litigation or similar legal action by any governmental authority seeking to impose a Burdensome Condition, (iii) absence of (x) any applicable law or order preventing or making illegal the consummation of the Merger or any of the other transactions contemplated by the Merger Agreement and (y) any litigation or similar legal action by any governmental authority (in any jurisdiction in which Morgan Stanley, E*TRADE or any of their respective subsidiaries conducts material operations) seeking to prohibit or restrain the Merger, (iv) approval for the listing on the NYSE of the shares of Morgan Stanley common stock to be issued in the Merger, subject to official notice of issuance, (v) accuracy of the representations and warranties made in the Merger Agreement by, in the case of Morgan Stanley and Merger Sub’s obligations to complete the Merger, E*TRADE and, in the case of E*TRADE’s obligation to complete the Merger, Morgan Stanley, in each case, as of the date of the Merger Agreement and as of the date of completion of the Merger, subject to certain materiality thresholds, (vi) performance in all material respects by, in the case of Morgan Stanley and Merger Sub’s obligations to complete the Merger, E*TRADE and, in the case of E*TRADE’s obligation to complete the Merger, Morgan Stanley and Merger Sub, of the obligations required to be performed by it at or prior to the effective time of the Merger and (vii) the absence since the date of the Merger Agreement of a material adverse effect on, in the case of Morgan Stanley and Merger Sub’s obligations to complete the Merger, E*TRADE and, in the case of E*TRADE’s obligation to complete the Merger, Morgan Stanley. There can be no assurance that the conditions to the closing of the Merger will be satisfied or waived or that the Merger will be completed. See “Risk Factors—Failure to complete the Merger could negatively impact the stock price and the future business and financial results of E*TRADE.”
In order to complete the Merger, Morgan Stanley and E*TRADE must make certain governmental filings and obtain certain governmental authorizations, and if such filings and authorizations are not made or granted or are granted with conditions to the parties, the closing of the Merger may be jeopardized or the anticipated benefits of the Merger could be reduced.
The closing of the Merger is conditioned upon the expiration or termination of any applicable waiting period, or any extension thereof, under the HSR Act and other required governmental authorizations. Although Morgan Stanley and E*TRADE have agreed in the Merger Agreement to use their reasonable best efforts, subject to certain limitations, to make certain governmental filings or obtain the required governmental
E*TRADE Q1 2020 10-Q | Page 96
authorizations, as the case may be, there can be no assurance that the relevant waiting periods will expire or that the relevant authorizations will be obtained. In addition, the governmental authorities with or from which these authorizations are required have broad discretion in administering the governing regulations. Adverse developments in Morgan Stanley’s or E*TRADE’s regulatory standing or any other factors considered by regulators in granting such approvals; governmental, political or community group inquiries, investigations or opposition; or changes in legislation or the political environment generally could affect whether and when required governmental authorizations are granted. As a condition to authorization of the Merger, governmental authorities may impose requirements, limitations or costs or place restrictions on the conduct of Morgan Stanley’s business after completion of the Merger. There can be no assurance that regulators will not impose conditions, terms, obligations or restrictions and that such conditions, terms, obligations or restrictions will not have the effect of delaying the closing of the Merger or imposing additional material costs on or materially limiting the revenues of the combined company following the Merger, or otherwise adversely affecting Morgan Stanley’s businesses and results of operations after completion of the Merger. In addition, there can be no assurance that these terms, obligations or restrictions will not result in the delay or abandonment of the Merger.
E*TRADE’s business relationships may be subject to disruption due to uncertainty associated with the Merger.
Parties with which E*TRADE does business may experience uncertainty associated with the Merger, including with respect to current or future business relationships with E*TRADE or the combined business. E*TRADE’s business relationships may be subject to disruption as parties with which E*TRADE does business may attempt to negotiate changes in existing business relationships or consider entering into business relationships with parties other than E*TRADE or the combined business. These disruptions could have an adverse effect on the businesses, financial condition, results of operations or prospects of the combined business, including an adverse effect on the ability to realize the anticipated benefits of the Merger. The risk, and adverse effect, of such disruptions could be exacerbated by a delay in completion of the Merger or termination of the Merger Agreement.
The Merger Agreement limits E*TRADE’s ability to pursue alternatives to the Merger and may discourage other companies from trying to acquire E*TRADE for greater consideration than what Morgan Stanley has agreed to pay pursuant to the Merger Agreement.
The Merger Agreement contains provisions that make it more difficult for E*TRADE to sell its business to a party other than Morgan Stanley. These provisions include a general prohibition on E*TRADE soliciting any acquisition proposal or offer for a competing transaction. Further, subject to certain exceptions, the E*TRADE board of directors will not withdraw or modify in a manner adverse to Morgan Stanley the recommendation of the E*TRADE board of directors in favor of the approval and adoption of the Merger Agreement, and Morgan Stanley generally has a right to match any competing acquisition proposals that may be made. Notwithstanding the foregoing, at any time prior to the approval and adoption of the Merger Agreement by E*TRADE stockholders, the E*TRADE board of directors is permitted to withdraw or modify in a manner adverse to Morgan Stanley the recommendation of the E*TRADE board of directors in favor of the approval and adoption of the Merger Agreement in certain circumstances if it determines in good faith that the failure to take such action would be reasonably likely to be inconsistent with its fiduciary duties to E*TRADE stockholders under applicable law. The Merger Agreement does not require that E*TRADE submit the approval and adoption of the Merger Agreement to a vote of E*TRADE stockholders if the E*TRADE board of directors changes its recommendation in favor of the approval and adoption of the Merger Agreement in a manner adverse to Morgan Stanley and terminates the Merger Agreement in order to enter into an alternative acquisition agreement with respect to a competing transaction in accordance with the terms of the Merger Agreement. In certain circumstances, upon termination of the Merger Agreement, E*TRADE will be required to pay a termination fee of $375 million to Morgan Stanley, including if E*TRADE terminates the Merger Agreement prior to obtaining E*TRADE stockholder approval in order to
E*TRADE Q1 2020 10-Q | Page 97
enter into an alternative acquisition agreement with respect to a competing transaction in accordance with the terms of the Merger Agreement.
While both E*TRADE and Morgan Stanley believe these provisions and agreements are reasonable and customary and are not preclusive of other offers, the restrictions, including the added expense of the $375 million termination fee that may become payable by E*TRADE to Morgan Stanley in certain circumstances, might discourage a third party that has an interest in acquiring all or a significant part of E*TRADE from considering or proposing that acquisition, even if that party were prepared to pay consideration with a higher per share value than the consideration payable in the Merger pursuant to the Merger Agreement.
Failure to complete the Merger could negatively impact the stock price and the future business and financial results of E*TRADE.
If the Merger is not completed for any reason, including as a result of E*TRADE stockholders failing to approve the necessary proposals, the ongoing businesses of E*TRADE may be adversely affected, and without realizing any of the benefits of having completed the Merger, E*TRADE would be subject to a number of risks, including the following:
•E*TRADE may experience negative reactions from the financial markets, including negative impacts on their respective stock prices.
•E*TRADE may experience negative reactions from their respective clients, regulators and employees.
•E*TRADE will be required to pay certain costs relating to the Merger, whether or not the Merger is completed.
•the Merger Agreement places certain restrictions on the conduct of E*TRADE’s businesses prior to completion of the Merger, and such restrictions, the waiver of which is subject to the written consent of the other party (in certain cases, not to be unreasonably withheld, conditioned or delayed), and subject to certain exceptions and qualifications, may prevent E*TRADE from making certain acquisitions, taking certain other specified actions or otherwise pursuing business opportunities during the pendency of the Merger that E*TRADE would have made, taken or pursued if these restrictions were not in place.
•matters relating to the Merger (including integration planning) will require substantial commitments of time and resources by E*TRADE management, which would otherwise have been devoted to day-to-day operations and other opportunities that may have been beneficial to E*TRADE as an independent company. In the event of a termination of the Merger Agreement under certain circumstances specified in the Merger Agreement, E*TRADE may be required to pay a termination fee of $375 million to Morgan Stanley. To the extent that a termination fee is not promptly paid by E*TRADE when due, the party failing to pay the termination fee is also required to pay any reasonable and documented costs and expenses (including reasonable legal fees and expenses) incurred by the other party in connection with legal action taken to enforce the Merger Agreement that results in a judgment for such amount against the party failing to promptly pay such amount, together with interest on the unpaid fee.
There can be no assurance that the risks described above will not materialize. If any of those risks materialize, they may materially and adversely affect E*TRADE’s businesses, financial condition, financial results, ratings, stock prices and/or bond prices. In addition, E*TRADE could be subject to litigation related to any failure to complete the Merger or related to any enforcement proceeding commenced against E*TRADE to perform its obligations under the Merger Agreement. If the Merger is not completed, these risks may materialize and may adversely affect E*TRADE’s businesses, financial condition, financial results, ratings, stock prices and/or bond prices.
E*TRADE Q1 2020 10-Q | Page 98
The shares of Morgan Stanley common stock to be received by E*TRADE stockholders upon completion of the Merger will have different rights from shares of E*TRADE common stock.
Upon completion of the Merger, E*TRADE stockholders will no longer be stockholders of E*TRADE but will instead become stockholders of Morgan Stanley. E*TRADE stockholders’ rights as stockholders will continue to be governed by Delaware law but the terms of the Morgan Stanley certificate of incorporation and the Morgan Stanley bylaws are in some respects materially different than the terms of the E*TRADE certificate of incorporation and the E*TRADE bylaws, which currently govern the rights of E*TRADE stockholders.
After the Merger, E*TRADE stockholders will have a significantly lower ownership and voting interest in Morgan Stanley than they currently have in E*TRADE and will exercise less influence over management.
Morgan Stanley and E*TRADE estimate that, as of immediately following completion of the Merger, holders of Morgan Stanley common stock as of immediately prior to the Merger will hold approximately 87% and holders of E*TRADE common stock immediately prior to the merger will hold approximately 13%, of the outstanding shares of Morgan Stanley common stock (or, on a fully diluted basis, holders of Morgan Stanley common stock as of immediately prior to the Merger will hold approximately 88% and holders of E*TRADE common stock as of immediately prior to the Merger will hold approximately 12% of the shares of Morgan Stanley common stock). Consequently, former E*TRADE stockholders will have less influence over the management and policies of Morgan Stanley than they currently have over the management and policies of E*TRADE.
Lawsuits have been filed against E*TRADE and its board of directors and other lawsuits may be filed against E*TRADE, Morgan Stanley and /or their respective boards of directors challenging the Merger. An adverse ruling in any such lawsuit may prevent the Merger from being completed, or from being completed within the expected timeframe.
Six complaints have been filed on behalf of Company stockholders in the United States District Court for the District of Delaware, the United States District Court for the Southern District of New York and the United States District Court for the District of New Jersey, alleging that the registration statement filed on Form S-4 in connection with the Merger Agreement omitted material information in violation of Sections 14(a) and 20(a) of the Securities Exchange Act, rendering the registration statement filed on Form S-4 false and misleading. Among other remedies, the complaints seek to enjoin the approval and adoption of the Merger Agreement by a vote of our stockholders and the closing of the Merger, as well as damages, costs and attorneys’ fees. The Company believes that the allegations in these lawsuits are without merit. There can be no assurances that additional complaints or demands will not be filed or made with respect to the merger. If additional similar complaints or demands are filed or made, absent new or different allegations that are material, neither E*TRADE nor Morgan Stanley will necessarily announce them.
One of the conditions to completion of the Merger is the absence of any applicable law or order being in effect that prevents the completion of the Merger. Accordingly, if a plaintiff is successful in obtaining an order prohibiting completion of the Merger, then such order may prevent the Merger from being completed, or from being completed within the expected timeframe.
Morgan Stanley and E*TRADE will incur significant transaction and Merger-related costs in connection with the Merger.
Morgan Stanley and E*TRADE expect to incur a number of non-recurring costs associated with the Merger and combining the operations of the two companies. The significant, non-recurring costs associated with the Merger include, among others, fees and expenses of financial advisors and other advisors and
E*TRADE Q1 2020 10-Q | Page 99
representatives, certain employment-related costs relating to employees of E*TRADE, filing fees due in connection with filings required under the HSR Act and filing fees and printing and mailing costs for the proxy statement/prospectus. Some of these costs have already been incurred or may be incurred regardless of whether the Merger is completed, including a portion of the fees and expenses of financial advisors and other advisors and representatives and filing fees for the proxy statement/prospectus filed on Form S-4 by Morgan Stanley. Morgan Stanley also will incur transaction fees and costs related to formulating and implementing integration plans with respect to the two companies, including facilities and systems consolidation costs. Morgan Stanley continues to assess the magnitude of these costs, and additional unanticipated costs may be incurred in the Merger and the integration of the two companies’ businesses. Although Morgan Stanley expects that the elimination of duplicative costs, as well as the realization of other efficiencies related to the integration of the businesses, should allow Morgan Stanley to offset integration-related costs over time, this net benefit may not be achieved in the near term, or at all.
The Merger may not be accretive, and may be dilutive, to Morgan Stanley’s earnings per share, which may negatively affect the market price of Morgan Stanley common stock following completion of the Merger.
In connection with the completion of the Merger, Morgan Stanley expects to issue additional Morgan Stanley common shares, provided that Morgan Stanley may be required to reserve additional shares of Morgan Stanley common stock for issuance if the Merger is not completed as of January 1, 2021 and certain E*TRADE equity awards are required to be converted into equity awards of Morgan Stanley pursuant to the Merger Agreement. The issuance of new Morgan Stanley common shares could have the effect of depressing the market price of Morgan Stanley common shares. Morgan Stanley currently projects that the Merger will result in a number of benefits, including enhanced competitive positioning and a platform from which to accelerate growth, and that it will ultimately be accretive to earnings per share. This projection is based on preliminary estimates that may materially change. However, future events and conditions could reduce or delay the accretion that is currently projected or result in the Merger being dilutive to Morgan Stanley’s earnings per share, including adverse changes in market conditions, additional transaction and integration related costs and other factors such as the failure to realize some or all of the benefits anticipated in the Merger. Any dilution of, reduction in or delay of any accretion to, Morgan Stanley’s earnings per share could cause the price of shares of Morgan Stanley common stock to decline or grow at a reduced rate.
The future results of the combined company may be adversely impacted if the combined company does not effectively manage its expanded operations following completion of the Merger.
Following completion of the Merger, the size of the combined company’s business will be significantly larger than the current size of either Morgan Stanley’s or E*TRADE’s respective businesses. The combined company’s ability to successfully manage this expanded business will depend, in part, upon management’s ability to implement an effective integration of the two companies and its ability to manage a combined business with significantly larger size and scope with the associated increased costs and complexity. There can be no assurances that the management of the combined company will be successful or that the combined company will realize the expected operating efficiencies, cost savings and other benefits currently anticipated from the Merger.
E*TRADE Q1 2020 10-Q | Page 100
Risks Relating to the Nature and Operation of Our Business
The coronavirus pandemic (COVID-19) has, and will likely continue to, adversely affect our business and results of operations. The extent to which COVID-19 and measures taken in response thereto, could materially adversely affect our business, results of operations and financial condition will depend on future developments, which are highly uncertain and cannot be predicted, including the scope and duration of the outbreak and actions taken by governmental authorities to contain the financial and economic impact of the outbreak.
The emergence of a disease pandemic, such as COVID-19, or other widespread health emergencies, and related global health concerns can create, and have created, economic and financial disruptions in the global economy that adversely affect our business and results of operations. The economic and financial disruptions from the COVID-19 outbreak, as well as measures taken by various governmental authorities in response to the outbreak, have led us to implement operational changes as we have executed our business continuity plan and transitioned nearly all of our workforce to a remote working environment. We are dependent on third-party vendors for the performance of certain critical processes and such vendors are also operating under business continuity plans. These factors may impair our ability to conduct our business, particularly when coupled with the significant increase in client trading volumes and inquiries. There can be no assurance that our business continuity plans, or those of our vendors, which may include requiring a significant portion of our workforce to work remotely for an extended period of time, will fully mitigate all potential risks to us.
The COVID-19 outbreak has also weighed on the macroeconomic environment, leading to lower interest rates and equity market valuations, which has adversely affected our results of operations through reduced net interest income and other related revenues, compressed net interest margins and lower margin balances, among other factors. While increased customer engagement has driven elevated trading-based net revenues and net asset flows, we cannot be certain that such levels will persist. Prolonged disruption to the global economy may negatively impact customer engagement and could impair our customers’ ability to fulfill their credit obligations which could lead to increased losses associated with our mortgage loan portfolio, margin or other securities-based lending. The full extent to which the COVID-19 outbreak, or the emergence of another disease pandemic, and measures taken in response thereto, could materially adversely affect our business, results of operations and financial condition will depend on future developments, which are highly uncertain and cannot be predicted, including the scope and duration of the outbreak or pandemic, actions taken by governmental authorities to contain the financial and economic impact of the outbreak or pandemic, the effects on our customers, employees and third-party vendors, and the overall impact to the economy and society.
E*TRADE Q1 2020 10-Q | Page 101
ITEM 2. UNREGISTERED SALES OF EQUITY SECURITIES AND USE OF PROCEEDS
Issuer Purchases of Equity Securities
The table below shows the timing and impact of our share repurchase programs, and the shares withheld from employees to satisfy tax withholding obligations during the three months ended March 31, 2020 (dollars in millions, except share data and per share amounts):
| | | | | | | | | | | | | | | | | | | | | | | | | | |
| Period | | Total Number of Shares Purchased(1) | | Average Price Paid per Share(1)(2) | | Total Number of Shares Purchased as Part of the Publicly Announced Programs(3) | | Maximum Dollar Value of Shares That May Yet Be Purchased Under the Programs(3) |
| January 1, 2020 - January 31, 2020 | | 118 | | | $ | 46.60 | | | — | | | $ | 914 | |
| February 1, 2020 - February 29, 2020 | | 2,426,944 | | | $ | 44.23 | | | 2,143,595 | | | $ | 820 | |
| March 1, 2020 - March 31, 2020 | | 7,553 | | | $ | 36.78 | | | — | | | $ | 820 | |
| Total | | 2,434,615 | | | $ | 44.21 | | | 2,143,595 | | | |
(1)Includes 291,020 shares withheld to satisfy tax withholding obligations associated with vesting of share-based awards. The average price paid per share for shares withheld was $45.16.
(2)Excludes commission paid, if any.
(3)On July 18, 2019, the Company announced a new $1.5 billion share repurchase program that the Company is currently operating under. The Company suspended repurchases under its current program subsequent to the announcement of the proposed merger with Morgan Stanley in February 2020.
E*TRADE Q1 2020 10-Q | Page 102
ITEM 3. DEFAULTS UPON SENIOR SECURITIES
None.
ITEM 4. MINE SAFETY DISCLOSURES
Not applicable.
ITEM 5. OTHER INFORMATION
None.
ITEM 6. EXHIBITS
| | | | | | | | |
Exhibit
Number | | Description |
| | |
| | |
| | |
| | |
| | |
| | |
| | |
| | |
| | |
| | |
| | |
| | |
| | |
| | |
| | |
| | |
| | |
| | |
| | |
| | |
| | |
| | |
| | |
| | |
| | |
| | |
| | |
| | |
| | |
| | |
| | |
| | |
| | |
| | |
| | |
| | |
| | |
| | |
| | |
| | |
| | |
| | |
| | |
| | |
| | |
| | |
| | |
| | Agreement and Plan of Merger, dated as of February 20, 2020, by and among Morgan Stanley, Moon-Eagle Merger Sub, Inc., and E*TRADE Financial Corporation (incorporated by reference to Exhibit 2.1 of the Company's Form 8-K filed on February 21, 2020, Commission File Number 1-11921). |
| | |
| | Certification of Chief Executive Officer pursuant to Section 302 of the Sarbanes-Oxley Act of 2002. |
| | |
| | Certification of Chief Financial Officer pursuant to Section 302 of the Sarbanes-Oxley Act of 2002. |
| | |
| | Certification of Chief Executive Officer and Chief Financial Officer pursuant to Section 906 of the Sarbanes-Oxley Act of 2002. |
| | |
| **101.INS | | XBRL Instance Document (the instance document does not appear in the Interactive Data File because its XBRL tags are embedded within the Inline XBRL document) |
| | |
| **101.SCH | | Inline XBRL Taxonomy Extension Schema Document |
| | |
| **101.CAL | | Inline XBRL Taxonomy Extension Calculation Linkbase Document |
| | |
| **101.DEF | | Inline XBRL Taxonomy Extension Definition Linkbase Document |
| | |
| **101.LAB | | Inline XBRL Taxonomy Extension Label Linkbase Document |
| | |
| **101.PRE | | Inline XBRL Taxonomy Extension Presentation Linkbase Document |
| | |
| **104 | | Cover Page Interactive Data File (formatted as Inline XBRL and contained in Exhibit 101) |
| | | | | | | | | | | |
| | | |
| * | The schedules and exhibits have been omitted pursuant to Item 601(b)(2) of Regulation S-K. The Company agrees to furnish supplementally a copy of such exhibits, or any section thereof, to the SEC upon request. | | |
| ** | Filed herewith. | | |
| | | |
E*TRADE Q1 2020 10-Q | Page 103
SIGNATURES
Pursuant to the requirements of Section 13 or 15(d) of the Securities Exchange Act of 1934, the registrant has duly caused this report to be signed on its behalf by the undersigned, thereunto duly authorized.
Dated: May 6, 2020
| | | | | | | | |
| | |
E*TRADE Financial Corporation
(Registrant) | | |
| | |
| By | | /S/ MICHAEL A. PIZZI |
| | Michael A. Pizzi |
| | Chief Executive Officer |
| | (Principal Executive Officer) |
| | |
| By | | /S/ CHAD E. TURNER |
| | Chad E. Turner |
| | Chief Financial Officer |
| | (Principal Financial Officer) |
| | |
| By | | /S/ DIRK W. WYCKOFF |
| | Dirk W. Wyckoff |
| | Corporate Controller |
| | (Principal Accounting Officer) |
E*TRADE Q1 2020 10-Q | Page 104