EXHIBIT 99.1

Pegasystems Announces Financial Results for the Second Quarter of 2018
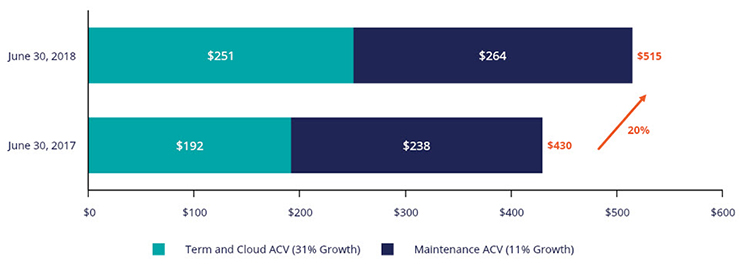
| • | Term and cloud ACV grows 31% driving total ACV growth of 20% year over year |
| • | For the first time in Pega’s history cloud exceeds 50% of new client commitments in the first half |
| • | In the first half cloud revenue grows 56% |
CAMBRIDGE, Mass. — August 8, 2018 — Pegasystems Inc. (NASDAQ: PEGA), the software company empowering customer engagement at the world’s leading enterprises, today announced its financial results for the second quarter of 2018.
“Our unique combination of customer engagement and digital process automation software continues to provide us a competitive advantage,” said Alan Trefler, founder and CEO, Pegasystems. “We’re pleased to see the acceleration in our clients’ move to the cloud and more recurring arrangements, which is a positive long-term trend for our business.”
“As we focused on driving much higher levels of recurring contract value and further penetration into the cloud, we set aggressive goals,” said Ken Stillwell, CFO and Chief Administrative Officer. “I am very pleased to see our movement into recurring and cloud happen even faster than we anticipated. In the first half of 2018, more than 50% of our new client arrangements were cloud arrangements. A natural consequence of increasing ratable cloud arrangements is a reduction in reported revenue growth for the period. At the same time, our 31% year over year growth in term and cloud ACV highlights our underlying business momentum while in this transition.”
Select financial and performance metrics (1)
| (Dollars in thousands, except per share amounts) |
Three Months Ended June 30, |
Six Months Ended June 30, |
||||||||||||||||||||||
|
|
|
|
|
|||||||||||||||||||||
| 2018 | 2017 | Change | 2018 | 2017 | Change | |||||||||||||||||||
| Total revenue (GAAP and Non-GAAP) |
$ | 196,779 | $ | 186,596 | 5 | % | $ | 431,961 | $ | 442,905 | (2 | %) | ||||||||||||
| Net (loss)/income (GAAP) |
$ | (10,409 | ) | $ | 3,702 | (381 | %) | $ | 1,791 | $ | 56,665 | (97 | %) | |||||||||||
| Net (loss)/income (Non-GAAP) |
$ | (297 | ) | $ | 4,268 | (107 | %) | $ | 19,955 | $ | 58,338 | (66 | %) | |||||||||||
| Diluted (loss)/earnings per share (GAAP) |
$ | (0.13 | ) | $ | 0.04 | (425 | %) | $ | 0.02 | $ | 0.69 | (97 | %) | |||||||||||
| Diluted earnings per share (Non-GAAP) |
$ | 0.00 | $ | 0.05 | (100 | %) | $ | 0.24 | $ | 0.71 | (66 | %) | ||||||||||||
| Cash provided by operating activities (GAAP and Non-GAAP) |
$ | 75,432 | $ | 85,769 | (12 | %) | ||||||||||||||||||
| (1) | A reconciliation of our Non-GAAP to GAAP measures is contained in the financial schedules at the end of this release. On January 1, 2018 we adopted the ASC 606 revenue recognition standard and have adjusted prior periods to conform. |
Annual contract value (ACV) (1)
| (1) | ACV, as of a given date, is the sum of the following two components: |
| • | The sum of the annual value of each term and cloud contract in effect on such date, with the annual value of a term or cloud contract being equal to the total value of the contract divided by the total number of years of the contract. |
| • | Maintenance revenue reported for the quarter ended on such date, multiplied by four. |
1
Committed not yet recognized revenue
We expect to recognize revenue for existing contracts in the future as follows:
| June 30, 2018 |
||||||||||||||||||||||||
| (in thousands) | Perpetual license |
Term license |
Maintenance | Cloud | Consulting and training |
Total | ||||||||||||||||||
| Remainder of 2018 |
$ | 28,626 | $ | 20,457 | $ | 111,086 | $ | 41,036 | $ | 12,039 | $ | 213,244 | ||||||||||||
| 2019 |
15,862 | 9,878 | 43,837 | 66,529 | 4,103 | 140,209 | ||||||||||||||||||
| 2020 |
2,423 | 5,665 | 5,265 | 50,250 | — | 63,603 | ||||||||||||||||||
| 2021 and thereafter |
362 | 944 | 2,103 | 55,995 | 200 | 59,604 | ||||||||||||||||||
|
|
|
|
|
|
|
|
|
|
|
|
|
|||||||||||||
| $ | 47,273 | $ | 36,944 | $ | 162,291 | $ | 213,810 | $ | 16,342 | $ | 476,660 | |||||||||||||
|
|
|
|
|
|
|
|
|
|
|
|
|
|||||||||||||
Quarterly conference call
Pegasystems will host a conference call and audio-only webcast associated with this announcement at 5:00 p.m. EDT today.
A live audio webcast of the conference call, together with detailed financial information, can be accessed through the investor information page of the Company’s website at www.pega.com/about/investors.
Dial-in information is as follows: (800) 263-0877 (domestic) or (646) 828-8143 (international).
To listen to the webcast, log onto www.pega.com/about/investors at least five minutes prior to the event’s broadcast and click on the webcast icon in the Investors section. A replay of the call will also be available on www.pega.com/about/investors by clicking the earnings calls link in the Investors section.
Discussion of non-GAAP financial measures
To supplement our financial results presented in accordance with generally accepted accounting principles in the U.S. (“GAAP”), the Company provides non-GAAP measures, including in this release. Pegasystems’ management utilizes a number of different financial measures, both GAAP and non-GAAP, in analyzing and assessing the overall performance of the business, for making operating decisions, and for forecasting and planning for future periods. The Company’s annual financial plan is prepared on both a GAAP and non-GAAP basis, and both are approved by our board of directors. In addition, and as a consequence of the importance of these measures in managing the business, the Company uses non-GAAP measures and financial performance results in the evaluation process to establish management’s compensation.
The non-GAAP measures exclude the effects of certain business combination accounting entries, stock-based compensation expense, amortization of intangible assets, acquisition-related and restructuring expenses, and certain other adjustments. The Company believes these non-GAAP measures are helpful in understanding its past financial performance and its anticipated future results. These non-GAAP financial measures are not meant to be considered in isolation or as a substitute for comparable GAAP measures and should be read only in conjunction with the Company’s consolidated financial statements prepared in accordance with GAAP.
2
A reconciliation of the Company’s GAAP to non-GAAP measures is included in the financial schedules at the end of this release.
Forward-looking statements
Certain statements contained in this press release may be construed as “forward-looking statements” as defined in the Private Securities Litigation Reform Act of 1995.
These forward-looking statements are based on current expectations, estimates, forecasts, and projections about the industry and markets in which we operate, and management’s beliefs and assumptions. In addition, other written or oral statements that constitute forward-looking statements may be made by us or on our behalf. Words such as “expect,” “anticipate,” “intend,” “plan,” “believe,” “could,” “estimate,” “may,” “target,” “strategy,” “is intended to,” “project,” “guidance,” “likely,” “usually,” or variations of such words and similar expressions are intended to identify such forward-looking statements.
These statements are not guarantees of future performance and involve certain risks, uncertainties, and assumptions that are difficult to predict. Important factors that could cause actual future activities and results to differ materially from those expressed in such forward-looking statements include, among others, variation in demand for our products and services; reliance on third party relationships; our beliefs and the timing of the completion of our analysis regarding the impact of the Tax Cuts and Jobs Act of 2017, including its impact on income tax expense and deferred tax assets; the inherent risks associated with international operations and the continued uncertainties in the global economy; our continued effort to market and sell both domestically and internationally; foreign currency exchange rates; the financial impact of any future acquisitions; the potential legal and financial liabilities and reputation damage due to cyber-attacks and security breaches; and management of our growth. These risks and other factors that could cause actual results to differ materially from those expressed in such forward-looking statements, are described more completely in Part I of our Annual Report on Form 10-K for the year ended December 31, 2017, as well as other filings we make with the U.S. Securities and Exchange Commission (“SEC”). These documents are available on the Company’s website at www.pega.com/about/investors.
The forward-looking statements contained in this press release represent the Company’s views as of August 8, 2018. Investors are cautioned not to place undue reliance on such forward-looking statements and there are no assurances that the results contained in such statements will be achieved. Although subsequent events may cause our view to change, except as required by applicable law, we do not undertake and specifically disclaim any obligation to publicly update or revise these forward-looking statements whether as the result of new information, future events, or otherwise. The statements should therefore not be relied upon as representing the Company’s view as of any date subsequent to August 8, 2018.
About Pegasystems
Pegasystems Inc. is the leader in software for customer engagement and operational excellence. Pega’s adaptive, cloud-architected software - built on its unified Pega Platform™ - empowers people to rapidly deploy, and easily extend and change applications to meet strategic business needs. Over its 35-year history, Pega has delivered award-winning capabilities in CRM and digital process automation (DPA), powered by advanced artificial intelligence and robotic automation, to help the world’s leading brands achieve breakthrough business results. For more information on Pegasystems (NASDAQ: PEGA) visit www.pega.com.
Press Contact:
Ilena Ryan
Pegasystems Inc.
ilena.ryan@pega.com
(617) 866-6022
Twitter: @pega
3
Investor Contact:
Garo Toomajanian
ICR for Pegasystems
PegaInvestorRelations@pega.com
(617) 866-6077
All trademarks are the property of their respective owners.
4
PEGASYSTEMS INC.
UNAUDITED CONDENSED CONSOLIDATED STATEMENTS OF OPERATIONS (1)
(in thousands, except per share amounts)
| Three Months Ended June 30, |
Six Months Ended June 30, |
|||||||||||||||
| 2018 | 2017 | 2018 | 2017 | |||||||||||||
| Revenue |
||||||||||||||||
| Software license |
$ | 44,784 | $ | 51,150 | $ | 132,557 | $ | 178,158 | ||||||||
| Maintenance |
65,906 | 59,424 | 130,431 | 118,137 | ||||||||||||
| Services |
86,089 | 76,022 | 168,973 | 146,610 | ||||||||||||
|
|
|
|
|
|
|
|
|
|||||||||
| Total revenue |
196,779 | 186,596 | 431,961 | 442,905 | ||||||||||||
|
|
|
|
|
|
|
|
|
|||||||||
| Cost of revenue |
||||||||||||||||
| Software license |
1,262 | 1,250 | 2,517 | 2,550 | ||||||||||||
| Maintenance |
5,874 | 7,011 | 11,956 | 14,229 | ||||||||||||
| Services |
66,681 | 59,614 | 134,958 | 119,186 | ||||||||||||
|
|
|
|
|
|
|
|
|
|||||||||
| Total cost of revenue |
73,817 | 67,875 | 149,431 | 135,965 | ||||||||||||
|
|
|
|
|
|
|
|
|
|||||||||
| Gross profit |
122,962 | 118,721 | 282,530 | 306,940 | ||||||||||||
|
|
|
|
|
|
|
|
|
|||||||||
| Operating expenses |
||||||||||||||||
| Selling and marketing |
93,972 | 75,200 | 182,355 | 144,881 | ||||||||||||
| Research and development |
41,972 | 39,762 | 88,757 | 80,058 | ||||||||||||
| General and administrative |
10,181 | 12,706 | 26,645 | 25,041 | ||||||||||||
|
|
|
|
|
|
|
|
|
|||||||||
| Total operating expenses |
146,125 | 127,668 | 297,757 | 249,980 | ||||||||||||
|
|
|
|
|
|
|
|
|
|||||||||
| (Loss)/income from operations |
(23,163 | ) | (8,947 | ) | (15,227 | ) | 56,960 | |||||||||
|
|
|
|
|
|
|
|
|
|||||||||
| Foreign currency transaction gain/(loss) |
1,244 | (2,242 | ) | 159 | (1,497 | ) | ||||||||||
| Interest income, net |
629 | 202 | 1,393 | 407 | ||||||||||||
| Other income, net |
— | 566 | 363 | 287 | ||||||||||||
|
|
|
|
|
|
|
|
|
|||||||||
| (Loss)/income before (benefit) from income taxes |
(21,290 | ) | (10,421 | ) | (13,312 | ) | 56,157 | |||||||||
| (Benefit) from income taxes |
(10,881 | ) | (14,123 | ) | (15,103 | ) | (508 | ) | ||||||||
|
|
|
|
|
|
|
|
|
|||||||||
| Net (loss)/income |
$ | (10,409 | ) | $ | 3,702 | $ | 1,791 | $ | 56,665 | |||||||
|
|
|
|
|
|
|
|
|
|||||||||
| (Loss)/earnings per share |
||||||||||||||||
| Basic |
$ | (0.13 | ) | $ | 0.05 | $ | 0.02 | $ | 0.74 | |||||||
| Diluted |
$ | (0.13 | ) | $ | 0.04 | $ | 0.02 | $ | 0.69 | |||||||
| Weighted-average number of common shares outstanding |
||||||||||||||||
| Basic |
78,635 | 77,313 | 78,436 | 77,039 | ||||||||||||
| Diluted |
78,635 | 82,945 | 83,247 | 82,412 | ||||||||||||
| Cash dividends declared per share |
$ | 0.03 | $ | 0.03 | $ | 0.06 | $ | 0.06 | ||||||||
| (1) | On January 1, 2018 we adopted the ASC 606 revenue recognition standard and have adjusted prior periods to conform. |
5
PEGASYSTEMS INC.
UNAUDITED RECONCILIATION OF SELECTED GAAP MEASURES TO NON-GAAP MEASURES (1)(4)
(in thousands, except percentages and per share amounts)
| Three Months Ended June 30, |
Six Months Ended June 30, |
|||||||||||||||||||||||
| 2018 | 2017 | Change | 2018 | 2017 | Change | |||||||||||||||||||
| Total revenue (GAAP and Non-GAAP) |
$ | 196,779 | $ | 186,596 | 5 | % | $ | 431,961 | $ | 442,905 | (2 | %) | ||||||||||||
| Gross profit (GAAP) |
$ | 122,962 | $ | 118,721 | 4 | % | $ | 282,530 | $ | 306,940 | (8 | %) | ||||||||||||
| Amortization of intangible assets |
1,231 | 1,305 | 2,463 | 2,639 | ||||||||||||||||||||
| Stock-based compensation(2) |
4,257 | 3,677 | 7,958 | 7,299 | ||||||||||||||||||||
|
|
|
|
|
|
|
|
|
|||||||||||||||||
| Gross profit (Non-GAAP) |
$ | 128,450 | $ | 123,703 | 4 | % | $ | 292,951 | $ | 316,878 | (8 | %) | ||||||||||||
|
|
|
|
|
|
|
|
|
|||||||||||||||||
| (Loss)/income from operations (GAAP) |
$ | (23,163 | ) | $ | (8,947 | ) | 159 | % | $ | (15,227 | ) | $ | 56,960 | (127 | %) | |||||||||
| Amortization of intangible assets |
2,836 | 3,174 | 5,673 | 6,374 | ||||||||||||||||||||
| Stock-based compensation(2) |
16,056 | 13,932 | 31,165 | 26,440 | ||||||||||||||||||||
|
|
|
|
|
|
|
|
|
|||||||||||||||||
| (Loss)/income from operations (Non-GAAP) |
$ | (4,271 | ) | $ | 8,159 | (152 | %) | $ | 21,611 | $ | 89,774 | (76 | %) | |||||||||||
|
|
|
|
|
|
|
|
|
|||||||||||||||||
| Net (loss)/income (GAAP) |
$ | (10,409 | ) | $ | 3,702 | (381 | %) | $ | 1,791 | $ | 56,665 | (97 | %) | |||||||||||
| Amortization of intangible assets |
2,836 | 3,174 | 5,673 | 6,374 | ||||||||||||||||||||
| Stock-based compensation(2) |
16,056 | 13,932 | 31,165 | 26,440 | ||||||||||||||||||||
| Income tax effects (3) |
(8,780 | ) | (16,540 | ) | (18,674 | ) | (31,141 | ) | ||||||||||||||||
|
|
|
|
|
|
|
|
|
|||||||||||||||||
| Net (loss)/income (Non-GAAP) |
$ | (297 | ) | $ | 4,268 | (107 | %) | $ | 19,955 | $ | 58,338 | (66 | %) | |||||||||||
|
|
|
|
|
|
|
|
|
|||||||||||||||||
| Diluted (loss)/earnings per share (GAAP) |
$ | (0.13 | ) | $ | 0.04 | (425 | %) | $ | 0.02 | $ | 0.69 | (97 | %) | |||||||||||
| Amortization of intangible assets |
0.04 | 0.04 | 0.07 | 0.08 | ||||||||||||||||||||
| Stock-based compensation (2) |
0.20 | 0.17 | 0.37 | 0.32 | ||||||||||||||||||||
| Income tax effects (3) |
(0.11 | ) | (0.20 | ) | (0.22 | ) | (0.38 | ) | ||||||||||||||||
|
|
|
|
|
|
|
|
|
|||||||||||||||||
| Diluted earnings per share (Non-GAAP) |
$ | 0.00 | $ | 0.05 | (100 | %) | $ | 0.24 | $ | 0.71 | (66 | %) | ||||||||||||
|
|
|
|
|
|
|
|
|
|||||||||||||||||
| Diluted weighted-average number of common shares outstanding (GAAP and Non-GAAP) |
78,635 | 82,945 | (5 | %) | 83,247 | 82,412 | 1 | % | ||||||||||||||||
| (1) | Our non-GAAP financial measures are not meant to be considered in isolation or as a substitute for comparable GAAP measures, and should be read only in conjunction with our consolidated financial statements prepared in accordance with GAAP. For a detailed explanation of the adjustments made to comparable GAAP measures, the reasons why management uses these measures, the usefulness of these measures, and the material limitations on the usefulness of these measures, see disclosure under “Discussion of non-GAAP financial measures” included earlier in this release and below. |
Our non-GAAP financial measures reflect adjustments based on the following items, as well as the related income tax effects:
| • | Amortization of intangible assets: We have excluded the amortization expense of intangible assets from our non-GAAP operating expenses and profitability measures. Amortization of intangible assets is inconsistent in amount and frequency and is significantly affected by the timing and size of our acquisitions. Investors should note that the use of intangible assets contributed to our revenues recognized during the periods presented and is expected to contribute to our future period revenues as well. Amortization of intangible assets will recur in future periods. |
| • | Stock-based compensation: We have excluded stock-based compensation expense from our non-GAAP operating expenses and profitability measures. Although stock-based compensation is a key incentive offered to our employees, and we believe such compensation contributed to the revenues recognized during the periods presented and will contribute to the generation of future period revenues, we continue to evaluate our business performance excluding stock-based compensation expense. |
6
| (2) | Stock-based compensation was as follows: |
| Three Months Ended June 30, |
Six Months Ended June 30, |
|||||||||||||||
| (in thousands) | 2018 | 2017 | 2018 | 2017 | ||||||||||||
| Cost of revenues |
$ | 4,257 | $ | 3,677 | $ | 7,958 | $ | 7,299 | ||||||||
| Selling and marketing |
6,038 | 4,101 | 10,696 | 7,506 | ||||||||||||
| Research and development |
3,802 | 3,575 | 7,439 | 6,887 | ||||||||||||
| General and administrative |
1,959 | 2,579 | 5,072 | 4,748 | ||||||||||||
|
|
|
|
|
|
|
|
|
|||||||||
| $ | 16,056 | $ | 13,932 | $ | 31,165 | $ | 26,440 | |||||||||
|
|
|
|
|
|
|
|
|
|||||||||
| Income tax benefit |
$ | (3,341 | ) | $ | (4,287 | ) | $ | (6,482 | ) | $ | (8,102 | ) | ||||
| (3) | The effective income tax rates were as follows: |
| Six Months Ended June 30, |
||||||||
| 2018 | 2017 | |||||||
| Effective income tax rate (GAAP) |
113 | % | (1 | )% | ||||
| Effective income tax rate (Non-GAAP) |
15 | % | 34 | % | ||||
The difference between our GAAP and non-GAAP effective income tax rates for the six months ended June 30, 2018 and 2017 primarily related to the impact of the following items on our GAAP effective income tax rate:
| • | Excess tax benefits generated by our stock-based compensation plans; |
| • | Tax credits for stock-based compensation awards to research and development employees; and |
| • | Unfavorable foreign stock-based compensation adjustments. |
| (4) | On January 1, 2018 we adopted the ASC 606 revenue recognition standard and have adjusted prior periods to conform. |
7
PEGASYSTEMS INC.
UNAUDITED CONDENSED CONSOLIDATED BALANCE SHEETS (1)
(in thousands)
| June 30, 2018 |
December 31, 2017 |
|||||||
| Assets |
||||||||
| Total cash, cash equivalents, and marketable securities |
$ | 243,583 | $ | 223,748 | ||||
| Total receivables (billed and unbilled) |
462,068 | 542,341 | ||||||
| Goodwill |
72,911 | 72,952 | ||||||
| Other assets |
194,478 | 172,526 | ||||||
|
|
|
|
|
|||||
| Total assets |
$ | 973,040 | $ | 1,011,567 | ||||
|
|
|
|
|
|||||
| Liabilities and stockholders’ equity |
||||||||
| Accrued expenses, including compensation and related expenses |
$ | 93,573 | $ | 111,548 | ||||
| Short-term deferred revenue |
163,525 | 166,297 | ||||||
| Deferred income tax liabilities |
38,208 | 38,463 | ||||||
| Other liabilities |
38,562 | 41,022 | ||||||
| Stockholders’ equity |
639,172 | 654,237 | ||||||
|
|
|
|
|
|||||
| Total liabilities and stockholders’ equity |
$ | 973,040 | $ | 1,011,567 | ||||
|
|
|
|
|
|||||
| (1) | On January 1, 2018 we adopted the ASC 606 revenue recognition standard and have adjusted prior periods to conform. |
PEGASYSTEMS INC.
UNAUDITED CONDENSED CONSOLIDATED STATEMENTS OF CASH FLOWS (1)
(in thousands)
| Six Months Ended June 30, |
||||||||
| 2018 | 2017 | |||||||
| Operating activities: |
||||||||
| Net income |
$ | 1,791 | $ | 56,665 | ||||
| Adjustments to reconcile net income to cash provided by operating activities: |
||||||||
| Change in operating assets and liabilities, net |
30,158 | (14,874 | ) | |||||
| Stock-based compensation expense |
31,165 | 26,440 | ||||||
| Depreciation and amortization of intangible assets |
12,474 | 12,356 | ||||||
| Other non-cash |
(156 | ) | 5,182 | |||||
|
|
|
|
|
|||||
| Cash provided by operating activities |
75,432 | 85,769 | ||||||
| Cash used in investing activities |
(46,369 | ) | (1,159 | ) | ||||
| Cash used in financing activities |
(45,825 | ) | (34,860 | ) | ||||
| Effect of exchange rates on cash and cash equivalents |
(1,226 | ) | 1,282 | |||||
|
|
|
|
|
|||||
| Net (decrease)/increase in cash and cash equivalents |
$ | (17,988 | ) | $ | 51,032 | |||
|
|
|
|
|
|||||
| Cash and cash equivalents, beginning of period |
$ | 162,279 | $ | 70,594 | ||||
|
|
|
|
|
|||||
| Cash and cash equivalents, end of period |
$ | 144,291 | $ | 121,626 | ||||
|
|
|
|
|
|||||
| (1) | On January 1, 2018 we adopted the ASC 606 revenue recognition standard and have adjusted prior periods to conform. |
8