| FREE WRITING PROSPECTUS | ||
| FILED PURSUANT TO RULE 433 | ||
| REGISTRATION FILE NO.: 333-260277-05 | ||
January 16, 2024
FREE WRITING PROSPECTUS
STRUCTURAL AND COLLATERAL TERM SHEET
$884,808,617
(Approximate Total Mortgage Pool Balance)
$785,919,000
(Approximate Offered Certificates)
| Benchmark 2024-V5 |
Deutsche Mortgage & Asset Receiving Corporation
Depositor
German American Capital Corporation
Citi Real Estate Funding Inc.
Barclays Capital Real Estate Inc.
Goldman Sachs Mortgage Company
Bank of Montreal
Sponsors and Mortgage Loan Sellers
| Deutsche Bank Securities | Barclays | BMO Capital Markets | Goldman Sachs & Co. LLC | Citigroup |
Co-Lead Managers and Joint Bookrunners
| Academy Securities | Drexel Hamilton |
Co-Managers
The depositor has filed a registration statement (including the prospectus) with the Securities and Exchange Commission (File No. 333-260277) for the offering to which this communication relates. Before you invest, you should read the prospectus in the registration statement and other documents the depositor has filed with the Securities and Exchange Commission for more complete information about the depositor, the issuing entity and this offering. You may get these documents for free by visiting EDGAR on the Securities and Exchange Commission website at www.sec.gov. Alternatively, the depositor or Deutsche Bank Securities Inc., any other underwriter, or any dealer participating in this offering will arrange to send you the prospectus if you request it by calling toll-free 1-800-503- 4611 or by emailing: prospectus.cpdg@db.com. The offered certificates referred to in these materials, and the asset pool backing them, are subject to modification or revision (including the possibility that one or more classes of certificates may be split, combined or eliminated at any time prior to issuance or availability of a final prospectus) and are offered on a “when, as and if issued” basis. You understand that, when you are considering the purchase of these certificates, a contract of sale will come into being no sooner than the date on which the relevant class has been priced and we have verified the allocation of certificates to be made to you; any “indications of interest” expressed by you, and any “soft circles” generated by us, will not create binding contractual obligations for you or us. This free writing prospectus does not contain all information that is required to be included in the prospectus.
|
Benchmark 2024-V5 Mortgage Trust |
| KEY FEATURES OF SECURITIZATION |
| Capitalized terms used but not defined herein have the meanings assigned to them in the Preliminary Prospectus expected to be dated January 16, 2024 relating to the offered certificates (hereinafter referred to as the “Preliminary Prospectus”). |
| Offering Terms: | |
| Co-Lead Managers and Joint Bookrunners: | Deutsche Bank Securities Inc., Citigroup Global Markets Inc., Barclays Capital Inc., Goldman Sachs & Co. LLC and BMO Capital Markets Corp. |
| Co-Managers: | Academy Securities, Inc. and Drexel Hamilton, LLC |
| Sponsors and Mortgage Loan Sellers: | German American Capital Corporation* (“GACC”) (23.8%), Citi Real Estate Funding Inc. (“CREFI”) (35.2%), Barclays Capital Real Estate Inc. (“BCREI”) (15.8%), Goldman Sachs Mortgage Company (“GSMC”) (13.0%) and Bank of Montreal (“BMO”) (12.2%) *An indirect wholly owned subsidiary of Deutsche Bank AG |
| Master Servicer: | Midland Loan Services, a Division of PNC Bank, National Association |
| Operating Advisor: | BellOak, LLC |
| Asset Representations Reviewer: | BellOak, LLC |
| Special Servicer: | Rialto Capital Advisors, LLC |
| Certificate Administrator: | Computershare Trust Company, N.A. |
| Trustee: | Computershare Trust Company, N.A. |
| Rating Agencies: | S&P Global Ratings (“S&P”), Fitch Ratings, Inc. (“Fitch”) and Kroll Bond Rating Agency, LLC (“KBRA”). |
| Credit Risk Retention: | For a discussion on the manner in which the U.S. credit risk retention requirements are being satisfied by GACC, as retaining sponsor, see “Credit Risk Retention” in the Preliminary Prospectus. Note that this securitization transaction is not being structured to satisfy EU/UK risk retention and due diligence requirements. |
| Determination Date: | 6th day of each month, or if such 6th day is not a business day, the immediately following business day, commencing in February 2024. |
| Distribution Date: | 4th business day following the Determination Date in each month, commencing in February 2024. |
| Cut-off Date: | With respect to each mortgage loan, the later of the related payment date of such mortgage loan in January 2024 (or, in the case of any mortgage loan that has its first due date subsequent to January 2024, the date that would have been its due date in January 2024 under the terms of that mortgage loan if a monthly payment were scheduled to be due in that month) and the date of origination of such mortgage loan. Unless otherwise noted, all mortgage loan statistics are based on balances as of the Cut-off Date. |
| Closing Date: | On or about January 31, 2024 |
| Settlement Terms: | DTC, Euroclear and Clearstream, same day funds, with accrued interest. |
| ERISA Eligible: | All of the Offered Certificates are expected to be ERISA eligible. |
| SMMEA Eligible: | None of the Offered Certificates will be SMMEA eligible. |
| Day Count: | 30/360 |
| Tax Treatment: | REMIC |
| Rated Final Distribution Date: | January 2057 |
| Minimum Denominations: | $10,000 (for each class of offered principal balance certificates) and $100,000 (for each class of offered interest-only certificates) and in each case in multiples of $1 thereafter. |
| Clean-up Call: | 1% (with certain exceptions described under “Pooling and Servicing Agreement—Termination; Retirement of Certificates” in the Preliminary Prospectus) |
| Distribution of Collateral by Property Type |

| THE INFORMATION IN THIS STRUCTURAL AND COLLATERAL TERM SHEET IS NOT COMPLETE AND MAY BE AMENDED PRIOR TO THE TIME OF SALE. THIS TERM SHEET IS NOT AN OFFER TO SELL THESE SECURITIES AND IT IS NOT A SOLICITATION OF AN OFFER TO BUY THESE SECURITIES IN ANY JURISDICTION WHERE THE OFFER OR SALE IS NOT PERMITTED. | ||
| 2 | ||
Benchmark 2024-V5 Mortgage Trust |
| OVERVIEW OF MORTGAGE POOL CHARACTERISTICS |
| Mortgage Loan Sellers |
Number of Mortgage Loans |
Number of Mortgaged Properties |
Aggregate Cut-off Date Balance |
% of Initial Outstanding Pool Balance |
Roll-up Aggregate Cut-off Date Balance |
Roll-up Aggregate % of Initial Outstanding Pool Balance | ||
| German American Capital Corporation | 5 | 5 | $95,290,000 | 10.8% | $210,290,000 | 23.8% | ||
| Citi Real Estate Funding Inc. | 14 | 62 | $296,460,000 | 33.5% | $311,460,000 | 35.2% | ||
| Barclays Capital Real Estate Inc. | 7 | 11 | $139,481,667 | 15.8% | $139,481,667 | 15.8% | ||
| Goldman Sachs Mortgage Company | 2 | 8 | $51,366,950 | 5.8% | $115,326,950 | 13.0% | ||
| Bank of Montreal | 4 | 7 | $63,250,000 | 7.1% | $108,250,000 | 12.2% | ||
| German American Capital Corporation / Goldman Sachs Mortgage Company(1) | 2 | 2 | $118,960,000 | 13.4% | ||||
| German American Capital Corporation / Bank of Montreal(2) | 1 | 6 | $60,000,000 | 6.8% | ||||
| Bank of Montreal / German American Capital Corporation / Citi Real Estate Funding Inc.(3) | 1 | 1 | $60,000,000 | 6.8% | ||||
| Total: | 36 | 102 | $884,808,617 | 100.0% | ||||
|
Collateral Facts |
||||||||
| Initial Outstanding Pool Balance: | $884,808,617 | |||||||
| Number of Mortgage Loans: | 36 | |||||||
| Number of Mortgaged Properties: | 102 | |||||||
| Average Mortgage Loan Cut-off Date Balance: | $24,578,017 | |||||||
| Weighted Average Mortgage Rate: | 6.99234% | |||||||
| Weighted Average Mortgage Loan Original Term to Maturity Date (months) (10): | 60 | |||||||
| Weighted Average Mortgage Loan Remaining Term to Maturity Date (months)(10): | 60 | |||||||
| Weighted Average Mortgage Loan Seasoning (months): | 0 | |||||||
| % of Mortgaged Properties Leased to a Single Tenant: | 15.8% | |||||||
|
Credit Statistics(4) |
||||||||
| Weighted Average Mortgage Loan U/W NCF DSCR: | 1.71x | |||||||
| Weighted Average Mortgage Loan Cut-off Date LTV(5): | 55.6% | |||||||
| Weighted Average Mortgage Loan Maturity Date LTV(5): | 55.6% | |||||||
| Weighted Average U/W NOI Debt Yield: | 12.7% | |||||||
|
Amortization Overview |
||||||||
| % Mortgage Loans with Amortization through Maturity Date: | 1.0% | |||||||
| % Mortgage Loans which pay Interest Only through Maturity Date: | 99.0% | |||||||
| % Mortgage Loans which pay Interest Only followed by Amortization through Maturity Date: | 0.0% | |||||||
| Weighted Average Remaining Amortization Term (months)(6): | 360 | |||||||
|
Loan Structural Features |
||||||||
| % Mortgage Loans with Upfront or Ongoing Tax Reserves: | 57.8% | |||||||
| % Mortgage Loans with Upfront or Ongoing Insurance Reserves: | 45.9% | |||||||
| % Mortgage Loans with Upfront or Ongoing Replacement Reserves(7): | 68.0% | |||||||
| % Mortgage Loans with Upfront or Ongoing TI/LC Reserves(8): | 21.5% | |||||||
| % Mortgage Loans with In Place Hard Lockboxes: | 46.7% | |||||||
| % Mortgage Loans with Cash Traps Triggered at DSCR Levels ≥ 1.05x: | 75.2% | |||||||
| % Mortgage Loans with Cash Traps Triggered at Debt Yield Levels ≥ 8.00%: | 24.8% | |||||||
| Prepayment Provisions(9) | ||||||||
| % Mortgage Loans with Defeasance Only After a Lockout Period and Prior to an Open Period: | 55.1% | |||||||
| % Mortgage Loans with Prepayment Only After a Lockout Period and Prior to an Open Period with a Yield Maintenance Charge: | 9.8% | |||||||
| % Mortgage Loans with Prepayment or Defeasance Only After a Lockout Period and Prior to an Open Period with Defeasance or a Yield Maintenance Charge: | 35.2% | |||||||
| (1) | Includes (i) a $73.96 million non-controlling pari passu portion of the Tysons Corner Center mortgage loan, as to which GACC is acting as mortgage loan seller of $40.0 million and GSMC is acting as mortgage loan seller of $33.96 million and (ii) a $45.0 million non-controlling pari passu portion of the Garden State Plaza mortgage loan, as to which GSMC is acting as mortgage loan seller of $30.0 million and GACC is acting as mortgage loan seller of $15.0 million. |
| (2) | Includes the Blue Own Tenneco Portfolio (Pool B) mortgage loan, as to which GACC is acting as mortgage loan seller of $45.0 million of such mortgage loan and BMO is acting as mortgage loan seller of $15.0 million of such mortgage loan. |
| (3) | Includes a $60.0 million controlling pari passu portion of the DoubleTree by Hilton Hotel Orlando at SeaWorld mortgage loan, as to which BMO is acting as mortgage loan seller of $30.0 million, GACC is acting as mortgage loan seller of $15.0 million and CREFI is acting as mortgage loan seller of $15.0 million. |
| (4) | The LTV, DSCR and Debt Yield calculations include any related pari passu companion loan(s) and exclude any related subordinate companion loan(s) and/or mezzanine loan(s). |
| (5) | With respect to 41 mortgaged properties (10.8%) (Avenue Living Mini Mall Storage Portfolio (6.3%), Davis Creek Apartments (2.6%), Staybridge Suites Toledo (1.0%) and Four Points Greensboro (1.0%), the Cut-off Date LTV and Maturity Date or LTV have been calculated using a value other than the “As Is” appraised value. For additional information please see the footnotes to Annex A-1 in the Preliminary Prospectus. |
| THE INFORMATION IN THIS STRUCTURAL AND COLLATERAL TERM SHEET IS NOT COMPLETE AND MAY BE AMENDED PRIOR TO THE TIME OF SALE. THIS TERM SHEET IS NOT AN OFFER TO SELL THESE SECURITIES AND IT IS NOT A SOLICITATION OF AN OFFER TO BUY THESE SECURITIES IN ANY JURISDICTION WHERE THE OFFER OR SALE IS NOT PERMITTED. | ||
| 3 | ||
Benchmark 2024-V5 Mortgage Trust |
| OVERVIEW OF MORTGAGE POOL CHARACTERISTICS |
| (6) | Excludes mortgage loans which are interest only for the full loan term. |
| (7) | Includes FF&E reserves. |
| (8) | Represents the percent of the allocated Initial Outstanding Pool Balance of retail, industrial and mixed use properties only structured with TI/LC reserves. |
| (9) | Please see Annex A-1 of the Preliminary Prospectus for more information. |
| (10) | With respect to one mortgage loans representing approximately 3.3% of the initial pool balance, the initial due date for such mortgage loan occurs after February 2024. On the Closing Date, the related mortgage loan seller(s) will contribute an initial interest deposit amount to the issuing entity to cover an amount that represents one month’s interest that would have accrued with respect to each such mortgage loan at the related interest rate with respect to the assumed February 2024 payment date, for such reason the mortgage loan is being treated as having an initial due date in February 2024. |
| THE INFORMATION IN THIS STRUCTURAL AND COLLATERAL TERM SHEET IS NOT COMPLETE AND MAY BE AMENDED PRIOR TO THE TIME OF SALE. THIS TERM SHEET IS NOT AN OFFER TO SELL THESE SECURITIES AND IT IS NOT A SOLICITATION OF AN OFFER TO BUY THESE SECURITIES IN ANY JURISDICTION WHERE THE OFFER OR SALE IS NOT PERMITTED. | ||
| 4 | ||
Benchmark 2024-V5 Mortgage Trust |
| STRUCTURE SUMMARY |
OFFERED CERTIFICATES
| Class(1) | Ratings (S&P/Fitch/KBRA) |
Initial Certificate Balance or Notional Amount(2) |
Initial Subordination |
Weighted Average Life (years)(4) |
Principal Window (months)(4) |
Certificate Principal to Value Ratio(5) |
Certificate Underwritten NOI Debt Yield(6) | |
| Class A-1 | AAA(sf) / AAAsf / AAA(sf) | $365,000 | 30.000%(7) | 2.54 | 1 – 58 | 38.9% | 18.1% | |
| Class A-2 | AAA(sf) / AAAsf / AAA(sf) | (8) | 30.000%(7) | (8) | (8) | 38.9% | 18.1% | |
| Class A-3 | AAA(sf) / AAAsf / AAA(sf) | (8) | 30.000%(7) | (8) | (8) | 38.9% | 18.1% | |
| Class X-A(9) | NR / AAAsf / AAA(sf) | $721,499,000 | (10) | N/A | N/A | N/A | N/A | N/A |
| Class A-M | NR / AAAsf / AAA(sf) | $120,250,000 | 16.000% | 4.94 | 60 – 60 | 46.7% | 15.1% | |
| Class B | NR / AA-sf / AA-(sf) | $37,578,000 | 11.625% | 4.94 | 60 – 60 | 49.1% | 14.4% | |
| Class C | NR / A-sf / A-(sf) | $26,842,000 | 8.500% | 4.94 | 60 – 60 | 50.9% | 13.9% | |
NON-OFFERED CERTIFICATES
| Class(1) | Ratings (S&P/Fitch/KBRA) |
Initial Certificate Balance or Notional Amount (2) |
Initial Subordination |
Weighted Average Life (years)(4) |
Principal Window (months)(4) |
Certificate Principal to Value Ratio(5) |
Certificate Underwritten NOI Debt Yield(6) | |
| Class X-B(9) | NR / AA-sf / AAA(sf) | $37,578,000 | (10) | N/A | N/A | N/A | N/A | N/A |
| Class X-D(9) | NR / BBB-sf / BBB-(sf) | $21,473,000 | (10) | N/A | N/A | N/A | N/A | N/A |
| Class X-F(9)(11) | NR / BB-sf / BB-(sf) | $15,031,000 | (10) | N/A | N/A | N/A | N/A | N/A |
| Class D | NR /BBBsf / BBB(sf) | $12,884,000 | 7.000% | 4.94 | 60 – 60 | 51.7% | 13.7% | |
| Class E | NR / BBB-sf / BBB-(sf) | $8,589,000 | 6.000% | 4.94 | 60 – 60 | 52.3% | 13.5% | |
| Class F(11) | NR / BB-sf / BB-(sf) | $15,031,000 | 4.250% | 4.94 | 60 – 60 | 53.2% | 13.3% | |
| Class G-RR(11) | NR / B-sf / B(sf) | $8,589,000 | 3.250% | 4.95 | 60 – 61 | 53.8% | 13.1% | |
| Class J-RR | NR / NR / NR | $27,915,964 | 0.000% | 5.03 | 61 – 61 | 55.6% | 12.7% | |
NON-OFFERED VERTICAL RISK RETENTION INTEREST
| Non-Offered Vertical Risk Retention Interest | Ratings (S&P/Fitch/KBRA) |
Initial Certificate Balance |
Initial Subordination |
Weighted Average Life (years)(12) |
Principal Window (months)(12) |
Certificate Principal to Value Ratio |
Certificate Underwritten NOI Debt Yield |
| VRR Interest(13)(14)(15) | NR / NR / NR | $25,880,653 | N/A | 4.91 | 1 – 61 | N/A | N/A |
| (1) | The pass-through rates for the Class A-1, Class A-2, Class A-3, Class A-M, Class B, Class C, Class D, Class E, Class F, Class G-RR and Class J-RR certificates (collectively, the “Principal Balance Certificates”) in each case, will be one of: (i) a fixed per annum rate, (ii) the weighted average of the net mortgage rates on the mortgage loans (in each case, adjusted, if necessary, to accrue on the basis of a 360-day year consisting of twelve 30-day months) as of their respective due dates in the month preceding the month in which such Distribution Date occurs (the “WAC Rate”), (iii) a rate equal to the lesser of a specified pass-through rate and the WAC Rate or (iv) the WAC Rate less a specified rate, but in any case not less than 0.000%. |
| (2) | Approximate; subject to a permitted variance of plus or minus 5%. The Certificate Balance of the VRR Interest is not included in the Certificate Balance or Notional Amount of any Class of Certificates set forth under "Offered Certificates" or "Non-Offered Certificates" in the table above. |
| (3) | The initial subordination levels are calculated based on the initial Certificate Balance. The approximate initial credit support percentages shown in the table above do not take into account the VRR Interest. However, losses incurred on the mortgage loans will be allocated between the VRR Interest and the Principal Balance Certificates, pro rata in accordance with their respective percentage allocation entitlement. See “Credit Risk Retention” and “Description of the Certificates” in the Preliminary Prospectus. |
| (4) | The weighted average life and principal window during which distributions of principal would be received as set forth in the table with respect to each class of Principal Balance Certificates are based on (i) modeling assumptions described in the Preliminary Prospectus and (ii) assumptions that there are no prepayments, modifications or losses in respect of the mortgage loans and there are no extensions or forbearances of maturity dates of the mortgage loans. The weighted average life and principal window of the Class A-2 and Class A-3 certificates are subject to change as described in footnote (8) below. |
| (5) | “Certificate Principal to Value Ratio” for any class of Principal Balance Certificates is calculated as the product of (a) the weighted average mortgage loan Cut-off Date LTV of the mortgage loans, multiplied by (b) a fraction, the numerator of which is the total initial Certificate Balance of the related class of Principal Balance Certificates and all other classes of Principal Balance Certificates, if any, that are senior to such class, and the denominator of which is the total initial Certificate Balance of all classes of Principal Balance Certificates. The Certificate Principal to Value Ratios of the Class A-1, Class A-2 and Class A-3 certificates are calculated in the aggregate for those classes as if they were a single class. |
| (6) | “Certificate Underwritten NOI Debt Yield” for any class of Principal Balance Certificates is calculated as the product of (a) the weighted average Underwritten NOI Debt Yield for the mortgage loans, multiplied by (b) a fraction, the numerator of which is the total initial Certificate Balance of all classes of Principal Balance Certificates and the denominator of which is the total initial Certificate Balance of such class of Principal Balance Certificates and all other classes of Principal Balance Certificates, if any, that are senior to such class. The Certificate Underwritten NOI Debt Yields of the Class A-1, Class A-2 and Class A-3 certificates are calculated in the aggregate for those classes as if they were a single class. |
| (7) | The initial subordination levels for the Class A-1, Class A-2 and Class A-3 certificates are represented in the aggregate. |
| (8) | The exact initial Certificate Balances of the Class A-2 and Class A-3 certificates are unknown and will be determined based on the final pricing of those classes of certificates. However, the respective initial Certificate Balances, weighted average lives and principal windows of the Class A-2 and Class A-3 certificates are expected to be within the applicable ranges reflected in the following chart. The aggregate initial Certificate Balance of the Class A-2 and Class A-3 certificates is expected to be approximately $600,884,000, subject to a variance of plus or minus 5.0%. |
| Class of Certificates | Expected Range of Initial Certificate Balance | Expected Range of Weighted Avg. Life (years)(4) | Expected Range of Principal Window (months)(4) |
| Class A-2 | $0 – $250,000,000 | NAP – 4.85 | NAP / 58 – 59 |
| Class A-3 | $350,884,000 – $600,884,000 | 4.93 – 4.89 | 59 – 60 / 58 – 60 |
| (9) | As further described in the Preliminary Prospectus, the pass-through rate applicable to the Class X-A , Class X-B, Class X-D and Class X-F certificates (collectively, the “Class X Certificates”) for each Distribution Date will generally be equal to the excess of (i) the WAC Rate over (ii) (A) with respect to the Class X-A certificates, the weighted average of the pass-through rates of the Class A-1, Class A-2, Class A-3 and Class A-M certificates (based on their respective Certificate Balances outstanding immediately prior to such Distribution Date), (B) with respect to the Class X-B certificates, the pass-through rate of the Class B certificates, (C) with respect to the Class X-D certificates, the weighted average of the pass-through rates of the Class D and Class E certificates (based on their respective Certificate Balances outstanding immediately prior to such Distribution Date), and (D) with respect to the Class X-F certificates, the pass-through rate of the Class F certificates. |
| THE INFORMATION IN THIS STRUCTURAL AND COLLATERAL TERM SHEET IS NOT COMPLETE AND MAY BE AMENDED PRIOR TO THE TIME OF SALE. THIS TERM SHEET IS NOT AN OFFER TO SELL THESE SECURITIES AND IT IS NOT A SOLICITATION OF AN OFFER TO BUY THESE SECURITIES IN ANY JURISDICTION WHERE THE OFFER OR SALE IS NOT PERMITTED. | ||
| 5 | ||
Benchmark 2024-V5 Mortgage Trust |
| STRUCTURE SUMMARY |
| (10) | The Class X Certificates will not have Certificate Balances. None of the Class X Certificates will be entitled to distributions of principal. The interest accrual amounts on the Class X-A certificates will be calculated by reference to a notional amount equal to the aggregate Certificate Balances of the Class A-1, Class A-2, Class A-3 and Class A-M certificates. The interest accrual amounts on the Class X-B certificates will be calculated by reference to a notional amount equal to the Certificate Balance of the Class B certificates. The interest accrual amounts on the Class X-D certificates will be calculated by reference to a notional amount equal to the aggregate Certificate Balances of the Class D and Class E certificates. The interest accrual amounts on the Class X-F certificates will be calculated by reference to a notional amount equal to the Certificate Balance of the Class F certificates. The notional amount of each class of Class X Certificates is subject to change depending upon the final pricing of the Principal Balance Certificates, as follows: (1) if as a result of such pricing the pass-through rate of any class of Principal Balance Certificates whose Certificate Balance comprises such notional amount is equal to the WAC Rate, the Certificate Balance of such class of Principal Balance Certificates may not be part of, and will reduce accordingly, such notional amount of such class of Class X Certificates (or, if as a result of such pricing the pass-through rate of such class of Class X Certificates is equal to zero, such class of Class X Certificates may not be issued on the Closing Date), and/or (2) if as a result of such pricing the pass-through rate of any class of Principal Balance Certificates that does not comprise such notional amount of such class of Class X Certificates is less than the WAC Rate, such class of Principal Balance Certificates may become a part of, and increase accordingly, such notional amount of such class of Class X Certificates. |
| (11) | The initial Certificate Balance of each of the Class F and Class G-RR certificates, and the notional amount of the Class X-F certificates, is subject to change based on final pricing of all Certificates, the final determination of the Class G-RR and Class J-RR certificates (collectively, the “HRR Certificates”) that will be retained by RREF IV-D AIV RR, LLC, as the retaining third-party purchaser, in partial satisfaction of the retention obligations of German American Capital Corporation, in its capacity as retaining sponsor, to satisfy the U.S. risk retention requirements. For more information regarding the methodology and key inputs and assumptions used to determine the sizing of the HRR Certificates, see “Credit Risk Retention” in the Preliminary Prospectus. |
| (12) | The weighted average life and principal window during which distributions of principal would be received as set forth in the foregoing table with respect to the VRR Interest (as defined below) are based on the assumptions set forth under “Yield and Maturity Considerations—Weighted Average Life” in the Preliminary Prospectus and on the assumptions that there are no prepayments, modifications or losses in respect of the mortgage loans and that there are no extensions or forbearances of maturity dates of the mortgage loans. |
| (13) | German American Capital Corporation, as the retaining sponsor, is expected to acquire from the depositor, on the Closing Date, an “eligible vertical interest” (as defined in Regulation RR) in the form of a single vertical security (the “VRR Interest”), representing the right to receive a specified percentage (to be determined as described in footnote (14) below) of all amounts collected on the mortgage loans (net of expenses of the issuing entity) that are available for distribution on the non-VRR certificates and the VRR Interest. See “Credit Risk Retention” in the Preliminary Prospectus. The VRR Interest is a class of Certificates. |
| (14) | The initial Certificate Balance of the VRR Interest is subject to change depending on the final pricing of all classes of Certificates with the final Certificate Balance of the VRR Interest determined such that, upon initial issuance, the percentage of the fair value of the HRR Certificates and the percentage of the VRR Interest (in the aggregate) will equal at least 5. If the initial Certificate Balance of the VRR Interest is reduced, the initial Certificate Balance of each class of Principal Balance Certificates (and correspondingly, the initial notional amount of each class of Class X Certificates) will be increased on a pro rata basis (based on the initial Certificate Balance set forth in the table above) in an aggregate amount equal to such reduction in the initial Certificate Balance of the VRR Interest. If the initial Certificate Balance of the VRR Interest is increased, the initial Certificate Balance of each class of Principal Balance Certificates (and correspondingly, the initial notional amount of each class of Class X Certificates) will be decreased on a pro rata basis (based on the initial Certificate Balance set forth in the table above) in an aggregate amount equal to such increase in the initial Certificate Balance of the VRR Interest. For a further description, see “Credit Risk Retention” in the Preliminary Prospectus. |
| (15) | Although it does not have a specified pass-through rate (other than for tax reporting purposes), the effective interest rate for the VRR Interest will be the WAC Rate. |
| THE INFORMATION IN THIS STRUCTURAL AND COLLATERAL TERM SHEET IS NOT COMPLETE AND MAY BE AMENDED PRIOR TO THE TIME OF SALE. THIS TERM SHEET IS NOT AN OFFER TO SELL THESE SECURITIES AND IT IS NOT A SOLICITATION OF AN OFFER TO BUY THESE SECURITIES IN ANY JURISDICTION WHERE THE OFFER OR SALE IS NOT PERMITTED. | ||
| 6 | ||
Benchmark 2024-V5 Mortgage Trust |
| OVERVIEW OF MORTGAGE POOL CHARACTERISTICS |
| Ten Largest Mortgage Loans |
| Mortgage Loan |
Mortgage Loan Seller |
City, State | Property Type |
Mortgage Loan Cut-off Date |
% of Initial Outstanding Pool Balance |
Cut-off Date Balance per NRA/Unit(1) |
Cut-off Date LTV(1) |
U/W NCF DSCR after IO(1) |
U/W NOI Debt Yield(1) |
| Highland Multifamily Portfolio | CREFI | Various, MI | Multifamily | $75,000,000 | 8.5% | $53,957 | 55.8% | 1.45x | 11.3% |
| Tysons Corner Center | GACC, GSMC | McLean, VA | Retail | $73,960,000 | 8.4% | $396 | 39.4% | 2.00x | 13.7% |
| Blue Owl Tenneco Portfolio (Pool B) | GACC, BMO | Various, Various | Industrial | $60,000,000 | 6.8% | $39 | 58.7% | 1.80x | 14.3% |
| DoubleTree by Hilton Hotel Orlando at SeaWorld | BMO, CREFI, GACC | Orlando, FL | Hospitality | $60,000,000 | 6.8% | $81,574 | 59.4% | 1.85x | 17.1% |
| Acquisition America Portfolio | Barclays | Various, NY | Multifamily | $60,000,000 | 6.8% | $193,333 | 64.4% | 1.25x | 8.9% |
| Avenue Living Mini Mall Storage Portfolio | CREFI | Various, Various | Self Storage | $55,500,000 | 6.3% | $49 | 58.7% | 2.03x | 9.5% |
| 333 South Spruce Street | CREFI | Manteno, IL | Industrial | $50,000,000 | 5.7% | $51 | 56.0% | 1.65x | 11.3% |
| Garden State Plaza | GSMC, GACC | Paramus, NJ | Retail | $45,000,000 | 5.1% | $255 | 28.9% | 2.98x | 20.2% |
| Beach Place | GACC | Fort Lauderdale, FL | Retail | $36,000,000 | 4.1% | $376 | 67.0% | 1.59x | 12.2% |
| Galleria at Tyler | GACC | Riverside, CA | Retail | $35,000,000 | 4.0% | $265 | 50.0% | 1.96x | 16.7% |
| Total/Weighted Average | $550,460,000 | 62.2% | 53.7% | 1.83x | 13.3% |
| (1) | The Cut-off Date Balance per NRA/Unit, Cut-off Date LTV, U/W NCF DSCR after IO and U/W NOI Debt Yield calculations include any related pari passu companion loan(s) and exclude any related subordinate companion loan(s) and/or mezzanine loan(s). |
| THE INFORMATION IN THIS STRUCTURAL AND COLLATERAL TERM SHEET IS NOT COMPLETE AND MAY BE AMENDED PRIOR TO THE TIME OF SALE. THIS TERM SHEET IS NOT AN OFFER TO SELL THESE SECURITIES AND IT IS NOT A SOLICITATION OF AN OFFER TO BUY THESE SECURITIES IN ANY JURISDICTION WHERE THE OFFER OR SALE IS NOT PERMITTED. | ||
| 7 | ||
Benchmark 2024-V5 Mortgage Trust |
| OVERVIEW OF MORTGAGE POOL CHARACTERISTICS |
| Companion Loan Summary |
| Loan No. | Mortgage Loan | Note(s) | Cut-off Date Balance | Holder of Note(1) | Lead Servicer for Whole Loan (Y/N) | Master Servicer Under Lead Securitization | Special Servicer Under Lead Securitization |
| 2 | Tysons Corner Center | A-1-1 | $176,080,000 | TYSN 2023-CRNR | Yes | Berkadia | Situs |
| A-1-2 | $30,000,000 | Benchmark 2024-V5 | No | ||||
| A-1-3 | $20,000,000 | DBNY | No | ||||
| A-1-4 | $10,000,000 | Benchmark 2024-V5 | No | ||||
| A-1-5 | $10,000,000 | DBNY | No | ||||
| A-1-6 | $37,920,000 | DBNY | No | ||||
| A-2-1 | $88,040,000 | TYSN 2023-CRNR | No | ||||
| A-2-2 | $20,000,000 | Benchmark 2024-V5 | No | ||||
| A-2-3 | $20,000,000 | GSBI | No | ||||
| A-2-4 | $13,960,000 | Benchmark 2024-V5 | No | ||||
| A-3-1 | $88,040,000 | TYSN 2023-CRNR | No | ||||
| A-3-2 | $20,000,000 | JPMCB | No | ||||
| A-3-3 | $10,000,000 | JPMCB | No | ||||
| A-3-4 | $23,960,000 | JPMCB | No | ||||
| A-4-1 | $88,040,000 | TYSN 2023-CRNR | No | ||||
| A-4-2 | $30,000,000 | BMO | No | ||||
| A-4-3 | $23,960,000 | BMO | No | ||||
| 4 | DoubleTree by Hilton Hotel Orlando at SeaWorld | A-1 | $30,000,000 | Benchmark 2024-V5 | Yes | Midland | Rialto |
| A-2 | $15,000,000 | Benchmark 2024-V5 | No | ||||
| A-3 | $15,000,000 | Benchmark 2024-V5 | No | ||||
| A-4 | $10,000,000 | BMO | No | ||||
| A-5 | $5,000,000 | DBNY | No | ||||
| A-6 | $5,000,000 | CREFI | No | ||||
| A-7 | $2,500,000 | BMO | No | ||||
| A-8 | $1,250,000 | DBNY | No | ||||
| A-9 | $1,250,000 | CREFI | No | ||||
| 5 | Acquisition America Portfolio | A-1 | $60,000,000 | Benchmark 2024-V5 | Yes | Midland | Rialto |
| A-2 | $24,100,000 | Barclays or an affiliate | No | ||||
| 7 | 333 South Spruce Street | A-1 | $50,000,000 | Benchmark 2024-V5 | Yes | Midland | Rialto |
| A-2 | $28,750,000 | CREFI | No | ||||
| 8 | Garden State Plaza | A-1-S1 | $170,000,000 | NJ Trust 2023-GSP | Yes | Berkadia | Argentic |
| A-2-S1 | $127,500,000 | NJ Trust 2023-GSP | No | ||||
| A-3-S1 | $127,500,000 | NJ Trust 2023-GSP | No | ||||
| A-1-C1 | $20,000,000 | Benchmark 2024-V5 | No | ||||
| A-1-C2 | $10,000,000 | Benchmark 2024-V5 | No | ||||
| A-1-C3 | $10,000,000 | GSBI | No | ||||
| A-2-C1 | $15,000,000 | Benchmark 2024-V5 | No | ||||
| A-2-C2 | $15,000,000 | GACC | No | ||||
| A-3-C1 | $15,000,000 | NREC | No | ||||
| A-3-C2 | $15,000,000 | NREC | No | ||||
| THE INFORMATION IN THIS STRUCTURAL AND COLLATERAL TERM SHEET IS NOT COMPLETE AND MAY BE AMENDED PRIOR TO THE TIME OF SALE. THIS TERM SHEET IS NOT AN OFFER TO SELL THESE SECURITIES AND IT IS NOT A SOLICITATION OF AN OFFER TO BUY THESE SECURITIES IN ANY JURISDICTION WHERE THE OFFER OR SALE IS NOT PERMITTED. | ||
| 8 | ||
Benchmark 2024-V5 Mortgage Trust |
| OVERVIEW OF MORTGAGE POOL CHARACTERISTICS |
| 10 | Galleria at Tyler | A-1-1 | $30,000,000 | BANA | Yes(2) | ||
| A-1-2 | $20,000,000 | BANA | No | ||||
| A-1-3 | $10,000,000 | BANA | No | ||||
| A-2-1 | $20,000,000 | Benchmark 2024-V5 | No | Midland(2) | Rialto(2) | ||
| A-2-2 | $15,000,000 | Benchmark 2024-V5 | No | ||||
| A-2-3 | $10,000,000 | DBRI | No | ||||
| A-3-1 | $20,000,000 | SocGen | No | ||||
| A-3-2 | $15,000,000 | SocGen | No | ||||
| A-3-3 | $10,000,000 | SocGen | No | ||||
| 23 | Warwick New York | A-1 | $60,500,000 | Benchmark 2023-V4 | Yes | Midland | KKR |
| A-2 | 10,000,000 | Benchmark 2024-V5 | No | ||||
| 29 | Philadelphia Marriott Downtown | A-1 | $55,000,000 | BBCMS 2023-5C23 | Yes | Midland | LNR |
| A-2 | $25,000,000 | Benchmark 2023-V4 | No | ||||
| A-3 | $20,000,000 | MSWF 2023-2 | No | ||||
| A-4 | $10,000,000 | BBCMS 2023-5C23 | No | ||||
| A-5 | $15,000,000 | Benchmark 2023-V4 | No | ||||
| A-6 | $15,000,000 | MSWF 2023-2 | No | ||||
| A-7 | $6,666,667 | Benchmark 2024-V5 | No | ||||
| A-8 | $10,000,000 | Benchmark 2023-V4 | No | ||||
| A-9 | $10,000,000 | BANK5 2023-5YR4 | No | ||||
| A-10 | $26,666,666 | MSWF 2023-2 | No | ||||
| A-11 | $10,000,000 | BANK5 2023-5YR4 | No | ||||
| A-12 | $11,666,667 | Benchmark 2023-B40 | No |
| (1) | The identification of a securitization trust means we have identified another securitization trust that has closed or as to which a preliminary prospectus (or preliminary offering circular) or final prospectus (or final offering circular) has printed that has or is expected to include the identified Mortgage Note(s). |
| (2) | Prior to the related servicing shift securitization date, the related whole loan will be serviced under the pooling and servicing agreement for this transaction. From and after the related servicing shift securitization date, the related servicing shift whole loan will be serviced under the related servicing shift pooling and servicing agreement. |
| THE INFORMATION IN THIS STRUCTURAL AND COLLATERAL TERM SHEET IS NOT COMPLETE AND MAY BE AMENDED PRIOR TO THE TIME OF SALE. THIS TERM SHEET IS NOT AN OFFER TO SELL THESE SECURITIES AND IT IS NOT A SOLICITATION OF AN OFFER TO BUY THESE SECURITIES IN ANY JURISDICTION WHERE THE OFFER OR SALE IS NOT PERMITTED. | ||
| 9 | ||
Benchmark 2024-V5 Mortgage Trust |
| OVERVIEW OF MORTGAGE POOL CHARACTERISTICS |
| Distribution of Cut-off Date Balances(1) | ||||||||||||
| Range of Cut-off Date Balances | Number of Mortgage Loans |
Aggregate Cut-off Date Balance |
% of Initial Pool |
Weighted Averages | ||||||||
| Mortgage Rate | Stated Remaining Term (Mos.)(2) |
U/W NCF DSCR | Cut-off Date LTV(3) |
Maturity Date LTV(3) | ||||||||
| $2,250,000 | - | $9,999,999 | 13 | $76,291,667 | 8.6% | 7.7001% | 59 | 1.51x | 57.4% | 57.1% | ||
| $10,000,000 | - | $19,999,999 | 8 | $120,765,000 | 13.6% | 7.2102% | 60 | 1.57x | 59.5% | 59.5% | ||
| $20,000,000 | - | $29,999,999 | 3 | $76,366,950 | 8.6% | 6.6414% | 60 | 1.64x | 54.8% | 54.8% | ||
| $30,000,000 | - | $39,999,999 | 4 | $131,925,000 | 14.9% | 7.3700% | 60 | 1.54x | 61.0% | 61.0% | ||
| $40,000,000 | - | $75,000,000 | 8 | $479,460,000 | 54.2% | 6.7768% | 59 | 1.84x | 53.0% | 53.0% | ||
| Total/Weighted Average | 36 | $884,808,617 | 100.0% | 6.9923% | 60 | 1.71x | 55.6% | 55.6% | ||||
| Distribution of Mortgage Rates(1) | ||||||||||||
| Range of Mortgage Rates | Number of Mortgage Loans |
Aggregate Cut-off Date Balance |
% of Initial Pool |
Weighted Averages | ||||||||
| Mortgage Rate | Stated Remaining Term (Mos.)(2) |
U/W NCF DSCR | Cut-off Date LTV(3) |
Maturity Date LTV(3) | ||||||||
| 4.5000% | - | 5.9999% | 2 | $85,116,950 | 9.6% | 4.9141% | 60 | 2.08x | 55.2% | 55.2% | ||
| 6.0000% | - | 6.4999% | 1 | $11,350,000 | 1.3% | 6.3090% | 60 | 1.24x | 73.7% | 73.7% | ||
| 6.5000% | - | 6.9999% | 10 | $341,650,000 | 38.6% | 6.6853% | 60 | 1.73x | 53.6% | 53.6% | ||
| 7.0000% | - | 8.9500% | 23 | $446,691,667 | 50.5% | 7.6406% | 60 | 1.64x | 56.8% | 56.7% | ||
| Total/Weighted Average | 36 | $884,808,617 | 100.0% | 6.9923% | 60 | 1.71x | 55.6% | 55.6% | ||||
| Property Type Distribution(1)(4) | |||||||||||
| Property Type |
Number of Mortgaged Properties |
Aggregate Cut-off Date Balance |
% of Initial Outstanding Pool Balance |
Number of NRA/Units/Rooms/Pads |
Weighted Averages |
||||||
|
Cut-off
Date NRA/Units/Rooms/Pads |
Mortgage Rate |
Stated Remaining Term (Mos.)(2) | Occupancy | U/W NCF DSCR | Cut-off Date LTV(3) | Maturity Date LTV(3) | |||||
| Multifamily | 27 | $258,493,000 | 29.2% | 3,384 | $138,424 | 7.0546% | 60 | 93.0% | 1.34x | 62.8% | 62.8% |
| Garden | 18 | $156,093,000 | 17.6% | 2,615 | $70,329 | 7.1432% | 60 | 93.0% | 1.38x | 62.3% | 62.3% |
| Mid Rise | 6 | $60,778,002 | 6.9% | 325 | $299,697 | 6.8288% | 60 | 91.2% | 1.26x | 64.6% | 64.6% |
| High Rise | 1 | $29,521,998 | 3.3% | 176 | $167,739 | 6.9100% | 60 | 97.7% | 1.25x | 64.4% | 64.4% |
| Age Restricted | 1 | $9,300,000 | 1.1% | 262 | $35,496 | 7.3200% | 60 | 86.6% | 1.45x | 55.8% | 55.8% |
| Low Rise | 1 | $2,800,000 | 0.3% | 6 | $466,667 | 7.6600% | 60 | 100.0% | 1.34x | 60.9% | 60.9% |
| Retail | 7 | $236,360,000 | 26.7% | 4,948,175 | $291 | 7.0621% | 60 | 95.0% | 2.01x | 46.3% | 46.3% |
| Super Regional Mall | 3 | $153,960,000 | 17.4% | 4,417,457 | $325 | 6.9039% | 60 | 94.1% | 2.28x | 38.7% | 38.7% |
| Anchored | 4 | $82,400,000 | 9.3% | 530,718 | $226 | 7.3576% | 60 | 96.6% | 1.52x | 60.4% | 60.4% |
| Industrial | 14 | $139,616,950 | 15.8% | 3,719,292 | $51 | 6.8303% | 60 | 100.0% | 1.82x | 55.6% | 55.6% |
| Warehouse/Distribution | 3 | $85,108,000 | 9.6% | 2,396,919 | $47 | 7.0063% | 60 | 100.0% | 1.71x | 57.1% | 57.1% |
| Warehouse/Manufacturing | 7 | $29,616,950 | 3.3% | 633,957 | $71 | 5.6900% | 61 | 100.0% | 2.16x | 48.7% | 48.7% |
| Flex | 3 | $16,732,000 | 1.9% | 511,716 | $34 | 7.5850% | 59 | 100.0% | 1.80x | 58.7% | 58.7% |
| Manufacturing | 1 | $8,160,000 | 0.9% | 176,700 | $46 | 7.5850% | 59 | 100.0% | 1.80x | 58.7% | 58.7% |
| Hospitality | 6 | $109,041,667 | 12.3% | 3,319 | $91,119 | 7.8992% | 59 | 71.9% | 1.84x | 56.6% | 56.4% |
| Full Service | 4 | $92,041,667 | 10.4% | 3,085 | $94,505 | 7.9838% | 59 | 73.0% | 1.84x | 55.6% | 55.6% |
| Select Service | 1 | $8,500,000 | 1.0% | 112 | $75,893 | 7.2720% | 60 | 59.8% | 1.96x | 66.4% | 66.4% |
| Extended Stay | 1 | $8,500,000 | 1.0% | 122 | $69,672 | 7.6100% | 60 | 72.5% | 1.71x | 57.0% | 54.4% |
| Self Storage | 44 | $95,110,000 | 10.7% | 1,675,102 | $65 | 5.7087% | 59 | 82.7% | 1.73x | 59.2% | 59.2% |
| Other | 1 | $18,440,000 | 2.1% | 124,289 | $148 | 6.6700% | 60 | 0.0% | 1.51x | 68.3% | 68.3% |
| Manufactured Housing | 1 | $18,100,000 | 2.0% | 286 | $63,287 | 7.2750% | 60 | 100.0% | 1.75x | 50.3% | 50.3% |
| Mixed Use | 2 | $9,647,000 | 1.1% | 40,004 | $47,199 | 8.4532% | 58 | 100.0% | 1.26x | 29.5% | 29.5% |
| Medical Office/Retail | 1 | $8,300,000 | 0.9% | 40,000 | $208 | 8.5900% | 58 | 100.0% | 1.26x | 23.1% | 23.1% |
| Multifamily/Retail | 1 | $1,347,000 | 0.2% | 4 | $336,750 | 7.6100% | 60 | 100.0% | 1.29x | 69.1% | 69.1% |
| Total/Weighted Average | 102 | $884,808,617 | 100.0% | 6.9923% | 60 | 91.1% | 1.71x | 55.6% | 55.6% | ||
| THE INFORMATION IN THIS STRUCTURAL AND COLLATERAL TERM SHEET IS NOT COMPLETE AND MAY BE AMENDED PRIOR TO THE TIME OF SALE. THIS TERM SHEET IS NOT AN OFFER TO SELL THESE SECURITIES AND IT IS NOT A SOLICITATION OF AN OFFER TO BUY THESE SECURITIES IN ANY JURISDICTION WHERE THE OFFER OR SALE IS NOT PERMITTED. | ||
| 10 | ||
Benchmark 2024-V5 Mortgage Trust |
| OVERVIEW OF MORTGAGE POOL CHARACTERISTICS |
| Geographic Distribution(1)(4) | |||||||||||
| State/Location |
Number of Properties |
Aggregate Cut-off Date Balance |
% of Initial Outstanding Pool Balance |
Weighted Averages | |||||||
| Mortgage Rate | Stated Remaining Term (Mos.)(2) | U/W NCF DSCR | Cut-off Date LTV(3) | Maturity Date LTV(3) | |||||||
| Michigan | 9 | $115,176,000 | 13.0% | 7.1925% | 60 | 1.43x | 59.3% | 59.3% | |||
| Florida | 3 | $102,000,000 | 11.5% | 7.6006% | 59 | 1.75x | 61.1% | 61.1% | |||
| New York | 9 | $86,400,000 | 9.8% | 7.1786% | 60 | 1.41x | 56.9% | 56.9% | |||
| New York City | 8 | $80,342,925 | 9.1% | 7.1989% | 60 | 1.42x | 56.3% | 56.3% | |||
| New York State | 1 | $6,057,075 | 0.7% | 6.9100% | 60 | 1.25x | 64.4% | 64.4% | |||
| New Jersey | 8 | $80,985,333 | 9.2% | 6.6756% | 60 | 2.24x | 44.3% | 44.3% | |||
| Virginia | 1 | $73,960,000 | 8.4% | 6.6006% | 59 | 2.00x | 39.4% | 39.4% | |||
| Illinois | 3 | $68,079,618 | 7.7% | 7.0473% | 60 | 1.64x | 56.1% | 56.1% | |||
| California | 3 | $59,106,000 | 6.7% | 7.4953% | 60 | 1.92x | 50.0% | 50.0% | |||
| Southern(5) | 3 | $59,106,000 | 6.7% | 7.4953% | 60 | 1.92x | 50.0% | 50.0% | |||
| Other | 66 | $299,101,666 | 33.8% | 6.7248% | 60 | 1.65x | 60.0% | 59.9% | |||
| Total/Weighted Average | 102 | $884,808,617 | 100.0% | 6.9923% | 60 | 1.71x | 55.6% | 55.6% | |||
| Distribution of Cut-off Date LTVs(1)(3) | ||||||||||||
| Range of Cut-off Date LTVs | Number
of Mortgage Loans |
Aggregate Cut-off Date Balance |
%
of Initial Outstanding Pool Balance |
Weighted Averages | ||||||||
| Mortgage Rate | Stated Remaining Term (Mos.)(2) | U/W NCF DSCR | Cut-off Date LTV(3) | Maturity Date LTV(3) | ||||||||
| 23.1% | - | 39.9% | 4 | $137,260,000 | 15.5% | 6.7847% | 59 | 2.30x | 34.5% | 34.5% | ||
| 40.0% | - | 49.9% | 2 | $35,616,950 | 4.0% | 6.0539% | 61 | 2.08x | 47.6% | 47.6% | ||
| 50.0% | - | 59.9% | 14 | $451,501,667 | 51.0% | 7.1707% | 59 | 1.69x | 56.6% | 56.5% | ||
| 60.0% | - | 69.9% | 15 | $249,080,000 | 28.2% | 6.9488% | 60 | 1.38x | 65.9% | 65.9% | ||
| 70.0% | - | 73.7% | 1 | $11,350,000 | 1.3% | 6.3090% | 60 | 1.24x | 73.7% | 73.7% | ||
| Total/Weighted Average | 36 | $884,808,617 | 100.0% | 6.9923% | 60 | 1.71x | 55.6% | 55.6% | ||||
| Distribution of Maturity Date LTVs(1)(3) | ||||||||||||
| Range of Maturity Date LTVs | Number of Mortgage Loans |
Aggregate Cut-off Date Balance |
% of Initial Outstanding Pool Balance |
Weighted Averages | ||||||||
| Mortgage Rate | Stated Remaining Term (Mos.)(2) | U/W NCF DSCR | Cut-off Date LTV(3) | Maturity Date LTV(3) | ||||||||
| 23.1% | - | 39.9% | 4 | $137,260,000 | 15.5% | 6.7847% | 59 | 2.30x | 34.5% | 34.5% | ||
| 40.0% | - | 49.9% | 2 | $35,616,950 | 4.0% | 6.0539% | 61 | 2.08x | 47.6% | 47.6% | ||
| 50.0% | - | 59.9% | 14 | $451,501,667 | 51.0% | 7.1707% | 59 | 1.69x | 56.6% | 56.5% | ||
| 60.0% | - | 73.7% | 16 | $260,430,000 | 29.4% | 6.9209% | 60 | 1.38x | 66.2% | 66.2% | ||
| Total/Weighted Average | 36 | $884,808,617 | 100.0% | 6.9923% | 60 | 1.71x | 55.6% | 55.6% | ||||
| Distribution of Underwritten NCF Debt Service Coverages(1) | ||||||||||||
| Range of Underwritten NCF Debt Service Coverages | Number of Mortgage Loans |
Aggregate Cut-off Date Balance |
% of Initial Outstanding Pool Balance |
Weighted Averages | ||||||||
| Mortgage Rate | Stated Remaining Term (Mos.)(2) | U/W NCF DSCR | Cut-off Date LTV(3) | Maturity Date LTV(3) | ||||||||
| 1.20x | - | 1.49x | 17 | $332,350,000 | 37.6% | 7.1302% | 60 | 1.34x | 60.9% | 60.9% | ||
| 1.50x | - | 1.99x | 14 | $338,381,667 | 38.2% | 7.5031% | 59 | 1.74x | 58.3% | 58.2% | ||
| 2.00x | - | 2.49x | 4 | $169,076,950 | 19.1% | 5.8000% | 59 | 2.06x | 47.0% | 47.0% | ||
| 2.50x | - | 2.98x | 1 | $45,000,000 | 5.1% | 6.6130% | 60 | 2.98x | 28.9% | 28.9% | ||
| Total/Weighted Average | 36 | $884,808,617 | 100.0% | 6.9923% | 60 | 1.71x | 55.6% | 55.6% | ||||
| Original Terms to Maturity(1)(2) | ||||||||||
| Original Terms to Maturity |
Number of Mortgage Loans |
Aggregate Cut-off Date Balance |
% of Initial Outstanding Pool Balance |
Weighted Averages | ||||||
| Mortgage Rate | Stated Remaining Term (Mos.) | U/W NCF DSCR | Cut-off Date LTV(3) | Maturity Date LTV(3) | ||||||
| 60 | - | 61 | 36 | $884,808,617 | 100.0% | 6.9923% | 60 | 1.71x | 55.6% | 55.6% |
| Total/Weighted Average | 36 | $884,808,617 | 100.0% | 6.9923% | 60 | 1.71x | 55.6% | 55.6% | ||
Distribution of Remaining Terms to Maturity(1)(2) | |||||||||||
| Range of Remaining Terms to Maturity |
Number of Mortgage Loans |
Aggregate Cut-off Date Balance |
% of Initial Outstanding Pool Balance |
Weighted Averages | |||||||
| Mortgage Rate | Stated Remaining Term (Mos.) | U/W NCF DSCR | Cut-off Date LTV(3) | Maturity Date LTV(3) | |||||||
| 58 | - | 59 | 14 | $339,986,667 | 38.4% | 6.9463% | 59 | 1.81x | 52.9% | 52.9% | |
| 60 | - | 61 | 22 | $544,821,950 | 61.6% | 7.0211% | 60 | 1.65x | 57.3% | 57.2% | |
| Total/Weighted Average | 36 | $884,808,617 | 100.0% | 6.9923% | 60 | 1.71x | 55.6% | 55.6% | |||
| THE INFORMATION IN THIS STRUCTURAL AND COLLATERAL TERM SHEET IS NOT COMPLETE AND MAY BE AMENDED PRIOR TO THE TIME OF SALE. THIS TERM SHEET IS NOT AN OFFER TO SELL THESE SECURITIES AND IT IS NOT A SOLICITATION OF AN OFFER TO BUY THESE SECURITIES IN ANY JURISDICTION WHERE THE OFFER OR SALE IS NOT PERMITTED. | ||
| 11 | ||
Benchmark 2024-V5 Mortgage Trust |
| OVERVIEW OF MORTGAGE POOL CHARACTERISTICS |
| Distribution of Underwritten NOI Debt Yields(1) | ||||||||||||
| Range of Underwritten NOI Debt Yields | Number of Mortgage Loans |
Aggregate Cut-off Date Balance |
% of Initial Outstanding Pool Balance |
Weighted Averages | ||||||||
| Mortgage Rate | Stated Remaining Term (Mos.)(2) | U/W NCF DSCR | Cut-off Date LTV(3) | Maturity Date LTV(3) | ||||||||
| 8.1% | - | 8.4% | 2 | $36,350,000 | 4.1% | 6.5298% | 59 | 1.21x | 67.0% | 67.0% | ||
| 8.5% | - | 9.4% | 2 | $90,000,000 | 10.2% | 6.8567% | 60 | 1.26x | 65.6% | 65.6% | ||
| 9.5% | - | 10.4% | 6 | $149,565,000 | 16.9% | 6.0681% | 60 | 1.61x | 62.0% | 62.0% | ||
| 10.5% | - | 11.4% | 9 | $158,625,000 | 17.9% | 7.1712% | 60 | 1.49x | 55.5% | 55.5% | ||
| 11.5% | - | 20.5% | 17 | $450,268,617 | 50.9% | 7.3008% | 59 | 1.95x | 50.6% | 50.6% | ||
| Total/Weighted Average | 36 | $884,808,617 | 100.0% | 6.9923% | 60 | 1.71x | 55.6% | 55.6% | ||||
| Amortization Types(1) | |||||||||
| Amortization Type | Number of Mortgage Loans |
Aggregate Cut-off Date Balance |
% of Initial Outstanding Pool Balance |
Weighted Averages | |||||
| Mortgage Rate | Stated Remaining Term (Mos.)(2) | U/W NCF DSCR | Cut-off Date LTV(3) | Maturity Date LTV(3) | |||||
| Interest Only | 35 | $876,308,617 | 99.0% | 6.9864% | 60 | 1.71x | 55.6% | 55.6% | |
| Amortizing Balloon | 1 | $8,500,000 | 1.0% | 7.6100% | 60 | 1.71x | 57.0% | 54.4% | |
| Total/Weighted Average | 36 | $884,808,617 | 100.0% | 6.9923% | 60 | 1.71x | 55.6% | 55.6% | |
| (1) | The U/W NCF DSCR, Cut-off Date LTV, Maturity Date LTV, Underwritten NOI Debt Yield and Cut-off Date Balance per # of NRA/Units/Rooms/Pads calculations include any related pari passu companion loan(s) and exclude any related subordinate companion loan(s) and/or mezzanine loan(s). |
| (2) | With respect to one mortgage loan representing approximately 3.3% of the initial pool balance, the initial due date for such mortgage loan occurs after February 2024. On the Closing Date, the related mortgage loan seller(s) will contribute an initial interest deposit amount to the issuing entity to cover an amount that represents one month’s interest that would have accrued with respect to each such mortgage loan at the related interest rate with respect to the assumed February 2024 payment date, for such reason the mortgage loan is being treated as having an initial due date in February 2024. |
| (3) | With respect to 41 mortgaged properties (10.8%) (Avenue Living Mini Mall Storage Portfolio (6.3%), Davis Creek Apartments (2.6%), Staybridge Suites Toledo (1.0%) and Four Points Greensboro (1.0%), the Cut-off Date LTV and Maturity Date or LTV have been calculated using a value other than the “As Is” appraised value. For additional information please see the footnotes to Annex A-1 in the Preliminary Prospectus. |
| (4) | Reflects the allocated loan amount for properties securing multi-property Mortgage Loans. |
| (5) | Northern California properties have a zip code greater than 93600. Southern California properties have a zip code less than or equal to 93600. |
| Previously Securitized Mortgaged Properties(1) | |||||||
| Mortgaged Property | Cut-off Date Balance | % of Initial Outstanding Pool Balance | City, State | Property Type | Previous Securitization | ||
| Garfield Commons | $30,500,000 | 3.4% | Clinton Township, Michigan | Multifamily | WFRBS 2014-C21 | ||
| Farmbrooke Manor | $19,000,000 | 2.1% | Clinton Township, Michigan | Multifamily | WFRBS 2014-C21 | ||
| Warren Woods | $10,250,000 | 1.2% | Warren, Michigan | Multifamily | WFRBS 2014-C21 | ||
| Highland Towers | $9,300,000 | 1.1% | Southfield, Michigan | Multifamily | WFRBS 2014-C21 | ||
| Golf Manor | $5,950,000 | 0.7% | Roseville, Michigan | Multifamily | WFRBS 2014-C21 | ||
| 333 South Spruce Street | $50,000,000 | 5.7% | Manteno, Illinois | Industrial | FIVE 2023-V1 | ||
| Garden State Plaza | $45,000,000 | 5.1% | Paramus, New Jersey | Retail | RBSCF 2013-GSP and WFRBS 2013-C18 | ||
| Davis Creek Apartments | $23,000,000 | 2.6% | Portage, Michigan | Multifamily | FREMF 2018-KC02 | ||
| The Dylan | $4,440,000 | 0.5% | Lubbock, Texas | Multifamily | FRESB 2016-SB15 | ||
| Dayville Storage | $1,650,000 | 0.2% | Killingly, Connecticut | Self Storage | BANK 2019-BN22 | ||
| Mechanic Street Storage | $1,435,000 | 0.2% | Danielson, Connecticut | Self Storage | BANK 2019-BN22 | ||
| Brooklyn Self Storage | $1,100,000 | 0.1% | Brooklyn, Connecticut | Self Storage | BANK 2019-BN22 | ||
| (1) | The table above includes mortgaged properties securing mortgage loans for which the most recent prior financing of all or a significant portion of each such mortgaged property was included in a securitization. Information under “Previous Securitization” represents the most recent such securitization with respect to each of those mortgaged properties. The information in the above table is based solely on information provided by the related borrower or obtained through searches of a third-party database and has not otherwise been confirmed by the related mortgage loan seller. |
| THE INFORMATION IN THIS STRUCTURAL AND COLLATERAL TERM SHEET IS NOT COMPLETE AND MAY BE AMENDED PRIOR TO THE TIME OF SALE. THIS TERM SHEET IS NOT AN OFFER TO SELL THESE SECURITIES AND IT IS NOT A SOLICITATION OF AN OFFER TO BUY THESE SECURITIES IN ANY JURISDICTION WHERE THE OFFER OR SALE IS NOT PERMITTED. | ||
| 12 | ||
Benchmark 2024-V5 Mortgage Trust |
| STRUCTURE OVERVIEW |
| Allocation between VRR Interest and the Non-VRR Certificates: | The aggregate amount available for distribution to holders of the certificates (including the VRR Interest) on each Distribution Date will be: (i) the gross amount of interest, principal, yield maintenance charges and prepayment premiums collected with respect to the Mortgage Loans in the applicable one-month collection period, net of specified expenses of the issuing entity, including fees payable therefrom to, and losses, liabilities, costs and expenses reimbursable or indemnifiable therefrom to, the Master Servicer, the Special Servicer, the Certificate Administrator, the Trustee, the Operating Advisor, the Asset Representations Reviewer and CREFC®; and (ii) allocated to amounts available for distribution to the holders of the VRR Interest, on the one hand, and amounts available for distribution to the holders of the Certificates (other than the Class R certificates and the VRR Interest) (the “Non-VRR Certificates”), on the other hand. On each Distribution Date, the portion of such aggregate available funds allocable to: (a) the VRR Interest will be the product of such aggregate available funds multiplied by a fraction, expressed as a percentage, the numerator of which is the initial Certificate Balance of the VRR Interest, and the denominator of which is the sum of the aggregate initial Certificate Balance of all classes of Principal Balance Certificates and the initial Certificate Balance of the VRR Interest (the “VRR Percentage”); and (b) the Non-VRR Certificates will at all times be the product of such aggregate available funds multiplied by the difference between 100% and the VRR Percentage (such difference, the “Non-VRR Percentage”). See “Credit Risk Retention” and “Description of the Certificates” in the Preliminary Prospectus. |
| Principal Payments: | Payments in respect of the Non-VRR Percentage of principal on the Non-VRR Certificates will be distributed to the Class A-1, Class A-2, Class A-3, Class A-M, Class B, Class C, Class D, Class E, Class F, Class G-RR and Class J-RR certificates, in that order, until the Certificate Balance of each such class is reduced to zero. Notwithstanding the foregoing, if the total Certificate Balance of the Class A-M, Class B, Class C, Class D, Class E, Class F, Class G-RR and Class J-RR certificates have been reduced to zero as a result of loss allocation, payments in respect of principal of the certificates will be distributed, first, to the Class A-1, Class A-2 and Class A-3 certificates, on a pro rata basis, based on the Certificate Balance of each such class, then, to the extent of any recoveries on realized losses, to the Class A-M, Class B, Class C, Class D, Class E, Class F, Class G-RR and Class J-RR certificates, in that order, in each case until the Certificate Balance of each such class is reduced to zero (or previously allocated realized losses have been fully reimbursed). Each of the Class X Certificates will not be entitled to receive distributions of principal; however, (i) the notional amount of the Class X-A certificates will be reduced by the aggregate amount of principal distributions and realized losses allocated to the Class A-1, Class A-2, Class A-3 and Class A-M certificates, (ii) the notional amount of the Class X-B certificates will be reduced by the amount of principal distributions and realized losses allocated to the Class B certificates, (iii) the notional amount of the Class X-D certificates will be reduced by the aggregate amount of principal distributions and realized losses allocated to the Class D and Class E certificates, and (iv) the notional amount of the Class X-F certificates will be reduced by the amount of principal distributions and realized losses allocated to the Class F certificates. |
| Interest Payments: | On each Distribution Date, interest accrued for each class of Non-VRR Certificates at the applicable pass-through rate will be distributed in the following order of priority, to the extent of the Non-VRR Percentage of the aggregate available funds (exclusive of any portion thereof that represents the Non-VRR Percentage of any yield maintenance charges and prepayment premiums): first, to the Class A-1, Class A-2, Class A-3, Class X-A, Class X-B, Class X-D and Class X-F certificates, on a pro rata basis, based on the accrued and unpaid interest on each such class and then, to the Class A-M, Class B, Class C, Class D, Class E, Class F, Class G-RR and Class J-RR certificates, in that order, in each case until the interest payable to each such class is paid in full.
The pass-through rates applicable to the Class A-1, Class A-2, Class A-3, Class A-M, Class B, Class C, Class D, Class E, Class F, Class G-RR and Class J-RR certificates for each Distribution Date will equal one of: (i) a fixed per annum rate, (ii) the WAC Rate, (iii) a rate equal to the lesser of a specified pass-through rate and the WAC Rate or (iv) the WAC Rate less a specified rate, but in any case not less than 0.000%. |
| THE INFORMATION IN THIS STRUCTURAL AND COLLATERAL TERM SHEET IS NOT COMPLETE AND MAY BE AMENDED PRIOR TO THE TIME OF SALE. THIS TERM SHEET IS NOT AN OFFER TO SELL THESE SECURITIES AND IT IS NOT A SOLICITATION OF AN OFFER TO BUY THESE SECURITIES IN ANY JURISDICTION WHERE THE OFFER OR SALE IS NOT PERMITTED. | ||
| 13 | ||
Benchmark 2024-V5 Mortgage Trust |
| STRUCTURE OVERVIEW |
|
As further described in the Preliminary Prospectus, the pass-through rates applicable to the Class X Certificates for each Distribution Date will generally be equal to the excess of (i) the WAC Rate over (ii) (A) with respect to the Class X-A certificates, the weighted average of the pass-through rates of the Class A-1, Class A-2, Class A-3 and Class A-M certificates (weighted based on their respective Certificate Balances outstanding immediately prior to that Distribution Date), (B) with respect to the Class X-B certificates, the pass-through rate of the Class B certificates, (C) with respect to the Class X-D certificates, the weighted average of the pass-through rates of the Class D and Class E certificates (weighted based on their respective Certificate Balances outstanding immediately prior to that Distribution Date) and (D) with respect to the Class X-F certificates, the pass-through rate of the Class F certificates. | |
| Prepayment Interest Shortfalls: | Prepayment interest shortfalls will be allocated pro rata based on interest entitlements, in reduction of the interest otherwise payable with respect to each of the interest-bearing classes of certificates. |
| Loss Allocation: | The Non-VRR Percentage of losses on the Mortgage Loans will be allocated to each class of Non-VRR Certificates entitled to principal in reverse alphabetical order starting with the Class J-RR certificates through and including the Class A-M certificates and then to the Class A-1, Class A-2 and Class A-3 certificates on a pro rata basis based on the Certificate Balance of each such class. The notional amount of any class of Class X Certificates will be reduced by the aggregate amount of realized losses allocated to the class(es) of certificates that are component(s) of the notional amount of such class of Class X Certificates. |
Prepayment Premiums:
|
A percentage of the Non-VRR Percentage of all prepayment premiums (either fixed prepayment premiums or yield maintenance amounts) collected on the Mortgage Loans will be allocated to each of the Class A-1, Class A-2, Class A-3, Class A-M, Class B, Class C, Class D and Class E certificates (the “YM P&I Certificates”) then entitled to principal distributions, which percentage will be equal to the product of (a) a fraction, not greater than one, the numerator of which is the amount of principal distributed to such class on such Distribution Date and the denominator of which is the total amount of principal distributed to the holders of each class of Principal Balance Certificates on such Distribution Date and (b) the Base Interest Fraction for the related principal prepayment and such class of certificates. The VRR Percentage of all prepayment premiums (either fixed prepayment premiums or yield maintenance amounts) will be distributed to the VRR Interest.
The “Base Interest Fraction” for any principal prepayment on any Mortgage Loan and for:
(A) any of the Class A-1 through Class E certificates with a Pass-Through Rate equal to either the WAC Rate or the WAC Rate less a specified rate, will be a fraction (not greater than one) (a) whose numerator is the greater of zero and the amount, if any, by which (i) the Pass-Through Rate on such class of certificates exceeds (ii) the yield rate (as provided by the master servicer) used in calculating the prepayment premium or yield maintenance charge, as applicable, with respect to such principal prepayment and (b) whose denominator is the amount, if any, by which (i) the Net Mortgage Rate on such Mortgage Loan during the related interest accrual period exceeds (ii) the yield rate (as provided by the master servicer) used in calculating the prepayment premium or yield maintenance charge, as applicable, with respect to such principal prepayment; provided, however, that if such yield rate is greater than or equal to the Net Mortgage Rate on such Mortgage Loan during the related interest accrual period, then the respective Base Interest Fraction will be zero; provided, further, that if such yield rate is greater than or equal to the Net Mortgage Rate on such Mortgage Loan during the related interest accrual period, but less than the Pass-Through Rate described in clause (a)(i) above, then the respective Base Interest Fraction will be one; and
(B) any of the Class A-1 through Class E certificates with a Pass-Through Rate equal to a fixed per annum rate, will be a fraction (not greater than one) (a) whose numerator is the greater of zero and the amount, if any, by which (i) the Pass-Through Rate on such class of certificates exceeds (ii) the yield rate (as provided by the master servicer) used in calculating the prepayment premium or yield maintenance charge, as applicable, with respect to such principal prepayment and (b) whose denominator is the amount, if any, by which (i) the Mortgage Rate on such Mortgage Loan (net of the Administrative Cost Rate) during the related interest accrual period multiplied by 365/360 exceeds (ii) the yield rate (as provided by the master servicer) used in calculating the prepayment premium or yield maintenance charge, as |
| THE INFORMATION IN THIS STRUCTURAL AND COLLATERAL TERM SHEET IS NOT COMPLETE AND MAY BE AMENDED PRIOR TO THE TIME OF SALE. THIS TERM SHEET IS NOT AN OFFER TO SELL THESE SECURITIES AND IT IS NOT A SOLICITATION OF AN OFFER TO BUY THESE SECURITIES IN ANY JURISDICTION WHERE THE OFFER OR SALE IS NOT PERMITTED. | ||
| 14 | ||
Benchmark 2024-V5 Mortgage Trust |
| STRUCTURE OVERVIEW |
|
applicable, with respect to such principal prepayment; provided, however, that if such yield rate is greater than or equal to the amount set forth in clause (b)(i) above, then the respective Base Interest Fraction will be zero; provided, further, that if such yield rate is greater than or equal to the amount set forth in clause (b)(i) above, but less than the Pass-Through Rate described in clause (a)(i) above, then the respective Base Interest Fraction will be one.
The remaining percentage of the Non-VRR Percentage of prepayment premiums will be allocated to the Class X-A, Class X-B and Class X-D certificates in the manner described in the Preliminary Prospectus. In general, this formula provides for an increase in the percentage of prepayment premiums allocated to the YM P&I Certificates then entitled to principal distributions relative to the Class X-A, Class X-B and Class X-D certificates as Discount Rates decrease and a decrease in the percentage allocated to such classes as Discount Rates rise. |
| Whole Loans: | The mortgaged properties identified on Annex A-1 to the Preliminary Prospectus as Tysons Corner Center, DoubleTree by Hilton Hotel Orlando at SeaWorld, Acquisition America Portfolio, 333 South Spruce Street, Garden State Plaza, Galleria at Tyler, Warwick New York and Philadelphia Marriott Downtown each secure both a mortgage loan to be included in the trust fund and one or more other companion loans that will not be included in the trust fund, each of which will be pari passu or subordinate in right of payment with the mortgage loan included in the trust fund. We refer to each such group of related loans as a “whole loan”.
As of the Closing Date, the pari passu companion loans and any subordinate companion loans are expected to be held by the party identified in “—Companion Loan Summary” above and the table titled “Whole Loan Control Notes and Non-Control Notes” in “Description of the Mortgage Pool—The Whole Loans—General” in the Preliminary Prospectus. |
| Control Rights and Directing Holder: | With respect to any Serviced Mortgage Loan and any related Serviced Companion Loan, the Directing Holder will generally be entitled to direct the Special Servicer to take, or refrain from taking certain actions with respect to each Serviced Mortgage Loan and any related Serviced Companion Loans. Furthermore, the Directing Holder will also have the right to receive notice and consent to certain material actions that the Master Servicer and the Special Servicer proposes to take with respect to each Serviced Mortgage Loan and any related Serviced Companion Loans.
The “Directing Holder” means, (i) with respect to each Serviced Mortgage Loan (other than any Servicing Shift Mortgage Loan) or Serviced Whole Loan (other than any Servicing Shift Whole Loan), the certificateholder (or its representative) selected by more than 50% of the Controlling Class, by Certificate Balance, as determined by the certificate registrar from time to time (the “Trust Directing Holder”); and (ii) with respect to any Servicing Shift Mortgage Loan or Servicing Shift Whole Loan, the related Loan-Specific Directing Holder identified in the Preliminary Prospectus (which is expected to be the holder of the related controlling pari passu companion loan) prior to the related Servicing Shift Securitization Date.
RREF IV-D AIV RR, LLC or its affiliate is expected to appoint itself or its affiliate as the initial Trust Directing Holder.
For a description of the directing holder (or equivalent party) for each Non-Serviced Whole Loan, see “Description of the Mortgage Pool—The Whole Loans” and “Pooling and Servicing Agreement—The Directing Holder” in the Preliminary Prospectus. |
| Control Eligible Certificates: | Class G-RR and Class J-RR certificates. |
| Controlling Class: | The Controlling Class will be, as of any time of determination, the most subordinate class of Control Eligible Certificates then-outstanding that has an aggregate Certificate Balance (as notionally reduced by any cumulative appraisal reduction amounts allocable to such class) equal to at least 25% of the initial Certificate Balance of such class; provided that if at any time the Certificate Balances of all Control Eligible Certificates, as notionally reduced by any appraisal reduction amounts (but without regard to any collateral deficiency amounts) allocable to such classes, have been reduced to zero, then the “Controlling Class” will be the most subordinate class of Control Eligible Certificates that has an aggregate principal balance greater than zero; provided, further, that if at any time the Certificate Balances of the Class A-1, Class A-2, Class A-3, Class A-M, Class B, Class C, Class D, Class E and Class F certificates have been reduced to zero as a result of the allocation of principal payments on the Mortgage |
| THE INFORMATION IN THIS STRUCTURAL AND COLLATERAL TERM SHEET IS NOT COMPLETE AND MAY BE AMENDED PRIOR TO THE TIME OF SALE. THIS TERM SHEET IS NOT AN OFFER TO SELL THESE SECURITIES AND IT IS NOT A SOLICITATION OF AN OFFER TO BUY THESE SECURITIES IN ANY JURISDICTION WHERE THE OFFER OR SALE IS NOT PERMITTED. | ||
| 15 | ||
Benchmark 2024-V5 Mortgage Trust |
| STRUCTURE OVERVIEW |
Loans, then the “Controlling Class” will be the most subordinate class of Control Eligible Certificates that has an aggregate Certificate Balance greater than zero without regard to the application of appraisal reduction amounts (or any collateral deficiency amounts) to notionally reduce the Certificate Balance of such class. The Controlling Class as of the Closing Date will be the Class J-RR certificates. | |
| Appraised-Out Class: | Any class of Control Eligible Certificates that has been determined, as a result of appraisal reduction amounts and collateral deficiency amounts allocable to such class, to no longer be the Controlling Class (an “Appraised-Out Class”). |
| Remedies
Available to Holders of an Appraised-Out Class: |
Holders of the majority (by Certificate Balance) of an Appraised-Out Class will have the right, at their sole expense, to require the Special Servicer to order a supplemental appraisal of any Mortgage Loan (or Serviced Whole Loan) for which an appraisal reduction event has occurred or as to which there exists a collateral deficiency amount. Upon receipt of such supplemental appraisal, the Special Servicer will be required to send the appraisal to the Master Servicer, who will be required to recalculate the appraisal reduction amount or collateral deficiency amount, as applicable, based on such supplemental appraisal, and if required by such recalculation, the applicable Appraised-Out Class as the Controlling Class. Any Appraised-Out Class requesting a supplemental appraisal will not be entitled to exercise any rights of the Controlling Class until such time, if any, as the class is reinstated as the Controlling Class. |
| Control Termination Event: | Will occur and be continuing with respect to any Mortgage Loan (other than any Servicing Shift Mortgage Loan or Serviced Whole Loan (other than any Servicing Shift Whole Loan), when one or more of the following is true: (i) the Class G-RR certificates have a Certificate Balance (taking into account the application of any cumulative appraisal reduction amounts and collateral deficiency amounts to notionally reduce the Certificate Balance of such class) being reduced to less than 25% of the initial Certificate Balance of that class, (ii) the holder of the Class G-RR certificates is the majority Controlling Class Certificateholder and has irrevocably waived its right, in writing, to exercise any of the rights of the Controlling Class Certificateholder and such rights have not been reinstated to a successor controlling class certificateholder pursuant to the terms of the PSA or (iii) such Mortgage Loan or Whole Loan is an applicable excluded loan; provided, further, that a Control Termination Event will not be deemed to be continuing in the event the Certificate Balances of all Classes of Principal Balance Certificates other than the Control Eligible Certificates have been reduced to zero; provided, further, that no Control Termination Event may occur with respect to the Loan-Specific Directing Holder related to any Servicing Shift Whole Loan and the term “Control Termination Event” will not be applicable to the Loan-Specific Directing Holder related to such Servicing Shift Whole Loan. With respect to an excluded loan related to the Directing Holder, a Control Termination Event will be deemed to exist. During the continuance of a Control Termination Event, the Directing Holder will no longer have any control rights. The Directing Holder will no longer have the right to direct certain actions of the Special Servicer and will no longer have consent rights with respect to certain material actions that the Master Servicer or Special Servicer proposes to take with respect to a Serviced Mortgage Loan and any related Serviced Companion Loans. During the continuance of a Control Termination Event, the Directing Holder will retain non-binding consultation rights with respect to certain material actions that the Special Servicer proposes to take with respect to a Serviced Mortgage Loan and any related Serviced Companion Loans. Such consultation rights will continue until the occurrence of a Consultation Termination Event. |
| Consultation Termination Event: | Will occur and be continuing with respect to any Mortgage Loan (other than any Servicing Shift Mortgage Loan) or Serviced Whole Loan (other than any Servicing Shift Whole Loan), when one or more of the following is true: (i) there is no class of Control Eligible Certificates that has a then-outstanding Certificate Balance (without regard to the application of any cumulative appraisal reduction amounts) equal to at least 25% of the initial Certificate Balance of that class, (ii) the holder of the Class G-RR certificates is the majority Controlling Class Certificateholder and has irrevocably waived its right, in writing, to exercise any of the rights of the Controlling Class Certificateholder and such rights have not been reinstated to a successor controlling class certificateholder pursuant to the terms of the PSA, or (iii) such Mortgage Loan or Whole Loan is an applicable excluded loan; provided, further, that a Consultation |
| THE INFORMATION IN THIS STRUCTURAL AND COLLATERAL TERM SHEET IS NOT COMPLETE AND MAY BE AMENDED PRIOR TO THE TIME OF SALE. THIS TERM SHEET IS NOT AN OFFER TO SELL THESE SECURITIES AND IT IS NOT A SOLICITATION OF AN OFFER TO BUY THESE SECURITIES IN ANY JURISDICTION WHERE THE OFFER OR SALE IS NOT PERMITTED. | ||
| 16 | ||
Benchmark 2024-V5 Mortgage Trust |
| STRUCTURE OVERVIEW |
Termination Event will not be deemed to be continuing in the event the Certificate Balances of all Classes of Principal Balance Certificates other than the Control Eligible Certificates have been reduced to zero; provided, further, that no Consultation Termination Event may occur with respect to the Loan-Specific Directing Holder related to any Servicing Shift Whole Loan and the term “Consultation Termination Event” will not be applicable to the Loan-Specific Directing Holder related to such Servicing Shift Whole Loan. With respect to an excluded loan related to the Directing Holder, a Consultation Termination Event will be deemed to exist. During the continuance of a Consultation Termination Event, the Directing Holder will have no rights under the PSA other than those rights that all Certificateholders have. | |
| Risk Retention Consultation Party: | The risk retention consultation parties will have certain non-binding consultation rights with respect to certain material servicing actions. Each holder of the VRR Interest will be entitled to appoint a risk retention consultation party. Deutsche Bank AG, New York Branch (a majority-owned affiliate of GACC) and CREFI are expected to be appointed as the initial risk retention consultation parties. |
| Appointment
and Replacement of Special Servicer: |
The Directing Holder will appoint the initial Special Servicer with respect to each Serviced Mortgage Loan and any related Serviced Companion Loans as of the Closing Date. For so long as no Control Termination Event is continuing, the Directing Holder generally may replace the Special Servicer with respect to each Serviced Mortgage Loan and any related Serviced Companion Loans with or without cause at any time. During the continuance of a Control Termination Event, the Directing Holder will no longer have the right to replace the Special Servicer and such replacement (other than with respect to the Non-Serviced Whole Loans) will occur based on a vote of holders of all voting eligible classes of certificates as described below. See “Description of the Mortgage Pool—The Whole Loans” and “Pooling and Servicing Agreement” in the Preliminary Prospectus for a description of the special servicer appointment and replacement rights with respect to Non-Serviced Whole Loans. |
| Replacement
of Special Servicer by Vote of Certificateholders: |
Other than with respect to Non-Serviced Whole Loans, if a Control Termination Event is continuing, upon (i) the written direction of holders of certificates evidencing not less than 25% of the voting rights (taking into account the application of any appraisal reduction amounts to notionally reduce the Certificate Balances) of the Principal Balance Certificates and the VRR Interest requesting a vote to replace the Special Servicer (other than with respect to any Servicing Shift Whole Loan) with a new special servicer, (ii) payment by such requesting holders to the Certificate Administrator of all reasonable fees and expenses to be incurred by the Certificate Administrator in connection with administering such vote and (iii) delivery by such holders to the Certificate Administrator and Trustee of written confirmations from each Rating Agency that the appointment of the replacement Special Servicer will not result in a downgrade of the certificates, the Certificate Administrator will be required to promptly post notice of such request on the Certificate Administrator’s website and concurrently provide written notice of such request by mail to all Certificateholders of such request and conduct the solicitation of votes of all certificates in such regard, which such vote must occur within 180 days of the posting of such notice. Upon the written direction of (i) holders of Principal Balance Certificates and the VRR Interest evidencing at least 66-2/3% of a Certificateholder Quorum or (ii) holders of Principal Balance Certificates and the VRR Interest evidencing more than 50% of the aggregate voting rights of Principal Balance Certificates and the VRR Interest outstanding that has not been reduced to less than 25% of its initial Certificate Balance through the application of appraisal reduction amounts and realized losses), the Trustee will immediately replace the Special Servicer with the replacement Special Servicer (other than with respect to Non-Serviced Whole Loans). “Certificateholder Quorum” means, in connection with any solicitation of votes in connection with the replacement of the Special Servicer as described above or the Asset Representations Reviewer as described below, the holders of certificates evidencing at least 50% of the aggregate voting rights (taking into account the application of any appraisal reduction amounts to notionally reduce the Certificate Balance of the certificates, except in the case of the termination of the Asset Representations Reviewer) of all Principal Balance Certificates and the VRR Interest, on an aggregate basis. |
| THE INFORMATION IN THIS STRUCTURAL AND COLLATERAL TERM SHEET IS NOT COMPLETE AND MAY BE AMENDED PRIOR TO THE TIME OF SALE. THIS TERM SHEET IS NOT AN OFFER TO SELL THESE SECURITIES AND IT IS NOT A SOLICITATION OF AN OFFER TO BUY THESE SECURITIES IN ANY JURISDICTION WHERE THE OFFER OR SALE IS NOT PERMITTED. | ||
| 17 | ||
Benchmark 2024-V5 Mortgage Trust |
| STRUCTURE OVERVIEW |
If at any time, the Operating Advisor determines, in its sole discretion exercised in good faith, that (1) the Special Servicer is not performing its duties as required under the PSA or is otherwise not acting in accordance with the Servicing Standard and (2) the replacement of the Special Servicer would be in the best interest of the Certificateholders as a collective whole, then the Operating Advisor will have the right to recommend the replacement of the Special Servicer. The Operating Advisor’s recommendation to replace the Special Servicer (other than with respect Non-Serviced Whole Loans) must be confirmed by a majority of a quorum of Certificateholders (which, for this purpose, is the Certificateholders that (i) evidence at least 20% of the Voting Rights (taking into account the application of any appraisal reduction amounts to notionally reduce the respective Certificate Balances) of all Principal Balance Certificates and the VRR Interest on an aggregate basis and (ii) consist of at least three Certificateholders or Certificate Owners that are not risk retention affiliated with each other) within 180 days from the time such recommendation is posted to the Certificate Administrator website and is subject to the receipt of written confirmations from each Rating Agency that the appointment of the replacement Special Servicer will not result in a downgrade of the certificates. See “Description of the Mortgage Pool—The Whole Loans” and “Pooling and Servicing Agreement” in the Preliminary Prospectus for a description of the special servicer appointment and replacement rights with respect to Non-Serviced Whole Loans. | |
| Cap
on Workout and Liquidation Fees: |
The workout fees and liquidation fees payable to a Special Servicer under the PSA will be an amount equal to the lesser of: (1) 1.0% of each collection of interest and principal following a workout or liquidation, subject to a minimum of $25,000 and (2) $1,000,000 per workout or liquidation. All Modification Fees actually paid to the Special Servicer in connection with a workout or liquidation or in connection with any prior workout or partial liquidation that occurred within the prior 18 months will be deducted from the total workout fee (only after receipt by the Special Servicer of workout fees of $25,000) and/or liquidation fees payable (other than Modification Fees earned while the Mortgage Loan was not in special servicing). In addition, the total amount of workout and liquidation fees actually payable by the Issuing Entity under the PSA will be capped in the aggregate at $1,000,000 for each related Mortgage Loan. If a new special servicer begins servicing the related Mortgage Loan, all amounts paid to the prior special servicer will be disregarded for purposes of calculating the cap. |
| Special Servicer Compensation: | The special servicing fee will equal 0.25% per annum of the stated principal balance of the related specially serviced loan or REO property, as applicable with a minimum monthly fee of $5,000. The Special Servicer and its affiliates will be prohibited from receiving or retaining any compensation or any other remuneration under the PSA (including, without limitation, in the form of commissions, brokerage fees, rebates, or as a result of any other fee-sharing arrangement) from any person (including, without limitation, the issuing entity, any borrower, any manager, any guarantor or indemnitor in respect of a Serviced Mortgage Loan and any related Serviced Companion Loans, and any purchaser of any Serviced Mortgage Loan and any related Serviced Companion Loan or REO Property) in connection with the disposition, workout or foreclosure of any Mortgage Loan (or Serviced Whole Loan, if applicable), the management or disposition of any REO Property, or the performance of any other special servicing duties under the PSA, other than as expressly permitted in the PSA and other than commercially reasonable treasury management fees, banking fees, property condition report fees, customary title agent fees and insurance commissions or fees received or retained by the Special Servicer or any of its Affiliates in connection with any services performed by such party with respect to any Mortgage Loan, Serviced Whole Loan or REO Property. Subject to certain limited exceptions, the Special Servicer will also be required to report any compensation or other remuneration the Special Servicer or its affiliates have received from any person and such information will be disclosed in the Certificateholders’ monthly distribution date statement. |
| Operating Advisor: | With respect to the Serviced Mortgage Loans and any related Serviced Companion Loans the Operating Advisor will have access to any final asset status report and all information available with respect to the transaction on the Certificate Administrator’s website and will have certain monitoring responsibilities on behalf of the entire trust. After the occurrence and during the continuance of an Operating Advisor Consultation Event, the Operating Advisor will have consultation rights with respect to certain major decisions. The Operating Advisor will be subject to termination if holders of at least 15% of the aggregate voting rights of the certificates (in connection with termination and replacement relating to the |
| THE INFORMATION IN THIS STRUCTURAL AND COLLATERAL TERM SHEET IS NOT COMPLETE AND MAY BE AMENDED PRIOR TO THE TIME OF SALE. THIS TERM SHEET IS NOT AN OFFER TO SELL THESE SECURITIES AND IT IS NOT A SOLICITATION OF AN OFFER TO BUY THESE SECURITIES IN ANY JURISDICTION WHERE THE OFFER OR SALE IS NOT PERMITTED. | ||
| 18 | ||
Benchmark 2024-V5 Mortgage Trust |
| STRUCTURE OVERVIEW |
Mortgage Loans) vote to terminate and replace the Operating Advisor and such vote is approved by holders of more than 50% of the applicable voting rights that exercise their right to vote (in the case of each of such vote and approval, taking into account realized losses and the application of any appraisal reduction amounts to notionally reduce the Certificate Balance of the certificates), provided that holders of at least 50% of the applicable voting rights have exercised their right to vote. The holders initiating such vote will be responsible for the fees and expenses in connection with the vote and replacement. An “Operating Advisor Consultation Event” will occur upon the earlier of when (i) the aggregate Certificate Balances of the HRR Certificates (taking into account the application of any Cumulative Appraisal Reduction Amounts to notionally reduce the Certificate Balances of such classes) is 25% or less of the initial aggregate Certificate Balances of the HRR Certificates and (ii) a Control Termination Event has occurred and is continuing (or a Control Termination Event would occur and be continuing if not for the last proviso in the definition of Control Termination Event). The Operating Advisor will not have consultation rights in respect of Non-Serviced Mortgage Loans. | |
| Asset Representations Reviewer: | The Asset Representations Reviewer will be required to review certain delinquent Mortgage Loans after a specified delinquency threshold has been exceeded and the required percentage of Certificateholders vote to direct a review of such delinquent Mortgage Loans. An asset review will occur when either (1) Mortgage Loans with an aggregate outstanding principal balance of 25% or more of the aggregate outstanding principal balance of all of the Mortgage Loans (including any REO loans (or a portion of any REO loan in the case of a whole loan)) held by the issuing entity as of the end of the applicable collection period are delinquent loans or (2)(A) prior to and including the second anniversary of the Closing Date, at least 10 Mortgage Loans are delinquent loans as of the end of the applicable collection period and the outstanding principal balance of such delinquent loans in the aggregate constitutes at least 15% of the aggregate outstanding principal balance of all of the Mortgage Loans (including any REO loans (or a portion of any REO loan in the case of a whole loan)) held by the issuing entity as of the end of the applicable collection period, or (B) after the second anniversary of the Closing Date, at least 15 Mortgage Loans are delinquent loans as of the end of the applicable collection period and the outstanding principal balance of such delinquent loans in the aggregate constitutes at least 20% of the aggregate outstanding principal balance of all of the Mortgage Loans (including any REO loans (or a portion of any REO loan in the case of a whole loan)) held by the issuing entity as of the end of the applicable collection period. The Asset Representations Reviewer may be terminated and replaced without cause. Upon (i) the written direction of Certificateholders evidencing not less than 25% of the voting rights (taking into account realized losses, but without regard to the application of any appraisal reduction amounts to notionally reduce the Certificate Balance of the certificates) requesting a vote to terminate and replace the Asset Representations Reviewer with a proposed successor asset representations reviewer that is an eligible asset representations reviewer, and (ii) payment by such holders to the Certificate Administrator of the reasonable fees and expenses to be incurred by the Certificate Administrator in connection with administering such vote, the Certificate Administrator will promptly provide notice to all Certificateholders and the Asset Representations Reviewer of such request by posting such notice on its internet website, and by mailing such notice to all Certificateholders and the Asset Representations Reviewer. Upon the written direction of Certificateholders evidencing at least 75% of a Certificateholder Quorum, the Trustee will terminate all of the rights and obligations of the Asset Representations Reviewer under the PSA by written notice to the Asset Representations Reviewer, and the proposed successor Asset Representations Reviewer will be appointed. See “Pooling and Servicing Agreement—The Asset Representations Reviewer” in the Preliminary Prospectus. |
| Dispute Resolution Provisions: | Each Mortgage Loan Seller will be subject to the dispute resolution provisions set forth in the PSA to the extent those provisions are triggered with respect to any Mortgage Loan sold to the depositor by such Mortgage Loan Seller and such Mortgage Loan Seller will be obligated under the related mortgage loan purchase agreement to comply with all applicable provisions and to take part in any mediation or arbitration proceedings that may result. Generally, in the event that a repurchase request as described in the Preliminary Prospectus is not “Resolved” within 180 days after the related Mortgage Loan Seller receives such Repurchase Request, then the enforcing servicer will be required to send a notice to the initial |
| THE INFORMATION IN THIS STRUCTURAL AND COLLATERAL TERM SHEET IS NOT COMPLETE AND MAY BE AMENDED PRIOR TO THE TIME OF SALE. THIS TERM SHEET IS NOT AN OFFER TO SELL THESE SECURITIES AND IT IS NOT A SOLICITATION OF AN OFFER TO BUY THESE SECURITIES IN ANY JURISDICTION WHERE THE OFFER OR SALE IS NOT PERMITTED. | ||
| 19 | ||
Benchmark 2024-V5 Mortgage Trust |
| STRUCTURE OVERVIEW |
requesting Certificateholder (if any) indicating the enforcing servicer’s intended course of action with respect to the Repurchase Request. If (a) the enforcing servicer’s intended course of action with respect to the Repurchase Request does not involve pursuing further action to exercise rights against the related Mortgage Loan Seller with respect to the Repurchase Request and the initial requesting Certificateholder, if any, or any other Certificateholder or Certificate Owner wishes to exercise its right to refer the matter to mediation (including nonbinding arbitration) or arbitration, or (b) the enforcing servicer’s intended course of action is to pursue further action to exercise rights against the related Mortgage Loan Seller with respect to the Repurchase Request but the initial requesting Certificateholder, if any, or any other Certificateholder or Certificate Owner does not agree with the dispute resolution method selected by the enforcing servicer, then the initial requesting Certificateholder, if any, or such other Certificateholder or Certificate Owner may deliver a written notice to the enforcing servicer indicating its intent to exercise its right to refer the matter to either mediation or arbitration. “Resolved” means, with respect to a Repurchase Request, (i) that the related material defect or material breach has been cured, (ii) the related Mortgage Loan has been repurchased in accordance with the related mortgage loan purchase agreement, (iii) a mortgage loan has been substituted for the related Mortgage Loan in accordance with the related mortgage loan purchase agreement, (iv) the applicable Mortgage Loan Seller made the loss of value payment, (v) a contractually binding agreement is entered into between the enforcing servicer, on behalf of the issuing entity, and the related Mortgage Loan Seller that settles the related Mortgage Loan Seller’s obligations under the related mortgage loan purchase agreement, or (vi) the related Mortgage Loan is no longer property of the issuing entity as a result of a sale or other disposition in accordance with the PSA. See “Pooling and Servicing Agreement—Dispute Resolution Provisions” in the Preliminary Prospectus. | |
| Liquidated Loan Waterfall: | On liquidation of any Mortgage Loan, all net liquidation proceeds will be applied according to the PSA, so that amounts allocated as a recovery of accrued and unpaid interest will not, in the first instance, include (a) any amount by which the interest portion of P&I Advances previously made was reduced as a result of appraisal reduction amounts and (b) Accrued AB Loan Interest. After the adjusted interest amount is so allocated, any remaining net liquidation proceeds will be allocated to pay principal on the Mortgage Loan until the unpaid principal amount of the Mortgage Loan has been reduced to zero. Any remaining liquidation proceeds would then be allocated as a recovery of (a) accrued and unpaid interest corresponding to the amount by which the interest portion of P&I Advances previously made was reduced as a result of appraisal reduction amounts and (b) any Accrued AB Loan Interest. |
| THE INFORMATION IN THIS STRUCTURAL AND COLLATERAL TERM SHEET IS NOT COMPLETE AND MAY BE AMENDED PRIOR TO THE TIME OF SALE. THIS TERM SHEET IS NOT AN OFFER TO SELL THESE SECURITIES AND IT IS NOT A SOLICITATION OF AN OFFER TO BUY THESE SECURITIES IN ANY JURISDICTION WHERE THE OFFER OR SALE IS NOT PERMITTED. | ||
| 20 | ||
|
Multifamily – Various Various Various, MI Various
|
Collateral Asset Summary – Loan No. 1 Highland Multifamily Portfolio |
Cut-off Date Balance: Cut-off Date LTV: U/W NCF DSCR: U/W NOI Debt Yield: |
$75,000,000 55.8% 1.45x 11.3% |
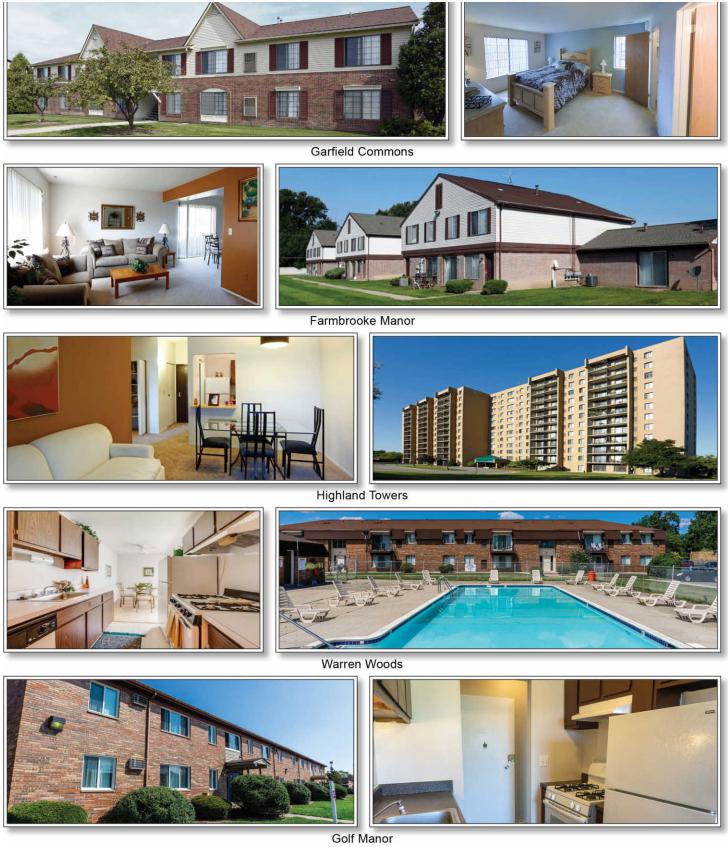
| THE INFORMATION IN THIS STRUCTURAL AND COLLATERAL TERM SHEET IS NOT COMPLETE AND MAY BE AMENDED PRIOR TO THE TIME OF SALE. THIS TERM SHEET IS NOT AN OFFER TO SELL THESE SECURITIES AND IT IS NOT A SOLICITATION OF AN OFFER TO BUY THESE SECURITIES IN ANY JURISDICTION WHERE THE OFFER OR SALE IS NOT PERMITTED. | ||
| 21 | ||
|
Multifamily – Various Various Various, MI Various
|
Collateral Asset Summary – Loan No. 1 Highland Multifamily Portfolio |
Cut-off Date Balance: Cut-off Date LTV: U/W NCF DSCR: U/W NOI Debt Yield: |
$75,000,000 55.8% 1.45x 11.3% |
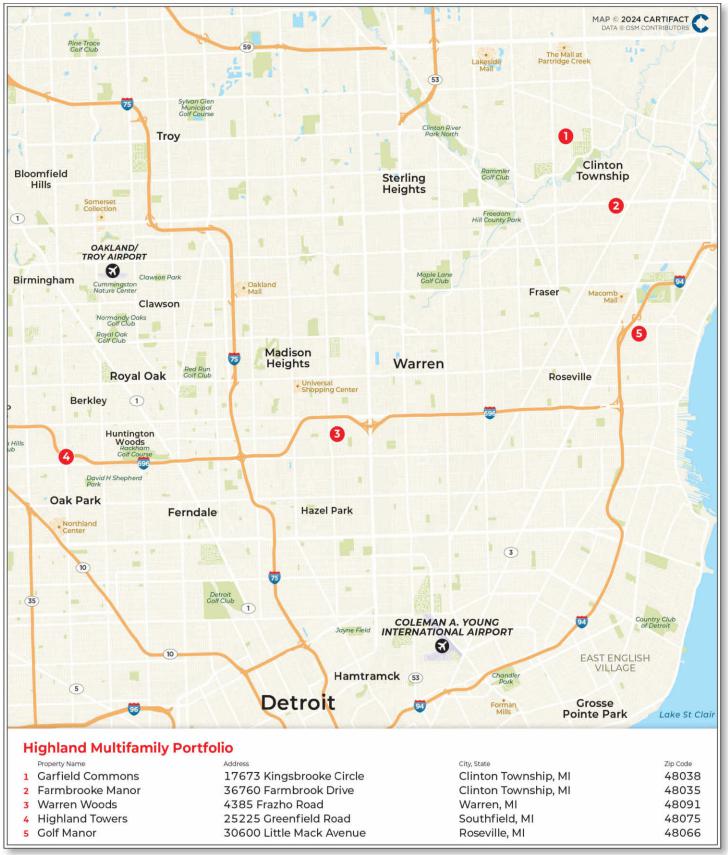
| THE INFORMATION IN THIS STRUCTURAL AND COLLATERAL TERM SHEET IS NOT COMPLETE AND MAY BE AMENDED PRIOR TO THE TIME OF SALE. THIS TERM SHEET IS NOT AN OFFER TO SELL THESE SECURITIES AND IT IS NOT A SOLICITATION OF AN OFFER TO BUY THESE SECURITIES IN ANY JURISDICTION WHERE THE OFFER OR SALE IS NOT PERMITTED. | ||
| 22 | ||
|
Multifamily – Various Various Various, MI Various
|
Collateral Asset Summary – Loan No. 1 Highland Multifamily Portfolio |
Cut-off Date Balance: Cut-off Date LTV: U/W NCF DSCR: U/W NOI Debt Yield: |
$75,000,000 55.8% 1.45x 11.3% |
| Mortgage Loan Information | Properties Information | |||
| Loan Seller: | CREFI | Single Asset / Portfolio: | Portfolio | |
| Loan Purpose: | Refinance | Properties Type – Subtype(3): | Multifamily – Various | |
| Borrower Sponsor(s): | Michael Colman, David Colman and Evan Ross | Collateral: | Fee | |
| Borrower(s)(1): | Various | Location(3): | Various, MI | |
| Original Balance: | $75,000,000 | Year Built / Renovated(3): | Various / Various | |
| Cut-off Date Balance: | $75,000,000 | Properties Management: | RoCo Management, LLC | |
| % by Initial UPB: | 8.5% | Size: | 1,390 Units | |
| Interest Rate: | 7.32000% | Appraised Value / Per Unit: | $134,400,000 / $96,691 | |
| Note Date: | December 8, 2023 | Appraisal Date: | November 2, 2023 | |
| Original Term: | 60 months | Occupancy: | 91.2% (as of October 25, 2023) | |
| Amortization: | Interest Only | UW Economic Occupancy: | 86.1% | |
| Original Amortization: | NAP | Underwritten NOI: | $8,459,372 | |
| Interest Only Period: | 60 months | Underwritten NCF: | $8,095,528 | |
| First Payment Date: | February 6, 2024 | |||
| Maturity Date: | January 6, 2029 | Historical NOI | ||
| Additional Debt Type: | NAP | Most Recent NOI(4): | $7,925,705 (TTM September 30, 2023) | |
| Additional Debt Balance: | NAP | 2022 NOI(4): | $7,218,290 | |
| Call Protection: | L(24),D(32),O(4) | 2021 NOI: | $7,057,618 | |
| Lockbox / Cash Management: | Springing / Springing | 2020 NOI: | $5,995,687 | |
| Reserves(2) | Financial Information | |||||
| Initial | Monthly | Cap | Cut-off Date Loan / Unit: | $53,957 | ||
| Taxes: | $388,236 | $97,059 | NAP | Maturity Date Loan / Unit: | $53,957 | |
| Insurance: | $0 | Springing | NAP | Cut-off Date LTV: | 55.8% | |
| Replacement Reserves: | $11,738,000 | $30,230 | NAP | Maturity Date LTV: | 55.8% | |
| TI / LC: | $0 | $0 | NAP | UW NOI DY: | 11.3% | |
| Deferred Maintenance: | $167,568 | $0 | NAP | UW NCF DSCR: | 1.45x | |
| Sources and Uses | |||||||
| Sources | Proceeds | % of Total | Uses | Proceeds | % of Total | ||
| Mortgage Loan | $75,000,000 | 100.0% | Loan Payoff(5) | $36,385,594 | 48.5 | % | |
| Return of Equity | 24,075,195 | 32.1 | |||||
| Upfront Reserves | 12,293,804 | 16.4 | |||||
| Closing Costs | 2,245,407 | 3.0 | |||||
| Total Sources | $75,000,000 | 100.0% | Total Uses | $75,000,000 | 100.0 | % | |
| (1) | The borrowers are Highland Towers Associates, LLC, Warren Woods Associates, LLC, Farmbrooke Manor Associates, LLC, Garfield Court Associates, LLC and Golf Manor Associates, LLC. |
| (2) | See “Initial and Ongoing Reserves” below. |
| (3) | See “Portfolio Summary” below. |
| (4) | The increase from 2022 NOI to Most Recent NOI is a result of increased base rents following approximately $4.1 million of capital improvements invested into the Highland Multifamily Portfolio Properties (as defined below) from 2019 to 2021. |
| (5) | Loan Payoff represents the payoff of five of the six properties previously securitized in the WFRBS 2014-C21 transaction. The sixth property, Warren Manor, was sold separately. |
The Loan. The largest mortgage loan (the “Highland Multifamily Portfolio Mortgage Loan”) is secured by the borrowers’ fee interests in five multifamily properties located in the Detroit metropolitan statistical area (“MSA”). Four of the five properties consist of two-story garden-style apartments, and one property consists of a single age restricted high rise apartment building, for a total of 1,390 units (the “Highland Multifamily Portfolio Properties”). The Highland Multifamily Portfolio Mortgage Loan is evidenced by a single promissory note with an outstanding principal balance as of the Cut-off Date of $75,000,000. The Highland Multifamily Portfolio Mortgage Loan was originated on December 8, 2023 by CREFI and accrues interest at a fixed rate of 7.32000% per annum. The Highland Multifamily Portfolio Mortgage Loan has an initial term of five years and is interest-only for the full term. The scheduled maturity date of the Highland Multifamily Portfolio Mortgage Loan is the payment date that occurs in January 2029.
| THE INFORMATION IN THIS STRUCTURAL AND COLLATERAL TERM SHEET IS NOT COMPLETE AND MAY BE AMENDED PRIOR TO THE TIME OF SALE. THIS TERM SHEET IS NOT AN OFFER TO SELL THESE SECURITIES AND IT IS NOT A SOLICITATION OF AN OFFER TO BUY THESE SECURITIES IN ANY JURISDICTION WHERE THE OFFER OR SALE IS NOT PERMITTED. | ||
| 23 | ||
|
Multifamily – Various Various Various, MI Various
|
Collateral Asset Summary – Loan No. 1 Highland Multifamily Portfolio |
Cut-off Date Balance: Cut-off Date LTV: U/W NCF DSCR: U/W NOI Debt Yield: |
$75,000,000 55.8% 1.45x 11.3% |
The Properties. The Highland Multifamily Portfolio Properties consist of five properties, totaling 1,390 units all located within the Detroit MSA. The Highland Multifamily Portfolio Properties were built between 1969 and 1988 and were 91.2% occupied as of October 25, 2023. The Highland Multifamily Portfolio Properties unit mix consists of 650 one-bedroom units, 612 two-bedrooms units and 128 three-bedroom units. The borrower sponsors acquired the Highland Multifamily Portfolio Properties in 2014 and have subsequently invested approximately $14.6 million into the properties with $4.1 million invested between 2019 and 2021 and currently plan to invest approximately $11.74 million post-closing to renovate the Highland Multifamily Portfolio Properties, which amount was reserved at origination of the Highland Multifamily Portfolio Mortgage Loan.
The following table presents certain information relating to the Highland Multifamily Portfolio Properties:
| Portfolio Summary | |||||||||||
| Property Name | City, State | Property Type - Subtype | Year Built / Renovated | Units(1) | Occupancy(1) | Allocated Cut-off Date Balance | % of Allocated Cut-off Date Balance | Appraised Value(2) | U/W NOI(1) | % of U/W NOI(1) | |
| Garfield Commons | Clinton Township, MI | Multifamily - Garden | 1988 / NAP | 496 | 92.5% | $30,500,000 | 40.7% | $54,500,000 | $3,384,108 | 40.0 | % |
| Farmbrooke Manor | Clinton Township, MI | Multifamily - Garden | 1975 / 2023 | 320 | 95.0 | 19,000,000 | 25.3 | 33,700,000 | 2,192,063 | 25.9 | |
| Warren Woods | Warren, MI | Multifamily - Garden | 1970 / NAP | 192 | 84.4 | 10,250,000 | 13.7 | 18,550,000 | 1,198,710 | 14.2 | |
| Highland Towers | Southfield, MI | Multifamily -Age Restricted | 1977 / NAP | 262 | 86.6 | 9,300,000 | 12.4 | 16,900,000 | 1,036,954 | 12.3 | |
| Golf Manor | Roseville, MI | Multifamily - Garden | 1969 / 2022 | 120 | 95.8 | 5,950,000 | 7.9 | 10,750,000 | 647,536 | 7.7 | |
| Total / Wtd. Avg. | 1,390 | 91.2% | $75,000,000 | 100.0% | $134,400,000 | $8,459,372 | 100.0 | % | |||
| (1) | Based on the underwritten rent rolls dated October 25, 2023. |
| (2) | Source: Appraisals. |
Garfield Commons (496 Units, 40.0% of Underwritten NOI)
The Garfield Commons property is a 496-unit garden style apartment community located at 17673 Kingsbrooke Circle, Clinton Township, Michigan (the “Garfield Commons Property”). The Garfield Commons Property was built in 1988, consists of 200 one-bedroom units and 296 two-bedroom units and has an in place occupancy of 92.5% as of October 25, 2023. Amenities at the Garfield Commons Property include an outdoor swimming pool, fully equipped kitchens, playground, tennis court and covered parking. Unit amenities at the Garfield Commons Property include fully equipped kitchens, washer and dryers in select units, dishwashers and pet friendly units.
Farmbrooke Manor (320 Units, 25.9% of Underwritten NOI)
The Farmbrooke Manor property is a 320-unit garden style apartment community located at 36760 Farmbrooke Drive, Clinton Township, Michigan (the “Farmbrooke Manor Property”). The Farmbrooke Manor Property was built in 1975 and consists of 32 one-bedroom units, 160 two-bedroom units, and 128 three-bedroom units with an in-place occupancy of 95.0% as of October 25, 2023. The Farmbrooke Manor Property has seven section 8 units. Amenities at the Farmbrooke Manor Property include an outdoor swimming pool, sundeck, parking and laundry facilities. Unit amenities at the Farmbrooke Manor Property include fully equipped kitchens, washer & dryers in select units and dishwashers.
Warren Woods (192 Units, 14.2% of Underwritten NOI)
The Warren Woods property is a 192-unit garden style apartment community located at 4385 Frazho Road, Warren, Michigan (the “Warren Woods Property”). The Warren Woods Property was built in 1970 and consists of 129 one-bedroom units and 63 two-bedroom units with in-place occupancy of 84.4% as of October 25, 2023. Amenities at the Warren Woods Property include an outdoor swimming pool, clubhouse, ample parking and laundry facilities. Unit amenities at the Warren Woods Property include gas ranges in apartments, patio/balconies, and dishwashers.
Highland Towers (262 Units, 12.3% of Underwritten NOI)
The Highland Towers property is a 262-unit age restricted high rise apartment building located at 25225 Greenfield Road, Southfield, Michigan (the “Highland Towers Property”). The Highland Towers Property was built in 1977 and consists of 217 one-bedroom units and 45 two-bedroom units with in-place occupancy of 86.6% as of October 25, 2023. The Highland Towers Property is age restricted to 55 and older and has 45 section 8 units. Amenities at the Highland Towers Property include an outdoor picnic area, pool, sundeck, ample parking, elevators, on-site management, and proximity to public transportation. Unit amenities at the Highland Towers Property feature fully equipped kitchens, air conditioning, dishwasher and separate dining areas.
| THE INFORMATION IN THIS STRUCTURAL AND COLLATERAL TERM SHEET IS NOT COMPLETE AND MAY BE AMENDED PRIOR TO THE TIME OF SALE. THIS TERM SHEET IS NOT AN OFFER TO SELL THESE SECURITIES AND IT IS NOT A SOLICITATION OF AN OFFER TO BUY THESE SECURITIES IN ANY JURISDICTION WHERE THE OFFER OR SALE IS NOT PERMITTED. | ||
| 24 | ||
|
Multifamily – Various Various Various, MI Various
|
Collateral Asset Summary – Loan No. 1 Highland Multifamily Portfolio |
Cut-off Date Balance: Cut-off Date LTV: U/W NCF DSCR: U/W NOI Debt Yield: |
$75,000,000 55.8% 1.45x 11.3% |
Golf Manor (120 Units, 7.7% of Underwritten NOI)
The Golf Manor Apartments property is a 120-unit garden style apartment community located at 30600 Little Mack Avenue, Roseville, Michigan (the “Golf Manor Property”). The Golf Manor Property was built in 1969 and consists of 72 one-bedroom units and 48 two-bedroom units with in-place occupancy of 95.8% as of October 25, 2023. Amenities at the Golf Manor Property include an outdoor swimming pool, laundry facilities, ample parking, and on-site maintenance. Unit amenities at the Golf Manor Property include fully equipped kitchens, and ceiling fans in units.
The following table presents certain information relating to the unit mix at the Highland Multifamily Portfolio Properties:
| Unit Mix(1) | ||||||
| Unit Type | # of Units | % of Total Units | Occupancy | Average Unit Size (Sq. Ft.) | Average Monthly Rent Per Unit | Average Monthly Market Rent Per Unit(2) |
| One Bedroom | 650 | 46.8% | 85.5% | 690 | $861 | $903 |
| Two Bedroom | 612 | 44.0 | 96.6% | 980 | $1,035 | $1,098 |
| Three Bedroom | 128 | 9.2 | 93.8% | 1,100 | $1,155 | $1,195 |
| Total / Wtd Avg. | 1,390 | 100.0% | 91.2% | 855 | $970 | $1,016 |
| (1) | Based on the underwritten rent rolls dated October 25, 2023. |
| (2) | Source: Appraisals. |
The following table presents certain information relating to the historical operating performance and Underwritten Net Cash Flow at the Highland Multifamily Portfolio Properties:
| Cash Flow Analysis(1) | ||||||
| 2020 | 2021 | 2022(2) | T-12 9/30/2023(2) | U/W | UW Per Unit | |
| Residential Rents in Place(3) | $13,271,464 | $13,864,704 | $14,815,671 | $15,612,724 | $14,750,112 | $10,611.59 |
| Potential Income from Vacant Units | 0 | 0 | 0 | 0 | 1,409,328 | $1,013.91 |
| Gross Potential Rent | $13,271,464 | $13,864,704 | $14,815,671 | $15,612,724 | $16,159,440 | $11,625.50 |
| Other Income(4) | 1,403,204 | 1,859,418 | 2,187,546 | 2,299,216 | 2,059,382 | $1,481.57 |
| Net Rental Income | $14,674,668 | $15,724,122 | $17,003,217 | $17,911,940 | $18,218,822 | $13,107.07 |
| Vacancy & Credit Loss | (1,544,177) | (1,460,576) | (2,287,163) | (2,424,771) | (2,241,291) | ($1,612.44) |
| Effective Gross Income | $13,130,491 | $14,263,546 | $14,716,054 | $15,487,169 | $15,977,531 | $11,494.63 |
| Real Estate Taxes | 992,613 | 1,012,331 | 1,033,126 | 1,055,449 | 1,118,129 | $804.41 |
| Insurance | 622,250 | 443,080 | 447,221 | 482,630 | 523,821 | $376.85 |
| Management Fee(5) | 515,905 | 571,671 | 593,860 | 626,502 | 479,326 | $344.84 |
| Other Operating Expenses(6) | 5,004,036 | 5,178,845 | 5,423,557 | 5,396,884 | 5,396,884 | $3,882.65 |
| Total Expenses | $7,134,805 | $7,205,928 | $7,497,764 | $7,561,464 | $7,518,159 | $5,408.75 |
| Net Operating Income | $5,995,687 | $7,057,618 | $7,218,290 | $7,925,705 | $8,459,372 | $6,085.88 |
| Replacement Reserves | 0 | 0 | 0 | 0 | 363,844 | $261.76 |
| Net Cash Flow | $5,995,687 | $7,057,618 | $7,218,290 | $7,925,705 | $8,095,528 | $5,824.12 |
| Occupancy | 92.1% | 93.5% | 91.4% | 91.3% | 86.1%(7) | |
| NCF DSCR | 1.08x | 1.27x | 1.30x | 1.42x | 1.45x | |
| NOI Debt Yield | 8.0% | 9.4% | 9.6% | 10.6% | 11.3% | |
| (1) | Based on the underwritten rent rolls dated October 25, 2023. |
| (2) | The increase from 2022 Net Operating Income to T-12 9/30/2023 Net Operating Income is a result of increased base rents following approximately $4.1 million of capital improvements invested into the Highland Multifamily Portfolio Properties from 2019 to 2021. |
| (3) | Residential Rents In-Place for the historical periods are sourced from borrower sponsor provided financial statement and include both actual rent collections and Potential Income from Vacant Units. U/W Residential Rents In Place and Potential Income from Vacant Units are broken out separately. |
| (4) | Other Income consists of utility income, late charges, termination fees, administrative fees, laundry income, pet fees, parking and other miscellaneous income. |
| (5) | The property manager charges a 4% management fee, however the U/W Management Fee is capped at 3.0%. Any Management Fees above 3% have been subordinated and will only be paid from excess cash flow after debt service. |
| (6) | Other Operating Expenses consist of payroll & benefits, utilities, repairs & maintenance, contract services, advertising and marketing, and general and administrative expenses. |
| (7) | U/W occupancy is based on the economic occupancy. |
| THE INFORMATION IN THIS STRUCTURAL AND COLLATERAL TERM SHEET IS NOT COMPLETE AND MAY BE AMENDED PRIOR TO THE TIME OF SALE. THIS TERM SHEET IS NOT AN OFFER TO SELL THESE SECURITIES AND IT IS NOT A SOLICITATION OF AN OFFER TO BUY THESE SECURITIES IN ANY JURISDICTION WHERE THE OFFER OR SALE IS NOT PERMITTED. | ||
| 25 | ||
|
Multifamily – Various Various Various, MI Various
|
Collateral Asset Summary – Loan No. 1 Highland Multifamily Portfolio |
Cut-off Date Balance: Cut-off Date LTV: U/W NCF DSCR: U/W NOI Debt Yield: |
$75,000,000 55.8% 1.45x 11.3% |
Appraisals. According to the appraisals, the Highland Multifamily Portfolio Properties had an aggregate “as-is” appraised value of $134,400,000 as of November 2, 2023.
| Highland Multifamily Portfolio Appraised Value(1) | ||
| Properties | Value | Capitalization Rate |
| Garfield Commons | $54,500,000 | 6.00% |
| Farmbrooke Manor | 33,700,000 | 6.00% |
| Warren Woods | 18,550,000 | 6.00% |
| Highland Towers | 16,900,000 | 6.00% |
| Golf Manor | 10,750,000 | 6.00% |
| Total / Wtd. Avg.(2) | $134,400,000 | 6.00% |
| (1) | Source: Appraisals. |
| (2) | Total / Wtd. Avg. is based on the appraised value of each Highland Multifamily Portfolio Property. |
Environmental Matters. According to the Phase I environmental assessments dated November 9, 2023, there was no evidence of any recognized environmental conditions at the Highland Multifamily Portfolio Properties.
The Market. The Highland Multifamily Portfolio Properties are located within the Macomb County Multifamily and Southfield submarkets of the Detroit MSA. According to the appraisals, the Detroit MSA had a total inventory of 348,125, a vacancy rate of 7.60% and asking rent of $1,196 per unit as of the third quarter of 2023.
According to the appraisals, the Garfield Commons Property, Farmbrooke Manor Property, Warren Woods Property and Golf Manor Property are located in the Macomb County Multifamily submarket of the Detroit MSA. As of the third quarter of 2023, the Macomb County Multifamily submarket had a total inventory of 66,553 units, a vacancy rate of 6.4%, and asking rent of $1,160 per unit.
According to the appraisal, the Highland Towers Property is located in the Southfield submarket of the Detroit MSA. As of the third quarter of 2023, the Southfield submarket had a total inventory of 12,658 units, a vacancy rate of 8.0%, and asking rent of $1,251 per unit.
The following table presents certain information relation to the demographics of the Highland Multifamily Portfolio Properties:
| Demographics Summary(1)(2) | ||||||||
| Property Name | City, State | Allocated Cut-off Date Balance | 1-mile Population | 3-mile Population | 5-mile Population | 1-mile Avg Household Income | 3-mile Avg Household Income | 5-mile Avg Household Income |
| Garfield Commons | Clinton Township, Michigan | $30,500,000 | 10,393 | 104,156 | 289,584 | $87,785 | $93,335 | $92,781 |
| Farmbrooke Manor | Clinton Township, Michigan | 19,000,000 | 14,070 | 98,479 | 276,609 | $74,532 | $84,081 | $86,419 |
| Warren Woods | Warren, Michigan | 10,250,000 | 14,287 | 122,287 | 323,230 | $72,934 | $72,532 | $82,289 |
| Highland Towers | Southfield, Michigan | 9,300,000 | 19,954 | 129,965 | 361,574 | $74,368 | $102,406 | $99,572 |
| Golf Manor | Roseville, Michigan | 5,950,000 | 11,537 | 106,812 | 261,706 | $87,236 | $80,248 | $81,245 |
| Total / Wtd. Avg. | $75,000,000 | 13,133 | 108,607 | 297,610 | $80,691 | $88,234 | $89,662 | |
| (1) | Source: Third party report. |
| (2) | Based on 2023 statistics. |
The Borrowers and the Borrower Sponsors. The borrowers are Highland Towers Associates, LLC, Warren Woods Associates, LLC, Farmbrooke Manor Associates, LLC, Garfield Court Associates, LLC and Golf Manor Associates, LLC, each a Delaware limited liability company and single purpose entity having at least one independent director in its organizational structure. Legal counsel to the borrowers delivered a non-consolidation opinion in connection with the origination of the Highland Multifamily Portfolio Mortgage Loan. The borrower sponsors and non-recourse carveout guarantors are Michael Colman, David Colman and Evan Ross of Roco Real Estate. Roco Real Estate is a Michigan based real estate firm with 23 apartment complexes in Michigan, four in Ohio and one in Mississippi.
Property Management. The Highland Multifamily Portfolio Properties are managed by RoCo Management, LLC, a borrower affiliated management company.
Initial and Ongoing Reserves. At origination of the Highland Multifamily Portfolio Mortgage Loan, the borrowers deposited approximately (i) $11,738,000 into a replacement reserve account for the cost of ongoing renovations at the Highland Multifamily Portfolio Properties, (ii) $388,235.61 into a reserve account for real estate taxes, and (iii) $167,568 into a reserve account for immediate repairs.
Tax Reserve – The borrowers are required to deposit into a real estate tax reserve, on a monthly basis, 1/12 of the taxes that the lender determines will be payable over the next-ensuing 12-month period (initially estimated to be approximately $97,058.90).
| THE INFORMATION IN THIS STRUCTURAL AND COLLATERAL TERM SHEET IS NOT COMPLETE AND MAY BE AMENDED PRIOR TO THE TIME OF SALE. THIS TERM SHEET IS NOT AN OFFER TO SELL THESE SECURITIES AND IT IS NOT A SOLICITATION OF AN OFFER TO BUY THESE SECURITIES IN ANY JURISDICTION WHERE THE OFFER OR SALE IS NOT PERMITTED. | ||
| 26 | ||
|
Multifamily – Various Various Various, MI Various
|
Collateral Asset Summary – Loan No. 1 Highland Multifamily Portfolio |
Cut-off Date Balance: Cut-off Date LTV: U/W NCF DSCR: U/W NOI Debt Yield: |
$75,000,000 55.8% 1.45x 11.3% |
Insurance Reserve – The borrowers are required to deposit into an insurance reserve, on a monthly basis, 1/12 of the amount which will be sufficient to pay the insurance premiums due for the renewal of coverage afforded by such policies; provided, however, such insurance reserve has been conditionally waived so long as the borrowers maintain a blanket policy meeting the requirements of the Highland Multifamily Portfolio Mortgage Loan documents.
Replacement Reserve – The borrowers are required to deposit into a replacement reserve, on a monthly basis, approximately $30,230.33.
Lockbox / Cash Management. The Highland Multifamily Portfolio Mortgage Loan is structured with a springing lockbox and springing cash management. On the first occurrence of a Trigger Period (as defined below) (and upon the first occurrence of a Trigger Period following the deactivation of the lockbox account, if the same occurs), the borrowers are required to establish a lender-controlled lockbox account, and are thereafter required to deposit (or cause the property manager to deposit) all revenue received by the borrowers or the property manager into such lockbox immediately upon receipt. All funds deposited into the lockbox account are required to be transferred on each business day to or at the direction of the borrowers unless a Trigger Period exists, in which case all funds in the lockbox account are required to be swept on each business day to a lender-controlled cash management account to be applied and disbursed in accordance with the Highland Multifamily Portfolio Mortgage Loan documents. All excess cash flow funds remaining in the cash management account after the application of such funds in accordance with the Highland Multifamily Portfolio Mortgage Loan documents are required to be held by the lender in an excess cash flow reserve account as additional collateral for the Highland Multifamily Portfolio Mortgage Loan. Upon the cure of the applicable Trigger Period, so long as no other Trigger Period exists, the lender is required to return any amounts remaining on deposit in the excess cash flow reserve account to the borrowers. Upon an event of default under the Highland Multifamily Portfolio Mortgage Loan documents, the lender may apply funds to the debt in such priority as it may determine. Notwithstanding the foregoing to the contrary, on one occasion during the term of the Highland Multifamily Portfolio Mortgage Loan, upon the expiration of the first Trigger Period to occur under the terms and conditions of the Highland Multifamily Portfolio Mortgage Loan agreement the borrowers may request that the lockbox account be deactivated and/or closed (and the lender must reasonably cooperate with the borrowers in connection therewith).
A “Trigger Period” means a period (A) commencing upon the earliest of (i) the occurrence and continuance of an event of default under the Highland Multifamily Portfolio Mortgage Loan documents, and (ii) the debt service coverage ratio being less than 1.20x; and (B) expiring upon (x) with regard to clause (i) above, the cure (if applicable) of such event of default under the Highland Multifamily Portfolio Mortgage Loan documents, and (y) with regard to clause (ii) above, the date that the debt service coverage ratio is equal to or greater than 1.20x for two consecutive calendar quarters.
Current Mezzanine or Secured Subordinate Indebtedness. None.
Permitted Future Mezzanine or Secured Subordinate Indebtedness. Not permitted.
Release of Collateral. Provided that no event of default is continuing under the Highland Multifamily Portfolio Mortgage Loan documents, at any time after the date that is the date that is two years after the closing date of the securitization that includes the last note comprising a part of the Highland Multifamily Portfolio Mortgage Loan to be securitized, the borrowers may deliver defeasance collateral and obtain release of one or more individual Highland Multifamily Portfolio Properties, in each case, provided that, among other conditions, (i) the defeasance collateral defeases an amount of the Highland Portfolio Mortgage Loan equal to the greater of (a) 120% of the allocated loan amount for the individual Highland Multifamily Portfolio Property, and (b) 90% of the net sales proceeds applicable to such individual Highland Multifamily Portfolio Property, (ii) the borrowers deliver a REMIC opinion, (iii) the borrowers deliver a rating agency confirmation, (iv) as of the date of notice of the partial release and the consummation of the partial release, after giving effect to the release, the debt service coverage ratio with respect to the remaining Highland Multifamily Portfolio Properties is greater than the greater of (a) 1.45x, and (b) the debt service coverage ratio for all of the Highland Multifamily Portfolio Properties immediately prior to the date of notice of the partial release or the consummation of the partial release, as applicable, (v) as of the date of notice of the partial release and the consummation of the partial release, after giving effect to the release, the loan-to-value ratio with respect to the remaining Highland Multifamily Portfolio Properties is no greater than the lesser of (a) 55.8% and (b) the loan-to-value ratio for all of the Highland Multifamily Portfolio Properties immediately prior to the date of notice of the partial release or the consummation of the partial release, as applicable, and (vi) as of the date of notice of the partial release and the consummation of the partial release, after giving effect to the release, the debt yield with respect to the remaining Highland Multifamily Portfolio Properties is greater than the greater of (a) 10.79%, and (b) the debt yield for all of the Highland Multifamily Portfolio Properties immediately prior to the date of notice of the partial release or the consummation of the partial release, as applicable. In addition, the borrowers may, without the prior consent of the lender, transfer an immaterial undeveloped portion of the Highland Multifamily Portfolio Properties to governmental authorities for dedication or public use or to a third party for uses which will benefit or serve the Highland Multifamily Portfolio Properties and not result in a material adverse effect, provided that no such transfer may materially impair the utility and operation of the applicable Highland Multifamily Portfolio Property or have a material adverse effect and, provided further, that if any release of any portion of an individual Highland Multifamily Portfolio Property requires that the borrowers make a prepayment of the debt in order that the Highland Multifamily Portfolio Mortgage Loan continue to satisfy all applicable REMIC requirements, the borrowers must make such prepayment (together with any related interest shortfall payment). The lender may require that the borrowers deliver a REMIC opinion in connection with the foregoing.
Ground Lease. None.
| THE INFORMATION IN THIS STRUCTURAL AND COLLATERAL TERM SHEET IS NOT COMPLETE AND MAY BE AMENDED PRIOR TO THE TIME OF SALE. THIS TERM SHEET IS NOT AN OFFER TO SELL THESE SECURITIES AND IT IS NOT A SOLICITATION OF AN OFFER TO BUY THESE SECURITIES IN ANY JURISDICTION WHERE THE OFFER OR SALE IS NOT PERMITTED. | ||
| 27 | ||
|
Retail – Super Regional Mall 1961 Chain Bridge Road McLean, VA 22102
|
Collateral Asset Summary – Loan No. 2 Tysons Corner Center |
Cut-off Date Balance: Cut-off Date LTV: U/W NCF DSCR: U/W NOI Debt Yield: |
$73,960,000 39.4% 2.00x 13.7% |
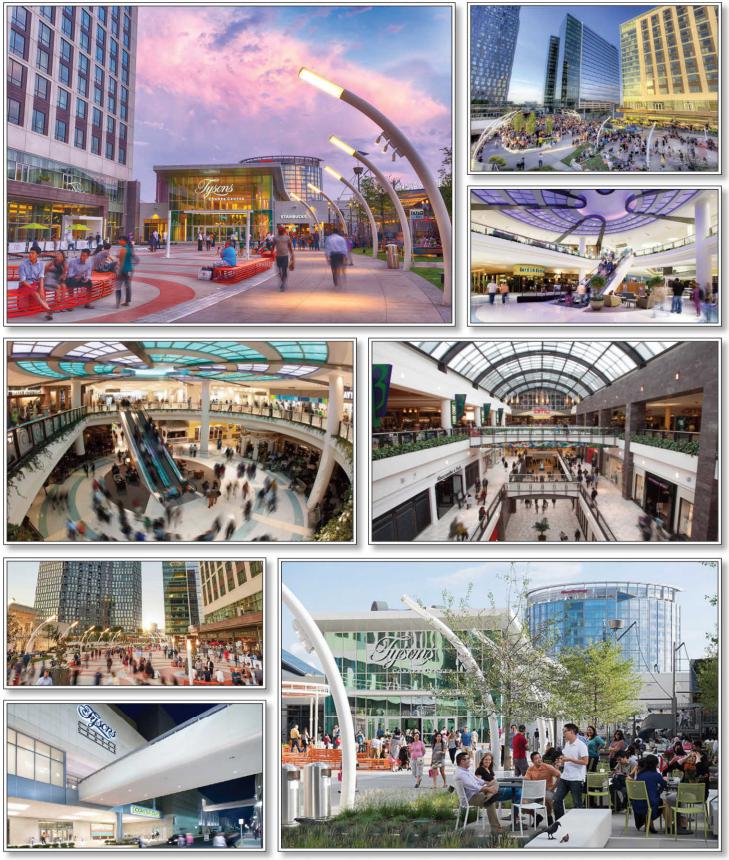
| THE INFORMATION IN THIS STRUCTURAL AND COLLATERAL TERM SHEET IS NOT COMPLETE AND MAY BE AMENDED PRIOR TO THE TIME OF SALE. THIS TERM SHEET IS NOT AN OFFER TO SELL THESE SECURITIES AND IT IS NOT A SOLICITATION OF AN OFFER TO BUY THESE SECURITIES IN ANY JURISDICTION WHERE THE OFFER OR SALE IS NOT PERMITTED. | ||
| 28 | ||
|
Retail – Super Regional Mall 1961 Chain Bridge Road McLean, VA 22102
|
Collateral Asset Summary – Loan No. 2 Tysons Corner Center |
Cut-off Date Balance: Cut-off Date LTV: U/W NCF DSCR: U/W NOI Debt Yield: |
$73,960,000 39.4% 2.00x 13.7% |
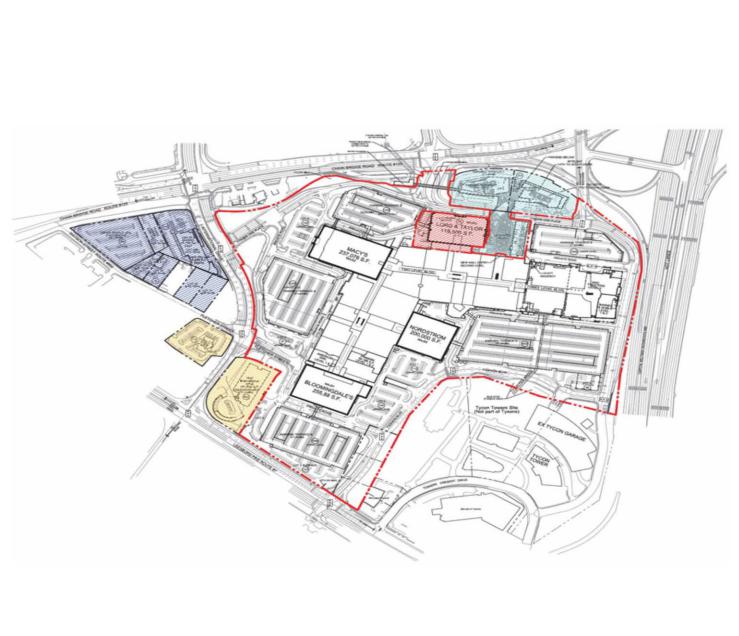
| THE INFORMATION IN THIS STRUCTURAL AND COLLATERAL TERM SHEET IS NOT COMPLETE AND MAY BE AMENDED PRIOR TO THE TIME OF SALE. THIS TERM SHEET IS NOT AN OFFER TO SELL THESE SECURITIES AND IT IS NOT A SOLICITATION OF AN OFFER TO BUY THESE SECURITIES IN ANY JURISDICTION WHERE THE OFFER OR SALE IS NOT PERMITTED. | ||
| 29 | ||
|
Retail – Super Regional Mall 1961 Chain Bridge Road McLean, VA 22102
|
Collateral Asset Summary – Loan No. 2 Tysons Corner Center |
Cut-off Date Balance: Cut-off Date LTV: U/W NCF DSCR: U/W NOI Debt Yield: |
$73,960,000 39.4% 2.00x 13.7% |

| THE INFORMATION IN THIS STRUCTURAL AND COLLATERAL TERM SHEET IS NOT COMPLETE AND MAY BE AMENDED PRIOR TO THE TIME OF SALE. THIS TERM SHEET IS NOT AN OFFER TO SELL THESE SECURITIES AND IT IS NOT A SOLICITATION OF AN OFFER TO BUY THESE SECURITIES IN ANY JURISDICTION WHERE THE OFFER OR SALE IS NOT PERMITTED. | ||
| 30 | ||
|
Retail – Super Regional Mall 1961 Chain Bridge Road McLean, VA 22102
|
Collateral Asset Summary – Loan No. 2 Tysons Corner Center |
Cut-off Date Balance: Cut-off Date LTV: U/W NCF DSCR: U/W NOI Debt Yield: |
$73,960,000 39.4% 2.00x 13.7% |

| THE INFORMATION IN THIS STRUCTURAL AND COLLATERAL TERM SHEET IS NOT COMPLETE AND MAY BE AMENDED PRIOR TO THE TIME OF SALE. THIS TERM SHEET IS NOT AN OFFER TO SELL THESE SECURITIES AND IT IS NOT A SOLICITATION OF AN OFFER TO BUY THESE SECURITIES IN ANY JURISDICTION WHERE THE OFFER OR SALE IS NOT PERMITTED. | ||
| 31 | ||
|
Retail – Super Regional Mall 1961 Chain Bridge Road McLean, VA 22102
|
Collateral Asset Summary – Loan No. 2 Tysons Corner Center |
Cut-off Date Balance: Cut-off Date LTV: U/W NCF DSCR: U/W NOI Debt Yield: |
$73,960,000 39.4% 2.00x 13.7% |

| THE INFORMATION IN THIS STRUCTURAL AND COLLATERAL TERM SHEET IS NOT COMPLETE AND MAY BE AMENDED PRIOR TO THE TIME OF SALE. THIS TERM SHEET IS NOT AN OFFER TO SELL THESE SECURITIES AND IT IS NOT A SOLICITATION OF AN OFFER TO BUY THESE SECURITIES IN ANY JURISDICTION WHERE THE OFFER OR SALE IS NOT PERMITTED. | ||
| 32 | ||
|
Retail – Super Regional Mall 1961 Chain Bridge Road McLean, VA 22102
|
Collateral Asset Summary – Loan No. 2 Tysons Corner Center |
Cut-off Date Balance: Cut-off Date LTV: U/W NCF DSCR: U/W NOI Debt Yield: |
$73,960,000 39.4% 2.00x 13.7% |
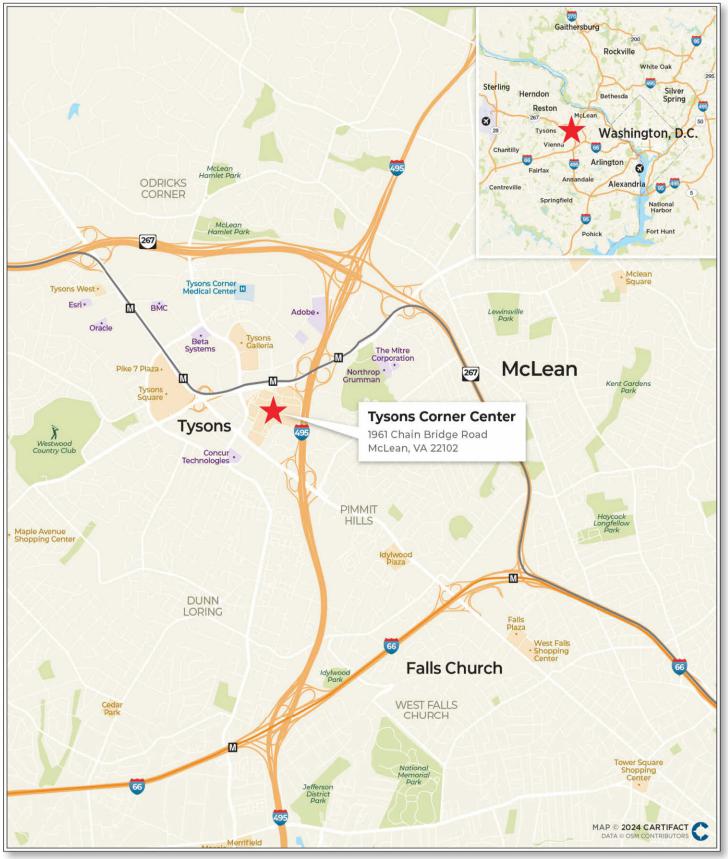
| THE INFORMATION IN THIS STRUCTURAL AND COLLATERAL TERM SHEET IS NOT COMPLETE AND MAY BE AMENDED PRIOR TO THE TIME OF SALE. THIS TERM SHEET IS NOT AN OFFER TO SELL THESE SECURITIES AND IT IS NOT A SOLICITATION OF AN OFFER TO BUY THESE SECURITIES IN ANY JURISDICTION WHERE THE OFFER OR SALE IS NOT PERMITTED. | ||
| 33 | ||
|
Retail – Super Regional Mall 1961 Chain Bridge Road McLean, VA 22102
|
Collateral Asset Summary – Loan No. 2 Tysons Corner Center |
Cut-off Date Balance: Cut-off Date LTV: U/W NCF DSCR: U/W NOI Debt Yield: |
$73,960,000 39.4% 2.00x 13.7% |
| Mortgage Loan Information | Property Information | ||||||||||
| Loan Sellers: | GACC, GSMC | Single Asset / Portfolio: | Single Asset | ||||||||
| Loan Purpose: | Refinance | Property Type - Subtype: | Retail – Super Regional Mall | ||||||||
| Borrower Sponsor(s): | The Macerich Partnership, L.P. and Alaska Permanent Fund Corporation | Collateral: | Fee / Leasehold | ||||||||
| Borrower(s): | Tysons Corner Property Holdings LLC and Tysons Corner Holdings LLC | Location: | McLean, VA | ||||||||
| Original Balance(1): | $73,960,000 | Year Built / Renovated: | 1968 / 1989, 2005 | ||||||||
| Cut-off Date Balance(1): | $73,960,000 | Property Management: | MACW Property Management, LLC | ||||||||
| % by Initial UPB: | 8.4% | Size: | 1,793,638 SF | ||||||||
| Interest Rate: | 6.60060% | Appraised Value / Per SF: | $1,800,000,000 / $1,004 | ||||||||
| Note Date: | December 4, 2023 | Appraisal Date: | October 5, 2023 | ||||||||
| Original Term: | 60 months | Occupancy: | 95.4% (as of November 1, 2023) | ||||||||
| Amortization: | Interest Only | UW Economic Occupancy: | 92.2% | ||||||||
| Original Amortization: | NAP | Underwritten NOI(5): | $97,102,547 | ||||||||
| Interest Only Period: | 60 months | Underwritten NCF: | $94,950,181 | ||||||||
| First Payment Date: | January 6, 2024 | ||||||||||
| Maturity Date: | December 6, 2028 | Historical NOI | |||||||||
| Additional Debt Type(1): | Pari Passu | Most Recent NOI(5): | $85,531,322 (TTM September 30, 2023) | ||||||||
| Additional Debt Balance (1): | $636,040,000 | 2022 NOI: | $84,604,983 | ||||||||
| Call Protection(2): | L(25),DorYM1(28),O(7) | 2021 NOI: | $83,536,276 | ||||||||
| Lockbox / Cash Management: | Hard / Springing | 2020 NOI: | $86,076,177 | ||||||||
| Reserves(3) | Financial Information(1) | ||||||||||
| Initial | Monthly | Cap | Cut-off Date Loan Per SF: | $396 | |||||||
| Taxes: | $0 | Springing | NAP | Maturity Date Loan Per SF: | $396 | ||||||
| Insurance: | $0 | Springing | NAP | Cut-off Date LTV: | 39.4% | ||||||
| FF&E Reserve: | $0 | Springing | $896,819 | Maturity Date LTV: | 39.4% | ||||||
| TI/LC: | $0 | Springing | $3,587,276 | UW NOI DY: | 13.7% | ||||||
| Other(4): | $39,775,125 | $0 | NAP | UW NCF DSCR: | 2.00x | ||||||
| Sources and Uses | |||||||||||
| Sources | Proceeds | % of Total | Uses | Proceeds | % of Total | ||||||
| Whole Loan | $710,000,000 | 100.0% | Loan Payoff | $666,692,845 | 93.9% | ||||||
| Upfront Reserves | 39,775,125 | 5.6 | |||||||||
| Closing Costs | 3,532,030 | 0.5 | |||||||||
| Total Sources | $710,000,000 | 100.0% | Total Uses | $710,000,000 | 100.0% | ||||||
| (1) | The Tysons Corner Center Mortgage Loan (as defined below) is part of the Tysons Corner Center Whole Loan (as defined below) which is comprised of seventeen pari passu notes with an aggregate original principal balance and Cut-off Date Balance of $710,000,000. The Tysons Corner Center Whole Loan was co-originated by Deutsche Bank AG, acting through its New York Branch (“DBNY”), JPMorgan Chase Bank, National Association (“JPMCB”), Bank of Montreal (“BMO”), and Goldman Sachs Bank USA (“GSBI”). The Financial Information in the chart above is based on the aggregate outstanding principal balance as of the Cut-off Date of the Tysons Corner Center Whole Loan. |
| (2) | The lockout period will be at least 25 payment dates beginning with and including the first payment date on January 6, 2024. Defeasance or voluntary prepayment with yield maintenance of the Tysons Corner Center Whole Loan in full (but not in part) is permitted at any time following the earlier to occur of (i) December 6, 2026 or (ii) the date that is two years from the closing date of the securitization that includes the last pari passu note to be securitized. The assumed lockout period of 25 payments is based on the expected Benchmark 2024-V5 securitization closing date in January 2024. The actual lockout period may be longer. |
| (3) | See “Initial and Ongoing Reserves” below. |
| (4) | Other Reserves consists of an Outstanding TI/LC (Upfront: $30,769,199) and a Gap Rent Reserve (Upfront: $9,005,926). See “Initial and Ongoing Reserves” below. |
| (5) | The main driver in the increase from Most Recent NOI to Underwritten NOI is recent lease up. |
| THE INFORMATION IN THIS STRUCTURAL AND COLLATERAL TERM SHEET IS NOT COMPLETE AND MAY BE AMENDED PRIOR TO THE TIME OF SALE. THIS TERM SHEET IS NOT AN OFFER TO SELL THESE SECURITIES AND IT IS NOT A SOLICITATION OF AN OFFER TO BUY THESE SECURITIES IN ANY JURISDICTION WHERE THE OFFER OR SALE IS NOT PERMITTED. | ||
| 34 | ||
|
Retail – Super Regional Mall 1961 Chain Bridge Road McLean, VA 22102
|
Collateral Asset Summary – Loan No. 2 Tysons Corner Center |
Cut-off Date Balance: Cut-off Date LTV: U/W NCF DSCR: U/W NOI Debt Yield: |
$73,960,000 39.4% 2.00x 13.7% |
The Loan. The second largest mortgage loan (the “Tysons Corner Center Mortgage Loan”) is part of a whole loan (the “Tysons Corner Center Whole Loan”) secured by the borrowers’ fee and leasehold interests, as applicable, in a 1,793,638 SF super regional mall located at 1961 Chain Bridge Road in McLean, Virginia (the “Tysons Corner Center Property”). The Tysons Corner Center Whole Loan is comprised of seventeen pari passu notes, with an aggregate outstanding principal balance as of the Cut-off Date of $710,000,000. The Tysons Corner Center Whole Loan was co-originated on December 4, 2023 by DBNY, JPMCB, BMO and GSBI and accrues interest at a fixed rate of 6.60060% per annum. The Tysons Corner Center Whole Loan has an initial term of five years and is interest-only for the full term. The scheduled maturity date of the Tysons Corner Center Whole Loan is on December 6, 2028. The Tysons Corner Center Mortgage Loan is evidenced by the non-controlling Notes A-1-2, A-1-4, A-2-2 and A-2-4 with an outstanding principal balance as of the Cut-off Date of $73,960,000. GACC is selling Note A-1-2 and Note A-1-4 in the outstanding principal balance of $40,000,000 as of the Cut-off Date, and GSMC is selling Notes A-2-2 and A-2-4 in the outstanding principal amount of $33,960,000 as of the Cut-off Date.
The table below summarizes the promissory notes that comprise the Tysons Corner Center Whole Loan. The relationship between the holders of the Tysons Corner Center Whole Loan will be governed by a co-lender agreement as described under “Description of the Mortgage Pool— The Whole Loans—The Non-Serviced Pari Passu Whole Loans” in the Preliminary Prospectus.
| Whole Loan Summary | ||||
| Note | Original Balance | Cut-off Date Balance | Note Holder | Controlling Piece |
| A-1-1 | $176,080,000 | $176,080,000 | TYSN 2023-CRNR | Yes |
| A-1-2 | 30,000,000 | 30,000,000 | Benchmark 2024-V5 | No |
| A-1-3 | 20,000,000 | 20,000,000 | DBNY(1) | No |
| A-1-4 | 10,000,000 | 10,000,000 | Benchmark 2024-V5 | No |
| A-1-5 | 10,000,000 | 10,000,000 | DBNY(1) | No |
| A-1-6 | 37,920,000 | 37,920,000 | DBNY(1) | No |
| A-2-1 | 88,040,000 | 88,040,000 | TYSN 2023-CRNR | No |
| A-2-2 | 20,000,000 | 20,000,000 | Benchmark 2024-V5 | No |
| A-2-3 | 20,000,000 | 20,000,000 | GSBI(1) | No |
| A-2-4 | 13,960,000 | 13,960,000 | Benchmark 2024-V5 | No |
| A-3-1 | 88,040,000 | 88,040,000 | TYSN 2023-CRNR | No |
| A-3-2 | 20,000,000 | 20,000,000 | JPMCB(1) | No |
| A-3-3 | 10,000,000 | 10,000,000 | JPMCB(1) | No |
| A-3-4 | 23,960,000 | 23,960,000 | JPMCB(1) | No |
| A-4-1 | 88,040,000 | 88,040,000 | TYSN 2023-CRNR | No |
| A-4-2 | 30,000,000 | 30,000,000 | BMO(1) | No |
| A-4-3 | 23,960,000 | 23,960,000 | BMO(1) | No |
| Whole Loan | $710,000,000 | $710,000,000 | ||
| (1) | Expected to be contributed to one or more future securitization transactions. |
The Property. The Tysons Corner Center Property is a 1,793,638 SF, super regional mall located 12.5 miles outside Washington D.C.
The Tysons Corner Center Property consists of one contiguous building and 10,059 parking spaces (for a parking ratio of 5.61 spaces per 1000 SF) situated on a 76.56 acre site in McLean, Virginia, and has 238 tenants. The Tysons Corner Center Property is anchored by Bloomingdale's, Macy's, and Nordstrom which collectively generated approximately $239.9 million of sales in the September 2023 TTM while also increasing foot traffic at the Tysons Corner Center Property. The diversified in-line tenant base features large-format retailers and operators including Zara, Apple, Uniqlo, Victoria’s Secret, lululemon athletica, H&M, and Sephora contributing to total Tysons Corner Center Property sales in the September 2023 TTM of approximately $891.2 million. In-line stores smaller than 10,000 SF (excluding arcade and non-retail stores) generated approximately $495.4 million of sales in the September 2023 TTM, driving sales volume of $1,202 PSF at an occupancy cost of 16.1%.
The Tysons Corner Center Property was originally developed in 1968 and was subsequently expanded in 1989 and 2005. Since 2005, the borrower sponsor has invested approximately $352 million (with over $100 million invested in the last six years) in capital improvements, leasing capital, and operational upgrades to preserve the asset’s competitive positioning. Major capital initiatives include Apple’s relocation/renewal costing approximately $22.1 million, the repositioning of L.L. Bean’s former space, costing approximately $19.6 million through 2023, and ongoing operating capital improvements to the parking deck, HVAC, roof, vertical transportation, security equipment, and common areas. The borrower sponsor has also invested approximately $525 million to create a (non-collateral) 24/7 live-work-play-stay, mixed-use destination adjacent to the Tysons Corner Center Property. This non-collateral development project opened between 2014 and 2016 and includes a 22-story Class-A office tower, a 429-unit luxury apartment building, and a 300-key Hyatt.
| THE INFORMATION IN THIS STRUCTURAL AND COLLATERAL TERM SHEET IS NOT COMPLETE AND MAY BE AMENDED PRIOR TO THE TIME OF SALE. THIS TERM SHEET IS NOT AN OFFER TO SELL THESE SECURITIES AND IT IS NOT A SOLICITATION OF AN OFFER TO BUY THESE SECURITIES IN ANY JURISDICTION WHERE THE OFFER OR SALE IS NOT PERMITTED. | ||
| 35 | ||
|
Retail – Super Regional Mall 1961 Chain Bridge Road McLean, VA 22102
|
Collateral Asset Summary – Loan No. 2 Tysons Corner Center |
Cut-off Date Balance: Cut-off Date LTV: U/W NCF DSCR: U/W NOI Debt Yield: |
$73,960,000 39.4% 2.00x 13.7% |
Major Tenants. The three anchor tenants are Bloomingdale’s, Macy’s and Nordstrom.
Bloomingdale’s (252,754 SF; 14.1% of net rentable area (“NRA”); 1.0% of underwritten gross rent). Bloomingdale’s is a high-end department store chain founded in 1860 that currently offers clothes, accessories, shoes, and furniture for men, women and children. Bloomingdale’s was acquired by Federated Department Stores in 1930, which acquired the Macy’s department store chain in 1994. Ultimately, Federated Department Stores was renamed Macy’s, Inc. (NYSE: M) in 2007. The chain has a total of 37 department stores and 23 outlet stores with the Bloomingdale's nameplate in operation. Its headquarters and flagship store are located in New York City. The Bloomingdale’s lease expires July 22, 2028, and the tenant has one seven-year renewal option upon no less than 270 days’ prior written notice.
Nordstrom (201,000 SF; 11.2% of NRA; 0.2% of underwritten gross rent). Nordstrom (NYSE: JWN) is a fashion retailer offering clothing shoes and accessories for men, women and children. Founded in 1901 and headquartered in Seattle, Nordstrom has 370 stores across 40 states and Canada, which includes 122 full-line stores, 236 Nordstrom Rack locations, 7 Trunk Club clubhouses, two clearance stores and a Nordstrom local service concept. In fiscal year 2022, Nordstrom reported net sales of nearly $15.1 billion, an increase of 6.6% from fiscal year 2021. The Nordstrom at the Tysons Corner Center Property is reportedly in the top 15% of all Nordstrom locations, with the men’s department ranking as the highest performing across Nordstrom’s entire national fleet. Nordstrom’s lease expires in March 2025 and the tenant has 11, five-year renewal options exercisable upon no less than 9 months’ and no earlier than 24 months prior written notice.
Macy’s (237,076 SF; 13.2% of NRA; 0.1% of underwritten gross rent). Macy’s, Inc. (NYSE: M) is an American department store chain founded in 1858 that currently offers clothes, accessories, shoes, and furniture for men, women and children. It operates more than 700 department stores under the nameplates Macy’s and Bloomingdale’s and over 160 specialty stores that include Bloomingdale’s The Outlet, Bluemercury and Macy’s Backstage. Macy’s Inc. operates stores in 43 states, the District of Columbia, Guam and Puerto Rico, as well as macys.com, bloomingdales.com and bluemercury.com. Macy’s Inc. has corporate offices in Cincinnati, Ohio and New York, New York. The Macy’s lease expires July 24, 2028, and the tenant has six, five-year renewal options upon no less than 270 days’ prior written notice.
The following table presents certain information relating to historical occupancy for the Tysons Corner Center Property inclusive of anchor tenants:
| Historical Occupancy | |||
| 2020 | 2021 | 2022 | As of Nov 1, 2023(1) |
| 90.6% | 88.6% | 88.9% | 95.4% |
| (1) | Based on the underwritten rent roll dated November 1, 2023. |
| THE INFORMATION IN THIS STRUCTURAL AND COLLATERAL TERM SHEET IS NOT COMPLETE AND MAY BE AMENDED PRIOR TO THE TIME OF SALE. THIS TERM SHEET IS NOT AN OFFER TO SELL THESE SECURITIES AND IT IS NOT A SOLICITATION OF AN OFFER TO BUY THESE SECURITIES IN ANY JURISDICTION WHERE THE OFFER OR SALE IS NOT PERMITTED. | ||
| 36 | ||
|
Retail – Super Regional Mall 1961 Chain Bridge Road McLean, VA 22102
|
Collateral Asset Summary – Loan No. 2 Tysons Corner Center |
Cut-off Date Balance: Cut-off Date LTV: U/W NCF DSCR: U/W NOI Debt Yield: |
$73,960,000 39.4% 2.00x 13.7% |
The following table presents certain information relating to the tenants (of which, certain tenants may have cotenancy provisions) at the Tysons Corner Center Property:
| Tenant Summary(1) | ||||||||||
|
Tenant |
Credit Rating (Moody’s/ S&P/Fitch)(2) |
Net Rentable Area (SF) | % of Net Rentable Area | U/W Gross Rent(3) |
U/W Gross Rent Per SF(3) |
% of Total U/W Gross Rent(3) | Lease Expiration | Termination Option (Y/N) | Renewal Options | |
| Anchors | ||||||||||
| Bloomingdale’s(4) | Ba1/BB+/NR | 252,754 | 14.1% | $1,218,492 | $4.82 | 1.0 | % | 7/22/2028 | N | 1 x 7 Yr |
| Nordstrom(5) | NR/BB+/BBB- | 200,000 | 11.2% | 282,999 | $1.41 | 0.2 | 3/31/2025 | N | 11 x 5 Yr | |
| Macy’s(6) | Ba1/BB+/NR | 237,076 | 13.2% | 94,786 | $0.40 | 0.1 | 7/24/2028 | N | 6 x 5 Yr | |
| Major Tenants | ||||||||||
| AMC Theatres(7) | Caa1/CCC+/NR | 105,122 | 5.9% | 4,589,627 | $43.66 | 3.6 | 9/30/2025 | N | 4 x 5 Yr | |
| Primark(8) | NR/NR/NR | 50,186 | 2.8% | 2,922,512 | $58.23 | 2.3 | 5/31/2034 | N | 3 x 5 Yr | |
| In-line >10,000 SF | 306,089 | 17.1% | 32,775,526 | $107.08 | 26.0 | |||||
| In-line <10,000 SF | 490,510 | 27.3% | 83,994,405 | $171.24 | 66.5 | |||||
| Specialty Leasing | 65,118 | 3.6% | NAP | NAP | NAP | |||||
| Office/Other | 4,661 | 0.3% | 357,065 | $76.61 | 0.3 | |||||
| Total Occupied | 1,711,516 | 95.4% | $126,235,411 | $73.76 | 100.0 | % | ||||
| Vacant | 82,122 | 4.6% | ||||||||
| Total | 1,793,638 | 100.0% | ||||||||
| (1) | Based on the underwritten rent roll dated November 1, 2023. |
| (2) | Certain ratings are those of the parent company whether or not the parent guarantees the lease. |
| (3) | U/W Gross Rent, U/W Gross Rent per SF and % of Total U/W Gross Rent includes Base Rent, recoveries (fixed CAM, tax reimbursements and utility reimbursements) and percentage rent contribution. |
| (4) | Bloomingdale’s has one, seven-year renewal option upon no less than 270 days’ prior written notice. |
| (5) | Nordstrom has eleven, five-year renewal options exercisable upon no less than 9 months’ and no earlier than 24 months prior written notice. This includes Nordstrom’s anchor space of 200,000 SF. There is an additional 1,000 SF that is included in the In-line <10,000 SF numbers above. |
| (6) | Macy’s has six, five-year renewal options exercisable upon no less than 270 days’ prior written notice. |
| (7) | AMC Theatres has four, five-year renewal options exercisable upon at least 12 months’ prior written notice. |
| (8) | Primark (signed but not open) is expected to commence ten-year lease on April 22, 2024. Primark has three, five-year renewal options exercisable. Primark has various options to terminate its lease (i) if it has not opened by a date determined by a formula specified in the lease, (ii) if the delivery date has not occurred in accordance with a formula specified in the lease or (iii) if the floor area is more than 3% less than specified in the lease. In addition, Primark has the right to terminate its lease effective as of the end of its fifth lease year if the tenant’s gross sales during its fourth lease year do not equal to exceed $23,000,000. Such termination right must be exercised by notice given at any time during the 90 day period following the end of the fourth lease year. At origination $9,005,926 was deposited into a gap rent reserve for various tenants, including $1,170,894 for Primark. We cannot assure you that Primark will take occupancy or commence paying rent as expected, or at all. |
| Tenant Sales Per SF(1) | ||||
| 2019 | 2021 | 2022 | Q3 2023(2) | |
| Tenants < 10,000 SF and Open > 12 months | ||||
| Occupancy Cost(3) | 17.0% | N/A | 15.9% | 16.1% |
| Sales PSF(4) | $981 | $1,030 | $1,133 | $1,202 |
| (1) | All sales information presented above is based upon information provided by the borrower sponsor. In certain instances, sales figures represent estimates because the tenants are not required to report, or otherwise may not have reported sales information on a timely basis. Further, because sales are self-reported, such information is not independently verified by the borrower sponsor. |
| (2) | Sales PSF listed for this period reflects Sales PSF for the 12-month period ending September 2023. |
| (3) | Cost of Occupancy was not calculated during periods affected by COVID due to incomplete sales reporting by tenants. |
| (4) | Based on sales per SF for all tenants open for 12 months or more. Excludes tenants >10,000 SF, arcades, and non-retail stores. |
| THE INFORMATION IN THIS STRUCTURAL AND COLLATERAL TERM SHEET IS NOT COMPLETE AND MAY BE AMENDED PRIOR TO THE TIME OF SALE. THIS TERM SHEET IS NOT AN OFFER TO SELL THESE SECURITIES AND IT IS NOT A SOLICITATION OF AN OFFER TO BUY THESE SECURITIES IN ANY JURISDICTION WHERE THE OFFER OR SALE IS NOT PERMITTED. | ||
| 37 | ||
|
Retail – Super Regional Mall 1961 Chain Bridge Road McLean, VA 22102
|
Collateral Asset Summary – Loan No. 2 Tysons Corner Center |
Cut-off Date Balance: Cut-off Date LTV: U/W NCF DSCR: U/W NOI Debt Yield: |
$73,960,000 39.4% 2.00x 13.7% |
The following table presents certain information relating to the tenants with the highest overall sales in the order of their September 30, 2023 TTM sales.
| Top Tenants by Total Sales(1) | ||||||||||
| Tenant | SF | % NRA | Lease Start | Base Rent | 2022 Sales |
2022 Sales PSF | 9/30/23 TTM Sales |
9/30/23 TTM Sales PSF | TTM Occ Cost | |
| Bloomingdale's | 252,754 | 14.1% | 11/27/1974 | $371,043 | $101,347,699 | $401 | $92,930,560 | $368 | 1.3% | |
| Macy's | 237,076 | 13.2% | 7/25/1968 | $0 | $76,311,220 | $322 | $77,142,356 | $325 | 0.1% | |
| Apple Store(2) | 5,181 | 0.3% | 5/19/2023 | $1,647,586 | $78,450,327 | $15,142 | $72,226,551 | $13,941 | 2.5% | |
| Nordstrom | 200,000 | 11.2% | 3/4/1988 | $1 | $60,987,002 | $305 | $69,823,919 | $349 | 0.4% | |
| Lenkersdorfer(3) | 2,400 | 0.1% | 5/1/1993 | $759,577 | $27,470,494 | $11,446 | $29,894,119 | $12,456 | 6.1% | |
| ZARA | 21,062 | 1.2% | 11/3/2014 | $2,422,283 | $29,754,068 | $1,413 | $28,586,503 | $1,357 | 14.8% | |
| SEPHORA | 7,088 | 0.4% | 4/12/2002 | $720,019 | $18,494,900 | $2,609 | $21,996,004 | $3,103 | 7.9% | |
| Lucid Motors | 4,462 | 0.2% | 10/5/2021 | $585,986 | $10,639,089 | $2,384 | $20,409,158 | $4,574 | 5.0% | |
| Uniqlo | 12,825 | 0.7% | 10/1/2016 | $1,805,157 | $17,480,115 | $1,363 | $19,811,305 | $1,545 | 10.7% | |
| lululemon athletica | 6,999 | 0.4% | 9/7/2007 | $397,193 | $11,566,303 | $1,653 | $15,630,205 | $2,233 | 7.3% | |
| (1) | All sales information presented herein with respect to the Tysons Corner Center Property is based upon information provided by the borrower sponsor. In certain instances, sales figures represent estimates because the tenants are not required to report, or otherwise may not have reported sales information on a timely basis. Further, because sales are self-reported, such information is not independently verified by the borrower sponsor. |
| (2) | Apple reports sales based on a 5,181 SF sales floor. Apple leases 13,010 SF which includes storage space, a breakroom, and other ancillary space. |
| (3) | SF and base rent reflects Lenkersdorfer's existing suite. Lenkersdorfer has executed a lease to expand into a 7,704 SF suite at a base rent of $1,329,864. |
The following table presents certain information relating to the lease rollover schedule at the Tysons Corner Center Property, based on initial lease expiration dates:
| Lease Rollover Schedule(1)(2) | |||||||||
| Year Ending December 31 | Expiring Owned GLA | % of Owned GLA | Cumulative % of Owned GLA | U/W Base Rent | % of Total U/W Base Rent | U/W Base Rent $ per SF | # of Expiring Leases | ||
| MTM | 12,809 | 0.7% | 0.7% | $857,511 | 1.1 | % | $66.95 | 6 | |
| 2024 | 139,997 | 7.8% | 8.5% | 10,907,326 | 14.5 | % | $77.91 | 40 | |
| 2025 | 417,137 | 23.3% | 31.8% | 13,290,259 | 17.7 | % | $31.86 | 33 | |
| 2026 | 104,482 | 5.8% | 37.6% | 10,419,016 | 13.9 | % | $99.72 | 23 | |
| 2027 | 53,367 | 3.0% | 40.6% | 6,063,018 | 8.1 | % | $113.61 | 20 | |
| 2028 | 572,395 | 31.9% | 72.5% | 8,931,129 | 11.9 | % | $15.60 | 26 | |
| 2029 | 18,224 | 1.0% | 73.5% | 1,559,846 | 2.1 | % | $85.59 | 7 | |
| 2030 | 25,339 | 1.4% | 74.9% | 2,855,202 | 3.8 | % | $112.68 | 13 | |
| 2031 | 32,012 | 1.8% | 76.7% | 2,202,582 | 2.9 | % | $68.80 | 8 | |
| 2032 | 28,649 | 1.6% | 78.3% | 2,715,169 | 3.6 | % | $94.77 | 10 | |
| 2033 | 67,584 | 3.8% | 82.1% | 5,552,422 | 7.4 | % | $82.16 | 11 | |
| 2034 | 166,699 | 9.3% | 91.4% | 8,362,650 | 11.1 | % | $50.17 | 10 | |
| 2035 & Thereafter | 7,704 | 0.4% | 91.8% | 1,329,864 | 1.8 | % | $172.62 | 1 | |
| Vacant | 82,122 | 4.6% | 96.4% | NAP | NA | P | NAP | 26 | |
| Specialty Leasing | 65,118 | 3.6% | 100.0% | NAP | NA | P | NAP | 30 | |
| Total / Wtd. Avg. | 1,793,638 | 100.0% | 100.0% | $75,045,995 | 100.0 | % | $45.58 | 238 | |
| (1) | Based on the underwritten rent roll as of November 1, 2023. |
| (2) | Certain tenants may have lease termination options that are not reflected in the Lease Rollover Schedule. |
| THE INFORMATION IN THIS STRUCTURAL AND COLLATERAL TERM SHEET IS NOT COMPLETE AND MAY BE AMENDED PRIOR TO THE TIME OF SALE. THIS TERM SHEET IS NOT AN OFFER TO SELL THESE SECURITIES AND IT IS NOT A SOLICITATION OF AN OFFER TO BUY THESE SECURITIES IN ANY JURISDICTION WHERE THE OFFER OR SALE IS NOT PERMITTED. | ||
| 38 | ||
|
Retail – Super Regional Mall 1961 Chain Bridge Road McLean, VA 22102
|
Collateral Asset Summary – Loan No. 2 Tysons Corner Center |
Cut-off Date Balance: Cut-off Date LTV: U/W NCF DSCR: U/W NOI Debt Yield: |
$73,960,000 39.4% 2.00x 13.7% |
The following table presents certain information relating to the historical operating performance and Underwritten Net Cash Flow at the Tysons Corner Center Property:
| Cash Flow Analysis(1) | |||||||
| 2019 | 2020 | 2021 | 2022 | TTM 9/30/2023 | U/W | U/W Per SF | |
| Base Rent | $81,387,952 | $74,476,740 | $67,924,167 | $65,811,352 | $67,573,137 | $75,045,995 | $41.84 |
| Rent Steps | 0 | 0 | 0 | 0 | 0 | 1,503,149 | 0.84 |
| Gross Up Vacancy | 0 | 0 | 0 | 0 | 0 | 11,821,381 | 6.59 |
| Gross Potential Rent | $81,387,952 | $74,476,740 | $67,924,167 | $65,811,352 | 67,573,137 | $88,370,525 | $49.27 |
| Total Reimbursements | 52,106,283 | 49,321,594 | 42,341,921 | 42,773,913 | 43,726,608 | 46,509,747 | 25.93 |
| Total Gross Income | $133,494,235 | $123,798,334 | $110,266,088 | $108,585,265 | 111,299,745 | 134,880,271 | $75.20 |
| Other Income | 13,634,813 | 17,429,202 | 19,929,530 | 19,463,316 | 19,285,025 | 17,560,026 | 9.79 |
| (Vacancy / Credit Loss) | (1,012,339) | (11,043,533) | (3,517,708) | (600,363) | (966,945) | (11,821,381) | (6.59) |
| Effective Gross Income | $146,116,709 | $130,184,003 | $126,677,910 | $127,448,218 | $129,617,825 | $140,618,916 | $78.40 |
| Management Fee | 2,161,973 | 2,024,225 | 1,881,995 | 1,892,939 | 1,930,258 | 1,000,000 | 0.56 |
| Real Estate Taxes | 24,846,557 | 25,853,243 | 24,151,845 | 23,490,194 | 23,317,982 | 24,033,263 | 13.40 |
| Insurance | 484,797 | 567,706 | 669,212 | 696,163 | 746,564 | 802,641 | 0.45 |
| Other Expenses(2) | 16,914,590 | 15,662,652 | 16,438,582 | 16,763,939 | 18,091,699 | 17,680,465 | 9.86 |
| Total Expenses | $44,407,917 | $44,107,826 | $43,141,634 | $42,843,235 | $44,086,503 | $43,516,369 | $24.26 |
| Net Operating Income(3) | $101,708,792 | $86,076,177 | $83,536,276 | $84,604,983 | $85,531,322 | $97,102,547 | $54.14 |
| Capital Expenditures | 0 | 0 | 0 | 0 | 0 | 358,728 | 0.20 |
| TI/LC | 0 | 0 | 0 | 0 | 0 | 1,793,638 | 1.00 |
| Net Cash Flow | $101,708,792 | $86,076,177 | $83,536,276 | $84,604,983 | $85,531,322 | $94,950,181 | $52.94 |
| Occupancy (%) | 92.8% | 90.6% | 88.6% | 88.9% | 94.9% | 95.4% | |
| NCF DSCR(4) | 2.14x | 1.81x | 1.76x | 1.78x | 1.80x | 2.00x | |
| NOI Debt Yield(4) | 14.3% | 12.1% | 11.8% | 11.9% | 12.0% | 13.7% | |
| (1) | Based on the underwritten rent roll as of November 1, 2023. |
| (2) | Other Expenses include general and administrative, repairs and maintenance, security, utility, marketing, other expenses and ground rent. |
| (3) | The main driver in the increase from TTM 9/30/2023 Net Operating Income to U/W Net Operating Income is recent lease up. |
| (4) | Based on the Tysons Corner Center Whole Loan. |
Appraisals. According to the appraisal, the Tysons Corner Center Property had an “as-is” appraised value of $1,800,000,000 as of October 5, 2023.
Appraisal Approach |
Appraised Value |
Capitalization Rate |
| Income Capitalization Approach | $1,800,000,000 | 5.25%(1) |
| (1) | Represents the direct Capitalization Rate. |
Environmental Matters. According to the Phase I environmental report, dated August 2, 2023, there was no evidence of any recognized environmental conditions at the Tysons Corner Center Property.
The Market. The Tysons Corner Center Property is located in at the intersection of Chain Bridge Route 123 and the Capital Beltway/I-495 where 172,000 vehicles pass daily, with direct access to DC’s Metro Silver Line and positioned between Dulles International and Reagan International airports. The Tysons Corner Center Property’s total trade area is comprised of approximately 3.2 million people in 1.2 million households with an average household income exceeding $165,000 and an average net worth over $1.8 million. As the primary shopping destination of Fairfax County, the trade area in which the Tysons Corner Center Property is located has an affluent, dense and educated population, and is ranked as having the 5th highest median household income in the United States. Loudon County and Falls Church City also fall within the Tysons Corner Center Property’s trade area and along with Fairfax County, represent three of the wealthiest counties in the United States.
Within the Fairfax County retail submarket, malls are the largest subtype, accounting for nearly 2.9 million SF. Rents are approximately $39.00/SF, which is a 3.7% increase from 2022. Vacancy in the retail submarket is 3.2%, which is near the same level it was a year ago. Vacancy has only fallen 0.1% during this time. During this period, 5,700 SF has been absorbed, and nothing has delivered. In the past three years, rents have increased a cumulative 7.4%.
As of year end 2022, the population within a 10-mile radius of the Tysons Corner Center Property had an aggregate retail sales level of $41.32 million, with average retail sales per household of $74,026. By comparison, the Washington D.C. metropolitan area had average sales per household of $71,488, while the Virginia and United States averages were $65,311 and $63,688, respectively.
| THE INFORMATION IN THIS STRUCTURAL AND COLLATERAL TERM SHEET IS NOT COMPLETE AND MAY BE AMENDED PRIOR TO THE TIME OF SALE. THIS TERM SHEET IS NOT AN OFFER TO SELL THESE SECURITIES AND IT IS NOT A SOLICITATION OF AN OFFER TO BUY THESE SECURITIES IN ANY JURISDICTION WHERE THE OFFER OR SALE IS NOT PERMITTED. | ||
| 39 | ||
|
Retail – Super Regional Mall 1961 Chain Bridge Road McLean, VA 22102
|
Collateral Asset Summary – Loan No. 2 Tysons Corner Center |
Cut-off Date Balance: Cut-off Date LTV: U/W NCF DSCR: U/W NOI Debt Yield: |
$73,960,000 39.4% 2.00x 13.7% |
As of 2022, Fairfax County had a population of 1,157,125, with 66% of households earning in excess of $100,000 and an average household net worth of $2.5 million. Within the Tysons Corner Center Property’s primary trade area, which had a population of 677,536 as of 2022, the average household income was $205,647, higher than Fairfax County overall and 27% higher than the greater Washington, DC metropolitan statistical area.
The following tables presents certain information relating to the demographics of the Tysons Corner Center Property:
| Demographics Summary(1)(2) | ||||||||
| Property Name | City, State | Whole Loan Cut-off Date Balance | 5-mile Population | 10-mile Population | 15-mile Population | 5-mile Avg Household Income | 10-mile Avg Household Income | 15-mile Avg Household Income |
| Tysons Corner Center | McLean, VA | $710,000,000 | 261,017 | 1,355,610 | 2,998,684 | $195,243 | $176,653 | $157,344 |
| (1) | Source: Appraisal. |
| (2) | Values are as of 2022. |
The Borrowers and the Borrower Sponsors. The borrowers for the Tysons Corner Center Whole Loan are Tysons Corner Property Holdings LLC and Tysons Corner Holdings LLC, each a Delaware limited liability company and single purpose entity with two independent directors. Legal counsel to the borrowers delivered a non-consolidation opinion in connection with the origination of the Tysons Corner Center Whole Loan.
The borrowers are a 50/50 joint venture between the borrower sponsors, which are the Macerich Partnership, L.P., a subsidiary of The Macerich Company (“Macerich”) and The Alaska Permanent Fund Corporation. Macerich is a fully integrated, self-managed and self-administered real estate investment trust. The Macerich Partnership, L.P. is the non-recourse carveout guarantor. As a leading owner, operator and developer of retail real estate in densely populated U.S. markets, Macerich’s portfolio is concentrated in California, the Pacific Northwest, Phoenix/Scottsdale, and the metropolitan New York to Washington, D.C. corridor. Developing and managing properties that serve as community cornerstones, Macerich currently owns 47 million SF of real estate consisting primarily of interests in 44 regional town centers.
The Alaska Permanent Fund, a sovereign wealth fund, was established in 1976 by Alaskans to preserve and convert the State’s non-renewable oil and mineral wealth into a renewable financial resource for all generations of Alaskans. The Alaska Permanent Fund is managed by the Alaska Permanent Fund Corporation, which was created by the Alaska State Legislature in 1980 as an independent state entity tasked with the mission to manage and invest the assets of the Alaska Permanent Fund and other funds designated by law. As of November 30, 2023, the Alaska Permanent Fund Corporation managed assets worth $75.5 billion.
Property Management. The Tysons Corner Center Property is managed by MACW Property Management, LLC, an affiliate of the non-recourse carveout guarantor.
Initial and Ongoing Reserves. At origination, the borrowers were required to deposit approximately $30,769,199 into an Outstanding TI/LC Reserve and $9,005,926 into a gap rent reserve.
Tax Reserve – During the continuance of a Trigger Period (as defined below), the borrowers are required to escrow 1/12th of the annual estimated tax payments payable during the next ensuing 12 months on a monthly basis.
Insurance Reserve – During the continuance of a Trigger Period, the borrowers are required to escrow 1/12th of the annual estimated insurance payments on a monthly basis, unless no event of default is continuing as to which the lender has initiated an enforcement action and the Tysons Corner Center Property is insured under a blanket policy meeting the requirements set forth in the related loan agreement (in which case, no insurance escrows will be required, notwithstanding the continuance of a Trigger Period).
Replacement Reserve – During the continuance of a Trigger Period, the borrowers are required to deposit monthly, with or on behalf of the lender, an amount equal to the gross leasable area of the Tysons Corner Center Property (excluding the non-collateral square footage and the premises leased or previously leased to (i) Nordstrom and (ii) Lord & Taylor, and any other tenant that is required to pay for all repairs and maintenance costs for its entire leased premises, roof and structural components) multiplied by $0.25 and divided by 12 (initially, $37,367) into a replacement reserve account subject to a cap of 24 times the required monthly deposit (initially, $896,819).
TI/LC Reserve – During the continuance of a Trigger Period, the borrowers are required to deposit monthly, with or on behalf of the lender, an amount equal to the gross leasable area of the Tysons Corner Center Property (excluding the non-collateral square footage and the premises leased or previously leased to (i) Nordstrom, (ii) Macy’s, (iii) Bloomingdales and (iv) Lord & Taylor) multiplied by $1.00 and divided by 12 (initially $149,740) into a leasing reserve account subject to a cap of 24 times the required monthly deposit (initially, $3,587,276).
| THE INFORMATION IN THIS STRUCTURAL AND COLLATERAL TERM SHEET IS NOT COMPLETE AND MAY BE AMENDED PRIOR TO THE TIME OF SALE. THIS TERM SHEET IS NOT AN OFFER TO SELL THESE SECURITIES AND IT IS NOT A SOLICITATION OF AN OFFER TO BUY THESE SECURITIES IN ANY JURISDICTION WHERE THE OFFER OR SALE IS NOT PERMITTED. | ||
| 40 | ||
|
Retail – Super Regional Mall 1961 Chain Bridge Road McLean, VA 22102
|
Collateral Asset Summary – Loan No. 2 Tysons Corner Center |
Cut-off Date Balance: Cut-off Date LTV: U/W NCF DSCR: U/W NOI Debt Yield: |
$73,960,000 39.4% 2.00x 13.7% |
All deposits to all reserve funds listed above may be in the form of Credit Support. “Credit Support” means any one or more of (A) cash, (B) United States obligations (C) other securities having a rating reasonably acceptable to the lender and for which a rating agency confirmation has been received, and/or (D) a letter of credit satisfying certain conditions. In addition, the TI/LC reserve may be replaced by a guaranty of limited payment provided by the non-recourse carveout guarantor, which will be reduced on a dollar-to-dollar basis by equity capital spent by the borrower on approved leasing expenses not duplicative of costs paid with funds in such reserve.
Lockbox / Cash Management. The Tysons Corner Center Whole Loan is structured with a hard lockbox and springing cash management. The borrowers are required to cause all tenants at the Tysons Corner Center Property to pay rents directly into a lockbox account controlled by the lender (the “Lockbox Account”), and to deposit any rents otherwise received by borrowers or the property manager into the Lockbox Account within three business days after receipt. Prior to a Trigger Period, the borrowers may utilize the Lockbox Account as the borrowers’ operating account. During the continuance of a Trigger Period, the borrowers will no longer have access to the Lockbox Account, and all funds deposited into the Lockbox Account are required to be swept on a weekly basis and on the second business day prior to each monthly payment date into a deposit account controlled by the lender (the “Cash Management Account”), to be applied and disbursed in accordance with the loan documents, provided no Cut-off Event (as defined below) is continuing, to pay debt service, the reserves and escrows described above, budgeted operating expenses, lender-approved extraordinary expenses, and capital projects undertaken in accordance with the loan documents. During the continuance of a Trigger Period, any excess cash is required to be deposited into an eligible account (the “Excess Cash Flow Reserve Account”) and held by the lender as additional security for the Whole Loan; provided, that, funds on deposit in the Excess Cash Flow Reserve Account will be made available to the borrowers for the payment of certain property-level expenses and other uses as set forth in the Tysons Corner Center Whole Loan documents, including required REIT distributions in an amount up to $500,000. All sums remaining on deposit in the Excess Cash Flow Reserve Account will be disbursed to the borrowers on the earlier to occur of (i) payment in full of the debt or (ii) discontinuation of a Trigger Period. A “Cut-off Event” means the occurrence of an event of default and the earlier of (i) an enforcement action (which has not been cured) or (ii) the tendering of a deed in lieu of foreclosure.
A “Trigger Period” means a period commencing upon (i) an event of default under the Tysons Corner Center Whole Loan documents or (ii) the interest only debt service coverage ratio falling below 1.50x for two consecutive calculation dates (a “Low DSCR Period”). A “calculation date” means the 60th day following the end of each calendar quarter. A Trigger Period resulting from an event of default will end if the lender has waived or the borrowers have cured such event of default. A Trigger Period resulting from a Low DSCR Period will end if the borrowers have maintained an interest only debt service coverage ratio of at least 1.50x for two consecutive calculation dates. Upon the end of a Trigger Period, all remaining funds in the Cash Management Account will be disbursed to the borrowers except for funds that are required to be deposited into an account whether or not a Trigger Period is continuing. The borrowers may also cure a Trigger Period arising from a Low DSCR Period by (i) following the expiration of the lockout period, prepaying the Tysons Corner Center Whole Loan (together with payment of the prepayment fee) in an amount that would result in an interest only debt service coverage ratio of 1.50x or (ii) providing to the lender Credit Support, in an amount which, if added to the underwritten net operating income of the Tysons Corner Center Property would cause the interest only debt service coverage ratio to equal 1.50x.
Current Mezzanine or Secured Subordinate Indebtedness. None.
Permitted Future Mezzanine or Secured Subordinate Indebtedness. Not Permitted.
Release of Collateral. The borrowers are permitted to obtain the free release of (i) non-income producing and unimproved real property, (ii) non-income producing real property that is improved by structures that have been vacant and non-income producing continuously since the origination date and for at least three years prior to the date of release, (iii) future development parcels identified in the loan agreement (and which may be increased in size by not more than 15%), and (iv) a parcel identified in the loan agreement as the “L&T Parcel,” which was formerly occupied by a Lord & Taylor store (and which may be increased in size by not more than 15%). Such release is subject to various conditions, including, among others, (i) satisfaction of REMIC related conditions, (ii) except in the case of a release of the L&T Parcel, certification by the borrowers that the release will not materially and adversely affect the use, operations, economic value of, or revenue produced by (exclusive of the economic value or revenue lost attributable to the release parcel) of the remaining improvements on the Tysons Corner Center Property, and (iii) the release parcel has been legally subdivided and constitutes a separate tax lot (or if not a separate tax lot, the release parcel owner is contractually obligated to pay its share of all taxes and other charges). Such release may be done by means of a lot line adjustment, plat, legal subdivision, vertical subdivision, condominium or any other means legally permitted.
Ground Lease. The borrower Tysons Corner Property Holdings LLC owns the fee interest in the Tysons Corner Center Property and ground leases it to the borrower Tysons Corner Holdings LLC, and the Tysons Corner Center Whole Loan is secured by both borrowers’ interests.
| THE INFORMATION IN THIS STRUCTURAL AND COLLATERAL TERM SHEET IS NOT COMPLETE AND MAY BE AMENDED PRIOR TO THE TIME OF SALE. THIS TERM SHEET IS NOT AN OFFER TO SELL THESE SECURITIES AND IT IS NOT A SOLICITATION OF AN OFFER TO BUY THESE SECURITIES IN ANY JURISDICTION WHERE THE OFFER OR SALE IS NOT PERMITTED. | ||
| 41 | ||
|
Industrial – Various Various Various, Various |
Collateral Asset Summary – Loan No. 3 Blue Owl Tenneco Portfolio |
Cut-off Date Balance: Cut-off Date LTV: U/W NCF DSCR: U/W NOI Debt Yield: |
$60,000,000 58.7% 1.80x 14.3% |
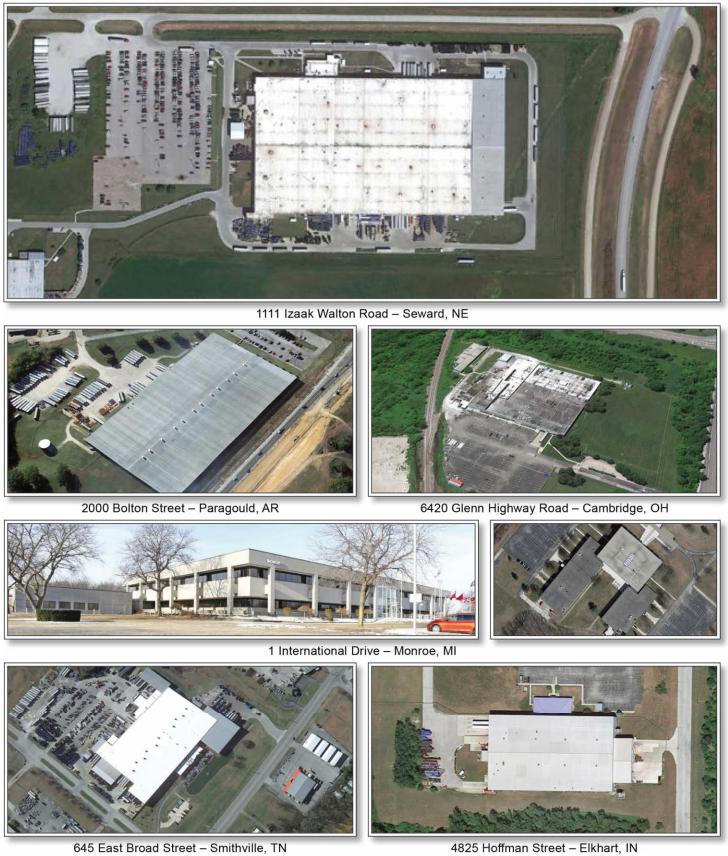
| THE INFORMATION IN THIS STRUCTURAL AND COLLATERAL TERM SHEET IS NOT COMPLETE AND MAY BE AMENDED PRIOR TO THE TIME OF SALE. THIS TERM SHEET IS NOT AN OFFER TO SELL THESE SECURITIES AND IT IS NOT A SOLICITATION OF AN OFFER TO BUY THESE SECURITIES IN ANY JURISDICTION WHERE THE OFFER OR SALE IS NOT PERMITTED. | ||
| 42 | ||
|
Industrial – Various Various Various, Various |
Collateral Asset Summary – Loan No. 3 Blue Owl Tenneco Portfolio |
Cut-off Date Balance: Cut-off Date LTV: U/W NCF DSCR: U/W NOI Debt Yield: |
$60,000,000 58.7% 1.80x 14.3% |
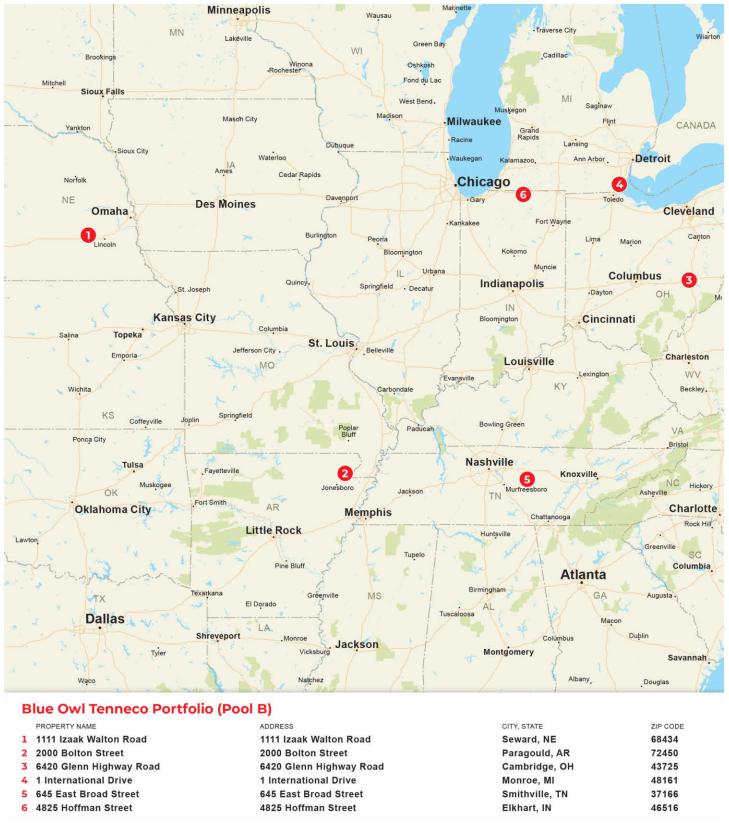
| THE INFORMATION IN THIS STRUCTURAL AND COLLATERAL TERM SHEET IS NOT COMPLETE AND MAY BE AMENDED PRIOR TO THE TIME OF SALE. THIS TERM SHEET IS NOT AN OFFER TO SELL THESE SECURITIES AND IT IS NOT A SOLICITATION OF AN OFFER TO BUY THESE SECURITIES IN ANY JURISDICTION WHERE THE OFFER OR SALE IS NOT PERMITTED. | ||
| 43 | ||
|
Industrial – Various Various Various, Various |
Collateral Asset Summary – Loan No. 3 Blue Owl Tenneco Portfolio |
Cut-off Date Balance: Cut-off Date LTV: U/W NCF DSCR: U/W NOI Debt Yield: |
$60,000,000 58.7% 1.80x 14.3% |
| Mortgage Loan Information | Property Information | ||||||||||
| Loan Sellers: | GACC, BMO | Single Asset / Portfolio: | Portfolio | ||||||||
| Loan Purpose(1): | Acquisition | Property Type – Subtype(4): | Industrial – Various | ||||||||
| Borrower Sponsor(s): | Blue Owl NLT Operating Partnership LP | Collateral: | Fee | ||||||||
| Borrower(s)(2): | Various | Location(4): | Various, Various | ||||||||
| Original Balance: | $60,000,000 | Year Built / Renovated(4): | Various / Various | ||||||||
| Cut-off Date Balance: | $60,000,000 | Property Management: | Self-Managed | ||||||||
| % by Initial UPB: | 6.8% | Size: | 1,538,760 SF | ||||||||
| Interest Rate: | 7.58500% | Appraised Value / Per SF: | $102,200,000 / $66 | ||||||||
| Note Date: | November 17, 2023 | Appraisal Date: | Various | ||||||||
| Original Term: | 60 months | Occupancy: | 100.0% (as of January 6, 2024) | ||||||||
| Amortization: | Interest Only | UW Economic Occupancy: | 95.0% | ||||||||
| Original Amortization: | NAP | Underwritten NOI: | $8,557,581 | ||||||||
| Interest Only Period: | 60 months | Underwritten NCF: | $8,326,767 | ||||||||
| First Payment Date: | January 6, 2024 | ||||||||||
| Maturity Date: | December 6, 2028 | Historical NOI | |||||||||
| Additional Debt Type: | NAP | Most Recent NOI(5): | NAV | ||||||||
| Additional Debt Balance: | NAP | 2022 NOI(5): | NAV | ||||||||
| Call Protection: | L(12),YM1(13),DorYM1(30),O(5) | 2021 NOI(5): | NAV | ||||||||
| Lockbox / Cash Management: | Hard / Springing | 2020 NOI(5): | NAV | ||||||||
| Reserves(3) | Financial Information | ||||||||||
| Initial | Monthly | Cap | Cut-off Date Loan Per SF: | $39 | |||||||
| Taxes: | $0 | Springing | NAP | Maturity Date Loan Per SF: | $39 | ||||||
| Insurance: | $0 | Springing | NAP | Cut-off Date LTV: | 58.7% | ||||||
| FF&E: | $0 | Springing | NAP | Maturity Date LTV: | 58.7% | ||||||
| TI/LC: | $0 | Springing | NAP | UW NOI DY: | 14.3% | ||||||
| Other: | $0 | $0 | NAP | UW NCF DSCR: | 1.80x | ||||||
| Sources and Uses | |||||||||||
| Sources | Proceeds | % of Total | Uses | Proceeds | % of Total | ||||||
| Mortgage Loan | $60,000,000 | 60.9% | Purchase Price(1) | $97,323,731 | 98.7% | ||||||
| Borrower Sponsor Equity | 38,602,490 | 39.1 | Closing Costs | 1,278,758 | 1.3 | ||||||
| Total Sources | $98,602,490 | 100.0% | Total Uses | $98,602,490 | 100.0% | ||||||
| (1) | The borrowers executed a sale leaseback transaction in June and July 2023 to acquire the Blue Owl Tenneco (Pool B) Properties (as defined below). The loan proceeds were used to recapitalize the borrowers. |
| (2) | The borrower entities are TENCAOH001 LLC, TENPAAR001 LLC, TENSENE001 LLC, TENSMTN001 LLC, TENELIN001 LLC and TENMOMI001 LLC. |
| (3) | See “Initial and Ongoing Reserves” below. |
| (4) | See the “Portfolio Summary” chart below. |
| (5) | Historical net operating income is not available as the properties were purchased in a sale-leaseback transaction in June and July 2023 with the sole tenant. |
| THE INFORMATION IN THIS STRUCTURAL AND COLLATERAL TERM SHEET IS NOT COMPLETE AND MAY BE AMENDED PRIOR TO THE TIME OF SALE. THIS TERM SHEET IS NOT AN OFFER TO SELL THESE SECURITIES AND IT IS NOT A SOLICITATION OF AN OFFER TO BUY THESE SECURITIES IN ANY JURISDICTION WHERE THE OFFER OR SALE IS NOT PERMITTED. | ||
| 44 | ||
|
Industrial – Various Various Various, Various |
Collateral Asset Summary – Loan No. 3 Blue Owl Tenneco Portfolio |
Cut-off Date Balance: Cut-off Date LTV: U/W NCF DSCR: U/W NOI Debt Yield: |
$60,000,000 58.7% 1.80x 14.3% |
The Loan. The third largest mortgage loan (the “Blue Owl Tenneco Portfolio (Pool B) Mortgage Loan”) is secured by the borrowers’ fee interests in a portfolio of six industrial properties totaling 1,538,760 square feet located in six states (the “Blue Owl Tenneco Portfolio (Pool B) Properties”). The Blue Owl Tenneco Portfolio (Pool B) Mortgage Loan is evidenced by four promissory notes with an aggregate outstanding principal balance as of the Cut-off Date of $60,000,000. The Blue Owl Tenneco Portfolio (Pool B) Mortgage Loan was originated on November 17, 2023 by DBR Investments Co. Limited (“DBRI”) and Bank of Montreal (“BMO”). GACC is selling Note A-1 and Note A-2 with an aggregate outstanding principal balance as of the Cut-off Date of $45,000,000, and BMO is selling Note A-3 and Note A-4 with an aggregate outstanding principal balance as of the Cut-off Date of $15,000,000. The Blue Owl Tenneco Portfolio (Pool B) Mortgage Loan accrues interest at a fixed rate of 7.58500% per annum, has a term of five-years and is interest-only for the full term. The scheduled maturity date of the Blue Owl Tenneco Portfolio (Pool B) Mortgage Loan is the payment date that occurs on December 6, 2028.
The Properties. The Blue Owl Tenneco Portfolio (Pool B) Properties are comprised of six industrial properties totaling 1,538,760 square feet located in six states. The borrowers executed a sale-leaseback with the sole tenant, Tenneco Inc. (“Tenneco”), whereby the borrowers acquired the Blue Owl Tenneco Portfolio (Pool B) Properties and executed a 20-year triple-net lease with Tenneco (the “Tenneco Lease”) expiring July 31, 2043 with 3% annual escalations. Tenneco is a designer, manufacturer, and marketer of automotive products for original equipment and aftermarket customers. The Blue Owl Tenneco Portfolio (Pool B) Properties house processes that include prototype testing, design and fabrication, product engineering, and distribution among others. These facilities support many of Tenneco’s largest customers including Caterpillar Inc., General Motors Company, Ford, Fiat Chrysler Automobiles and Deere & Company (John Deere). The properties included in the portfolio are the ones that are mission-critical to Tenneco operations, housing processes that are integral to Tenneco’s operations including prototype testing, design and fabrication, product engineering, distribution, and more.
The following table presents certain information relating to the Blue Owl Tenneco Portfolio (Pool B) Properties:
| Portfolio Summary | ||||||||||
| Property Name | City, State | Property Type - Subtype | Year Built / Renovated | SF(1) | Occupancy(1) | Allocated Mortgage Loan Cut-off Date Balance | % of Allocated Mortgage Loan Cut-off Date Balance | Appraised Value(2) | % of Base Rent | Max Clear Height |
| 1111 Izaak Walton Road |
Seward, NE |
Industrial – Warehouse/Distribution | 1974 / 2012 | 550,344 | 100.0% | $20,431,000 | 34.1% | $34,800,000 | 35.2% | 25” |
| 2000 Bolton Street | Paragould, AR | Industrial – Warehouse/Distribution | 1989 / 2022 | 300,000 | 100.0 | 14,677,000 | 24.5 | 25,000,000 | 23.3% | 28’ |
| 6420 Glenn Highway Road | Cambridge, OH | Industrial - Manufacturing | 1953, 1957, 1960, 1991, 1992 / NAP | 176,700 | 100.0 | 8,160,000 | 13.6 | 13,900,000 | 14.2% | 16” |
| 1 International Drive | Monroe, MI | Industrial - Flex | 1973 / 1996 | 195,916 | 100.0 | 7,926,000 | 13.2 | 13,500,000 | 13.9% | 14’ |
| 645 East Broad Street | Smithville, TN | Industrial – Flex | 1988 / 2022 | 230,000 | 100.0 | 5,753,000 | 9.6 | 9,800,000 | 8.8% | 20’ |
| 4825 Hoffman Street | Elkhart, IN | Industrial – Flex | 1996 / NAP | 85,800 | 100.0 | 3,053,000 | 5.1 | 5,200,000 | 4.5% | 48’ |
| Total / Wtd. Avg. | 100.0% | 1,538,760 | 100.0% | $60,000,000 | 100.0% | $102,200,000 | 100.0% | |||
| (1) | Based on the underwritten rent roll dated January 6, 2024. |
| (2) | Source: Appraisals. |
The following table presents certain information relating to historical occupancy for the Blue Owl Tenneco Portfolio (Pool B) Properties:
| Historical Occupancy | |||
| 2020 | 2021 | 2022 | As of Jan 6, 2024(1) |
| 100.0% | 100.0% | 100.0% | 100.0% |
| (1) | Based on the underwritten rent roll dated January 6, 2024. |
Sole Tenant. The Blue Owl Tenneco Portfolio (Pool B) Properties are 100% leased to Tenneco through July 31, 2043. The lease has five, five-year renewal options with at least 18 months’ notice at the greater of fair market rent or 3.0% over the prior year’s base rent. There are no termination options, except in connection with certain casualty or condemnation events. Rent under the lease commences at $8,759,136 annually (approximately $5.69 per square foot), with 3.0% annual increases.
Tenneco has operated from the Blue Owl Tenneco Portfolio (Pool B) Properties for an average of approximately 46 years (dating back as early as 1953). The location of the Blue Owl Tenneco Portfolio (Pool B) Properties is proximate to Tenneco’s largest clients, including General Motors and Ford, allowing for direct links to end-users. Further, Tenneco has invested significantly in the Blue Owl Tenneco Portfolio (Pool B) Properties, with over $104 million in capital improvements since 2019 and planned through 2024. Capital expenditures planned for 2024 are not required or reserved for under the loan documents and there can be no assurance that they will be implemented as planned.
| THE INFORMATION IN THIS STRUCTURAL AND COLLATERAL TERM SHEET IS NOT COMPLETE AND MAY BE AMENDED PRIOR TO THE TIME OF SALE. THIS TERM SHEET IS NOT AN OFFER TO SELL THESE SECURITIES AND IT IS NOT A SOLICITATION OF AN OFFER TO BUY THESE SECURITIES IN ANY JURISDICTION WHERE THE OFFER OR SALE IS NOT PERMITTED. | ||
| 45 | ||
|
Industrial – Various Various Various, Various |
Collateral Asset Summary – Loan No. 3 Blue Owl Tenneco Portfolio |
Cut-off Date Balance: Cut-off Date LTV: U/W NCF DSCR: U/W NOI Debt Yield: |
$60,000,000 58.7% 1.80x 14.3% |
In February 2022, Tenneco was acquired by Apollo in a $7.1 billion all-cash transaction, including an investment of $1.6 billion of cash equity, as well as additional debt.
The Tenneco Lease permits the tenant to assign or transfer its lease or sublet its space at one or more leased premises (x) to an entity that purchases, or effectuates a merger or consolidation of or with respect to, all or substantially all of the interests in, or assets of, either (i) Tenneco or (ii) an operating division, business group, or department of Tenneco (any, a “Division”), (y) to an entity or entities created by splitting the Division of Tenneco using the leased premises into one or more separate corporations, partnerships, or other entities and (z) in connection with the public offering of the stock of (i) Tenneco (ii) any affiliated or successor entity of Tenneco, or (iii) any entity created in connection with the “spin-off” of an operating Division of Tenneco; provided that in the case of each of (x), (y) and (z) (each a “Tenneco Divisional Transfer”), each of (1) the proposed transferee (or a substitute guarantor) that will become the tenant as to the applicable leased premises and (2) the surviving Tenneco entity (or substitute guarantor) that will remain the tenant under the Tenneco Lease as to the remaining leased premises has (x) a total indebtedness leverage ratio of less than 6.25 to 1, as evidenced by the financial statements of such entity or its guarantor, as applicable, and (y) EBITDA of at least $100,000,000. See “Description of the Mortgage Pool—Property Types—Industrial Properties” in the preliminary prospectus for further information regarding such financial tests. Simultaneously with a Tenneco Divisional Transfer, unless the lender elects in its sole and absolute discretion to have the related property remain as collateral for the Blue Owl Tenneco Portfolio (Pool B) Mortgage Loan, the borrowers are required to obtain the release of such property as described below under “Release of Collateral.” In addition, the borrowers have the right to sever the Tenneco Lease into two or more leases; however, the loan documents require the lender’s consent for a severance.
Tenneco (rated Caa1/B/CCC+ by Moody’s, S&P and Fitch) is a designer, manufacturer and marketer of automotive products for original equipment and aftermarket customers. Tenneco operates globally at over 200 sites worldwide and employs 71,000 people. Tenneco produces automotive parts through four business segments: Motorparts (DriV), Performance Solutions, Clean Air, and Powertrain. The chart below details each business segment and the revenue share generated by each:
| Business Segment Revenue Share(1) | ||
| Segment | LTM Revenue % | Description |
| Motorparts | 15% | Manufactures, sources, markets and distributes a broad portfolio of leading brand-name products in the global vehicle aftermarket while also servicing original equipment. |
| Performance Solutions | 17% | Designs, manufactures, markets and distributes a variety of products and systems designed to optimize the ride experience to a global original equipment customer base. |
| Clean Air | 46% | Designs, manufactures, and distributes a variety of products and systems designed to reduce pollution and optimize engine performance, acoustic tuning and weight on a vehicle. |
| Powertrain | 22% | Designs, manufactures, and distributes a variety of original equipment powertrain products for light vehicle, commercial truck, off-highway and industrial applications |
| (1) | Source: borrower sponsor. |
The following table presents certain information relating to the sole tenant at the Blue Owl Tenneco Portfolio (Pool B) Properties:
| Tenant Summary(1) | ||||||||||||
|
Tenant |
Credit Rating (Moody’s/S&P/Fitch)(2) | Net Rentable Area (SF) | % of Net Rentable Area | U/W Base Rent | U/W Base Rent Per SF | % of Total U/W Base Rent | Lease Expiration | Termination Option (Y/N) | Renewal Options(3) | |||
| Tenneco Inc. | Caa1/B/CCC+ | 1,538,760 | 100.0% | 8,759,136 | $5.69 | 100.0% | 12/31/2042 | No | 5 x 5 Yr | |||
| Total Occupied | 1,538,760 | 100.0% | 8,759,136 | $5.69 | 100.0% | |||||||
| Vacant | 0 | 0.0% | ||||||||||
| Total | 1,538,760 | 100.0% | ||||||||||
| (1) | Based on the underwritten rent roll dated January 6, 2024. |
| (2) | In certain instances, ratings provided are those of the parent company of the entity shown, whether or not the parent company guarantees the lease. |
| (3) | The Tenneco Lease has five, five year renewal options with at least 18 months’ notice at the greater of fair market rent or 3.0% over the last base rent. |
| THE INFORMATION IN THIS STRUCTURAL AND COLLATERAL TERM SHEET IS NOT COMPLETE AND MAY BE AMENDED PRIOR TO THE TIME OF SALE. THIS TERM SHEET IS NOT AN OFFER TO SELL THESE SECURITIES AND IT IS NOT A SOLICITATION OF AN OFFER TO BUY THESE SECURITIES IN ANY JURISDICTION WHERE THE OFFER OR SALE IS NOT PERMITTED. | ||
| 46 | ||
|
Industrial – Various Various Various, Various |
Collateral Asset Summary – Loan No. 3 Blue Owl Tenneco Portfolio |
Cut-off Date Balance: Cut-off Date LTV: U/W NCF DSCR: U/W NOI Debt Yield: |
$60,000,000 58.7% 1.80x 14.3% |
The following table presents certain information relating to the lease rollover schedule at the Blue Owl Tenneco Portfolio (Pool B) Properties, based on initial lease expiration dates:
| Lease Rollover Schedule(1) | |||||||||||
| Year Ending December 31 | Expiring Owned GLA | % of Owned GLA | Cumulative % of Owned GLA | UW Base Rent | % of Total UW Base Rent | UW Base Rent $ per SF | # of Expiring Leases | ||||
| MTM | 0 | 0.0 | % | 0.0% | $0.00 | 0.0 | % | $0.00 | 0 | ||
| 2024 | 0 | 0.0 | 0.0% | $0.00 | 0.0 | 0.00 | 0 | ||||
| 2025 | 0 | 0.0 | 0.0% | $0.00 | 0.0 | 0.00 | 0 | ||||
| 2026 | 0 | 0.0 | 0.0% | $0.00 | 0.0 | 0.00 | 0 | ||||
| 2027 | 0 | 0.0 | 0.0% | $0.00 | 0.0 | 0.00 | 0 | ||||
| 2028 | 0 | 0.0 | 0.0% | $0.00 | 0.0 | 0.00 | 0 | ||||
| 2029 | 0 | 0.0 | 0.0% | $0.00 | 0.0 | 0.00 | 0 | ||||
| 2030 | 0 | 0.0 | 0.0% | $0.00 | 0.0 | 0.00 | 0 | ||||
| 2031 | 0 | 0.0 | 0.0% | $0.00 | 0.0 | 0.00 | 0 | ||||
| 2032 | 0 | 0.0 | 0.0% | $0.00 | 0.0 | 0.00 | 0 | ||||
| 2033 | 0 | 0.0 | 0.0% | $0.00 | 0.0 | 0.00 | 0 | ||||
| 2034 | 0 | 0.0 | 0.0% | $0.00 | 0.0 | 0.00 | 0 | ||||
| 2035 & Thereafter | 1,538,760 | 100.0 | 100.0% | $8,759,136 | 100.0 | 5.69 | 1 | ||||
| Vacant | 0 | 0.0 | 100.0% | NAP | NAP | NAP | NAP | ||||
| Total / Wtd. Avg. | 1,538,760 | 100.0 | % | $8,759,136 | 100.0% | $5.69 | 1 | ||||
| (1) | Based on the underwritten rent roll dated January 6, 2024. |
Appraisals. According to the portfolio appraisal, the Blue Owl Tenneco Portfolio (Pool B) Properties have an aggregate “as-is” appraised value of $102,200,000 as of the individual appraisal dates between August 9, 2023 and August 11, 2023. According to the individual appraisals, the Blue Owl Tenneco Portfolio (Pool B) Properties had an aggregate hypothetical value “as dark” of $55,850,000 based on the appraisals dated August 9, 2023 through August 11, 2023. Based on the aggregate values, the hypothetical loan to dark value is 107.4%.
Appraisal Approach |
Appraised Value |
Capitalization Rate |
| Discounted Cash Flow Approach | $102,200,000 | 10.40% |
Environmental Matters. According to the Phase I environmental reports dated March 31, 2023 and July 6, 2023, a controlled recognized environmental condition (“CREC”) exists at the 6420 Glenn Highway Road property and a recognized environmental condition (“REC”) exists at the 1111 Izaak Walton Road property. Limited Phase II investigations were performed at such properties, as well as at the 645 East Broad Street property even though no RECs or CRECs were identified at the 645 East Broad Street property. See “Description of the Mortgage Pool—Environmental Considerations” in the Preliminary Prospectus. No RECs or CRECs were identified at the remaining properties.
The Market. The Blue Owl Tenneco Portfolio (Pool B) Properties are located in Nebraska, Arkansas, Ohio, Michigan, Tennessee and Indiana. The Blue Owl Tenneco Portfolio (Pool B) Properties are dispersed geographically with each asset in a different state. No location makes up more than 35.8% of NRA. A stratification of the Blue Owl Tenneco Portfolio (Pool B) Properties by state is presented in the chart below:
| Geographic Summary | |||||||||
| State | # of Properties | Total SF(2) | % of NRA(2) | Occupied SF(2) | Occupancy(2) | Base Rent | Market Rent PSF(1) | Base Rent PSF | |
| Nebraska | 1 | 550,344 | 35.8% | 550,344 | 100.0% | $3,086,096 | $5.75 | $5.61 | |
| Arkansas | 1 | 300,000 | 19.5% | 300,000 | 100.0% | $2,044,429 | $6.50 | $6.81 | |
| Tennessee | 1 | 230,000 | 14.9% | 230,000 | 100.0% | $772,502 | $3.10 | $3.36 | |
| Michigan | 1 | 195,916 | 12.7% | 195,916 | 100.0% | 1,214,240 | $5.50 | $6.20 | |
| Ohio | 1 | 176,700 | 11.5% | 176,700 | 100.0% | 1,247,175 | $4.00 | $7.06 | |
| Indiana | 1 | 85,800 | 5.6% | 85,800 | 100.0% | 394,694 | $5.00 | $4.60 | |
| Total / Wtd. Avg. | 6 | 1,538,760 | 100.0% | 1,538,760 | 100.0% | 8,759,136 | $5.69 | ||
| (1) | Source: Appraisal. |
| (2) | Based on the underwritten rent roll dated January 6, 2024. |
| THE INFORMATION IN THIS STRUCTURAL AND COLLATERAL TERM SHEET IS NOT COMPLETE AND MAY BE AMENDED PRIOR TO THE TIME OF SALE. THIS TERM SHEET IS NOT AN OFFER TO SELL THESE SECURITIES AND IT IS NOT A SOLICITATION OF AN OFFER TO BUY THESE SECURITIES IN ANY JURISDICTION WHERE THE OFFER OR SALE IS NOT PERMITTED. | ||
| 47 | ||
|
Industrial – Various Various Various, Various |
Collateral Asset Summary – Loan No. 3 Blue Owl Tenneco Portfolio |
Cut-off Date Balance: Cut-off Date LTV: U/W NCF DSCR: U/W NOI Debt Yield: |
$60,000,000 58.7% 1.80x 14.3% |
The following table presents certain information relating to the demographics of the areas where the Blue Owl Tenneco Portfolio (Pool B) Properties are located:
| Demographics Summary(1)(2) | |||||||
| Property Name | City, State | 1-mile Population | 3-mile Population | 5-mile Population | 1-mile Avg Household Income | 3-mile Avg Household Income | 5-mile Avg Household Income |
| 1111 Izaak Walton Road | Seward, NE | NAV | NAV | NAV | NAV | NAV | NAV |
| 2000 Bolton Street | Paragould, AR | 3,118 | 20,669 | 31,767 | $64,257 | $57,814 | $63,570 |
| 6420 Glenn Highway Road | Cambridge, OH | 977 | 11,154 | 18,471 | $60,351 | $62,624 | $66,605 |
| 1 International Drive | Monroe, MI | 3,614 | 23,773 | 46,519 | $90,005 | $74,096 | $77,433 |
| 645 East Broad Street | Smithville, TN | 748 | 7,357 | 10,830 | $79,002 | $64,761 | $66,609 |
| 4825 Hoffman Street | Elkhart, IN | 1,124 | 28,406 | 85,747 | $110,521 | $98,334 | $80,322 |
| (1) | Source: Appraisal. |
| (2) | Values are 2023 estimations. |
| THE INFORMATION IN THIS STRUCTURAL AND COLLATERAL TERM SHEET IS NOT COMPLETE AND MAY BE AMENDED PRIOR TO THE TIME OF SALE. THIS TERM SHEET IS NOT AN OFFER TO SELL THESE SECURITIES AND IT IS NOT A SOLICITATION OF AN OFFER TO BUY THESE SECURITIES IN ANY JURISDICTION WHERE THE OFFER OR SALE IS NOT PERMITTED. | ||
| 48 | ||
|
Industrial – Various Various Various, Various |
Collateral Asset Summary – Loan No. 3 Blue Owl Tenneco Portfolio |
Cut-off Date Balance: Cut-off Date LTV: U/W NCF DSCR: U/W NOI Debt Yield: |
$60,000,000 58.7% 1.80x 14.3% |
The following table presents certain information relating to the Underwritten Net Cash Flow at the Blue Owl Tenneco Portfolio (Pool B) Properties:
| Cash Flow Analysis(1)(2) | ||
| U/W | U/W Per SF | |
| Base Rent | $8,759,136 | $5.69 |
| Contractual Rent Steps(3) | 262,774 | 0.17 |
| Gross Potential Rent | $9,021,910 | $5.86 |
| Total Reimbursements | 264,667 | 0.17 |
| Net Rental Income | $9,286,578 | $6.04 |
| Vacancy & Credit Loss | (464,329) | (0.30) |
| Effective Gross Income | $8,822,249 | $5.73 |
| Total Expenses | 264,667 | 0.17 |
| Net Operating Income | $8,557,581 | $5.56 |
| Capital Expenditures | 230,814 | 0.15 |
| TI/LC | 0 | 0.00 |
| Net Cash Flow | $8,326,767 | $5.41 |
| Occupancy | 95.0% | |
| NCF DSCR | 1.80x | |
| NOI Debt Yield | 14.3% | |
| (1) | Based on the underwritten rent roll dated January 6, 2024. |
| (2) | Historical cash flows are unavailable due to the acquisition of the Blue Owl Tenneco Portfolio (Pool B) Properties in a sale-leaseback transaction in June and July 2023. |
| (3) | Inclusive of rent steps through July 31, 2024. |
The Borrowers and the Borrower Sponsor. The borrowers for the Blue Owl Tenneco Portfolio (Pool B) Mortgage Loan are TENCAOH001 LLC, TENPAAR001 LLC, TENSENE001 LLC, TENSMTN001 LLC, TENELIN001 LLC and TENMOMI001 LLC, each a Delaware limited liability company and each a single purpose entity with two independent directors. Legal counsel to the borrowers delivered a non-consolidation opinion in connection with the origination of the Blue Owl Tenneco Portfolio (Pool B) Mortgage Loan.
The borrower sponsor for the Blue Owl Tenneco Portfolio (Pool B) Mortgage Loan is Blue Owl NLT Operating Partnership LP, a Delaware limited partnership, a joint venture between Blue Owl Capital Inc (“Blue Owl”) and GIC (Realty) Private Limited, a fund controlled by the government of Singapore. Blue Owl (NYSE: OWL) is an asset manager with $144 billion of assets under management. Blue Owl was formed in May 2021 by the strategic combination of Owl Rock, a direct lending platform, and Dyal Capital, a provider of capital solutions to large, multi-product private capital managers. Blue Owl acquired Oak Street, a private equity real estate firm, in December 2021 as a complement to its direct lending and GP solutions platform. Owl Rock, Dyal Capital, and Oak Street are divisions of Blue Owl. In April 2022, Blue Owl acquired Wellfleet Credit Partners which focuses on the management of CLO portfolios of broadly syndicated leveraged loans and is now a platform within the Owl Rock division.
Property Management. The Blue Owl Tenneco Portfolio (Pool B) Properties are self-managed by the sole tenant.
Initial and Ongoing Reserves.
Tax Reserve – In the event the Reserve Waiver Conditions (as defined below) are no longer being met, the borrowers are required to escrow 1/12 of the annual estimated tax payments payable during the next ensuing 12 months on a monthly basis.
Insurance Reserve – In the event the Reserve Waiver Conditions are no longer being met, the borrowers are required to escrow 1/12 of the annual estimated insurance payments on a monthly basis, unless the Portfolio is insured under a blanket policy meeting the requirements set forth in the related loan agreement (in which case, no insurance escrows will be required, even if the Reserve Waiver Conditions are no longer met).
| THE INFORMATION IN THIS STRUCTURAL AND COLLATERAL TERM SHEET IS NOT COMPLETE AND MAY BE AMENDED PRIOR TO THE TIME OF SALE. THIS TERM SHEET IS NOT AN OFFER TO SELL THESE SECURITIES AND IT IS NOT A SOLICITATION OF AN OFFER TO BUY THESE SECURITIES IN ANY JURISDICTION WHERE THE OFFER OR SALE IS NOT PERMITTED. | ||
| 49 | ||
|
Industrial – Various Various Various, Various |
Collateral Asset Summary – Loan No. 3 Blue Owl Tenneco Portfolio |
Cut-off Date Balance: Cut-off Date LTV: U/W NCF DSCR: U/W NOI Debt Yield: |
$60,000,000 58.7% 1.80x 14.3% |
Replacement Reserve – In the event the Reserve Waiver Conditions are no longer being met, the borrowers are required to deposit monthly, with or on behalf of the lender, approximately $19,235 into a replacement reserve account.
TI/LC Reserve – In the event the Reserve Waiver Conditions are no longer being met, the borrower is required to deposit monthly, with or on behalf of the lender, $128,230 into a leasing reserve account.
The “Reserve Waiver Conditions” means the following: (i) the Tenneco lease is a triple net lease, remains in full force and effect with no monetary or material non-monetary default occurring thereunder and covers the entirety of the Portfolio, (ii) no Trigger Period (as defined below) is continuing, (iii) Tenneco is obligated pursuant to its lease (w) to pay directly to the applicable governmental authority taxes and other assessments (if any), (x) to maintain insurance consistent with the insurance requirements set forth in the loan documents, (y) is responsible for all capital expenditures related to the Portfolio and (z) to be responsible to directly pay for such other ongoing recurring property level expenses which would be covered by the applicable reserve which has been suspended, and (iv) Tenneco performs such obligations in a timely manner and the borrowers provide evidence of such performance to the lender in a timely manner.
Lockbox / Cash Management. The Blue Owl Tenneco Portfolio (Pool B) Mortgage Loan is structured with a hard lockbox and springing cash management. The borrowers are required to direct the sole tenant to pay rent directly into the lockbox account, and to deposit any rents otherwise received into such account within two business days after receipt. During the continuance of a Trigger Period, provided no event of default is continuing, all funds in the lockbox account are required to be swept on a daily basis to a lender-controlled cash management account. Provided no event of default is continuing, funds in the cash management account are required to be applied to debt service, the reserves and escrows described above, budgeted operating expenses, lender-approved extraordinary expenses and required REIT distributions not exceeding $75,000 per annum, with any excess funds (i) during a Trigger Period due to a Lease Sweep Period (as defined below), to be deposited into a lease sweep reserve, (ii) if no Lease Sweep Period is continuing, but any other Trigger Period is continuing, to be deposited into a cash collateral account held by the lender as cash collateral for the Blue Owl Tenneco Portfolio (Pool B) Mortgage Loan during such Trigger Period.
A “Trigger Period” means the period commencing upon the occurrence of (i) an event of default under the Blue Owl Tenneco Portfolio (Pool B) Mortgage Loan documents, (ii) a Low DSCR Period (as defined below), or (iii) a Lease Sweep Period (as defined below). A Trigger Period will end if (i) in the case of an event of default, a cure of such event of default is accepted by the lender, (ii) in the case of a Low DSCR Period, the Low DSCR Period has been cured in accordance with the definition of such term, and (iii) in the case of a Lease Sweep Period, such Lease Sweep Period has been cured in accordance with the definition of such term.
A “Low DSCR Period” will commence if as of the last day of two consecutive calendar quarters the Blue Owl Tenneco Portfolio (Pool B) Mortgage Loan interest only debt service coverage ratio is less than 1.35x; however, if any tenant becomes subject to certain underwritten net cash flow adjustments as described in the loan agreement, then the underwritten net cash flow as of the most recent calendar quarter may be immediately adjusted downward by the lenders and to the extent said adjustment results in a debt service coverage ratio that is below 1.35x, a Low DSCR Period will immediately commence. A Low DSCR Period will end when either (i) the Blue Owl Tenneco Portfolio (Pool B) Mortgage Loan interest only debt service coverage ratio is at least 1.35x as of the last day of two consecutive calendar quarters or (ii) cash has been deposited with the lenders (or swept into the cash collateral account) or a letter of credit has been delivered to the lender, in each case in an amount which if applied to repay the outstanding principal balance of the Blue Owl Tenneco Portfolio (Pool B) Mortgage Loan would cause the interest only debt service coverage ratio to be 1.35x. Such cash or letter of credit is required to be released to the borrowers if the Blue Owl Tenneco Portfolio (Pool B) Mortgage Loan interest only debt service coverage ratio is at least 1.35x as of the last day of two consecutive calendar quarters.
A “Lease Sweep Period” will commence on the first monthly payment date following (a) the earlier of (i) the date that is twelve months prior to the expiration of a Sweep Lease (as defined below) or (ii) the date required under the Sweep Lease by which the Sweep Tenant (as defined below) is required to give notice of its exercise of a renewal option thereunder (and such renewal has not been so exercised); (b) upon (1) the surrender, cancellation or termination of a Sweep Lease (or any material portion thereof) or (2) upon the borrower’s receipt of written notice by a Sweep Tenant of its intent to effect a surrender, cancellation or termination of its Sweep Lease (or any material portion thereof); (c) if a Sweep Tenant has discontinued its business (i.e., “goes dark”) in 10% or more of its space at the Blue Owl Tenneco Portfolio (Pool B) Properties (provided that a Lease Sweep Period will not be deemed to exist if the sole reason the Sweep Tenant is dark is to (i) perform alterations or repairs in accordance with its lease and the loan documents for a period not to exceed 90 days, (ii) restore the applicable property following a casualty or condemnation for a period of not more than 270 days or (iii) comply with governmental restrictions on the use or occupancy of the applicable property in connection with any pandemic or epidemic and the Sweep Tenant resumes operations within 30 days after such government restrictions are lifted); (d) upon a monetary or material nonmonetary default under a Sweep Lease by a Sweep Tenant beyond any applicable notice and cure period, (e) upon a bankruptcy or insolvency proceeding of a Sweep Tenant or its direct or indirect parent company or lease guarantor (if any) (f) upon a decline in the credit rating of the Sweep Tenant (or its parent) below B- or equivalent by any rating agency or (g) upon the borrower or lender receiving notice or obtaining knowledge of a material monetary default under any corporate credit facility in place with respect to a Sweep Tenant or its direct or indirect parent company or lease guarantor (if any).
| THE INFORMATION IN THIS STRUCTURAL AND COLLATERAL TERM SHEET IS NOT COMPLETE AND MAY BE AMENDED PRIOR TO THE TIME OF SALE. THIS TERM SHEET IS NOT AN OFFER TO SELL THESE SECURITIES AND IT IS NOT A SOLICITATION OF AN OFFER TO BUY THESE SECURITIES IN ANY JURISDICTION WHERE THE OFFER OR SALE IS NOT PERMITTED. | ||
| 50 | ||
|
Industrial – Various Various Various, Various |
Collateral Asset Summary – Loan No. 3 Blue Owl Tenneco Portfolio |
Cut-off Date Balance: Cut-off Date LTV: U/W NCF DSCR: U/W NOI Debt Yield: |
$60,000,000 58.7% 1.80x 14.3% |
A Lease Sweep Period will terminate upon: (A) in the case of clauses (a), (b), and (c) above, the entirety of the Sweep Lease space (or applicable portion thereof) is leased pursuant to one or more qualified leases (which must be on market terms and have terms that extend at least five years beyond the loan term) and in the lender’s reasonable judgement there are sufficient funds in the lease sweep reserve to cover all reasonably anticipated leasing expenses, and free or abated rent periods for such qualified leases (collectively, “Leasing Costs”), and any shortfalls in loan agreement payments or operating expenses resulting from anticipated down time prior to the commencement of payments under such qualified leases (collectively, “Shortfalls”); (B) in the case of clause (a) above, the Sweep Tenant irrevocably exercises its renewal option and there are sufficient funds in the lease sweep reserve to cover all anticipated shortfalls or leasing expenses in connection with such renewal; (C) in the case of clause (d) above, the default in question has been cured and no other default is continuing for a period of 60 days thereafter; (D) in the case of clause (e) above, the applicable bankruptcy or insolvency proceeding has been terminated and the applicable Sweep Lease (and any guaranty of it) has been affirmed or assumed in a manner reasonably satisfactory to the lender or pursuant to a final non-appealable order of the bankruptcy court, all lease defaults have been cured and the Sweep Tenant is in occupancy and paying full, unabated rent, and adequate assurance of future performance under the Sweep Lease (and any guaranty), as reasonably determined by the lender, has been provided; (E) in the case of clause (f) above, the credit rating of the Sweep Lease tenant has been restored to at least “B-“ or equivalent by any of the rating agencies; and (F) in the case of clause (g) above, the earlier to occur of (x) delivery of evidence acceptable to the lender, in its sole and absolute discretion, that such material monetary default under such corporate credit facility has been cured or such corporate credit facility has been repaid in full and (y) the date funds equal to $7,500,000 have accumulated in the lease sweep reserve.
A “Sweep Lease” means the Tenneco Lease and any replacement lease that covers at least 25% of the rentable square feet of the Portfolio.
A “Sweep Tenant” means any tenant under a Sweep Lease.
Current Mezzanine or Secured Subordinate Indebtedness. None.
Permitted Future Mezzanine or Secured Subordinate Indebtedness. Not Permitted.
Release of Collateral. After the prepayment lockout expiration date, the related loan documents permit the release of any of the individual Blue Owl Tenneco Portfolio (Pool B) Properties in connection with the sale of such property (a "Blue Owl Tenneco Sale Release"), upon satisfaction of the following conditions, among others, (i) no event of default is continuing, (ii) the sale is pursuant to an arm’s length agreement to a third party not affiliated with any borrower or guarantor, (iii) the borrowers prepay (x) the amount of any collateral held to cure a debt service coverage ratio related cash management trigger, and (y) the Release Amount (as defined below) for the applicable property, and pay (z) a prepayment fee equal to the greater of 1.0% (or if an event of default is continuing, 4.0%) of the amount prepaid and a yield maintenance premium on the amounts so prepaid, (iv) after giving effect to such sale and prepayment, the interest only debt service coverage ratio must be no less than the greater of 1.75x and the interest only debt service coverage ratio immediately preceding the sale, (v) the applicable property must be removed from the Tenneco Lease, and (vi) satisfaction of REMIC related conditions.
The related loan documents also permit the release of any of the individual Blue Owl Tenneco Portfolio (Pool B) Properties as to which the following conditions, among others, have been satisfied (a “Blue Owl Tenneco Defaulted Property Release”): (i) (x) an event of default is occurring that (1) is non-monetary in nature, (2) relates solely to the property being released (the “Defaulted Property”) and (3) after giving effect to the applicable release, no event of default is ongoing and (y) the borrowers have demonstrated in good faith to the lender that they have pursued a cure of such event of default (which will not require any capital contribution), which cure lender may accept or deny in its sole and absolute discretion, and (ii) all conditions to a Blue Owl Tenneco Sale Release set forth above, except that an event of default may exist (solely as to the Defaulted Property) and the release may be in connection with a transfer to a borrower affiliate.
The related loan documents also permit the release of any of the individual Blue Owl Tenneco Portfolio (Pool B) Properties as to which a casualty or condemnation has occurred (a “Blue Owl Tenneco Casualty/Condemnation Release”), provided that the following conditions, among others, have been satisfied, (i) either (x) the casualty or condemnation affects more than 60% of the rentable square footage at the applicable property or (y) the lender has determined that the net proceeds of such casualty or condemnation will be applied to repay the mortgage and the amount of net proceeds so applied is equal to at least 30% of the allocated loan amount for the applicable property; (ii) such release occurs no more than 120 days after the occurrence of the applicable casualty or condemnation, and (iii) all conditions to a Blue Owl Tenneco Sale Release set forth above, except that the release may be in connection with a transfer to a borrower affiliate.
In addition, unless otherwise elected by the lender in its sole discretion, the related loan documents require the borrowers to obtain the release of any related individual properties as to which a Tenneco Divisional Transfer has occurred as described above under “Sole Tenant” (a “Blue Owl Tenneco Divisional Transfer Release”), and to satisfy the conditions to a Blue Owl Tenneco Sale Release in connection therewith, except that an event of default may exist and the release may be in connection with a transfer to a borrower affiliate.
| THE INFORMATION IN THIS STRUCTURAL AND COLLATERAL TERM SHEET IS NOT COMPLETE AND MAY BE AMENDED PRIOR TO THE TIME OF SALE. THIS TERM SHEET IS NOT AN OFFER TO SELL THESE SECURITIES AND IT IS NOT A SOLICITATION OF AN OFFER TO BUY THESE SECURITIES IN ANY JURISDICTION WHERE THE OFFER OR SALE IS NOT PERMITTED. | ||
| 51 | ||
|
Industrial – Various Various Various, Various |
Collateral Asset Summary – Loan No. 3 Blue Owl Tenneco Portfolio |
Cut-off Date Balance: Cut-off Date LTV: U/W NCF DSCR: U/W NOI Debt Yield: |
$60,000,000 58.7% 1.80x 14.3% |
“Release Amount” means:
| ● | (A) with respect to any property released pursuant to a Blue Owl Tenneco Sale Release or a Blue Owl Tenneco Defaulted Property Release, the greater of (x) 85% of the net sales proceeds of such property and (y)(I) until such time as the outstanding principal balance of the Blue Owl Tenneco Portfolio (Pool B) Mortgage Loan is reduced by 20%, 110% of its allocated loan amount and (II) upon such time as the outstanding principal balance of the Blue Owl Tenneco Portfolio (Pool B) Mortgage Loan is reduced by at least 20%, 125% of its allocated loan amount; |
| ● | (B) with respect to any property released pursuant to a Blue Owl Tenneco Casualty/Condemnation Release, 125% of its allocated loan amount; and |
| ● | (C) with respect to any property released pursuant to a Blue Owl Tenneco Divisional Transfer Release, (x) with respect to each of the 1111 Izaak Walton Road property, the 2000 Bolton Street property and the 6420 Glenn Highway Road property, 115% of its allocated loan amount, (y) with respect to each of the 645 East Broad Street property and the 4825 Hoffman Street property, 110% of its allocated loan amount, and (z) with respect to the 1 International Drive property, 105% of its allocated loan amount. |
In addition, the loan documents permit the release of all or a portion of any vacant, non-improved land (each a “Release Parcel”) located on any of the 645 East Broad Street property or 1 International Drive property. Pursuant to agreements between the borrowers and Tenneco, such parties may each market the Release Parcel for sale (and upon such sale such Release Parcel will be removed from the Tenneco Lease), and the profits from any sale of a Release Parcel (net of expenses of the applicable borrower and Tenneco and all applicable taxes) are required to be divided 50% each between the applicable borrower and Tenneco. Such release is conditioned upon, among other things, (i) the Release Parcel constituting a legally divided separate tax lot and zoning lot, (ii) the release not causing any adverse effect on the use or operation of, or access to, the remaining portion of the related property or causing such remaining property to violate legal requirements or any document or instrument relating to such remaining property, (iii) compliance with REMIC related conditions, (iv) conveyance of the Release Parcel to a third party or to certain specified affiliates of the borrowers, and (v) deposit of any net proceeds received by the borrowers or any affiliate from the sale of the Release Parcel (but not any net proceeds allocable to Tenneco) into the lockbox account.
Ground Lease. None.
| THE INFORMATION IN THIS STRUCTURAL AND COLLATERAL TERM SHEET IS NOT COMPLETE AND MAY BE AMENDED PRIOR TO THE TIME OF SALE. THIS TERM SHEET IS NOT AN OFFER TO SELL THESE SECURITIES AND IT IS NOT A SOLICITATION OF AN OFFER TO BUY THESE SECURITIES IN ANY JURISDICTION WHERE THE OFFER OR SALE IS NOT PERMITTED. | ||
| 52 | ||
|
Hospitality – Full Service 10100 International Drive Orlando, FL 32821
|
Collateral Asset Summary – Loan No. 4 DoubleTree by Hilton Hotel |
Cut-off Date Balance: Cut-off Date LTV: U/W NCF DSCR: U/W NOI Debt Yield: |
$60,000,000 59.4% 1.85x 17.1% |

| THE INFORMATION IN THIS STRUCTURAL AND COLLATERAL TERM SHEET IS NOT COMPLETE AND MAY BE AMENDED PRIOR TO THE TIME OF SALE. THIS TERM SHEET IS NOT AN OFFER TO SELL THESE SECURITIES AND IT IS NOT A SOLICITATION OF AN OFFER TO BUY THESE SECURITIES IN ANY JURISDICTION WHERE THE OFFER OR SALE IS NOT PERMITTED. | ||
| 53 | ||
|
Hospitality – Full Service 10100 International Drive Orlando, FL 32821
|
Collateral Asset Summary – Loan No. 4 DoubleTree by Hilton Hotel |
Cut-off Date Balance: Cut-off Date LTV: U/W NCF DSCR: U/W NOI Debt Yield: |
$60,000,000 59.4% 1.85x 17.1% |

| THE INFORMATION IN THIS STRUCTURAL AND COLLATERAL TERM SHEET IS NOT COMPLETE AND MAY BE AMENDED PRIOR TO THE TIME OF SALE. THIS TERM SHEET IS NOT AN OFFER TO SELL THESE SECURITIES AND IT IS NOT A SOLICITATION OF AN OFFER TO BUY THESE SECURITIES IN ANY JURISDICTION WHERE THE OFFER OR SALE IS NOT PERMITTED. | ||
| 54 | ||
|
Hospitality – Full Service 10100 International Drive Orlando, FL 32821
|
Collateral Asset Summary – Loan No. 4 DoubleTree by Hilton Hotel |
Cut-off Date Balance: Cut-off Date LTV: U/W NCF DSCR: U/W NOI Debt Yield: |
$60,000,000 59.4% 1.85x 17.1% |
| Mortgage Loan Information | Property Information | |||||||||||||
| Loan Sellers: | BMO, CREFI, GACC | Single Asset / Portfolio: | Single Asset | |||||||||||
| Loan Purpose: | Refinance | Property Type - Subtype: | Hospitality – Full Service | |||||||||||
| Borrower Sponsor(s): | BLT Real Estate JV5 LLC | Collateral: | Fee | |||||||||||
| Borrower(s): | AWH Orlando Property, LLC | Location: | Orlando, FL | |||||||||||
| Original Balance(1): | $60,000,000 | Year Built / Renovated: | 1981 / 2018, 2022 | |||||||||||
| Cut-off Date Balance(1): | $60,000,000 | Property Management: | Crescent Hotel Management Services, LLC | |||||||||||
| % by Initial UPB: | 6.8% | Size: | 1,042 Rooms | |||||||||||
| Interest Rate: | 7.75000% | Appraised Value / Per Room: | $143,000,000 / $137,236 | |||||||||||
| Note Date: | November 30, 2023 | Appraisal Date: | May 28, 2023 | |||||||||||
| Original Term: | 60 months | Occupancy: | 77.0% (as of October 31, 2023) | |||||||||||
| Amortization: | Interest Only | UW Economic Occupancy: | 77.0% | |||||||||||
| Original Amortization: | NAP | Underwritten NOI(4): | $14,563,103 | |||||||||||
| Interest Only Period: | 60 months | Underwritten NCF: | $12,382,219 | |||||||||||
| First Payment Date: | January 6, 2024 | |||||||||||||
| Maturity Date: | December 6, 2028 | Historical NOI | ||||||||||||
| Additional Debt Type(1): | Pari Passu | Most Recent NOI: | $14,396,570 (TTM October 31, 2023) | |||||||||||
| Additional Debt Balance(1): | $25,000,000 | 2022 NOI(4): | $11,990,892 | |||||||||||
| Call Protection(2): | L(25),DorYM1(28),O(7) | 2021 NOI: | $5,673,856 | |||||||||||
| Lockbox / Cash Management: | Hard / Springing | 2020 NOI(4): | ($1,685,368) | |||||||||||
| Reserves(3) | Financial Information(1) | |||||||||||||
| Initial | Monthly | Cap | ||||||||||||
| Taxes: | $207,641 | $103,820 | NAP | Cut-off Date Loan Per Room: | $81,574 | |||||||||
| Insurance: | $484,118 | Springing | NAP | Maturity Date Loan Per Room: | $81,574 | |||||||||
| Replacement Reserves: | $0 | 4% Gross Revenue | NAP | Cut-off Date LTV: | 59.4% | |||||||||
| Seasonality Reserve: | $81,403 | $81,403 | NAP | Maturity Date LTV: | 59.4% | |||||||||
| UW NOI DY: | 17.1% | |||||||||||||
| UW NCF DSCR: | 1.85x | |||||||||||||
| Sources and Uses | ||||||||||||||
| Sources | Proceeds | % of Total | Uses | Proceeds | % of Total | |||||||||
| Whole Loan | $85,000,000 | 99.4% | Loan Payoff | $83,645,446 | 97.8% | |||||||||
| Borrower Sponsor Equity | 554,430 | 0.6 | Closing Costs | 1,135,823 | 1.3 | |||||||||
| Upfront Reserves | 773,161 | 0.9 | ||||||||||||
| Total Sources | $85,554,430 | 100.0% | Total Uses | $85,554,430 | 100.0% | |||||||||
| (1) | The DoubleTree by Hilton Hotel Orlando at SeaWorld Mortgage Loan (as defined below) is part of the DoubleTree by Hilton Hotel Orlando at SeaWorld Whole Loan (as defined below) which is comprised of nine pari passu promissory notes with an aggregate original principal balance of $85,000,000. The DoubleTree by Hilton Hotel Orlando at SeaWorld Whole Loan was originated by Bank of Montreal (“BMO”). The Financial Information in the chart above is based on the aggregate outstanding principal balance of the DoubleTree by Hilton Hotel Orlando at SeaWorld Whole Loan. |
| (2) | The DoubleTree by Hilton Hotel Orlando at SeaWorld Whole Loan may be voluntarily prepaid in whole (but not in part) beginning after the payment date that is the earlier of three years from the note date and two years from the closing date of the last securitization of any portion of the DoubleTree by Hilton Hotel Orlando at SeaWorld Whole Loan, with the payment of a yield maintenance premium if such prepayment occurs prior to the payment date in June 2028. In addition, defeasance of the DoubleTree by Hilton Hotel Orlando at SeaWorld Whole Loan is permitted at any time after the earlier to occur of (a) the end of the two-year period commencing on the closing date of the securitization of the last promissory note representing a portion of the DoubleTree by Hilton Hotel Orlando at SeaWorld Whole Loan to be securitized and (b) November 30, 2026. The assumed lockout period of 25 payments is based on the anticipated closing date of the Benchmark 2024-V5 securitization trust in January 2024. The actual lockout period may be longer. |
| (3) | See “Initial and Ongoing Reserves” below. |
| (4) | The increase from 2020 NOI to 2022 NOI is primarily attributable to the effect of the novel coronavirus on the hospitality industry in 2020, and the subsequent recovery in 2021 and 2022. |
| THE INFORMATION IN THIS STRUCTURAL AND COLLATERAL TERM SHEET IS NOT COMPLETE AND MAY BE AMENDED PRIOR TO THE TIME OF SALE. THIS TERM SHEET IS NOT AN OFFER TO SELL THESE SECURITIES AND IT IS NOT A SOLICITATION OF AN OFFER TO BUY THESE SECURITIES IN ANY JURISDICTION WHERE THE OFFER OR SALE IS NOT PERMITTED. | ||
| 55 | ||
|
Hospitality – Full Service 10100 International Drive Orlando, FL 32821
|
Collateral Asset Summary – Loan No. 4 DoubleTree by Hilton Hotel |
Cut-off Date Balance: Cut-off Date LTV: U/W NCF DSCR: U/W NOI Debt Yield: |
$60,000,000 59.4% 1.85x 17.1% |
The Loan. The fourth largest mortgage loan (the “DoubleTree by Hilton Hotel Orlando at SeaWorld Mortgage Loan”) is part of a whole loan (the “DoubleTree by Hilton Hotel Orlando at SeaWorld Whole Loan”) secured by the borrower’s fee interest in a 1,042 room hotel located in Orlando, Florida (the “DoubleTree by Hilton Hotel Orlando at SeaWorld Property”). The DoubleTree by Hilton Hotel Orlando at SeaWorld Whole Loan is comprised of nine pari passu notes, with an aggregate outstanding principal balance as of the Cut-off Date of $85,000,000. The DoubleTree by Hilton Hotel Orlando at SeaWorld Whole Loan was originated on November 30, 2023 by BMO and accrues interest at a fixed rate of 7.75000% per annum. BMO transferred certain portions of the DoubleTree by Hilton Hotel Orlando at SeaWorld Whole Loan to Citi Real Estate Funding Inc. and Deutsche Bank AG, New York Branch on January 2, 2024 and December 13, 2023, respectively. The DoubleTree by Hilton Hotel Orlando at SeaWorld Whole Loan has an initial term of five-years and is interest-only for the full term. The scheduled maturity date of the DoubleTree by Hilton Hotel Orlando at SeaWorld Whole Loan is the payment date that occurs on December 6, 2028. The DoubleTree by Hilton Hotel Orlando at SeaWorld Mortgage Loan is evidenced by the controlling Note A-1 and the non-controlling Note A-2 and Note A-3, with an aggregate outstanding principal balance as of the Cut-off Date of $60,000,000. BMO is selling Note A-1 in the outstanding principal balance of $30,000,000 as of the Cut-off Date, GACC is selling Note A-2 in the outstanding principal balance of $15,000,000 as of the Cut-off Date and CREFI is selling Note A-3 in the outstanding principal amount of $15,000,000 as of the Cut-off Date.
The table below summarizes the promissory notes that comprise the DoubleTree by Hilton Hotel Orlando at SeaWorld Whole Loan. The relationship among the holders of the DoubleTree by Hilton Hotel Orlando at SeaWorld Whole Loan will be governed by a co-lender agreement as described under “Description of the Mortgage Pool—The Whole Loans—The Serviced Pari Passu Whole Loans” in the Preliminary Prospectus.
| Whole Loan Summary | ||||
| Note | Original Balance | Cut-off Date Balance | Note Holder | Controlling Piece |
| A-1 | $30,000,000 | $30,000,000 | Benchmark 2024-V5 | Yes |
| A-2 | 15,000,000 | 15,000,000 | Benchmark 2024-V5 | No |
| A-3 | 15,000,000 | 15,000,000 | Benchmark 2024-V5 | No |
| A-4(1) | 10,000,000 | 10,000,000 | BMO | No |
| A-5(1) | 5,000,000 | 5,000,000 | DBNY | No |
| A-6(1) | 5,000,000 | 5,000,000 | CREFI | No |
| A-7(1) | 2,500,000 | 2,500,000 | BMO | No |
| A-8(1) | 1,250,000 | 1,250,000 | DBNY | No |
| A-9(1) | 1,250,000 | 1,250,000 | CREFI | No |
| Whole Loan | $85,000,000 | $85,000,000 | ||
| (1) | Expected to be contributed to one or more future securitizations. |
The Property. The DoubleTree by Hilton Hotel Orlando at SeaWorld Property is a 1,042 full service hotel on an approximately 28.6-acre parcel located at 10100 International Drive in Orlando, Florida. The DoubleTree by Hilton Hotel Orlando at SeaWorld Property has 24 interconnected structures consisting of multiple two- and three-story villa-style buildings, a 16-story tower, a two-story lobby building and a two-story conference center. The improvements were constructed in 1981 and renovated in 2018 and 2022.
The DoubleTree by Hilton Hotel Orlando at SeaWorld Property contains 270 king guestrooms and 772 double queen guestrooms. Amenities at the DoubleTree by Hilton Hotel Orlando at SeaWorld Property includes approximately 85,270 square feet of meeting space, two restaurants, a poolside bar and a lobby lounge. In addition, the DoubleTree by Hilton Hotel Orlando at SeaWorld Property includes 851 surface parking spaces resulting in a ratio of approximately 0.82 parking spaces per room.
The franchise agreement between the borrower and Hilton Franchise Holding LLC (“Hilton”), commenced on May 19, 2015 and expires on May 31, 2030. Among other things, the franchise agreement requires the borrower to pay Hilton, on a monthly basis, a royalty fee of 5.0% of gross room revenue and a monthly program fee of 4.0% of gross room revenue.
The following table presents certain information relating to the demand analysis with respect to the DoubleTree by Hilton Hotel Orlando at SeaWorld Property based on market segmentation, as provided by the appraisal:
| Demand Segmentation(1) | ||||
| Property | Rooms | Leisure | Meeting and Group | Commercial |
| DoubleTree by Hilton Hotel Orlando at SeaWorld | 1,042 | 73% | 27% | 0% |
| (1) | Source: Appraisal. |
| THE INFORMATION IN THIS STRUCTURAL AND COLLATERAL TERM SHEET IS NOT COMPLETE AND MAY BE AMENDED PRIOR TO THE TIME OF SALE. THIS TERM SHEET IS NOT AN OFFER TO SELL THESE SECURITIES AND IT IS NOT A SOLICITATION OF AN OFFER TO BUY THESE SECURITIES IN ANY JURISDICTION WHERE THE OFFER OR SALE IS NOT PERMITTED. | ||
| 56 | ||
|
Hospitality – Full Service 10100 International Drive Orlando, FL 32821
|
Collateral Asset Summary – Loan No. 4 DoubleTree by Hilton Hotel |
Cut-off Date Balance: Cut-off Date LTV: U/W NCF DSCR: U/W NOI Debt Yield: |
$60,000,000 59.4% 1.85x 17.1% |
The following tables present certain information relating to the current and historical occupancy, ADR and RevPAR at the DoubleTree by Hilton Hotel Orlando at SeaWorld Property and its competitors:
| Historical Occupancy, ADR, RevPAR(1)(2) | |||||||||
| Competitive Set | DoubleTree by Hilton Hotel Orlando at SeaWorld | Penetration Factor | |||||||
| Year | Occupancy | ADR | RevPAR | Occupancy | ADR | RevPAR | Occupancy | ADR | RevPAR |
| 2021(3) | 56.4% | $92.27 | $52.04 | 63.6% | $82.30 | $52.32 | 112.7% | 89.2% | 100.5% |
| 2022(3) | 73.2% | $118.74 | $86.92 | 79.6% | $116.31 | $92.57 | 108.7% | 98.0% | 106.5% |
| 2023(4) | 73.8% | $120.67 | $89.01 | 77.0% | $132.13 | $101.70 | 104.3% | 109.5% | 114.3% |
| (1) | Occupancy, ADR and RevPAR for the Competitive Set and the DoubleTree by Hilton Hotel Orlando at SeaWorld Property are based on data provided by a third-party hospitality research report. The Competitive Set includes DoubleTree by Hilton at the Entrance To Universal, Wyndham Orlando Resort International Drive, Wyndham Lake Buena Vista Disney Springs Resort Area, The Florida Hotel & Conference Center, Hotel Kinetic Orlando Universal Blvd. and Wyndham Garden Lake Buena Vista Disney Springs Area. |
| (2) | Variances among the underwriting, the appraisal and the above table with respect to Occupancy, ADR and RevPAR at the DoubleTree by Hilton Hotel Orlando at SeaWorld Property are attributable to variances in reporting methodologies and/or timing differences. |
| (3) | Based on the trailing twelve-month data as of December 31st for each respective year. |
| (4) | Based on the trailing twelve-month data as of October 31, 2023. |
Appraisal. According to the appraisal, the DoubleTree by Hilton Hotel Orlando at SeaWorld Property had an “as-is” appraised value of $143,000,000 as of May 28, 2023. The table below shows the appraiser’s “as-is” conclusions. Based on the “as-is” value of $143,000,000, the Cut-off Date LTV and Maturity Date LTV are 59.4%.
| DoubleTree by Hilton Hotel Orlando at SeaWorld(1) | ||
| Property | Value | Capitalization Rate |
| DoubleTree by Hilton Hotel Orlando at SeaWorld | $143,000,000 | 7.67% |
| (1) | Source: Appraisal. |
Environmental. According to the Phase I environmental assessment dated June 22, 2023, there was no evidence of any recognized environmental conditions at the DoubleTree by Hilton Hotel Orlando at SeaWorld Property.
| THE INFORMATION IN THIS STRUCTURAL AND COLLATERAL TERM SHEET IS NOT COMPLETE AND MAY BE AMENDED PRIOR TO THE TIME OF SALE. THIS TERM SHEET IS NOT AN OFFER TO SELL THESE SECURITIES AND IT IS NOT A SOLICITATION OF AN OFFER TO BUY THESE SECURITIES IN ANY JURISDICTION WHERE THE OFFER OR SALE IS NOT PERMITTED. | ||
| 57 | ||
|
Hospitality – Full Service 10100 International Drive Orlando, FL 32821
|
Collateral Asset Summary – Loan No. 4 DoubleTree by Hilton Hotel |
Cut-off Date Balance: Cut-off Date LTV: U/W NCF DSCR: U/W NOI Debt Yield: |
$60,000,000 59.4% 1.85x 17.1% |
The following table presents certain information relating to the historical operating performance and Underwritten Net Cash Flow at the DoubleTree by Hilton Hotel Orlando at SeaWorld Property:
| Cash Flow Analysis(1) | ||||||||||
| 2018 | 2019 | 2020 | 2021 | 2022 | TTM(2) | Underwritten | Per Room(3) | %(4) | ||
| ADR | $109.82 | $114.16 | $97.70 | $88.69 | $119.71 | $132.13 | $132.13 | |||
| RevPAR | $83.51 | $85.68 | $27.63 | $62.37 | $95.16 | $101.70 | $101.70 | |||
| Room Revenue | $31,090,432 | $31,900,036 | $10,443,032 | $23,719,825 | $36,193,928 | $38,677,729 | $38,677,729 | $37,119 | 68.8 | % |
| Food & Beverage Revenue | 10,680,337 | 10,132,780 | 3,223,062 | 7,176,367 | 11,162,290 | 13,440,798 | 13,440,798 | 12,899 | 23.9 | |
| Other Departments Revenue | 628,939 | 456,422 | 448,851 | 1,954,779 | 1,325,665 | 1,392,675 | 1,392,675 | 1,337 | 2.5 | |
| Miscellaneous Income | 2,260,007 | 2,338,118 | 869,194 | 647,534 | 3,053,090 | 2,699,735 | 2,699,735 | 2,591 | 4.8 | |
| Total Revenue | $44,659,715 | $44,827,355 | $14,984,139 | $33,498,506 | $51,734,974 | $56,210,937 | $56,210,937 | $53,945 | 100.0 | % |
| Room Expense | $10,293,421 | $10,289,532 | $4,089,644 | $9,671,955 | $12,814,127 | $13,106,369 | $13,106,369 | $12,578 | 33.9 | % |
| Food & Beverage Expense | 7,604,052 | 7,880,223 | 2,759,528 | 5,584,969 | 8,996,654 | 9,917,629 | 9,917,629 | 9,518 | 73.8 | |
| Other Departmental Expenses | 564,315 | 550,981 | 168,977 | 94,841 | 19,265 | 67,825 | 67,825 | 65 | 4.9 | |
| Departmental Expenses | $18,461,789 | $18,720,735 | $7,018,149 | $15,351,765 | $21,830,046 | $23,091,823 | $23,091,823 | $22,161 | 41.1 | % |
| Gross Operating Income | $26,197,926 | $26,106,620 | $7,965,989 | $18,146,741 | $29,904,927 | $33,119,114 | $33,119,114 | $31,784 | 58.9 | % |
| General & Administrative | $4,250,517 | $4,411,457 | $2,314,139 | $3,155,970 | $4,251,060 | $4,049,497 | $4,049,497 | $3,886 | 7.2 | % |
| Marketing | 3,719,973 | 3,237,541 | 1,810,358 | 2,246,066 | 3,268,227 | 3,585,608 | 3,585,608 | 3,441 | 6.4 | |
| Franchise Fee | 2,737,852 | 2,885,136 | 939,873 | 2,139,362 | 3,473,121 | 3,678,687 | 3,480,996 | 3,341 | 6.2 | |
| Management Fee | 928,014 | 672,422 | 403,015 | 517,869 | 796,005 | 898,305 | 843,164 | 809 | 1.5 | |
| Property Operations & Maintenance | 2,038,241 | 2,008,040 | 1,152,997 | 1,785,745 | 3,053,515 | 3,006,983 | 3,006,983 | 2,886 | 5.3 | |
| Utilities | 1,343,658 | 1,314,563 | 962,881 | 1,193,782 | 1,369,000 | 1,622,840 | 1,622,840 | 1,557 | 2.9 | |
| Total Undistributed Expenses | $15,018,255 | $14,529,159 | $7,583,264 | $11,038,793 | $16,210,928 | $16,841,921 | $16,589,088 | $15,920 | 29.5 | % |
| Effective Gross Income | $11,179,671 | $11,577,461 | $382,726 | $7,107,948 | $13,694,000 | $16,277,193 | $16,530,026 | $15,864 | 29.4 | % |
| Real Estate Taxes | $1,213,189 | $1,150,197 | $1,241,269 | $1,005,542 | $1,157,258 | $1,234,678 | $1,268,076 | $1,217 | 2.3 | % |
| Property Insurance | 627,727 | 654,515 | 809,278 | 409,921 | 523,528 | 638,695 | 691,597 | 664 | 1.2 | |
| Other | 3,729 | 24,805 | 17,548 | 18,628 | 22,322 | 7,250 | 7,250 | 7 | 0.0 | |
| Net Operating Income(5) | $9,335,027 | $9,747,945 | ($1,685,368) | $5,673,856 | $11,990,892 | $14,396,570 | $14,563,102 | $13,976 | 25.9 | % |
| FF&E | 0 | 0 | 0 | 0 | 0 | 0 | 2,180,884 | 2,093 | 3.9 | |
| Net Cash Flow | $9,335,027 | $9,747,945 | ($1,685,368) | $5,673,856 | $11,990,892 | $14,396,570 | $12,382,219 | $11,883 | 22.0 | % |
| Occupancy | 76.0% | 75.1% | 28.3% | 70.3% | 79.5% | 77.0% | 77.0% | |||
| NCF DSCR(6) | 1.40x | 1.46x | (0.25x) | 0.85x | 1.80x | 2.16x | 1.85x | |||
| NOI Debt Yield(6) | 11.0% | 11.5% | (2.0%) | 6.7% | 14.1% | 16.9% | 17.1% | |||
| (1) | Based on financials provided by the borrower. |
| (2) | TTM represents the trailing 12-month period ending October 31, 2023. |
| (3) | Per Room values are based on 1,042 rooms. |
| (4) | % column represents percent of Total Revenue except for Room Expense, Food & Beverage Expense and Other Departmental Expenses which are based on their corresponding revenue line items. |
| (5) | The decrease in NOI from 2019 to 2020 and the increase in NOI from 2020 to 2021 and from 2021 to 2022 was primarily due to the effect of the novel coronavirus on the hospitality industry in 2020, and the subsequent recovery in 2021 and 2022. |
| (6) | Calculated based on the DoubleTree by Hilton Hotel Orlando at SeaWorld Whole Loan. |
The Market. The DoubleTree by Hilton Hotel Orlando at SeaWorld Property is located in Orlando, Florida within the Orlando-Kissimmee-Sanford metropolitan statistical area (“Orlando MSA”) and the Orlando, Florida lodging market. The Orlando, Florida lodging market comprises approximately 166,380 hotel rooms located primarily in Orange County. The primary municipal feeder market is Orlando, which has a population of approximately 1.7 million with an income per capita of $45,000 as of January 2023. The DoubleTree by Hilton Hotel Orlando at SeaWorld Property is located southwest quadrant of the Westwood Boulevard and International Drive intersection with frontage along both streets. The DoubleTree by Hilton Hotel Orlando at SeaWorld Property is located 0.5 miles north of the entrance to Sea World, 0.7 miles north of Discovery Cove Orlando and 0.6 miles south/southeast of the Orange County Convention Center. The nearby Orlando International Airport is one of the fastest growing major metropolitan airports in the nation in terms of passenger traffic and is ranked as the seventh busiest airport in the world as of 2021.
| THE INFORMATION IN THIS STRUCTURAL AND COLLATERAL TERM SHEET IS NOT COMPLETE AND MAY BE AMENDED PRIOR TO THE TIME OF SALE. THIS TERM SHEET IS NOT AN OFFER TO SELL THESE SECURITIES AND IT IS NOT A SOLICITATION OF AN OFFER TO BUY THESE SECURITIES IN ANY JURISDICTION WHERE THE OFFER OR SALE IS NOT PERMITTED. | ||
| 58 | ||
|
Hospitality – Full Service 10100 International Drive Orlando, FL 32821
|
Collateral Asset Summary – Loan No. 4 DoubleTree by Hilton Hotel |
Cut-off Date Balance: Cut-off Date LTV: U/W NCF DSCR: U/W NOI Debt Yield: |
$60,000,000 59.4% 1.85x 17.1% |
The following table presents certain information relating to the primary competition for the DoubleTree by Hilton Hotel Orlando at SeaWorld Property:
| Competitive Set(1)(2) | |||||
| Property | Number of Rooms | Year Built | 2022 Occupancy | 2022 ADR | 2022 RevPAR |
| DoubleTree by Hilton Hotel Orlando at SeaWorld(3) | 1,042 | 1981 | 77.0% | $132.13 | $101.70 |
| DoubleTree by Hilton at The Entrance To Universal | 742 | 1972 | 70.0% - 75.0% | $125.00 - $130.00 | $90.00 - $95.00 |
| Wyndham Orlando Resort International Drive | 613 | 1978 | 75.0% - 80.0% | $125.00 - $130.00 | $95.00 - $100.00 |
| Wyndham Disney Springs Resort Area | 232 | 1972 | 75.0% - 80.0% | $120.00 - $125.00 | $90.00 - $95.00 |
| The Florida Hotel & Conference Center | 511 | 1986 | 75.0% - 80.0% | $110.00 - $115.00 | $80.00 - $85.00 |
| Hotel Kinetic Orlando Universal | 400 | 2002 | 80.0% - 85.0% | $110.00 - $115.00 | $85.00 - $90.00 |
| Wyndham Garden Disney Springs Area | 394 | 2015 | 70.0% - 75.0% | $115.00 - $120.00 | $85.00 - $90.00 |
| Total Avg. Competitive Set | 76.0% | $120.00 | $91.00 | ||
| (1) | Source: Appraisal. |
| (2) | It has been announced that three new hotels, which are approximately 3 miles from the DoubleTree by Hilton Hotel Orlando at SeaWorld Property and have 750 rooms, 750 rooms and 500 rooms, respectively, are being developed by Universal Orlando Resort and are expected to open in 2025. |
| (3) | 2022 Occupancy, ADR and RevPAR for the DoubleTree by Hilton Hotel Orlando at SeaWorld Property are based on the underwriting for the trailing twelve-month period ending October 31, 2023. |
The Borrower and the Borrower Sponsor. The borrower is AWH Orlando Property, LLC, a Delaware limited liability company and single purpose entity having at least two independent directors in its organizational structure. Legal counsel to the borrower delivered a non-consolidation opinion in connection with the origination of the DoubleTree by Hilton Hotel Orlando at SeaWorld Whole Loan. The borrower sponsor and non-recourse carveout guarantor is BLT Real Estate JV5 LLC (“BLT”). BLT is a Stamford, CT based vertically integrated real estate firm that develops, owns, and manages residential, commercial, and mixed-use projects. BLT’s portfolio includes over 4,000 of class-A multifamily units (with an additional 2,000 in the development pipeline), approximately 6,000,000 square feet of office space and over 7,000 hotel keys across over 50 hotels.
Property Management. The DoubleTree by Hilton Hotel Orlando at SeaWorld Property is managed by Crescent Hotel Management Services, LLC, a third-party property management company with over 25,000 rooms, 100 properties, 1,000,000 square feet of meeting space and 120 restaurants, bars and outlets under management.
Initial and Ongoing Reserves. At origination of the DoubleTree by Hilton Hotel Orlando at SeaWorld Whole Loan, the borrower deposited (i) approximately $207,641 into a reserve account for real estate taxes, (ii) $484,118 into a reserve account for insurance premiums and (iii) approximately $81,403 into a reserve account for a seasonality reserve.
Tax Reserve – The borrower is required to deposit into a real estate tax reserve, on a monthly basis, 1/12 of the taxes that the lender estimates will be payable over the next-ensuing 12-month period (initially estimated to be approximately $103,820).
Insurance Reserve – The borrower is required to deposit into an insurance reserve an amount equal to 1/12 of the amount which would be sufficient to pay the insurance premiums due for the renewal of the coverage afforded by the insurance policies upon the expiration thereof, however, such insurance reserve deposit has been conditionally waived so long as the borrower continues to maintain a blanket policy that satisfies the conditions set forth in the DoubleTree by Hilton Hotel Orlando at SeaWorld Whole Loan documents.
FF&E Reserve – On each monthly payment date, the borrower is required to deposit an amount equal to the greater of (i) 4% of gross income from operations for the calendar month two months prior to each payment date or (ii) that amount required pursuant to the hotel franchise agreement, into an FF&E reserve (initially estimated to be approximately $2,180,884).
Seasonality Reserve – On each monthly payment date other than payment dates occurring in August and September of each year, the borrower is required to deposit approximately $81,403 into a seasonality reserve. The borrower may request up to two times each calendar year during the term of the loan that the lender recalculate the Seasonality Shortfall Amount (as defined below) and, based on the results of that calculation, the lender will be required to increase or decrease such monthly deposit amount. The (“Seasonality Shortfall Amount”) means, as of any date of calculation, the product of (i) the amount, if any, by which the gross income from the operations of the DoubleTree by Hilton Hotel Orlando at SeaWorld Property with respect to the immediately preceding 12 month period was deficient for purposes of paying the debt service on the DoubleTree by Hilton Hotel Orlando at SeaWorld Whole Loan for such period, multiplied by (ii) 1.10.
| THE INFORMATION IN THIS STRUCTURAL AND COLLATERAL TERM SHEET IS NOT COMPLETE AND MAY BE AMENDED PRIOR TO THE TIME OF SALE. THIS TERM SHEET IS NOT AN OFFER TO SELL THESE SECURITIES AND IT IS NOT A SOLICITATION OF AN OFFER TO BUY THESE SECURITIES IN ANY JURISDICTION WHERE THE OFFER OR SALE IS NOT PERMITTED. | ||
| 59 | ||
|
Hospitality – Full Service 10100 International Drive Orlando, FL 32821
|
Collateral Asset Summary – Loan No. 4 DoubleTree by Hilton Hotel |
Cut-off Date Balance: Cut-off Date LTV: U/W NCF DSCR: U/W NOI Debt Yield: |
$60,000,000 59.4% 1.85x 17.1% |
Lockbox / Cash Management. The DoubleTree by Hilton Hotel Orlando at SeaWorld Whole Loan is structured with a hard lockbox and springing cash management. The borrower is required to deliver credit card direction letters to each of the credit card companies with which borrower has entered into a merchant’s or other credit card agreement directing them to pay to the lender-controlled lockbox account all payments which would otherwise be paid to borrower under the applicable credit card processing agreement. The borrower is permitted to collect cash income and deposit it into an operating account. The borrower is required to (or cause the property manager to) deposit all revenue generated by the DoubleTree by Hilton Hotel Orlando at SeaWorld Property into the lender-controlled lockbox account within two business days of receipt. All funds deposited into the lockbox are required to be transferred on each business day to or at the direction of the borrower unless a Trigger Period (as defined below) exists. Upon the occurrence and during the continuance of a Trigger Period, all funds in the lockbox account are required to be swept on each business day to a cash management account under the control of the lender to be applied and disbursed in accordance with the DoubleTree by Hilton Hotel Orlando at SeaWorld Whole Loan documents, and all excess cash flow funds remaining in the cash management account after the application of such funds in accordance with the DoubleTree by Hilton Hotel Orlando at SeaWorld Whole Loan documents may be held by the lender in an excess cash flow reserve account as additional collateral for the DoubleTree by Hilton Hotel Orlando at SeaWorld Whole Loan; provided however, such excess cash flow funds will go to a PIP reserve account if the Trigger Period is caused solely by a PIP Trigger.
A “Trigger Period” means a period (A) commencing upon the earliest of (i) the occurrence of an event of default, (ii) the occurrence of a Debt Yield Trigger Event (as defined below), (iii) the occurrence of a PIP Trigger (as defined below) and (iv) the occurrence of a Franchise Extension Trigger (as defined below); and (B) expiring upon (w) with regard to any Trigger Period commenced in connection with clause (i) above, the cure (if applicable) of such event of default, (x) with regard to any Trigger Period commenced in connection with clause (ii) above, a cure of the Debt Yield Trigger Event, (y) with regard to any Trigger Period commenced in connection with clause (iii) above, the amount on deposit in the PIP reserve account equals 110% of the PIP costs and (z) with regard to any Trigger Period commenced in connection with clause (iv) above, the occurrence of a Franchise Extension Trigger cure.
A “Debt Yield Trigger Event” means the debt yield is equal to or less than 10.5%, and is cured upon the debt yield being greater than 10.5% for one calendar quarter or the lender has received a debt yield cure deposit that would be sufficient to cause the calculation of the debt yield to be greater than 10.5%.
A “PIP Trigger” the date that is 90 days after borrower's receipt of notice that franchisor will require a property improvement plan (“PIP”) if, on or before such date, the borrower has not deposited 110% of the PIP costs into the PIP reserve account.
A “Franchise Extension Trigger” means the occurrence of either (i) the payment date occurring in December, 2027 if, as of such date, the debt yield is less than 14.75%, or (ii) the payment date occurring in May, 2028; provided, however, that a Franchise Extension Trigger cannot occur in connection with either clause (i) or clause (ii) above if, on or before the applicable date, the borrower has either (y) delivered evidence reasonably satisfactory to the lender that the term of the existing franchise agreement has been extended for a period of no less than 10 years on substantially the same terms and conditions as set forth in the existing franchise agreement acceptable to the lender, or otherwise on terms reasonably acceptable to the lender, or (z) entered into a replacement franchise agreement with a term of no less than 10 years, and such Franchise Extension Trigger will be cured upon the borrower having either (i) delivered evidence reasonably satisfactory to the lender that the term of the existing franchise agreement has been extended for a period of no less than 10 years on substantially the same terms and conditions as set forth in the existing franchise agreement, or otherwise on terms reasonably acceptable to the lender, or (ii) entered into a replacement franchise agreement acceptable to the lender with a term of no less than 10 years.
Current Mezzanine or Secured Subordinate Indebtedness. None.
Permitted Future Mezzanine or Secured Subordinate Indebtedness. None permitted.
Release of Collateral. Not permitted.
Ground Lease. None.
| THE INFORMATION IN THIS STRUCTURAL AND COLLATERAL TERM SHEET IS NOT COMPLETE AND MAY BE AMENDED PRIOR TO THE TIME OF SALE. THIS TERM SHEET IS NOT AN OFFER TO SELL THESE SECURITIES AND IT IS NOT A SOLICITATION OF AN OFFER TO BUY THESE SECURITIES IN ANY JURISDICTION WHERE THE OFFER OR SALE IS NOT PERMITTED. | ||
| 60 | ||
Multifamily- Various Various Various, NY
|
Collateral Asset Summary – Loan No. 5 Acquisition America Portfolio |
Cut-off Date Balance: Cut-off Date LTV: U/W NCF DSCR: U/W NOI Debt Yield: |
$60,000,000 64.4% 1.25x 8.9% |

| THE INFORMATION IN THIS STRUCTURAL AND COLLATERAL TERM SHEET IS NOT COMPLETE AND MAY BE AMENDED PRIOR TO THE TIME OF SALE. THIS TERM SHEET IS NOT AN OFFER TO SELL THESE SECURITIES AND IT IS NOT A SOLICITATION OF AN OFFER TO BUY THESE SECURITIES IN ANY JURISDICTION WHERE THE OFFER OR SALE IS NOT PERMITTED. | ||
| 61 | ||
Multifamily- Various Various Various, NY
|
Collateral Asset Summary – Loan No. 5 Acquisition America Portfolio |
Cut-off Date Balance: Cut-off Date LTV: U/W NCF DSCR: U/W NOI Debt Yield: |
$60,000,000 64.4% 1.25x 8.9% |
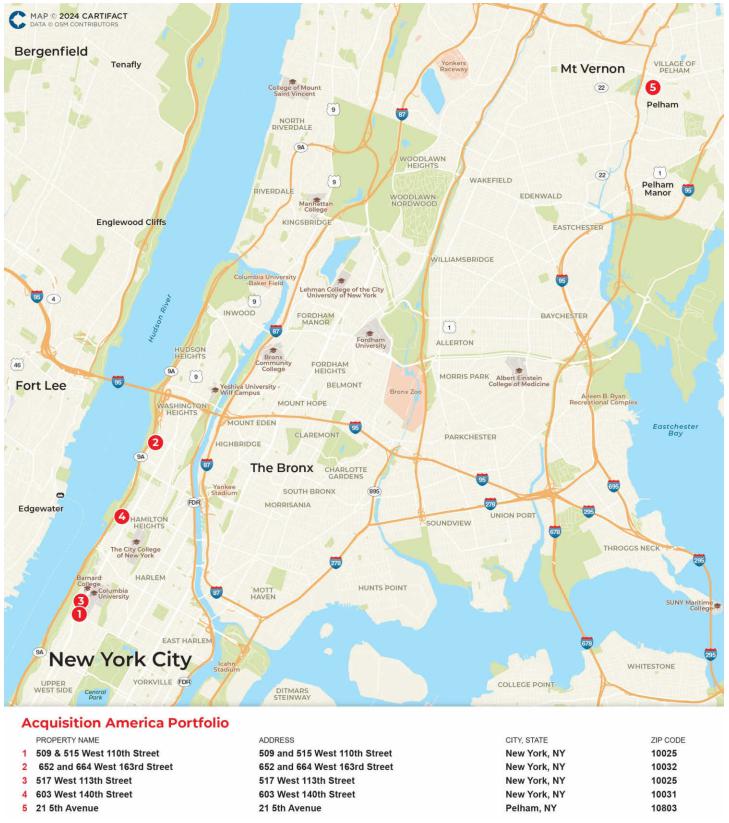
| THE INFORMATION IN THIS STRUCTURAL AND COLLATERAL TERM SHEET IS NOT COMPLETE AND MAY BE AMENDED PRIOR TO THE TIME OF SALE. THIS TERM SHEET IS NOT AN OFFER TO SELL THESE SECURITIES AND IT IS NOT A SOLICITATION OF AN OFFER TO BUY THESE SECURITIES IN ANY JURISDICTION WHERE THE OFFER OR SALE IS NOT PERMITTED. | ||
| 62 | ||
Multifamily- Various Various Various, NY
|
Collateral Asset Summary – Loan No. 5 Acquisition America Portfolio |
Cut-off Date Balance: Cut-off Date LTV: U/W NCF DSCR: U/W NOI Debt Yield: |
$60,000,000 64.4% 1.25x 8.9% |
| Mortgage Loan Information | |
| Loan Seller(s): | Barclays |
| Loan Purpose: | Refinance |
| Borrower Sponsor(s): | Fred Ohebshalom |
| Borrower(s)(1): | Various |
| Original Balance(2): | $60,000,000 |
| Cut-off Date Balance(2): | $60,000,000 |
| % by Initial UPB: | 6.8% |
| Interest Rate: | 6.91000% |
| Note Date: | January 4, 2024 |
| Original Term: | 60 months |
| Amortization: | Interest Only |
| Original Amortization: | NAP |
| Interest Only Period: | 60 months |
| First Payment Date: | February 6, 2024 |
| Maturity Date: | January 6, 2029 |
| Additional Debt Type(2): | Pari Passu |
| Additional Debt Balance(2): | $24,100,000 |
| Call Protection(3): | L(24),D(29),O(7) |
| Lockbox / Cash Management: | Springing / Springing |
| Reserves(4) | |||
| Initial | Monthly | Cap | |
| Taxes: | $0 | $283,486 | NAP |
| Insurance: | $38,703 | $38,703 | NAP |
| Replacement Reserve: | $0 | $9,063 | NAP |
| TI/LC: | $0 | $0 | NAP |
| Other(5): | $6,438,035 | $0 | NAP |
| Property Information | |
| Single Asset / Portfolio: | Portfolio |
| Property Type / Subtype: | Multifamily - Various |
| Collateral: | Fee |
| Location(6): | Various, NY |
| Year Built / Renovated(6): | Various / Various |
| Property Management: | Empire Management America Corp. |
| Size: | 435 Units |
| Appraised Value / Per Unit: | $130,600,000 / $300,230 |
| Appraisal Date: | November 16, 2023 |
| Occupancy: | 95.4% (as of December 13, 2023) |
| UW Economic Occupancy: | 92.4% |
| Underwritten NOI: | $7,467,461 |
| Underwritten NCF: | $7,358,711 |
| Historical NOI | |
| Most Recent NOI(7): | $7,179,562 (TTM October 31, 2023) |
| 2022 NOI(7): | $5,463,639 |
| 2021 NOI(7): | $4,094,413 |
| 2020 NOI: | $4,565,862 |
| Financial Information(2) | |
| Cut-off Date Loan Per Unit: | $193,333 |
| Maturity Date Loan Per Unit: | $193,333 |
| Cut-off Date LTV: | 64.4% |
| Maturity Date LTV: | 64.4% |
| UW NOI DY: | 8.9% |
| UW NCF DSCR: | 1.25x |
| Sources and Uses | |||||||
| Sources | Proceeds | % of Total | Uses | Proceeds | % of Total | ||
| Whole Loan | $84,100,000 | 100.0% | Loan Payoff | $64,662,370 | 76.9 | % | |
| Return of Equity | 6,919,414 | 8.2 | |||||
| Upfront Reserves | 6,476,738 | 7.7 | |||||
| Closing Costs(8) | 6,041,478 | 7.2 | |||||
| Total Sources | $84,100,000 | 100.0% | Total Uses | $84,100,000 | 100.0 | % | |
| (1) | The borrowers for the Acquisition America Portfolio Whole Loan (as defined below) are Acquisition America VI, LLC, Acquisition America VII, LLC, Acquisition America VIII, LLC, Acquisition America IX, LLC, Acquisition America X, LLC, Acquisition America XI, LLC and Acquisition America XII, LLC. |
| (2) | The Acquisition America Portfolio Mortgage Loan (as defined below) is part of the Acquisition America Portfolio Whole Loan, which is comprised of two pari passu promissory notes with an aggregate original principal balance and Cut-off Date Balance of $84,100,000. The Acquisition America Portfolio Whole Loan was originated by Barclays Capital Real Estate Inc. (“Barclays”). The Financial Information in the chart above is based on the aggregate outstanding principal balance as of the Cut-off Date of the Acquisition America Portfolio Whole Loan. |
| (3) | The lockout period will be at least 24 payment dates beginning with and including the first payment date on February 6, 2024. Defeasance of the Acquisition America Portfolio Whole Loan in full (but not in part) is permitted at any time following the earlier to occur of (i) January 4, 2027 or (ii) the date that is two years from the closing date of the securitization that includes the last pari passu note to be securitized. The assumed lockout period of 24 payments is based on the expected Benchmark 2024-V5 securitization closing date in January 2024. The actual lockout period may be longer. |
| (4) | See “Initial and Ongoing Reserves” below. |
| (5) | Other initial reserves include a violations reserve of approximately $6,357,572 for remediation of certain violations that existed at certain of the Acquisition America Portfolio Properties (as defined below) as of the origination date and an immediate repairs reserve of approximately $80,463. |
| (6) | See the “Portfolio Summary” chart below. |
| (7) | The increase in net operating income from 2021 NOI to 2022 NOI to Most Recent NOI is due to the units that the borrower sponsor had been gut renovating progressively becoming available for rent. |
| (8) | Closing Costs include an interest rate buydown of $2,523,000. |
The Loan. The
fifth largest mortgage loan (the “Acquisition America Portfolio Mortgage Loan”) is part of a whole loan (the “Acquisition
America Portfolio Whole Loan”) secured by the borrowers’ fee interests in four mid rise multifamily properties and one
high rise multifamily property totaling 435 units located in New York, New York and Pelham, New York (the “Acquisition America
Portfolio Properties”). The Acquisition America Portfolio Whole Loan is comprised of two pari passu notes, with an aggregate
outstanding principal balance as of the Cut-off Date of $84,100,000. The Acquisition America Portfolio Whole Loan was originated on January
4, 2024 by Barclays and accrues interest at a fixed rate of 6.91000% per annum. The Acquisition America Portfolio Whole Loan has
an initial term of five-years and is interest-only for the full term. The scheduled maturity date of the Acquisition America Portfolio
Whole Loan is the payment date that occurs on January 6, 2029. The Acquisition America Portfolio Mortgage Loan is evidenced by the controlling
Note A-1 with an outstanding principal balance as of the Cut-off Date of $60,000,000.
| THE INFORMATION IN THIS STRUCTURAL AND COLLATERAL TERM SHEET IS NOT COMPLETE AND MAY BE AMENDED PRIOR TO THE TIME OF SALE. THIS TERM SHEET IS NOT AN OFFER TO SELL THESE SECURITIES AND IT IS NOT A SOLICITATION OF AN OFFER TO BUY THESE SECURITIES IN ANY JURISDICTION WHERE THE OFFER OR SALE IS NOT PERMITTED. | ||
| 63 | ||
Multifamily- Various Various Various, NY
|
Collateral Asset Summary – Loan No. 5 Acquisition America Portfolio |
Cut-off Date Balance: Cut-off Date LTV: U/W NCF DSCR: U/W NOI Debt Yield: |
$60,000,000 64.4% 1.25x 8.9% |
The table below summarizes the promissory notes that comprise the Acquisition America Portfolio Whole Loan. The relationship between the holders of the Acquisition America Portfolio Whole Loan will be governed by a co-lender agreement as described under “Description of the Mortgage Pool— The Whole Loans—The Serviced Pari Passu Whole Loans” in the Preliminary Prospectus.
| Whole Loan Summary | ||||
| Note | Original Balance | Cut-off Date Balance | Note Holder | Controlling Piece |
| A-1 | $60,000,000 | $60,000,000 | Benchmark 2024-V5 | Yes |
| A-2 | 24,100,000 | 24,100,000 | Barclays or an affiliate | No |
| Whole Loan | $84,100,000 | $84,100,000 | ||
The Properties. The Acquisition America Portfolio Properties are comprised of a four mid rise multifamily properties and one high-rise multifamily property located in New York, New York and Pelham, New York that were 95.4% occupied as of December 13, 2023.
The following table presents certain information relating to the Acquisition America Portfolio Properties:
| Portfolio Summary | ||||||||||
| Property Name | City, State | Year Built / Renovated | Units(1) | Occupancy(1) | Allocated Whole Loan Cut-off Date Balance | % of Allocated Whole Loan Cut-off Date Balance | Appraised Value(2) | U/W NOI | % of U/W NOI | |
| 509 & 515 West 110th Street | New York, NY | 1909 / 1988, 2019-2023 | 176 | 97.7% | $41,380,000 | 49.2% | $63,500,000 | $3,664,408 | 49.1 | % |
| 517 West 113th Street | New York, NY | 1919 / 1987, 2019-2023 | 45 | 95.6% | 14,220,000 | 16.9% | 21,600,000 | 1,255,892 | 16.8 | % |
| 652 and 664 West 163rd Street | New York, NY | 1923 / 1987, 2019-2023 | 106 | 91.5% | 13,120,000 | 15.6% | 22,000,000 | 1,174,689 | 15.7 | % |
| 21 5th Avenue | Pelham, NY | 1922 / 2019-2023 | 53 | 94.3% | 8,490,000 | 10.1% | 12,100,000 | 755,725 | 10.1 | % |
| 603 West 140th Street | New York, NY | 1910 / 1987, 2019-2023 | 55 | 96.4% | 6,890,000 | 8.2% | 11,400,000 | 616,747 | 8.3 | % |
| Total / Wtd. Avg. | 435 | 95.4% | $84,100,000 | 100.0% | $130,600,000 | $7,467,461 | 100.0 | % | ||
| (1) | Based on the underwritten rent rolls dated December 13, 2023. |
| (2) | Source: Appraisals. |
The following table presents certain information relating to historical occupancy for the Acquisition Americas Portfolio Properties:
| Historical Occupancy(1) | |||
| 2020(2) | 2021(2) | 2022(2) | TTM(3) |
| 87.3% | 85.4% | 94.4% | 95.4% |
| (1) | Historical Occupancy represents average occupancy for the respective year. |
| (2) | Historical Occupancy improved as the COVID-19 pandemic subsided. The 509 & 515 West 110th Street Property (as defined below) and the 517 West 113th Street Property (as defined below) were the most impacted by the COVID-19 pandemic, driven by students vacating certain units. Such vacancies partially allowed the borrower sponsor to gut renovate 30 aggregate units across these two properties. |
| (3) | Based on the underwritten rent roll dated December 13, 2023, representing the weighted average occupancy of the Acquisition America Portfolio Properties. |
509 & 515 West 110th Street. 509 & 515 West 110th Street (the “509 & 515 West 110th Street Property”) is a high rise multifamily property comprised of two adjacent 12-story buildings with an aggregate of 176 units located in the Morningside Heights section of New York, New York. Of the 176 units, 48 units are rent controlled or rent stabilized (27.3% of units), accounting for 17.4% of the gross potential rent. According to the borrower sponsor, approximately $1.9 million has been invested in capital expenditures over the past four years, including a gut renovation of 27 units, electric upgrades and work in the basement, lobby and façade. The unit renovations in 2022 resulted in an average increase in post-renovation 2023 rent of approximately $1,248 per renovated unit. Amenities at the 509 & 515 West 110th Street Property include an elevator, laundry room, bike storage and close proximity to New York City subway lines and other public transportation. Columbia University and Barnard College are both also located in Morningside Heights, with student populations of approximately 32,429 students and 2,573 students, respectively.
| THE INFORMATION IN THIS STRUCTURAL AND COLLATERAL TERM SHEET IS NOT COMPLETE AND MAY BE AMENDED PRIOR TO THE TIME OF SALE. THIS TERM SHEET IS NOT AN OFFER TO SELL THESE SECURITIES AND IT IS NOT A SOLICITATION OF AN OFFER TO BUY THESE SECURITIES IN ANY JURISDICTION WHERE THE OFFER OR SALE IS NOT PERMITTED. | ||
| 64 | ||
Multifamily- Various Various Various, NY
|
Collateral Asset Summary – Loan No. 5 Acquisition America Portfolio |
Cut-off Date Balance: Cut-off Date LTV: U/W NCF DSCR: U/W NOI Debt Yield: |
$60,000,000 64.4% 1.25x 8.9% |
The following table presents certain information relating to the unit mix at the 509 & 515 West 110th Street Property:
| Unit Mix(1) | ||||||
| Unit Type | # of Units(2) | % of Total Units | Occupancy(3) | Average Unit Size (SF)(4) | Average Monthly Rent Per Unit | |
| Studio | 21 | 11.9 | % | 100.0% | 500 | $2,404 |
| 1BR/1BA | 71 | 40.3 | % | 98.6% | 750 | $2,903 |
| 2BR/1BA | 77 | 43.8 | % | 96.1% | 950 | $3,846 |
| 3BR/2BA | 6 | 3.4 | % | 100.0% | 1,100 | $4,708 |
| 4BR/2BA | 1 | 0.6 | % | 100.0% | 1,200 | $5,500 |
| Total / Wtd. Avg. | 176 | 100.0 | % | 97.7% | 822 | $3,326 |
| (1) | Based on the underwritten rent roll dated December 13, 2023. |
| (2) | Of the total 176 units, 48 units are rent controlled or rent stabilized. |
| (3) | The 509 & 515 West 110th Street Property contains two management units that were underwritten as vacant. |
| (4) | Based on the appraisal estimates since figures were not provided by the borrower sponsor. |
517 West 113th Street. 517 West 113th Street (the “517 West 113th Street Property”) is a mid rise multifamily property comprised of an eight-story building plus a basement with 45 units located in the Morningside Heights section of New York, New York. Of the 45 units, 13 units are rent controlled or rent stabilized (28.9% of units), accounting for 18.2% of the gross potential rent. According to the borrower sponsor, approximately $840,000 has been invested in capital expenditures over the past four years, including a gut renovation of three units and elevator upgrades. The unit renovations in 2022 resulted in an average increase in post-renovation 2023 rent of $2,714 per renovated unit. Amenities at the 517 West 113th Street Property include an elevator, laundry room and close proximity to New York City subway lines and other public transportation. Columbia University and Barnard College are both also located in Morningside Heights, with student populations of approximately 32,429 students and 2,573 students, respectively.
The following table presents certain information relating to the unit mix at the 517 West 113th Street Property:
| Unit Mix(1) | |||||
| Unit Type | # of Units(2) | % of Total Units | Occupancy | Average Unit Size (SF)(3) | Average Monthly Rent Per Unit |
| Studio | 5 | 11.1% | 100.0% | 550 | $2,179 |
| 1BR/1BA | 9 | 20.0% | 100.0% | 750 | $3,061 |
| 2BR/1BA | 16 | 35.6% | 93.8% | 950 | $4,264 |
| 3BR/2BA | 14 | 31.1% | 92.9% | 1,100 | $4,907 |
| 5BR | 1 | 2.2% | 100.0% | NAV | $7,000 |
| Total / Wtd. Avg. | 45 | 100.0% | 95.6% | 911 | $4,028 |
| (1) | Based on the underwritten rent roll dated December 13, 2023. |
| (2) | Of 45 total units, 13 are rent controlled or rent stabilized. |
| (3) | Based on the appraisal estimates since figures were not provided by the borrower sponsor and the total/wtd.avg. Average Unit Size (SF) does not include the 5BR unit. |
652 and 664 West 163rd Street. 652 and 664 West 163rd Street (the “652 and 664 West 163rd Street Property”) is a mid rise multifamily property comprised of two adjacent 6-story buildings with an aggregate of 106 units located in the Washington Heights section of New York, New York. Of the 106 units, 35 units are rent controlled or rent stabilized (33.0% of units), accounting for 22.0% of the gross potential rent. According to the borrower sponsor, approximately $588,000 has been invested in capital expenditures over the past four years, including a gut renovation of 13 units and façade renovation. The unit renovations in 2022 resulted in an average increase in post-renovation 2023 rent of $1,093 per renovated unit. Amenities at the 652 and 664 West 163rd Street Property include an elevator, laundry room, and close proximity to New York City subway lines and other public transportation.
| THE INFORMATION IN THIS STRUCTURAL AND COLLATERAL TERM SHEET IS NOT COMPLETE AND MAY BE AMENDED PRIOR TO THE TIME OF SALE. THIS TERM SHEET IS NOT AN OFFER TO SELL THESE SECURITIES AND IT IS NOT A SOLICITATION OF AN OFFER TO BUY THESE SECURITIES IN ANY JURISDICTION WHERE THE OFFER OR SALE IS NOT PERMITTED. | ||
| 65 | ||
Multifamily- Various Various Various, NY
|
Collateral Asset Summary – Loan No. 5 Acquisition America Portfolio |
Cut-off Date Balance: Cut-off Date LTV: U/W NCF DSCR: U/W NOI Debt Yield: |
$60,000,000 64.4% 1.25x 8.9% |
The following table presents certain information relating to the unit mix at the 652 and 664 West 163rd Street Property:
| Unit Mix(1) | |||||
| Unit Type | # of Units(2) | % of Total Units | Occupancy | Average Unit Size (SF)(3) | Average Monthly Rent Per Unit |
| Studio | 2 | 1.9% | 100.0% | 600 | $1,938 |
| 1BR/1BA | 35 | 33.0% | 88.6% | 800 | $2,120 |
| 2BR/1BA | 46 | 43.4% | 95.7% | 1,000 | $1,992 |
| 3BR/2BA | 23 | 21.7% | 87.0% | 1,100 | $2,667 |
| Total / Wtd. Avg. | 106 | 100.0% | 91.5% | 948 | $2,171 |
| (1) | Based on the underwritten rent roll dated December 13, 2023. |
| (2) | Of the 106 total units, 35 are rent controlled or rent stabilized. |
| (3) | Based on the appraisal estimates since figures were not provided by the borrower sponsor. |
21 5th Avenue. 21 5th Avenue (the “21 5th Avenue Property”) is a mid rise multifamily property of a six-story apartment building with 53 units located in Pelham, New York, approximately 10 miles north of Manhattan. There are no rent controlled or rent stabilized units at the 21 5th Avenue Property. The borrower sponsor recently spent $126,000 to renovate seven units at the 21 5th Avenue Property. Amenities at the 21 5th Avenue Property include an elevator and a laundry room. The 21 5th Avenue Property also has access to New York City by the Metro North railroad.
The following table presents certain information relating to the unit mix at the 21 5th Avenue Property:
| Unit Mix(1) | |||||
| Unit Type | # of Units(2) | % of Total Units | Occupancy(3) | Average Unit Size (SF)(4) | Average Monthly Rent Per Unit |
| Studio | 5 | 9.4% | 100.0% | 575 | $1,570 |
| 1BR/1BA | 29 | 54.7% | 100.0% | 650 | $1,737 |
| 2BR/1BA | 15 | 28.3% | 80.0% | 850 | $2,231 |
| 3BR/2BA | 4 | 7.5% | 100.0% | 1,000 | $2,800 |
| Total / Wtd. Avg. | 53 | 100.0% | 94.3% | 726 | $1,924 |
| (1) | Based on the underwritten rent roll dated December 13, 2023. |
| (2) | No units are rent controlled or rent stabilized. |
| (3) | The 21 5th Avenue Property contains one management unit that was underwritten as vacant. |
| (4) | Based on the appraisal estimates since figures were not provided by the borrower sponsor. |
603 West 140th Street. 603 West 140th Street (the “603 West 140th Street Property”) is a mid rise multifamily property comprised of a six-story building plus a basement with 55 units located in the Hamilton Heights section of New York, New York. Of the 55 units, 25 units are rent controlled or rent stabilized (44.5% of units), accounting for 29.1% of the gross potential rent. According to the borrower sponsor, approximately $846,000 has been invested in capital expenditures over the past four years, including a gut renovation of 13 units and façade restoration. The unit renovations in 2022 resulted in an average increase in post-renovation 2023 rent of $1,105 per renovated unit. Amenities at the 603 West 140th Street Property include an elevator, laundry room and close proximity to New York City subway lines and other public transportation.
The following table presents certain information relating to the unit mix at the 603 West 140th Street Property.
| Unit Mix(1) | |||||
| Unit Type | # of Units(2) | % of Total Units | Occupancy | Average Unit Size (SF)(3) | Average Monthly Rent Per Unit |
| 1BR/1BA | 10 | 18.2% | 100.0% | 650 | $2,089 |
| 2BR/1BA | 24 | 43.6% | 95.8% | 850 | $2,388 |
| 2BR/2BA | 1 | 1.8% | 100.0% | 850 | $806 |
| 3BR/2BA | 20 | 36.4% | 95.0% | 1,000 | $1,860 |
| Total / Wtd. Avg. | 55 | 100.0% | 96.4% | 868 | $2,112 |
| (1) | Based on the underwritten rent roll dated December 13, 2023. |
| (2) | Of the 55 total units, 25 are rent controlled or rent stabilized. |
| (3) | Based on the appraisal estimates since figures were not provided by the borrower sponsor. |
| THE INFORMATION IN THIS STRUCTURAL AND COLLATERAL TERM SHEET IS NOT COMPLETE AND MAY BE AMENDED PRIOR TO THE TIME OF SALE. THIS TERM SHEET IS NOT AN OFFER TO SELL THESE SECURITIES AND IT IS NOT A SOLICITATION OF AN OFFER TO BUY THESE SECURITIES IN ANY JURISDICTION WHERE THE OFFER OR SALE IS NOT PERMITTED. | ||
| 66 | ||
Multifamily- Various Various Various, NY
|
Collateral Asset Summary – Loan No. 5 Acquisition America Portfolio |
Cut-off Date Balance: Cut-off Date LTV: U/W NCF DSCR: U/W NOI Debt Yield: |
$60,000,000 64.4% 1.25x 8.9% |
The following table presents certain information relating to the historical operating performance and Underwritten Net Cash Flow of the Acquisition America Portfolio Properties:
| Cash Flow Analysis(1) | ||||||
| 2020 | 2021(2) | 2022(2) | TTM 10/31/2023(2) | U/W | U/W Per Unit | |
| Base Rent | $9,916,617 | $9,709,939 | $11,280,448 | $13,127,246 | $14,658,629 | $33,698 |
| Vacant Income | 0 | 0 | 0 | 0 | 0 | 0 |
| Reimbursements | 0 | 0 | 0 | 0 | 0 | 0 |
| Other Income(3) | 187,583 | 201,550 | 222,105 | 216,907 | 220,693 | 507 |
| Vacancy | 0 | 0 | 0 | 0 | (1,131,446) | (2,601) |
| Effective Gross Income | $10,104,199 | $9,911,489 | $11,502,552 | $13,344,153 | $13,747,876 | $31,604 |
| Total Expenses | 5,538,337 | 5,817,077 | 6,038,913 | 6,164,591 | 6,280,414 | 14,438 |
| Net Operating Income | $4,565,862 | $4,094,413 | $5,463,639 | $7,179,562 | $7,467,461 | $17,167 |
| Replacement Reserves | 0 | 0 | 0 | 0 | 108,750 | 250 |
| Net Cash Flow | $4,565,862 | $4,094,413 | $5,463,639 | $7,179,562 | $7,358,711 | $16,917 |
| Occupancy | 87.3% | 85.4% | 94.4% | 95.7% | 92.4% | |
| NCF DSCR(4) | 0.77x | 0.69x | 0.93x | 1.22x | 1.25x | |
| NOI Debt Yield(4) | 5.4% | 4.9% | 6.5% | 8.5% | 8.9% | |
| (1) | Based on the underwritten rent roll dated as of December 13, 2023. |
| (2) | The increase in net operating income from 2021 to 2022 to TTM 10/31/2023 is due to the units that the borrower sponsor had been gut renovating progressively becoming available for rent. |
| (3) | Other income includes a laundry contract, antenna leases and miscellaneous fees. |
| (4) | The NCF DSCR and NOI Debt Yield are based off the Acquisition America Portfolio Whole Loan. |
Appraisals. According to the appraisals, the Acquisition America Portfolio Properties had an aggregate “as-is” appraised value of $130,600,000 as of November 16, 2023.
Environmental Matters. According to the Phase I environmental reports, dated November 28, 2023, there was no evidence of any recognized environmental conditions at the Acquisition America Portfolio Properties.
The Market. The Acquisition America Portfolio Properties are located across four submarkets across the New York City metropolitan area.
The 509 & 515 West 110th Street Property and 517 West 113th Street Property are located in the Morningside Heights submarket. According to the appraisals, as of the third quarter of 2023, the submarket had an existing supply of approximately 4,210 units with an average occupancy of 97.4% and asking rents per month of $4,038. According to the appraisals for the 509 & 515 West 110th Street Property and the 517 West 113th Street Property, the 2023 population and average household income in a one-, three- and five-mile radius are 172,422, 1,162,662 and 2,510,778 and $152,779, $147,026 and $136,473, respectively.
The 652 and 664 West 163rd Street Property is located in the Upper Manhattan submarket. According to the appraisal, as of the third quarter of 2023, the submarket had an existing supply of approximately 55,585 units with an average occupancy of 99.0% and asking rents per month of $2,164. According to the appraisal for the 652 and 664 West 163rd Street Property, the 2023 population and average household income in a one-, three- and five-mile radius are 172,422, 1,162,662 and 2,510,778 and $152,779, $147,026 and $136,473, respectively.
The 603 West 140th Street Property is located in the Harlem submarket. According to the appraisal, as of the third quarter of 2023, the submarket had an existing supply of approximately 48,672 units with an average occupancy of 97.6% and asking rents per month of $2,432. According to the appraisal for the 603 West 140th Street Property, the 2023 population and average household income in a one-, three- and five-mile radius are 172,422, 1,162,662 and 2,510,778 and $152,779, $147,026 and $136,473, respectively.
The 21 5th Avenue Property is located in the Yonkers/Mt Vernon/New Rochelle submarket. According to the appraisal, as of the third quarter of 2023, the submarket had an existing supply of approximately 32,484 units with an average occupancy of 96.4% and asking rents per month of $2,323. According to the appraisal for the 21 5th Avenue Property, the 2023 population and average household income in a one-, three- and five-mile radius are 37,863, 322,667 and 819,358 and $151,136, $123,073 and $112,432, respectively.
| THE INFORMATION IN THIS STRUCTURAL AND COLLATERAL TERM SHEET IS NOT COMPLETE AND MAY BE AMENDED PRIOR TO THE TIME OF SALE. THIS TERM SHEET IS NOT AN OFFER TO SELL THESE SECURITIES AND IT IS NOT A SOLICITATION OF AN OFFER TO BUY THESE SECURITIES IN ANY JURISDICTION WHERE THE OFFER OR SALE IS NOT PERMITTED. | ||
| 67 | ||
Multifamily- Various Various Various, NY
|
Collateral Asset Summary – Loan No. 5 Acquisition America Portfolio |
Cut-off Date Balance: Cut-off Date LTV: U/W NCF DSCR: U/W NOI Debt Yield: |
$60,000,000 64.4% 1.25x 8.9% |
The Borrowers and the Borrower Sponsor. The borrowers are Acquisition America VI, LLC, Acquisition America VII, LLC, Acquisition America VIII, LLC, Acquisition America IX, LLC, Acquisition America X, LLC, Acquisition America XI, LLC and Acquisition America XII, LLC, each a New York limited liability company and single purpose entity having at least two independent directors in its organizational structure. Legal counsel to the borrowers delivered a non-consolidation opinion in connection with the origination of the Acquisition America Portfolio Whole Loan. The borrower sponsor and non-recourse carveout guarantor is Fred Ohebshalom. Fred Ohebshalom is the chief executive officer and founder of Empire Management. Founded in 1975, Empire Management is a diversified real estate firm involved in the ownership, management and development of properties. Empire Management manages a portfolio of more than 2,000 multifamily apartments and over one million square feet of office, industrial and retail space. The related borrowers, the related guarantor and certain affiliates thereof are defendants to an action filed by the City of New York (the “City”) alleging, among other things, that the defendants failed to maintain certain multifamily properties, including the Acquisition America Portfolio Properties and three non-collateral properties (the “Non-Collateral Properties”), in code compliance, failed to maintain the facades of such properties and committed other administrative code violations. In December 2023 the parties entered into a stipulation of partial settlement (the “Stipulation”) with respect to the claims pending against the Acquisition America Portfolio Properties (but not the Non-Collateral Properties), pursuant to which (i) the defendants paid the City penalties and fines totaling approximately $1,245,923 and (ii) agreed to cure any open violations pertaining to the Acquisition America Portfolio Properties in accordance with a schedule of deadlines set forth in the related Stipulation, generally ranging between April 30 and June 30, 2024. See “Initial and Ongoing Reserves,” below, and “Description of the Mortgage Pool—Litigation and Other Considerations” in the Preliminary Prospectus.
Property Management. The Acquisition America Portfolio Properties are managed by Empire Management America Corp., a borrower-affiliated management company.
Initial and Ongoing Reserves. At origination of the Acquisition America Portfolio Whole Loan, the borrowers deposited approximately (i) $38,703 into a reserve account for insurance premiums, (ii) $6,357,572 into a reserve account for outstanding violations as described below, and (iii) $80,463 into a deferred maintenance account.
Tax Reserve – The borrowers are required to deposit into a real estate tax reserve, on a monthly basis, 1/12 of the taxes that the lender estimates will be payable over the next-ensuing 12-month period (initially estimated to be approximately $283,486).
Insurance Reserve – So long as the Acquisition America Portfolio Properties are not covered by a blanket policy acceptable to the lender, the borrowers are required to deposit into an insurance reserve, on a monthly basis, 1/12 of the amount which will be sufficient to pay the insurance premiums due for the renewal of coverage afforded by such policies (initially estimated to be approximately $38,703).
Replacement Reserve – On each monthly payment date, the borrowers are required to deposit approximately $9,063 into a replacement reserve.
Violations Reserve – The borrowers deposited $6,357,572 into a violations reserve in connection with the litigation described under “The Borrowers and the Borrower Sponsor,” above. Additionally, a Trigger Period (as defined below) will commence upon the occurrence of an event of default under the Settlement Documents. The Acquisition America Portfolio Whole Loan documents also provide recourse to the guarantor for amounts owed by the borrowers and/or guarantor under the Settlement Documents.
Lockbox / Cash Management. The Acquisition America Portfolio Whole Loan is structured with a springing lockbox and springing cash management. Upon the occurrence of a Trigger Period, the borrowers are required to (or cause the property manager to) deposit all revenue generated by the Acquisition America Portfolio Properties into the lender-controlled lockbox account within two business days of receipt. Upon the occurrence and during the continuance of a Trigger Period, all funds in the lockbox account are required to be swept on each business day to a cash management account under the control of the lender to be applied and disbursed in accordance with the Acquisition America Portfolio Whole Loan documents, and all excess cash flow funds remaining in the cash management account after the application of such funds in accordance with the Acquisition America Portfolio Whole Loan documents are required to be held by the lender in an excess cash flow reserve account as additional collateral for the Acquisition America Portfolio Whole Loan. To the extent that no Trigger Period is continuing, all excess cash flow funds are required to be disbursed to the borrower.
A “Trigger Period” means a period (A) commencing on the earliest of (i) an event of default; (ii) the debt service coverage ratio being less than 1.10x; or (iii) the occurrence of a default by the borrowers beyond any applicable notice and cure period under the Settlement Documents and (B) expiring upon (x) with regard to clause (i) above, the cure of such event of default; (y) with regard to clause (ii) above, the debt service coverage ratio being equal to or greater than 1.15x for two consecutive quarters or a DSCR Sweep Avoidance Election (as defined below); and (z) with regard to clause (iii) above, lender’s receipt of satisfactory evidence of a cure of such event of default under the Settlement Documents.
A “DSCR Sweep Avoidance Election” will occur upon the borrowers written notice to the lender that they intend to deposit cash or a letter of credit in the amount equal to twelve months of the cash flow differential between a debt service coverage ratio of 1.00x and a debt service coverage ratio of 1.15x. After each twelve-month period following the initial deposit, the borrower will be required to replenish the differential.
| THE INFORMATION IN THIS STRUCTURAL AND COLLATERAL TERM SHEET IS NOT COMPLETE AND MAY BE AMENDED PRIOR TO THE TIME OF SALE. THIS TERM SHEET IS NOT AN OFFER TO SELL THESE SECURITIES AND IT IS NOT A SOLICITATION OF AN OFFER TO BUY THESE SECURITIES IN ANY JURISDICTION WHERE THE OFFER OR SALE IS NOT PERMITTED. | ||
| 68 | ||
Multifamily- Various Various Various, NY
|
Collateral Asset Summary – Loan No. 5 Acquisition America Portfolio |
Cut-off Date Balance: Cut-off Date LTV: U/W NCF DSCR: U/W NOI Debt Yield: |
$60,000,000 64.4% 1.25x 8.9% |
Current Mezzanine or Secured Subordinate Indebtedness. None.
Permitted Future Mezzanine or Secured Subordinate Indebtedness. Not permitted.
Release of Collateral. Not permitted.
Ground Lease. None.
| THE INFORMATION IN THIS STRUCTURAL AND COLLATERAL TERM SHEET IS NOT COMPLETE AND MAY BE AMENDED PRIOR TO THE TIME OF SALE. THIS TERM SHEET IS NOT AN OFFER TO SELL THESE SECURITIES AND IT IS NOT A SOLICITATION OF AN OFFER TO BUY THESE SECURITIES IN ANY JURISDICTION WHERE THE OFFER OR SALE IS NOT PERMITTED. | ||
| 69 | ||
Self Storage – Self Storage Various Various, Various
|
Collateral Asset Summary – Loan No. 6 Avenue
Living Mini Mall |
Cut-off Date Balance: Cut-off Date LTV: U/W NCF DSCR: U/W NOI Debt Yield: |
$55,500,000 58.7% 2.03x 9.5% |

| THE INFORMATION IN THIS STRUCTURAL AND COLLATERAL TERM SHEET IS NOT COMPLETE AND MAY BE AMENDED PRIOR TO THE TIME OF SALE. THIS TERM SHEET IS NOT AN OFFER TO SELL THESE SECURITIES AND IT IS NOT A SOLICITATION OF AN OFFER TO BUY THESE SECURITIES IN ANY JURISDICTION WHERE THE OFFER OR SALE IS NOT PERMITTED. | ||
| 70 | ||
Self Storage – Self Storage Various Various, Various
|
Collateral Asset Summary – Loan No. 6 Avenue
Living Mini Mall |
Cut-off Date Balance: Cut-off Date LTV: U/W NCF DSCR: U/W NOI Debt Yield: |
$55,500,000 58.7% 2.03x 9.5% |

| THE INFORMATION IN THIS STRUCTURAL AND COLLATERAL TERM SHEET IS NOT COMPLETE AND MAY BE AMENDED PRIOR TO THE TIME OF SALE. THIS TERM SHEET IS NOT AN OFFER TO SELL THESE SECURITIES AND IT IS NOT A SOLICITATION OF AN OFFER TO BUY THESE SECURITIES IN ANY JURISDICTION WHERE THE OFFER OR SALE IS NOT PERMITTED. | ||
| 71 | ||
Self Storage – Self Storage Various Various, Various
|
Collateral Asset Summary – Loan No. 6 Avenue
Living Mini Mall |
Cut-off Date Balance: Cut-off Date LTV: U/W NCF DSCR: U/W NOI Debt Yield: |
$55,500,000 58.7% 2.03x 9.5% |
| Mortgage Loan Information | Properties Information | ||||||||||||
| Loan Seller: | CREFI | Single Asset / Portfolio: | Portfolio | ||||||||||
| Loan Purpose: | Refinance | Properties Type – Subtype: | Self Storage – Self Storage | ||||||||||
| Borrower Sponsor(s): | Mini Mall U.S. Storage Properties Master LP | Collateral: | Fee | ||||||||||
| Borrower(s)(1): | Various | Location(3): | Various, Various | ||||||||||
| Original Balance: | $55,500,000 | Year Built / Renovated(3): | Various / Various | ||||||||||
| Cut-off Date Balance: | $55,500,000 | Property Management: | Mini Mall U.S. Storage Properties Master LP | ||||||||||
| % by Initial UPB: | 6.3% | Size: | 1,135,541 SF | ||||||||||
| Interest Rate: | 4.50000% | Appraised Value / Per SF(4): | $94,600,000 / $83 | ||||||||||
| Note Date: | December 6, 2023 | Appraisal Date(4): | June 22, 2023 | ||||||||||
| Original Term: | 60 months | Occupancy: | 75.4% (as of October 1, 2023) | ||||||||||
| Amortization: | Interest Only | UW Economic Occupancy: | 74.5% | ||||||||||
| Original Amortization: | NAP | Underwritten NOI: | $5,261,492 | ||||||||||
| Interest Only Period: | 60 months | Underwritten NCF: | $5,147,938 | ||||||||||
| First Payment Date: | January 6, 2024 | ||||||||||||
| Maturity Date: | December 6, 2028 | Historical NOI | |||||||||||
| Additional Debt Type: | NAP | Most Recent NOI: | $5,224,504 (TTM September 30, 2023) | ||||||||||
| Additional Debt Balance: | NAP | 2022 NOI(5): | NAV | ||||||||||
| Call Protection: | L(25),D(28),O(7) | 2021 NOI(5): | NAV | ||||||||||
| Lockbox / Cash Management: | Springing / Springing | 2020 NOI(5): | NAV | ||||||||||
| Reserves(2) | Financial Information | ||||||||||||
| Initial | Monthly | Cap | Cut-off Date Loan / SF: | $49 | |||||||||
| Taxes: | $0 | Springing | NAP | Maturity Date Loan / SF: | $49 | ||||||||
| Insurance: | $0 | Springing | NAP | Cut-off Date LTV(4): | 58.7% | ||||||||
| Replacement Reserves: | $519,450 | $9,463 | NAP | Maturity Date LTV(4): | 58.7% | ||||||||
| TI / LC: | $0 | $0 | NAP | UW NOI DY: | 9.5% | ||||||||
| Deferred Maintenance: | $198,406 | $0 | NAP | UW NCF DSCR: | 2.03x | ||||||||
| Sources and Uses | |||||||||||||
| Sources | Proceeds | % of Total | Uses | Proceeds | % of Total | ||||||||
| Mortgage Loan | $55,500,000 | 100.0% | Loan Payoff | $41,219,718 | 74.3% | ||||||||
| Closing Costs(6) | 8,675,793 | 15.6 | |||||||||||
| Borrower Sponsor Equity | 4,886,633 | 8.8 | |||||||||||
| Upfront Reserves | 717,856 | 1.3 | |||||||||||
| Total Sources | $55,500,000 | 100.0% | Total Uses | $55,500,000 | 100.0% | ||||||||
| (1) | The borrowers are ALL4401MN LP, ALL4402TK LP, ALL4403CD LP, ALL4404TY LP, ALL4405TY LP, ARL3301HS LP, ARL3302HS LP, ARL3303HS LP, ARL3304HS LP, ARL3305HS LP, ARL3306HS LP, ARL3307HS LP, ARL3308HS LP, ARL3309HS LP, ARL3310HS LP, ARL3311HS LP, ARL3312HS LP, ARL3313HS LP, ARL3314BK LP, ARL3315HS LP, ILU2801DE LP, IN2903CE LP, INU2901GE LP, INU2902CE LP, LAU4201NS LP, MSU4301LE LP, MSU4305FE LP, OHU3001LD LP, SCU4140AN LP and OHU3002CS LLC. |
| (2) | See “Initial and Ongoing Reserves” below. |
| (3) | See “Portfolio Summary” below. |
| (4) | The Appraised Value is based on the “As Is Portfolio” value, inclusive of a 4.8% portfolio premium. The sum of the individual as-is appraised values is $90,290,000, which equates to a Cut-off Date LTV and Maturity Date LTV of 61.5%. |
| (5) | 2020 NOI, 2021 NOI and 2022 NOI are not available because the Avenue Living Mini Mall Storage Portfolio Properties (as defined below) were recently acquired between December 2021 and June 2022. |
| (6) | Closing Costs include a rate buydown fee of $6,559,091. |
The Loan. The sixth largest mortgage loan (the “Avenue Living Mini Mall Storage Portfolio Mortgage Loan”) is secured by the borrowers’ fee interests in 38 self storage properties, totaling 7,282 units and 1,135,541 square feet, located across the Southeast and Midwest United States, in Alabama, Arkansas, Illinois, Indiana, Louisiana, Mississippi, Ohio and South Carolina (the “Avenue Living Mini Mall Storage Portfolio Properties”). The Avenue Living Mini Mall Storage Portfolio Mortgage Loan is evidenced by a single promissory note with an outstanding principal balance as of the Cut-off Date of $55,500,000. The Avenue Living Mini Mall Storage Portfolio Mortgage Loan was originated on December 6, 2023 by CREFI and accrues interest at a fixed rate of 4.50000% per annum. The Avenue Living Mini Mall Storage Portfolio Mortgage Loan has an initial term of five years and is interest-only for the full term. The scheduled maturity date of the Avenue Living Mini Mall Storage Portfolio Mortgage Loan is the payment date that occurs on December 6, 2028.
| THE INFORMATION IN THIS STRUCTURAL AND COLLATERAL TERM SHEET IS NOT COMPLETE AND MAY BE AMENDED PRIOR TO THE TIME OF SALE. THIS TERM SHEET IS NOT AN OFFER TO SELL THESE SECURITIES AND IT IS NOT A SOLICITATION OF AN OFFER TO BUY THESE SECURITIES IN ANY JURISDICTION WHERE THE OFFER OR SALE IS NOT PERMITTED. | ||
| 72 | ||
Self Storage – Self Storage Various Various, Various
|
Collateral Asset Summary – Loan No. 6 Avenue
Living Mini Mall |
Cut-off Date Balance: Cut-off Date LTV: U/W NCF DSCR: U/W NOI Debt Yield: |
$55,500,000 58.7% 2.03x 9.5% |
The Properties. The Avenue Living Mini Mall Storage Portfolio Properties consist of 38 self storage properties, totaling 7,282 units and 1,135,541 square feet, located across the Southeast and Midwest United States, in Alabama, Arkansas, Illinois, Indiana, Louisiana, Mississippi, Ohio and South Carolina. The Avenue Living Mini Mall Storage Portfolio Properties were built between 1975 and 2019 and recently acquired by the borrower sponsor between December 2021 and June 2022. As of October 1, 2023 the Avenue Living Mini Mall Storage Portfolio Properties were 75.4% occupied. The Avenue Living Mini Mall Storage Portfolio Properties unit mix consists of 964 climate controlled units totaling 99,842 square feet, 6,001 non-climate controlled units totaling 1,008,429 square feet, 28 commercial units totaling 19,950 square feet and 289 parking units.
The following table presents certain information relating to the Avenue Living Mini Mall Storage Portfolio Properties:
| Portfolio Summary | ||||||||||||
| Property Name | City, State(1) | Year Built / Renovated(1) | Allocated Loan Amount | % of Allocated Loan Amount | Pop (5-mi.)(1)(2) | Household Income (5-mi.)(1)(2) | Appraised Value(1)(3) | Units(4) | Occupancy(4) | U/W NOI(4) | % of U/W NOI(4) | |
| New Orleans | New Orleans, LA | 2010 / NAP | $6,331,266 | 11.4% | 272,866 | $71,710 | $10,300,000 | 599 | 72.4% | $501,785 | 9.5% | |
| Loveland | Loveland, OH | 1976 / NAP | 4,763,817 | 8.6 | 112,827 | 147,550 | 7,750,000 | 457 | 83.6% | 435,348 | 8.3 | |
| Anderson Storage | Anderson, SC | 1991 / 2023 | 4,640,879 | 8.4 | 69,527 | 66,595 | 7,550,000 | 712 | 72.2% | 387,407 | 7.4 | |
| Higdon Road | Hot Springs, AR | 1998 / NAP | 3,380,773 | 6.1 | 53,787 | 64,484 | 5,500,000 | 290 | 87.3% | 387,588 | 7.4 | |
| Lake Charles | Lake Charles, LA | 1985, 1990 / 2022 | 3,011,961 | 5.4 | 85,498 | 65,077 | 4,900,000 | 372 | 82.1% | 298,196 | 5.7 | |
| Columbus | Columbus, OH | 1988, 1989 / NAP | 2,735,353 | 4.9 | 283,831 | 87,946 | 4,450,000 | 421 | 76.9% | 298,741 | 5.7 | |
| Danville | Danville, IL | 2000 / NAP | 2,704,618 | 4.9 | 41,607 | 59,238 | 4,400,000 | 545 | 79.5% | 304,990 | 5.8 | |
| Files Road | Hot Springs, AR | 2005 / 2018 | 2,397,275 | 4.3 | 52,839 | 64,906 | 3,900,000 | 254 | 77.0% | 204,445 | 3.9 | |
| Greencastle | Greencastle, IN | 1981 / NAP | 2,274,338 | 4.1 | 14,963 | 82,878 | 3,700,000 | 280 | 76.8% | 254,078 | 4.8 | |
| Hot Springs 267 | Hot Springs, AR | 2004 / NAP | 1,844,058 | 3.3 | 40,066 | 66,885 | 3,000,000 | 229 | 74.3% | 160,929 | 3.1 | |
| Royal | Royal, AR | 2006 / 2009 | 1,782,589 | 3.2 | 13,698 | 61,949 | 2,900,000 | 188 | 76.9% | 144,868 | 2.8 | |
| Winans | Hot Springs, AR | 1983 / 2017 | 1,782,589 | 3.2 | 48,088 | 62,794 | 2,900,000 | 249 | 69.9% | 164,248 | 3.1 | |
| Meridian | Meridian, MS | 1990, 1995, 1998 / 1998 | 1,475,246 | 2.7 | 36,578 | 52,046 | 2,400,000 | 169 | 67.7% | 143,289 | 2.7 | |
| Florence | Florence, MS | 1988, 2000 / NAP | 1,229,372 | 2.2 | 26,390 | 76,176 | 2,000,000 | 211 | 58.5% | 81,887 | 1.6 | |
| Lucedale 63 South | Lucedale, MS | 2006 / 2020 | 1,198,638 | 2.2 | 5,027 | 63,596 | 1,950,000 | 175 | 71.8% | 110,737 | 2.1 | |
| Hot Springs 176 | Hot Springs, AR | 2005 / NAP | 1,106,435 | 2.0 | 39,027 | 67,541 | 1,800,000 | 107 | 79.0% | 107,297 | 2.0 | |
| Moulton | Moulton, AL | 1998 / 2001 | 1,060,333 | 1.9 | 8,694 | 61,019 | 1,725,000 | 197 | 86.8% | 144,585 | 2.7 | |
| Airport Road | Hot Springs, AR | 1996 / NAP | 998,865 | 1.8 | 53,508 | 61,174 | 1,625,000 | 134 | 80.9% | 123,494 | 2.3 | |
| Central 6122 | Hot Springs, AR | 1997 / NAP | 952,763 | 1.7 | 21,260 | 80,689 | 1,550,000 | 188 | 45.1% | 57,219 | 1.1 | |
| Higdon Ferry Road South | Hot Springs, AR | 1996 / NAP | 829,826 | 1.5 | 50,383 | 66,004 | 1,350,000 | 102 | 69.9% | 71,248 | 1.4 | |
| Trinity - Al. Hwy 24 | Trinity, AL | 2000 / 2022 | 829,826 | 1.5 | 22,038 | 73,162 | 1,350,000 | 105 | 71.6% | 75,102 | 1.4 | |
| Moss Point | Moss Point, MS | 1999 / NAP | 814,459 | 1.5 | 5,843 | 75,953 | 1,325,000 | 108 | 74.6% | 64,903 | 1.2 | |
| Trinity - Co. Rd. 434 | Trinity, AL | 1998 / NAP | 737,623 | 1.3 | 11,660 | 66,088 | 1,200,000 | 137 | 76.1% | 89,942 | 1.7 | |
| Ernie’s | Hot Springs, AR | 2001 / 2004 | 660,787 | 1.2 | 23,126 | 73,735 | 1,075,000 | 86 | 58.8% | 47,459 | 0.9 | |
| Marion Anderson Road | Hot Springs, AR | 1999 / 2004 | 645,420 | 1.2 | 39,533 | 67,183 | 1,050,000 | 77 | 83.5% | 71,622 | 1.4 | |
| Amity | Hot Springs, AR | 2001 / 2003 | 633,127 | 1.1 | 27,668 | 76,547 | 1,030,000 | 78 | 79.6% | 67,680 | 1.3 | |
| Cloverdale | Cloverdale, IN | 1976 / NAP | 522,486 | 0.9 | 5,494 | 73,570 | 850,000 | 92 | 95.0% | 78,846 | 1.5 | |
| Mountain Pine Road | Hot Springs, AR | 1990 / 2008 | 497,896 | 0.9 | 44,165 | 53,666 | 810,000 | 66 | 80.0% | 39,092 | 0.7 | |
| Lucedale MS-613 | Lucedale, MS | 2019 / NAP | 476,382 | 0.9 | 4,666 | 68,709 | 775,000 | 56 | 79.7% | 52,443 | 1.0 | |
| Crawfordsville | Crawfordsville, IN | 1984 / NAP | 461,015 | 0.8 | 22,055 | 68,591 | 750,000 | 95 | 85.6% | 62,863 | 1.2 | |
| Point Cedar | Bismarck, AR | 1975 / NAP | 430,280 | 0.8 | 1,990 | 52,631 | 700,000 | 66 | 71.7% | 37,087 | 0.7 | |
| Central 6045 | Hot Springs, AR | 2006 / NAP | 417,986 | 0.8 | 22,973 | 79,443 | 680,000 | 59 | 68.8% | 38,401 | 0.7 | |
| Lucedale 63 North | Lucedale, MS | 2006 / 2008 | 384,179 | 0.7 | 5,662 | 65,716 | 625,000 | 67 | 66.2% | 30,945 | 0.6 | |
| Malvern Road | Hot Springs, AR | 2001 / NAP | 368,812 | 0.7 | 15,559 | 82,912 | 600,000 | 64 | 48.3% | 22,982 | 0.4 | |
| John Owens | Hot Springs, AR | 2010 / 2022 | 331,930 | 0.6 | 51,162 | 62,388 | 540,000 | 58 | 68.3% | 31,405 | 0.6 | |
| Town Creek | Town Creek, AL | 1990 / NAP | 322,710 | 0.6 | 4,428 | 64,870 | 525,000 | 80 | 78.9% | 44,063 | 0.8 | |
| Courtland | Courtland, AL | 1990 / NAP | 291,976 | 0.5 | 2,492 | 53,230 | 475,000 | 74 | 57.6% | 14,086 | 0.3 | |
| Thibodaux | Thibodaux, LA | 2010 / 2022 | 172,112 | 0.3 | 36,823 | 76,475 | 280,000 | 35 | 83.5% | 10,194 | 0.2 | |
| Total / Wtd. Avg. | $55,500,000 | 100.0% | 84,543 | $75,186 | $90,290,000 | 7,282 | 75.4% | $5,261,492 | 100.0% | |||
| (1) | Source: Appraisals. |
| (2) | Pop (5-mi.) and Household Income (5-mi.) represent population statistics and average household income as of 2022. |
| (3) | Appraised Values represent the “as is” appraised value for each property. The appraiser also concluded to an “As Is Portfolio” value, of $94,600,000, which is inclusive of a 4.8% portfolio premium. |
| (4) | Based on the underwritten rent rolls dated October 1, 2023. |
| THE INFORMATION IN THIS STRUCTURAL AND COLLATERAL TERM SHEET IS NOT COMPLETE AND MAY BE AMENDED PRIOR TO THE TIME OF SALE. THIS TERM SHEET IS NOT AN OFFER TO SELL THESE SECURITIES AND IT IS NOT A SOLICITATION OF AN OFFER TO BUY THESE SECURITIES IN ANY JURISDICTION WHERE THE OFFER OR SALE IS NOT PERMITTED. | ||
| 73 | ||
Self Storage – Self Storage Various Various, Various
|
Collateral Asset Summary – Loan No. 6 Avenue
Living Mini Mall |
Cut-off Date Balance: Cut-off Date LTV: U/W NCF DSCR: U/W NOI Debt Yield: |
$55,500,000 58.7% 2.03x 9.5% |
The following table presents certain information relating to the unit mix at the Avenue Living Mini Mall Storage Portfolio Properties:
| Unit Mix(1) | ||||||
| Unit Type | Net Rentable Area (Sq. Ft.) | % of NRA (Sq. Ft.) | # of Units | Occupancy(2) | % of UW Rent by Unit Type | UW Rent per Unit |
| Non-Climate Controlled | 1,008,429 | 88.8% | 6,001 | 72.7% | 77.8% | $1,252 |
| Climate Controlled | 99,842 | 8.8 | 964 | 74.0% | 16.6 | $1,638 |
| Commercial | 19,950 | 1.8 | 28 | 71.4% | 2.3 | $7,961 |
| Parking | 7,320 | 0.6 | 289 | 70.9% | 3.4 | $1,148 |
| Total / Wtd Avg. | 1,135,541 | 100.0% | 7,282 | 72.8% | 100.0% | $1,325 |
| (1) | Based on the underwritten rent rolls dated October 1, 2023. |
| (2) | Occupancy calculated based on # of Units. |
The following table presents certain information relating to the historical operating performance and Underwritten Net Cash Flow at the Avenue Living Mini Mall Storage Portfolio Properties:
| Cash Flow Analysis(1)(2) | |||
| T-12 9/30/2023 | U/W | UW Per SF | |
| In-Place Storage Rent | $6,808,002 | $7,025,530 | $6.19 |
| Potential Income from Vacant Units | 0 | 2,409,204 | $2.12 |
| Gross Potential Rent | $6,808,002 | $9,434,734 | $8.31 |
| Other Income(3) | 1,379,108 | 1,379,108 | $1.21 |
| Net Rental Income | $8,187,110 | $10,813,842 | $9.52 |
| Vacancy & Credit Loss | 0 | (2,409,204) | ($2.12) |
| Effective Gross Income | $8,187,110 | $8,404,638 | $7.40 |
| Real Estate Taxes | 443,264 | 711,705 | $0.63 |
| Insurance | 385,064 | 550,439 | $0.48 |
| Management Fee | 409,355 | 420,232 | $0.37 |
| Other Operating Expenses(4) | 1,724,921 | 1,460,770 | $1.29 |
| Total Expenses | $2,962,606 | $3,143,146 | $2.77 |
| Net Operating Income | $5,224,504 | $5,261,492 | $4.63 |
| Replacement Reserves | 0 | 113,554 | $0.10 |
| Net Cash Flow | $5,224,504 | $5,147,938 | $4.53 |
| Occupancy | 74.7% | 74.5%(5) | |
| NCF DSCR | 2.06x | 2.03x | |
| NOI Debt Yield | 9.4% | 9.5% | |
| (1) | Based on the underwritten rent rolls dated October 1, 2023. |
| (2) | Historical financial information is not available because the Avenue Living Mini Mall Storage Portfolio Properties were recently acquired between December 2021 and June 2022. |
| (3) | Other Income consists of tenant insurance income revenue and late fees. |
| (4) | Other Operating Expenses consist of general and administrative, utilities, repairs & maintenance, and tenant insurance expenses. |
| (5) | U/W occupancy is based on the economic occupancy. |
| THE INFORMATION IN THIS STRUCTURAL AND COLLATERAL TERM SHEET IS NOT COMPLETE AND MAY BE AMENDED PRIOR TO THE TIME OF SALE. THIS TERM SHEET IS NOT AN OFFER TO SELL THESE SECURITIES AND IT IS NOT A SOLICITATION OF AN OFFER TO BUY THESE SECURITIES IN ANY JURISDICTION WHERE THE OFFER OR SALE IS NOT PERMITTED. | ||
| 74 | ||
Self Storage – Self Storage Various Various, Various
|
Collateral Asset Summary – Loan No. 6 Avenue
Living Mini Mall |
Cut-off Date Balance: Cut-off Date LTV: U/W NCF DSCR: U/W NOI Debt Yield: |
$55,500,000 58.7% 2.03x 9.5% |
Appraisal. According to the appraisal prepared in connection with the origination of the Avenue Living Mini Mall Storage Portfolio Mortgage Loan, the appraiser concluded to an “As Is Portfolio” appraised value of $94,600,000 for the Avenue Living Mini Mall Storage Portfolio Properties as of June 22, 2023, which is inclusive of an approximately 4.8% portfolio premium and reflects the “as-is” value of the Avenue Living Mini Mall Storage Portfolio Properties as a whole if sold in their entirety to a single buyer. Additionally, the appraiser appraised the Avenue Living Mini Mall Storage Portfolio Properties as of various dates in June 2023, which produced an aggregate “as-is” appraised value of $90,290,000.
| Avenue Living Mini Mall Storage Portfolio Appraised Value(1) | ||
| Property | Value | Capitalization Rate |
| Avenue Living Mini Mall Storage Portfolio | $94,600,000 | 7.25%(2) |
| (1) | Source: Appraisal. |
| (2) | The appraiser used a discounted cash flow approach to arrive at the appraised value. The capitalization rate shown above represents the terminal capitalization rate. The discount rate utilized by the appraiser was 9.0%. |
Environmental Matters. The Phase I environmental reports dated as of June 21, 2023 identified recognized environmental conditions at (i) the Royal property associated with the historic operation on its northwestern corner of a gasoline filling station and possible auto repair activities, (ii) the Greencastle property associated with two adjacent long-existing gas stations for which records indicate potential poor underground storage tank system maintenance and/or for which no subsurface quality data was available, and (iii) the New Orleans property associated with impacts to groundwater identified in 2022 and associated with the operation of an historic onsite gas station from the 1950s through the 1990s. In connection with the origination of the Avenue Living Mini Mall Storage Portfolio Mortgage Loan, the borrowers obtained a Site Lender Environmental Asset Protection insurance policy which covers the foregoing three properties, issued by Lloyd’s Syndicates 623/2623, with a policy term of eight years with a limit of liability of $8,400,000 (per claim and in the aggregate) and a $25,000 deductible. See “Description of the Mortgage Pool—Environmental Considerations” in the Preliminary Prospectus.
The Market. The Avenue Living Mini Mall Storage Portfolio Properties are located across eight states: Arkansas (17 properties, 33.8% of UW NOI), Louisiana (three properties, 15.4% of UW NOI), Ohio (two properties, 14.0% of UW NOI), Mississippi (six properties, 9.2% of UW NOI), Indiana (three properties, 7.5% of UW NOI), South Carolina (one property, 7.4% of UW NOI), Alabama (five properties, 7.0% of UW NOI) and Illinois (one property, 5.8% of UW NOI).
The following table presents certain market information relating to the Avenue Living Mini Mall Storage Portfolio Properties by market:
| Market Summary | ||||||
| State |
Property Count |
# of Units(1) | SF(1) | Allocated Loan Amount | UW NOI(1) | % of UW NOI(1) |
| Arkansas | 17 | 2,295 | 482,224 | $19,061,411 | $1,777,062 | 33.8% |
| Louisiana | 3 | 1,006 | 113,710 | 9,515,339 | 810,175 | 15.4 |
| Ohio | 2 | 878 | 122,925 | 7,499,170 | 734,089 | 14.0 |
| Mississippi | 6 | 786 | 109,100 | 5,578,276 | 484,204 | 9.2 |
| Indiana | 3 | 467 | 78,640 | 3,257,839 | 395,788 | 7.5 |
| South Carolina | 1 | 712 | 92,692 | 4,640,879 | 387,407 | 7.4 |
| Alabama | 5 | 593 | 78,625 | 3,242,468 | 367,778 | 7.0 |
| Illinois | 1 | 545 | 57,625 | 2,704,618 | 304,990 | 5.8 |
| Total | 38 | 7,282 | 1,135,541 | $55,500,000 | $5,261,492 | 100.0% |
| (1) | Based on the underwritten rent rolls dated October 1, 2023. |
The Borrowers and the Borrower Sponsor. The borrowers are ALL4401MN LP, ALL4402TK LP, ALL4403CD LP, ALL4404TY LP, ALL4405TY LP, ARL3301HS LP, ARL3302HS LP, ARL3303HS LP, ARL3304HS LP, ARL3305HS LP, ARL3306HS LP, ARL3307HS LP, ARL3308HS LP, ARL3309HS LP, ARL3310HS LP, ARL3311HS LP, ARL3312HS LP, ARL3313HS LP, ARL3314BK LP, ARL3315HS LP, ILU2801DE LP, IN2903CE LP, INU2901GE LP, INU2902CE LP, LAU4201NS LP, MSU4301LE LP, MSU4305FE LP, OHU3001LD LP, SCU4140AN LP and OHU3002CS LLC, each a Delaware limited partnership with the exception of OHU3002CS LLC which operates as a Delaware limited liability company. Each borrower is a single purpose entity having at least one independent director in its organizational structure. Legal counsel to the borrowers delivered a non-consolidation opinion in connection with the origination of the Avenue Living Mini Mall Storage Portfolio Mortgage Loan.
| THE INFORMATION IN THIS STRUCTURAL AND COLLATERAL TERM SHEET IS NOT COMPLETE AND MAY BE AMENDED PRIOR TO THE TIME OF SALE. THIS TERM SHEET IS NOT AN OFFER TO SELL THESE SECURITIES AND IT IS NOT A SOLICITATION OF AN OFFER TO BUY THESE SECURITIES IN ANY JURISDICTION WHERE THE OFFER OR SALE IS NOT PERMITTED. | ||
| 75 | ||
Self Storage – Self Storage Various Various, Various
|
Collateral Asset Summary – Loan No. 6 Avenue
Living Mini Mall |
Cut-off Date Balance: Cut-off Date LTV: U/W NCF DSCR: U/W NOI Debt Yield: |
$55,500,000 58.7% 2.03x 9.5% |
The borrower sponsor and non-recourse carveout guarantor is Mini Mall U.S. Storage Properties Master LP. Mini Mall U.S. Storage Properties Master LP is a subsidiary of Mini Mall Storage Properties Trust which owns and operates over 210 self storage facilities totaling over eight million square feet across the United States and Canada. Mini Mall Storage Properties Trust focuses on acquiring legacy-run assets and applies institutional-grade technology and strategies to increase profitability. These include 24/7 access, mobile rentals, improved security and dynamic pricing models.
Property Management. The Avenue Living Mini Mall Storage Portfolio Properties are managed by Mini Mall U.S. Storage Properties Master LP, a borrower affiliated management company, or such other persons selected to manage an individual Avenue Living Mini Mall Storage Portfolio Property pursuant to the terms of the Avenue Living Mini Mall Storage Portfolio Mortgage Loan documents.
Initial and Ongoing Reserves. At origination of the Avenue Living Mini Mall Storage Portfolio Mortgage Loan, the borrowers deposited (i) $519,450 into a replacement reserve account, and (iii) $198,406 into a reserve account for deferred maintenance.
Tax Reserve – The borrowers are required to deposit into a real estate tax reserve, on a monthly basis during the continuance of a Trigger Period (as defined below), 1/12 of the taxes that the lender determines will be payable over the next-ensuing 12-month period.
Insurance Reserve – The borrowers are required to deposit into an insurance reserve, on a monthly basis during the continuance of a Trigger Period, 1/12 of the amount which will be sufficient to pay the insurance premiums due for the renewal of coverage afforded by such policies; provided, however, such insurance reserve has been conditionally waived so long as the borrowers maintain a blanket policy meeting the requirements of the Avenue Living Mini Mall Storage Portfolio Mortgage Loan documents.
Replacement Reserve – The borrowers are required to deposit into a replacement reserve, on a monthly basis, $9,463.
Lockbox / Cash Management. The Avenue Living Mini Mall Storage Portfolio Mortgage Loan is structured with a springing lockbox and springing cash management. On the first occurrence of a Trigger Period, the borrowers are required to establish a lender-controlled lockbox account, and are thereafter required to deposit (or cause the property manager to deposit) all revenue received by the borrowers or the property manager into such lockbox immediately upon receipt. All funds deposited into the lockbox account are required to be transferred on each business day to or at the direction of the borrowers unless a Trigger Period exists and the lender elects (in its sole and absolute discretion) to deliver a restricted account notice to the institution maintaining the lockbox account, in which case all funds in the lockbox account are required to be swept on each business day to a lender-controlled cash management account to be applied and disbursed in accordance with the Avenue Living Mini Mall Storage Portfolio Mortgage Loan documents. All excess cash flow funds remaining in the cash management account after the application of such funds in accordance with the Avenue Living Mini Mall Storage Portfolio Mortgage Loan documents are required to be held by the lender in an excess cash flow reserve account as additional collateral for the Avenue Living Mini Mall Storage Portfolio Mortgage Loan. Upon the cure of the applicable Trigger Period, so long as no other Trigger Period exists and provided no event of default under the Avenue Living Mini Mall Storage Portfolio Mortgage Loan documents has occurred and is continuing, the lender is required to return any amounts remaining on deposit in the excess cash flow reserve account to the borrowers. Upon an event of default under the Avenue Living Mini Mall Storage Portfolio Mortgage Loan documents, the lender may apply funds to the debt in such priority as it may determine.
“Trigger Period” means a period (A) commencing upon the earlier of (i) the occurrence and continuance of an event of default under the Avenue Living Mini Mall Storage Portfolio Mortgage Loan documents, and (ii) the debt yield being less than 8%; and (B) expiring upon (x) with regard to clause (i) above, the cure (if applicable) of such event of default under the Avenue Living Mini Mall Storage Portfolio Mortgage Loan documents, and (y) with regard to clause (ii) above, the date that the debt yield is equal to or greater than 8% for two consecutive calendar quarters.
Current Mezzanine or Secured Subordinate Indebtedness. None.
Permitted Future Mezzanine or Secured Subordinate Indebtedness. Not permitted.
Release of Collateral. Not Permitted.
Ground Lease. None.
| THE INFORMATION IN THIS STRUCTURAL AND COLLATERAL TERM SHEET IS NOT COMPLETE AND MAY BE AMENDED PRIOR TO THE TIME OF SALE. THIS TERM SHEET IS NOT AN OFFER TO SELL THESE SECURITIES AND IT IS NOT A SOLICITATION OF AN OFFER TO BUY THESE SECURITIES IN ANY JURISDICTION WHERE THE OFFER OR SALE IS NOT PERMITTED. | ||
| 76 | ||
Industrial – Warehouse/Distribution 333 South Spruce Street Manteno, IL 60950 |
Collateral Asset Summary – Loan No.7 333 South Spruce Street |
Cut-off Date Balance: Cut-off Date LTV: U/W NCF DSCR: U/W NOI Debt Yield: |
$50,000,000 56.0% 1.65x 11.3% |

| THE INFORMATION IN THIS STRUCTURAL AND COLLATERAL TERM SHEET IS NOT COMPLETE AND MAY BE AMENDED PRIOR TO THE TIME OF SALE. THIS TERM SHEET IS NOT AN OFFER TO SELL THESE SECURITIES AND IT IS NOT A SOLICITATION OF AN OFFER TO BUY THESE SECURITIES IN ANY JURISDICTION WHERE THE OFFER OR SALE IS NOT PERMITTED. | ||
| 77 | ||
Industrial – Warehouse/Distribution 333 South Spruce Street Manteno, IL 60950 |
Collateral Asset Summary – Loan No.7 333 South Spruce Street |
Cut-off Date Balance: Cut-off Date LTV: U/W NCF DSCR: U/W NOI Debt Yield: |
$50,000,000 56.0% 1.65x 11.3% |

| THE INFORMATION IN THIS STRUCTURAL AND COLLATERAL TERM SHEET IS NOT COMPLETE AND MAY BE AMENDED PRIOR TO THE TIME OF SALE. THIS TERM SHEET IS NOT AN OFFER TO SELL THESE SECURITIES AND IT IS NOT A SOLICITATION OF AN OFFER TO BUY THESE SECURITIES IN ANY JURISDICTION WHERE THE OFFER OR SALE IS NOT PERMITTED. | ||
| 78 | ||
Industrial – Warehouse/Distribution 333 South Spruce Street Manteno, IL 60950 |
Collateral Asset Summary – Loan No.7 333 South Spruce Street |
Cut-off Date Balance: Cut-off Date LTV: U/W NCF DSCR: U/W NOI Debt Yield: |
$50,000,000 56.0% 1.65x 11.3% |
| Mortgage Loan Information | Property Information | ||||||||||||
| Loan Seller: | CREFI | Single Asset / Portfolio: | Single Asset | ||||||||||
| Loan Purpose: | Acquisition | Property Type – Subtype: | Industrial – Warehouse/Distribution | ||||||||||
| Borrower Sponsor(s): | Gotion, Inc. | Collateral: | Fee | ||||||||||
| Borrower(s): | 333 South Spruce LLC | Location: | Manteno, IL | ||||||||||
| Original Balance(1): | $50,000,000 | Year Built / Renovated: | 1991 / NAP | ||||||||||
| Cut-off Date Balance(1): | $50,000,000 | Property Management: | Self-Managed | ||||||||||
| % by Initial UPB: | 5.7% | Size: | 1,546,575 SF | ||||||||||
| Interest Rate: | 6.60000% | Appraised Value / Per SF: | $140,700,000 / $91 | ||||||||||
| Note Date: | December 15, 2023 | Appraisal Date: | October 20, 2023 | ||||||||||
| Original Term: | 60 months | Occupancy: | 100.0% (as of January 6, 2024) | ||||||||||
| Amortization: | Interest Only | UW Economic Occupancy: | 95.0% | ||||||||||
| Original Amortization: | NAP | Underwritten NOI: | $8,875,215 | ||||||||||
| Interest Only Period: | 60 months | Underwritten NCF: | $8,720,558 | ||||||||||
| First Payment Date: | February 6, 2024 | ||||||||||||
| Maturity Date: | January 6, 2029 | Historical NOI(5) | |||||||||||
| Additional Debt Type(1): | Pari Passu | Most Recent NOI: | NAV | ||||||||||
| Additional Debt Balance(1): | $28,750,000 | 2022 NOI: | NAV | ||||||||||
| Call Protection(2): | L(3),YM1(50),O(7) | 2021 NOI: | NAV | ||||||||||
| Lockbox / Cash Management: | Hard / Springing | 2020 NOI: | NAV | ||||||||||
| Reserves(3) | Financial Information(1) | ||||||||||||
| Initial | Monthly | Cap | Cut-off Date Loan / SF: | $51 | |||||||||
| Taxes: | $425,726 | $85,145 | NAP | Maturity Date Loan / SF: | $51 | ||||||||
| Insurance: | $217,592 | $217,592 | NAP | Cut-off Date LTV: | 56.0% | ||||||||
| Replacement Reserves: | $950,000 | $12,888 | NAP | Maturity Date LTV: | 56.0% | ||||||||
| TI / LC: | $0 | Springing | NAP | UW NOI DY: | 11.3% | ||||||||
| Deferred Maintenance: | $40,625 | $0 | NAP | UW NCF DSCR: | 1.65x | ||||||||
| Other(4): | $9,356,000 | $0 | NAP | ||||||||||
| Sources and Uses | |||||||||||||
| Sources | Proceeds | % of Total | Uses | Proceeds | % of Total | ||||||||
| Whole Loan | $78,750,000 | 47.6% | Purchase Price | $139,500,000 | 84.4% | ||||||||
| Borrower Sponsor Equity | 77,225,947 | 46.7 | Closing Costs(6) | 14,842,004 | 9.0 | ||||||||
| Other Sources(4) | 9,356,000 | 5.7 | Upfront Reserves(4) | 10,989,943 | 6.6 | ||||||||
| Total Sources | $165,331,947 | 100.0% | Total Uses | $165,331,947 | 100.0% | ||||||||
| (1) | The 333 South Spruce Street Mortgage Loan (as defined below) is part of the 333 South Spruce Street Whole Loan (as defined below) which is comprised of two pari passu promissory notes with an aggregate original principal balance and Cut-off Date Balance of $78,750,000. The 333 South Spruce Street Whole Loan was originated by Citi Real Estate Funding Inc. (“CREFI”). The Financial Information in the chart above is based on the aggregate outstanding principal balance of the 333 South Spruce Street Whole Loan. |
| (2) | The borrower has the option to prepay the 333 South Spruce Street Whole Loan in whole but not in part (i) on or after the payment date occurring in July 2028 without the payment of any prepayment premium or (ii) at any time other than the period commencing 90 days prior to an anticipated securitization of any portion of the 333 South Spruce Whole Loan and ending 90 days after the closing of such securitization with the payment of a prepayment fee equal to the greater of 1.00% of the amount prepaid and a yield maintenance premium. The assumed prepayment lockout period of three payments is based on the closing date of the Benchmark 2024-V5 securitization in January 2024. The actual lockout period may be longer. |
| (3) | See “Initial and Ongoing Reserves” below. |
| (4) | Initial Other reserves and Other Sources represent a $9,356,000 security deposit reserve in the form of a letter of credit which accounts for approximately one-year rent. |
| (5) | Historical financials are not available because the 333 South Spruce Street Property (as defined below) was recently acquired and subsequently leased to an affiliate of the borrower in December 2023. |
| (6) | Closing Costs includes a rate buydown fee of $3,937,500. |
| THE INFORMATION IN THIS STRUCTURAL AND COLLATERAL TERM SHEET IS NOT COMPLETE AND MAY BE AMENDED PRIOR TO THE TIME OF SALE. THIS TERM SHEET IS NOT AN OFFER TO SELL THESE SECURITIES AND IT IS NOT A SOLICITATION OF AN OFFER TO BUY THESE SECURITIES IN ANY JURISDICTION WHERE THE OFFER OR SALE IS NOT PERMITTED. | ||
| 79 | ||
Industrial – Warehouse/Distribution 333 South Spruce Street Manteno, IL 60950 |
Collateral Asset Summary – Loan No.7 333 South Spruce Street |
Cut-off Date Balance: Cut-off Date LTV: U/W NCF DSCR: U/W NOI Debt Yield: |
$50,000,000 56.0% 1.65x 11.3% |
The Loan. The seventh largest mortgage loan (the “333 South Spruce Street Mortgage Loan”) is part of a whole loan (the “333 South Spruce Street Whole Loan”) secured by the borrower’s fee interest in an industrial warehouse and distribution center totaling 1,546,575 square feet located in Manteno, Illinois (the “333 South Spruce Street Property”). The 333 South Spruce Street Whole Loan is comprised of two pari passu notes, with an aggregate outstanding principal balance as of the Cut-off Date of $78,750,000. The 333 South Spruce Street Whole Loan was originated on December 15, 2023 by CREFI and accrues interest at a fixed rate of 6.60000% per annum. The 333 South Spruce Street Whole Loan has an initial term of five-years and is interest-only for the full term. The scheduled maturity date of the 333 South Spruce Street Whole Loan is the payment date that occurs on January 6, 2029. The 333 South Spruce Street Mortgage Loan is evidenced by the controlling Note A-1 with an outstanding principal balance as of the Cut-off Date of $50,000,000.
The table below summarizes the promissory notes that comprise the 333 South Spruce Street Whole Loan. The relationship between the holders of the 333 South Spruce Street Whole Loan will be governed by a co-lender agreement as described under “Description of the Mortgage Pool— The Whole Loans—The Serviced Pari Passu Whole Loans” in the Preliminary Prospectus.
| Whole Loan Summary | ||||
| Note | Original Balance | Cut-off Date Balance | Note Holder | Controlling Piece |
| A-1 | $50,000,000 | $50,000,000 | Benchmark 2024-V5 | Yes |
| A-2 | $28,750,000 | $28,750,000 | CREFI(1) | No |
| Whole Loan | $78,750,000 | $78,750,000 | ||
| (1) | Expected to be contributed to one or more future securitization transactions or may otherwise be transferred at any time. |
The Property. The 333 South Spruce Street Property is a 1,546,575 square foot Class A industrial warehouse and distribution facility located at 333 South Spruce Street in Manteno, Illinois. The 333 South Spruce Street Property is located off Interstate 57, approximately 50 miles south of Chicago, Illinois. As of January 6, 2024, the 333 South Spruce Street Property was 100.0% leased to Gotion Illinois New Energy, Inc. (“Gotion”), which commenced a 15-year triple net lease in December 2023 with a scheduled expiration date of November 30, 2038 and no termination options. The nonrecourse carveout guarantor, Gotion, Inc., a California corporation, an affiliate of the borrower, delivered a guaranty of such lease. The 333 South Spruce Street Property was constructed in 1991 and is situated on an approximately 153.0-acre site. The 333 South Spruce Street Property consists of a single-story facility that features 35’ clear heights, 88 exterior docks, three drive-in doors and 981 concrete paved truck trailer stalls. The 333 South Spruce Street Property also contains office space which comprises approximately 1.0% of net rentable area and a 250 square foot guard house. The 333 South Spruce Street Property also contains 586 parking spaces resulting in a parking ratio of 0.38 spaces per 1,000 square feet.
Sole Tenant. The 333 South Spruce Street Property is 100.0% occupied to a single tenant, Gotion, an affiliate of the borrower, that is pursuant to a triple net lease with a commencement date of December 1, 2023, and a scheduled expiration date of November 30, 2038. The Gotion lease has one, five-year renewal option and no termination options. Gotion specializes in the design and manufacturing of lithium-ion powered batteries and clean energy storage applications. Gotion intends to focus on lithium-ion battery cells for electric vehicles at the 333 South Spruce Street Property.
The following table presents certain information relating to the sole tenant at the 333 South Spruce Street Property:
| Tenant Summary(1) | |||||||||
|
Tenant |
Credit Rating (Moody’s/ S&P/Fitch) |
Net Rentable Area (SF) | % of Net Rentable Area | U/W Base Rent |
U/W Base Rent Per SF |
% of Total U/W Base Rent | Lease Expiration | Termination Option (Y/N) | Renewal Option |
| Gotion | NR/NR/NR | 1,546,575 | 100.0% | $9,356,779 | $6.05 | 100.0% | 11/30/2038 | N | 1 x 5 Yr |
| Total Occupied | 1,546,575 | 100.0% | $9,356,779 | $6.05 | 100.0% | ||||
| Vacant | 0 | 0.0 | |||||||
| Total | 1,546,575 | 100.0% | |||||||
| (1) | Based on the underwritten rent roll dated January 6, 2024. |
| THE INFORMATION IN THIS STRUCTURAL AND COLLATERAL TERM SHEET IS NOT COMPLETE AND MAY BE AMENDED PRIOR TO THE TIME OF SALE. THIS TERM SHEET IS NOT AN OFFER TO SELL THESE SECURITIES AND IT IS NOT A SOLICITATION OF AN OFFER TO BUY THESE SECURITIES IN ANY JURISDICTION WHERE THE OFFER OR SALE IS NOT PERMITTED. | ||
| 80 | ||
Industrial – Warehouse/Distribution 333 South Spruce Street Manteno, IL 60950 |
Collateral Asset Summary – Loan No.7 333 South Spruce Street |
Cut-off Date Balance: Cut-off Date LTV: U/W NCF DSCR: U/W NOI Debt Yield: |
$50,000,000 56.0% 1.65x 11.3% |
The following table presents certain information relating to the lease rollover schedule at the 333 South Spruce Street Property, based on initial lease expiration dates:
| Lease Rollover Schedule(1) | |||||||
| Year Ending December 31 | Expiring Owned GLA | % of Owned GLA | Cumulative % of Owned GLA | U/W Base Rent | % of Total U/W Base Rent | U/W Base Rent $ per SF | # of Expiring Leases |
| MTM | 0 | 0.0% | 0.0% | $0 | 0.0% | $0.00 | 0 |
| 2024 | 0 | 0.0 | 0.0% | 0 | 0.0 | 0.00 | 0 |
| 2025 | 0 | 0.0 | 0.0% | 0 | 0.0 | 0.00 | 0 |
| 2026 | 0 | 0.0 | 0.0% | 0 | 0.0 | 0.00 | 0 |
| 2027 | 0 | 0.0 | 0.0% | 0 | 0.0 | 0.00 | 0 |
| 2028 | 0 | 0.0 | 0.0% | 0 | 0.0 | 0.00 | 0 |
| 2029 | 0 | 0.0 | 0.0% | 0 | 0.0 | 0.00 | 0 |
| 2030 | 0 | 0.0 | 0.0% | 0 | 0.0 | 0.00 | 0 |
| 2031 | 0 | 0.0 | 0.0% | 0 | 0.0 | 0.00 | 0 |
| 2032 | 0 | 0.0 | 0.0% | 0 | 0.0 | 0.00 | 0 |
| 2033 | 0 | 0.0 | 0.0% | 0 | 0.0 | 0.00 | 0 |
| 2034 | 0 | 0.0 | 0.0% | 0 | 0.0 | 0.00 | 0 |
| 2035 & Thereafter | 1,546,575 | 100.0% | 100.0% | 9,356,779 | 100.0 | 6.05 | 1 |
| Vacant | 0 | 0.0 | 100.0% | NAP | NAP | NAP | NAP |
| Total / Wtd. Avg. | 1,546,575 | 100.0% | $9,356,779 | 100.0% | $6.05 | 1 | |
| (1) | Based on underwritten rent roll dated January 6, 2024. |
The following table presents certain information relating to the Underwritten Net Cash Flow at the 333 South Spruce Street Property:
| Cash Flow Analysis(1)(2) | ||
| U/W | U/W Per SF | |
| Base Rent | $9,356,779 | $6.05 |
| Gross Potential Rent | $9,356,779 | $6.05 |
| Total Reimbursements | 274,491 | 0.18 |
| Total Gross Income | $9,631,270 | $6.23 |
| (Vacancy / Credit Loss) | (481,563) | (0.31) |
| Effective Gross Income | $9,149,706 | $5.92 |
| Management Fee | 274,491 | 0.18 |
| Real Estate Taxes | 0 | 0.00 |
| Insurance | 0 | 0.00 |
| Total Expenses(3) | $274,491 | $0.18 |
| Net Operating Income | $8,875,215 | $5.74 |
| Capital Expenditures | 154,658 | 0.10 |
| TI/LC | 0 | 0.00 |
| Net Cash Flow | $8,720,558 | $5.64 |
| Occupancy (%) | 95.0% | |
| NCF DSCR(4) | 1.65x | |
| NOI Debt Yield(4) | 11.3% | |
| (1) | Based on the underwritten rent roll dated as of January 6, 2024. |
| (2) | Historical financial information is not available because the borrower sponsor acquired and subsequently leased the 333 South Spruce Street Property to an affiliate of the borrower in December 2023. |
| (3) | Total Expenses are underwritten based on Gotion’s absolute triple net lease. As a result, there are no underwritten real estate taxes or insurance. |
| (4) | Based on the 333 South Spruce Street Whole Loan. |
| THE INFORMATION IN THIS STRUCTURAL AND COLLATERAL TERM SHEET IS NOT COMPLETE AND MAY BE AMENDED PRIOR TO THE TIME OF SALE. THIS TERM SHEET IS NOT AN OFFER TO SELL THESE SECURITIES AND IT IS NOT A SOLICITATION OF AN OFFER TO BUY THESE SECURITIES IN ANY JURISDICTION WHERE THE OFFER OR SALE IS NOT PERMITTED. | ||
| 81 | ||
Industrial – Warehouse/Distribution 333 South Spruce Street Manteno, IL 60950 |
Collateral Asset Summary – Loan No.7 333 South Spruce Street |
Cut-off Date Balance: Cut-off Date LTV: U/W NCF DSCR: U/W NOI Debt Yield: |
$50,000,000 56.0% 1.65x 11.3% |
Appraisal. According to the appraisal, the 333 South Spruce Street Property had an “as-is” appraised value of $140,700,000 as of October 20, 2023 and a hypothetical market value “as dark” of $112,200,000 as of October 20, 2023. The table below shows the appraiser’s “as-is” conclusions. Based on the “as dark” value of $112,200,000, the Cut-off Date LTV and Maturity Date LTV for the 333 South Spruce Street Whole Loan are 70.2%.
| 333 South Spruce Street Appraised Value(1) | ||
| Property | Value | Capitalization Rate |
| 333 South Spruce Street | $140,700,000 | 6.50% |
| (1) | Source: Appraisal. |
Environmental Matters. According to the Phase I environmental report, dated August 8, 2023, there was no evidence of any recognized environmental conditions at the 333 South Spruce Street Property.
The Market. The 333 South Spruce Street Property is located in Manteno, Illinois within Kankakee County. Kankakee County is approximately 50 miles south of Chicago, Illinois. The 333 South Spruce Street Property is located within the Kankakee Metropolitan Statistical Area (“MSA”). Primary access to the 333 South Spruce Street Property is provided by Route 17 and Route 50, which are both primary commercial roads. Route 17 and Route 50 intersect Interstate 57 which serves as a major north/south route from Chicago, Illinois. The Interstate 57 corridor includes warehouse and distribution facilities for Amazon, Clorox and J.M. Smucker Company.
According to a third-party market research provider, the 333 South Spruce Street Property is located within the Kankakee Industrial Market which reported a total inventory of approximately 13.5 million square feet of industrial space, a vacancy rate of 2.9% and average year to date rental rates as of September 2023 of $5.58 per square foot. There have been 100,000 square feet of net deliveries within the Kankakee Industrial Market over the past three years and there are no projects currently underway.
The Kankakee MSA’s major industries include manufacturing, food processing and pharmaceutical production. The three largest employers in the MSA are Riverside HealthCare, CSL Behring and Shapiro Development Center. According to the appraisal, the 2023 total population within a one-, three- and five-mile radius is 2,152, 10,086 and 19,862, respectively. Furthermore, the 2023 average household income within a one-, three- and five-mile radius is $124,383, $98,658 and $103,416, respectively.
| Summary of Comparable Sales(1) | ||||
| Address | Sale Date | Sale Price | Square Feet | Price per SF |
|
333 South Spruce Street Manteno, Illinois |
Dec – 2023 | $139,500,000 | 1,546,575 SF(2) | $90.20(2) |
|
3835 Youngs Road Channahon, Illinois |
Jan – 2022 | $96,750,000 | 906,517 SF | $106.73 |
|
25101 South Ridgeland Avenue Monee, Illinois |
Apr – 2022 | $85,924,058 | 879,090 SF | $97.74 |
|
1669 Elijah Creek Road Hebron, Kentucky |
Sep – 2022 | $63,005,250 | 600,050 SF | $105.00 |
|
81 & 89 Forest Road Franklin, Indiana |
May – 2022 | $78,250,000 | 948,000 SF | $82.54 |
|
6531 Cochran Road Solon, Ohio |
Jan – 2021 | $26,000,000 | 302,022 SF | $86.09 |
| (1) | Source: Appraisal. |
| (2) | Based on the underwritten rent roll dated January 6, 2024. |
The Borrower and the Borrower Sponsor. The borrower is 333 South Spruce LLC, a Delaware limited liability company and single purpose entity having at least one independent director in its organizational structure. Legal counsel to the borrower delivered a non-consolidation opinion in connection with the origination of the 333 South Spruce Street Whole Loan. The borrower sponsor and non-recourse carveout guarantor is Gotion, Inc. See “Sole Tenant” for more information.
Initial and Ongoing Reserves. At origination of the 333 South Spruce Street Whole Loan, the borrower deposited: (i) approximately $425,726 into a tax reserve, (ii) approximately $217,592 into an insurance reserve, (iii) $950,000 into a replacement reserve, and (iv) $40,625 into an immediate repairs reserve. In addition, at origination of the 333 South Spruce Street Whole Loan, the borrower was required to deliver to lender (to be deposited into a security deposit reserve) all security deposits (and any interest theretofore earned thereon) under all leases at the 333 South Spruce Street Property, and, if requested by the lender, all letters of credit delivered in lieu of a cash security deposit assigned with full power of attorney and executed sight drafts. At origination the letter of credit totaled $9,356,000.
Tax Reserve – The borrower is required to deposit into a real estate tax reserve, on a monthly basis, 1/12 of the taxes that the lender estimates will be payable over the next-ensuing 12-month period (initially estimated to be approximately $85,145).
| THE INFORMATION IN THIS STRUCTURAL AND COLLATERAL TERM SHEET IS NOT COMPLETE AND MAY BE AMENDED PRIOR TO THE TIME OF SALE. THIS TERM SHEET IS NOT AN OFFER TO SELL THESE SECURITIES AND IT IS NOT A SOLICITATION OF AN OFFER TO BUY THESE SECURITIES IN ANY JURISDICTION WHERE THE OFFER OR SALE IS NOT PERMITTED. | ||
| 82 | ||
Industrial – Warehouse/Distribution 333 South Spruce Street Manteno, IL 60950 |
Collateral Asset Summary – Loan No.7 333 South Spruce Street |
Cut-off Date Balance: Cut-off Date LTV: U/W NCF DSCR: U/W NOI Debt Yield: |
$50,000,000 56.0% 1.65x 11.3% |
Insurance Reserve – The borrower is required to deposit into an insurance reserve, on a monthly basis, 1/12 of the amount which will be sufficient to pay the insurance premiums due for the renewal of coverage afforded by such policies (initially estimated to be approximately $217,592).
Replacement Reserve – The borrower is required to deposit into a replacement reserve, on a monthly basis, approximately $12,888.
TI / LC Reserve – During a Trigger Period (as defined below), the borrower is required to deposit into a TI/LC reserve, on a monthly basis, an amount equal to approximately $32,220.
Security Deposit Reserve – The borrower is required to deposit into the security deposit reserve all amounts drawn under any letter of credit held by the borrower in lieu of cash security deposits.
Lockbox / Cash Management The 333 South Spruce Street Whole Loan is structured with a hard lockbox and springing cash management. The borrower is required to, and is required to cause the property manager to, promptly deposit all rents directly into a lender approved lockbox account. Within two business days of origination of the 333 South Spruce Street Whole Loan, the borrower was required to deliver a notice to the sole tenant at the 333 South Spruce Street Property directing the sole tenant to remit all payments under the applicable lease directly to the lender-controlled lockbox. All funds deposited into the lockbox are required to be transferred on each business day to or at the direction of the borrower unless a Trigger Period exists. Upon the occurrence and during the continuance of a Trigger Period, all funds in the lockbox account are required to be swept on each business day to a cash management account under the control of the lender to be applied and disbursed in accordance with the 333 South Spruce Street Whole Loan documents, and all excess cash flow funds remaining in the cash management account after the application of such funds in accordance with the 333 South Spruce Street Whole Loan documents are required to be held by the lender in an excess cash flow reserve account as additional collateral for the 333 South Spruce Street Whole Loan. Upon the cure of the applicable Trigger Period, so long as no other Trigger Period exists, the lender is required to return any amounts remaining on deposit in the excess cash flow reserve account to the borrower. Upon an event of default under the 333 South Spruce Street Whole Loan documents, the lender may apply funds to the debt in such priority as it may determine.
A “Trigger Period” means a period (A) commencing upon the earliest of (i) the occurrence and continuance of an event of default, (ii) the debt service coverage ratio falling below 1.20x (on an interest only basis), (iii) the occurrence of Specified Tenant Trigger Period (as defined below), (iv) the occurrence of a Performance Trigger (as defined below) and/or (v) any cancellation and/or termination of Tax Incentive Program (as defined below), any violation or breach of the terms and conditions of the 333 South Spruce Street Whole Loan documents concerning such Tax Incentive Program, and/or any event which would, directly or indirectly, cause a termination right, cause any termination fees to be due, or would cause a material adverse effect to occur under any Tax Incentive Program, and (B) expiring upon (a) with regard to any Trigger Period commenced in connection with clause (i) above, the cure (if applicable) of such event of default, (b) with regard to any Trigger Period commenced in connection with clause (ii) above, the date that the debt service coverage ratio is equal to or greater than 1.20x (on an interest only basis) for two consecutive calendar quarters, (c) with regard to any Trigger Period commenced in connection with clause (iii) above, a Specified Tenant Trigger Period ceasing to exist, (d) with regard to any Trigger Period commenced in connection with clause (iv) above, a Performance Trigger ceasing to exist, and (e) with regard to any Trigger Period commenced in connection with clause (v) above, the reinstatement of the applicable Tax Incentive Program, cure of the applicable violation or breach, and/or cure of any such event.
A “Specified Tenant” means (i) Gotion, together with any successor, (ii) any replacement tenant of Gotion Tenant approved in accordance with the 333 South Spruce Street Whole Loan documents and (iii) any parent or affiliate thereof providing credit support or a guaranty under the applicable related Specified Tenant lease.
A “Specified Tenant Trigger Period” means a period (A) commencing upon the earliest of (i) Specified Tenant being in monetary default or material non-monetary default under the applicable Specified Tenant lease beyond applicable notice and cure periods, (ii) Specified Tenant failing to be in actual, physical possession of the Specified Tenant space (or applicable portion thereof), or Specified Tenant failing to be open for business during customary hours and/or “going dark” in the Specified Tenant space (or applicable portion thereof), (iii) Specified Tenant subleasing any portion of the Specified Tenant space, (iv) Specified Tenant giving notice that it is terminating its lease for all or any portion of the Specified Tenant space (or applicable portion thereof), (v) any termination or cancellation of any Specified Tenant lease (including, without limitation, rejection in any bankruptcy or similar insolvency proceeding) and/or any Specified Tenant lease failing to otherwise be in full force and effect, and (vi) any bankruptcy or similar insolvency of Specified Tenant, and (B) expiring upon the first to occur of the lender’s receipt of evidence reasonably acceptable to the lender of (1) the satisfaction of the applicable Specified Tenant Cure Conditions (as defined below); or (2) the borrower leasing the entire Specified Tenant space (or applicable portion thereof) pursuant to one or more leases in accordance with the applicable terms and conditions of the 333 South Spruce Street Whole Loan documents, the applicable tenant(s) under such lease(s) being in actual, physical occupancy of the space demised, and, in the lender’s judgment, the applicable Specified Tenant Excess Cash Flow Condition (as defined below) is satisfied in connection therewith.
| THE INFORMATION IN THIS STRUCTURAL AND COLLATERAL TERM SHEET IS NOT COMPLETE AND MAY BE AMENDED PRIOR TO THE TIME OF SALE. THIS TERM SHEET IS NOT AN OFFER TO SELL THESE SECURITIES AND IT IS NOT A SOLICITATION OF AN OFFER TO BUY THESE SECURITIES IN ANY JURISDICTION WHERE THE OFFER OR SALE IS NOT PERMITTED. | ||
| 83 | ||
Industrial – Warehouse/Distribution 333 South Spruce Street Manteno, IL 60950 |
Collateral Asset Summary – Loan No.7 333 South Spruce Street |
Cut-off Date Balance: Cut-off Date LTV: U/W NCF DSCR: U/W NOI Debt Yield: |
$50,000,000 56.0% 1.65x 11.3% |
“Specified Tenant Cure Conditions” means (i) the lender’s receipt of reasonably satisfactory evidence that the Specified Tenant has cured all defaults under the applicable Specified Tenant lease and no other default under such Specified Tenant lease occurs for a period of three consecutive months following such cure, (ii) the applicable Specified Tenant is in actual, physical possession of the Specified Tenant space (or applicable portion thereof) and open for business during customary hours and not “dark” in the Specified Tenant space (or applicable portion thereof), (iii) the applicable Specified Tenant has revoked or rescinded all termination or cancellation notices with respect to the applicable Specified Tenant lease and has re-affirmed the applicable Specified Tenant lease as being in full force and effect, (iv) if applicable, the Specified Tenant is no longer insolvent or subject to any bankruptcy or insolvency proceedings and has affirmed the applicable Specified Tenant lease pursuant to final, non-appealable order of a court of competent jurisdiction, and (v) the applicable Specified Tenant is paying full, unabated rent under the applicable Specified Tenant lease.
“Specified Tenant Excess Cash Flow Condition” means, with respect to curing any Specified Tenant Trigger Period by re-tenanting the applicable Specified Tenant space or renewal/extension of any Specified Tenant lease, sufficient funds have been accumulated in the excess cash flow account and the leasing reserve account (during the continuance of the subject Specified Tenant Trigger Period) to cover all anticipated leasing commissions, tenant improvement costs, tenant allowances, free rent periods, and/or rent abatement periods to be incurred in connection with any such re-tenanting or renewal/extension.
“Performance Trigger” means a period (A) commencing upon, as of any calendar month, the failure of Gotion, to maintain trailing twelve month revenues of at least $300,000,000, and (B) expiring upon Gotion maintaining trailing twelve month revenues of at least $300,000,000 for two consecutive calendar quarters.
“Tax Incentive Program” means that certain Intergovernmental Agreement, dated August 31, 2023 and effective on or about the date of origination of the Mortgage Loan, by the governmental agencies party thereto, pursuant to which real estate taxes in excess of $2,000,000 in each tax year commencing with the 2024 tax year and ending with the 2053 tax year will be abated.
Current Mezzanine or Secured Subordinate Indebtedness. None.
Permitted Future Mezzanine or Secured Subordinate Indebtedness. Not permitted.
Release of Collateral. Not Permitted.
Ground Lease. None.
| THE INFORMATION IN THIS STRUCTURAL AND COLLATERAL TERM SHEET IS NOT COMPLETE AND MAY BE AMENDED PRIOR TO THE TIME OF SALE. THIS TERM SHEET IS NOT AN OFFER TO SELL THESE SECURITIES AND IT IS NOT A SOLICITATION OF AN OFFER TO BUY THESE SECURITIES IN ANY JURISDICTION WHERE THE OFFER OR SALE IS NOT PERMITTED. | ||
| 84 | ||
Retail – Super Regional Mall 1 Garden State Plaza Paramus, NJ 07652 |
Collateral Asset Summary – Loan No. 8 Garden State Plaza |
Cut-off Date Balance: Cut-off Date LTV: U/W NCF DSCR: U/W NOI Debt Yield: |
$45,000,000 28.9% 2.98x 20.2% |

| THE INFORMATION IN THIS STRUCTURAL AND COLLATERAL TERM SHEET IS NOT COMPLETE AND MAY BE AMENDED PRIOR TO THE TIME OF SALE. THIS TERM SHEET IS NOT AN OFFER TO SELL THESE SECURITIES AND IT IS NOT A SOLICITATION OF AN OFFER TO BUY THESE SECURITIES IN ANY JURISDICTION WHERE THE OFFER OR SALE IS NOT PERMITTED. | ||
| 85 | ||
Retail – Super Regional Mall 1 Garden State Plaza Paramus, NJ 07652 |
Collateral Asset Summary – Loan No. 8 Garden State Plaza |
Cut-off Date Balance: Cut-off Date LTV: U/W NCF DSCR: U/W NOI Debt Yield: |
$45,000,000 28.9% 2.98x 20.2% |

| THE INFORMATION IN THIS STRUCTURAL AND COLLATERAL TERM SHEET IS NOT COMPLETE AND MAY BE AMENDED PRIOR TO THE TIME OF SALE. THIS TERM SHEET IS NOT AN OFFER TO SELL THESE SECURITIES AND IT IS NOT A SOLICITATION OF AN OFFER TO BUY THESE SECURITIES IN ANY JURISDICTION WHERE THE OFFER OR SALE IS NOT PERMITTED. | ||
| 86 | ||
Retail – Super Regional Mall 1 Garden State Plaza Paramus, NJ 07652 |
Collateral Asset Summary – Loan No. 8 Garden State Plaza |
Cut-off Date Balance: Cut-off Date LTV: U/W NCF DSCR: U/W NOI Debt Yield: |
$45,000,000 28.9% 2.98x 20.2% |
| Mortgage Loan Information | Property Information | ||||||||
| Loan Sellers: | GSMC, GACC | Single Asset / Portfolio: | Single Asset | ||||||
| Loan Purpose: | Refinance | Property Type – Subtype: | Retail – Super Regional Mall | ||||||
| Borrower Sponsor(s) (1): | Unibail-Rodamco-Westfield and affiliates of The Prudential Assurance Company Limited | Collateral: | Fee | ||||||
| Borrower(s)(1): | Westland Garden State Plaza Limited Partnership | Location: | Paramus, NJ | ||||||
| Original Balance(2): | $45,000,000 | Year Built / Renovated: | 1957 / 1981, 1986, 1993, 1994, 2014, 2017, 2021 | ||||||
| Cut-off Date Balance(2): | $45,000,000 | Property Management: | Westfield Property Management LLC | ||||||
| % by Initial UPB: | 5.1% | Size(7): | 2,057,906 SF | ||||||
| Interest Rate(3): | 6.61300% | Appraised Value / Per SF: | $1,814,000,000 / $881 | ||||||
| Note Date: | December 11, 2023 | Appraisal Date: | October 23, 2023 | ||||||
| Original Term: | 60 months | Occupancy(8): | 94.9% (as of September 13, 2023) | ||||||
| Amortization: | Interest Only | UW Economic Occupancy: | 92.1% | ||||||
| Original Amortization: | NAP | Underwritten NOI: | $105,902,693 | ||||||
| Interest Only Period: | 60 months | Underwritten NCF: | $104,725,782 | ||||||
| First Payment Date: | February 6, 2024 | ||||||||
| Maturity Date: | January 6, 2029 | Historical NOI | |||||||
| Additional Debt Type(2): | Pari Passu | Most Recent NOI: | $97,794,310 (TTM September 30, 2023) | ||||||
| Additional Debt Balance(2): | $480,000,000 | 2022 NOI: | $96,638,742 | ||||||
| Call Protection(4): | L(24),DorYM1(29),O(7) | 2021 NOI: | $99,169,720 | ||||||
| Lockbox / Cash Management: | Hard / Springing | 2020 NOI: | $83,636,399 | ||||||
| Reserves(5) | Financial Information(2) | ||||||||
| Initial | Monthly | Cap | Cut-off Date Loan / SF: | $255 | |||||
| Taxes: | $0 | Springing | NAP | Maturity Date Loan / SF: | $255 | ||||
| Insurance: | $0 | Springing | NAP | Cut-off Date LTV: | 28.9% | ||||
| Replacement Reserves: | $0 | Springing | $367,747 | Maturity Date LTV: | 28.9% | ||||
| TI / LC: | $0 | Springing | $1,838,735 | UW NOI DY: | 20.2% | ||||
| Other(6): | $0(4) | $0 | NAP | UW NCF DSCR: | 2.98x | ||||
| Sources and Uses | |||||||||
| Sources | Proceeds | % of Total | Uses | Proceeds | % of Total | ||||
| Whole Loan(2) | $525,000,000 | 98.4% | Loan Payoff | $526,745,637 | 98.7% | ||||
| Equity Contribution | 8,659,157 | 1.6 | Closing Costs | 6,913,520 | 1.3 | ||||
| Total Sources | $533,659,157 | 100.0% | Total Uses | $533,659,157 | 100.0% | ||||
| (1) | There is no non-recourse carveout guarantor with respect to the Garden State Plaza Whole Loan (as defined below). |
| (2) | The Garden State Plaza Mortgage Loan (as defined below) is part of the Garden State Plaza Whole Loan, which is evidenced by ten pari passu promissory notes with an aggregate principal balance as of the Cut-off Date of $525,000,000. The Financial Information in the chart above is based on the aggregate principal balance of the promissory notes comprising the Garden State Plaza Whole Loan. |
| (3) | For purposes of calculating interest and other amounts payable on the Garden State Plaza Whole Loan, each note was divided into multiple components with varying interest rates. The interest rate of the Garden State Plaza Whole Loan represents the approximate weighted average interest rate of three components. Prepayments of the Garden State Plaza Whole Loan will be applied to the components in sequential order. As a result of the components having different interest rates and the allocation of prepayments to sequentially reduce the components, the per annum weighted average interest rate of the components (and, therefore, the interest rate of the Garden State Plaza Whole Loan) may increase over time. |
| (4) | Voluntary prepayment with yield maintenance or defeasance of the Garden State Plaza Whole Loan is permitted at any time after the date that is the earliest to occur of (i) two years after the closing date of the securitization that includes the last Garden State Plaza Whole Loan note to be securitized and (ii) December 11, 2026 (or in the case of prepayments to cure a Cash Management Sweep Period or Trigger Period, at any time after the origination date). The assumed lockout period of 24 payments is based on the anticipated closing date of the Benchmark 2024-V5 securitization trust in January 2024. The actual lockout period may be longer. |
| (5) | See “Initial and Ongoing Reserves.” |
| (6) | Other Reserves were not funded at closing; a reserve guaranty was provided in lieu. |
| (7) | Size includes the Lord & Taylor box, specialty tenants and excludes two free-standing units (Best Buy & Bank of America) that are set to be demolished (such free-standing units were not included in the underwritten rent roll). 832,083 SF of the Size is related to tenants on ground leases, including Macy’s, Neiman Marcus, Nordstrom, and Chilis/On The Border. |
| (8) | Included in the occupancy figures is Papaya (8,531 SF / 0.4% of Size). Papaya executed their lease in January 2022 but never took occupancy at the Garden State Plaza Property. There is no U/W total rent attributed to the failed Papaya occupancy. Occupancy is 91.0% when excluding ground lease tenants and Lord & Taylor and 81.3% while excluding ground lease tenants and including the Lord & Taylor box and treating the box as vacant. Occupancy is 88.9% when including ground lease tenants and Lord & Taylor box and treating the box as vacant. |
| THE INFORMATION IN THIS STRUCTURAL AND COLLATERAL TERM SHEET IS NOT COMPLETE AND MAY BE AMENDED PRIOR TO THE TIME OF SALE. THIS TERM SHEET IS NOT AN OFFER TO SELL THESE SECURITIES AND IT IS NOT A SOLICITATION OF AN OFFER TO BUY THESE SECURITIES IN ANY JURISDICTION WHERE THE OFFER OR SALE IS NOT PERMITTED. | ||
| 87 | ||
Retail – Super Regional Mall 1 Garden State Plaza Paramus, NJ 07652 |
Collateral Asset Summary – Loan No. 8 Garden State Plaza |
Cut-off Date Balance: Cut-off Date LTV: U/W NCF DSCR: U/W NOI Debt Yield: |
$45,000,000 28.9% 2.98x 20.2% |
The Loan. The eighth largest mortgage loan (the “Garden State Plaza Mortgage Loan”) is part of a whole loan (the “Garden State Plaza Whole Loan”) evidenced by ten pari passu notes that are secured by the borrower’s fee interests in an 2,057,906 square foot retail property located in Paramus, New Jersey (the “Garden State Plaza Property”). The Garden State Plaza Mortgage Loan, which is evidenced by the non-controlling notes A-1-C1, A-1-C2 and A-2-C1, has an aggregate outstanding principal balance as of the Cut-off Date of $45,000,000. The Garden State Plaza Whole Loan was co-originated by Goldman Sachs Bank USA (“GSBI”), German American Capital Corporation (“GACC”) and Natixis Real Estate Capital LLC (“NREC”) and has an aggregate outstanding principal balance as of the Cut-off Date of $525,000,000. The Garden State Plaza Whole Loan has a five-year interest-only term and accrues interest at a fixed rate of 6.61300% per annum. The Garden State Plaza Whole Loan has an initial term of 60 months and has a remaining term of 60 months as of the Cut-off Date. GSMC is selling Notes A-1-C1 and A-1-C2 with an aggregate outstanding principal balance of $30,000,000 as of the Cut-off Date and GACC is selling Note A-2-C1 in the outstanding principal balance of $15,000,000 as of the Cut-off Date, to the Benchmark 2024-V5 securitization transaction.
The table below summarizes the promissory notes that comprise the Garden State Plaza Whole Loan. The relationship between the holders of the Garden State Plaza Whole Loan is governed by a co-lender agreement as described under “Description of the Mortgage Pool—The Whole Loans—The Non-Serviced Pari Passu Whole Loans” in the Preliminary Prospectus.
| Whole Loan Summary | ||||
| Note | Original Balance | Cut-off Date Balance | Note Holder | Controlling Piece |
| A-1-S1 | $170,000,000 | $170,000,000 | NJ Trust 2023-GSP | Yes |
| A-2-S1 | 127,500,000 | 127,500,000 | NJ Trust 2023-GSP | No |
| A-3-S1 | 127,500,000 | 127,500,000 | NJ Trust 2023-GSP | No |
| A-1-C1 | 20,000,000 | 20,000,000 | Benchmark 2024-V5 | No |
| A-1-C2 | 10,000,000 | 10,000,000 | Benchmark 2024-V5 | No |
| A-1-C3 | 10,000,000 | 10,000,000 | GSBI(1) | No |
| A-2-C1 | 15,000,000 | 15,000,000 | Benchmark 2024-V5 | No |
| A-2-C2 | 15,000,000 | 15,000,000 | GACC(1) | No |
| A-3-C1 | 15,000,000 | 15,000,000 | NREC(1) | No |
| A-3-C2 | 15,000,000 | 15,000,000 | NREC(1) | No |
| Whole Loan | $525,000,000 | $525,000,000 | ||
| (1) | Expected to be contributed to one or more future securitization trust(s). |
The Property. The Garden State Plaza Property is a 2,057,906 SF super-regional mall featuring a mix of retail and entertainment tenants. The Garden State Plaza Property is located at the cross section of Route 4, Route 17, and the Garden State Parkway, which, combined, see over approximately 105,000 vehicles per day, providing both nearby residents and visitors accessibility to the Garden State Plaza Property’s roster of over 300 tenants, which includes three leased fee department stores (Macy’s / Neiman Marcus / Nordstrom).
As of October 2023 TTM, the Garden State Plaza Property achieved approximately $893 million in total sales with in-line <10,000 SF comparable sales of $1,034 PSF during the same period despite most tenants being closed on Sundays due to the “blue laws” in Bergen County, New Jersey, which prohibit the sale of most consumer discretionary goods on Sundays. In-line <10,000 SF comparable sales increased 50.7% from 2020 sales of $686 PSF. According to a third party data analytics firm which tracks foot traffic, the Garden State Plaza Property is home to the 11th ranked AMC in the United States, generating nearly $15.9 million in sales over October 2023 TTM (approximately $996,000 per screen), as well as the 5th ranked Macy’s, 9th ranked Nordstrom and 12th ranked Neiman Marcus.
The borrower sponsors have contributed significant capital to the Garden State Plaza Property in recent years, including approximately $250 million in capital expenditures since 2017. The borrower recently signed leases with entertainment and food and beverage tenants, including Pinstripes, Nerf Action Experience, Planet Playskool, and Fogo de Chão. Nerf Action Experience has not yet taken occupancy, and we cannot assure you that the tenant will do so as expected or at all.
Major Tenants.
Macy’s (439,632 SF; 22.0% of Net Rentable Area (“NRA”); 10.6% of underwritten base rent): Macy’s is an American department store chain featuring the Macy’s Bloomingdale’s and Bluemercury nameplates. Founded in 1858 as a dry goods store in New York City, Macy’s has 784 boxes at 723 locations as of October 28, 2023. Macy’s has been a tenant at the Garden State Plaza Property since 1957. NRA includes four ground lease tenants and the Lord & Taylor box (130,000 SF) that is expected to be redeveloped and excludes specialty tenants (including temporary tenants, RMUs / Carts, Specialty Tenants, ATMs, Trash and Non-Leasable Space).
AMC (95,818 SF; 4.8% of NRA; 4.1% of underwritten base rent): AMC is the largest movie exhibition company in the world. Founded in 1920, AMC owned or operated approximately 900 theaters and 10,000 screens across the globe as of June 30, 2023. AMC has been a tenant at the Garden State Plaza Property since 2005.
| THE INFORMATION IN THIS STRUCTURAL AND COLLATERAL TERM SHEET IS NOT COMPLETE AND MAY BE AMENDED PRIOR TO THE TIME OF SALE. THIS TERM SHEET IS NOT AN OFFER TO SELL THESE SECURITIES AND IT IS NOT A SOLICITATION OF AN OFFER TO BUY THESE SECURITIES IN ANY JURISDICTION WHERE THE OFFER OR SALE IS NOT PERMITTED. | ||
| 88 | ||
Retail – Super Regional Mall 1 Garden State Plaza Paramus, NJ 07652 |
Collateral Asset Summary – Loan No. 8 Garden State Plaza |
Cut-off Date Balance: Cut-off Date LTV: U/W NCF DSCR: U/W NOI Debt Yield: |
$45,000,000 28.9% 2.98x 20.2% |
Zara (23,573 SF; 1.2% of NRA; 4.0% of underwritten base rent): Zara is a Spanish multinational retail clothing chain. Founded in 1975, Zara had 2,237 locations as of October 31, 2023. Zara has been a tenant at the Garden State Plaza Property since 2016.
The following table presents certain information relating to the tenants (of which, certain tenants may have cotenancy provisions) at the Garden State Plaza Property:
| Tenant Summary(1)(2) | ||||||||||||
|
Tenant |
Credit Rating (Moody’s/ S&P/Fitch)(3) |
Net Rentable Area (SF) | % of Net Rentable Area | U/W Base Rent |
U/W Base Rent Per SF |
% of Total U/W Base Rent | Lease Expiration | Termination Option (Y/N) | Renewal Options | |||
| Macy's | Ba2/BB+/BBB- | 439,632 | 22.0 | % | $8,245,410 | $18.76 | 10.6 | % | 7/31/2026 | N | 7 x 7 Yr | |
| AMC | Caa2/CCC+/NR | 95,818 | 4.8 | 3,209,903 | $33.50 | 4.1 | 5/31/2027 | N | 4 x 5 Yr | |||
| Zara | NR/NR/NR | 23,573 | 1.2 | 3,113,286 | $132.07 | 4.0 | 10/31/2026 | N | None | |||
| Nordstrom | Ba1/BB+/BB+ | 245,348 | 12.3 | 2,562,525 | $10.44 | 3.3 | 7/31/2026 | N | 6 x 10 Yr | |||
| H&M | NR/BBB/NR | 23,851 | 1.2 | 2,138,242 | $89.65 | 2.8 | 1/31/2026 | N | None | |||
| Victoria's Secret | B1/BB-/NR | 13,927 | 0.7 | 1,531,274 | $109.95 | 2.0 | 1/31/2026 | N | None | |||
| Gap | B1/BB/NR | 11,744 | 0.6 | 1,376,044 | $117.17 | 1.8 | 6/30/2026 | N | None | |||
| Express/Express Men | NR/NR/NR | 9,999 | 0.5 | 1,298,270 | $129.84 | 1.7 | 1/31/2027 | N | None | |||
| Hollister | NR/BB-/NR | 9,329 | 0.5 | 1,182,973 | $126.81 | 1.5 | 1/31/2024 | N | None | |||
| Gucci | NR/A/NR | 6,231 | 0.3 | 661,047 | $106.09 | 0.9 | 1/31/2033 | N | None | |||
| Largest Tenants | 879,452 | 44.1 | % | $25,318,974 | $28.79 | 32.6 | % | |||||
| Remaining Occupied | 886,981 | 44.4 | 52,358,944 | $59.03 | 67.4 | |||||||
| Total Occupied | 1,766,433 | 88.5 | % | $77,677,918 | $43.97 | 100.0 | % | |||||
| Vacant | 229,113 | 11.5 | ||||||||||
| Total | 1,995,546 | 100.0 | % | |||||||||
| (1) | Based on the underwritten rent roll dated September 13, 2023, inclusive of contractual rent steps through December 31, 2024. |
| (2) | Includes four ground lease tenants and the Lord & Taylor box (130,000 SF) that is expected to be redeveloped. Excludes specialty tenants (including temporary tenants, RMUs / Carts, Specialty Tenants, ATMs, Trash and Non-Leasable Space). |
| (3) | Certain ratings are those of the parent company whether or not the parent guarantees the lease. |
The following table presents certain information relating to the lease rollover schedule at the Garden State Plaza Property, based on the initial lease expiration dates:
| Lease Rollover Schedule(1)(2)(3)(4) | |||||||||
| Year Ending December 31 | Expiring Owned GLA | % of Owned GLA | Cumulative % of Owned GLA | U/W Base Rent | % of Total U/W Base Rent | U/W Base Rent $ per SF | # of Expiring Leases | ||
| MTM | 15,015 | 0.8 | % | 0.8% | $1,524,784 | 2.0 | % | $101.55 | 9 |
| 2023 | 5,742 | 0.3 | 1.0% | 411,442 | 0.5 | 71.65 | 3 | ||
| 2024 | 146,113 | 7.3 | 8.4% | 10,891,053 | 14.0 | 74.54 | 41 | ||
| 2025 | 114,472 | 5.7 | 14.1% | 8,013,601 | 10.3 | 70.00 | 34 | ||
| 2026 | 842,236 | 42.2 | 56.3% | 24,775,533 | 31.9 | 29.42 | 41 | ||
| 2027 | 137,733 | 6.9 | 63.2% | 7,712,433 | 9.9 | 56.00 | 18 | ||
| 2028 | 94,184 | 4.7 | 67.9% | 6,379,937 | 8.2 | 67.74 | 26 | ||
| 2029 | 30,826 | 1.5 | 69.5% | 2,415,433 | 3.1 | 78.36 | 13 | ||
| 2030 | 18,855 | 0.9 | 70.4% | 1,520,902 | 2.0 | 80.66 | 8 | ||
| 2031 | 28,244 | 1.4 | 71.8% | 1,582,656 | 2.0 | 56.04 | 10 | ||
| 2032 | 60,822 | 3.0 | 74.9% | 4,832,928 | 6.2 | 79.46 | 14 | ||
| 2033 | 35,832 | 1.8 | 76.7% | 2,649,518 | 3.4 | 73.94 | 9 | ||
| 2034 | 14,723 | 0.7 | 77.4% | 1,333,891 | 1.7 | 90.60 | 7 | ||
| 2035 & Thereafter | 221,636 | 11.1 | 88.5% | 3,633,809 | 4.7 | 16.40 | 4 | ||
| Vacant | 229,113 | 11.5 | 100.0% | NAP | NAP | NAP | NAP | ||
| Total / Wtd. Avg. | 1,995,546 | 100.0 | % | $77,677,918 | 100.0 | % | $43.97 | 237 | |
| (1) | Based on the underwritten rent roll dated September 13, 2023, inclusive of contractual rent steps through December 31, 2024. |
| (2) | Lease Rollover Schedule is based on the lease expiration dates of all direct leases in place. Certain tenants have more than one lease. |
| (3) | Certain tenants may have lease termination options that are exercisable prior to the originally stated expiration date of the related lease and are not considered in the lease rollover schedule. |
| (4) | Includes four ground lease tenants and the Lord & Taylor box (130,000 SF) that is expected to be redeveloped. Excludes specialty tenants (including temporary tenants, RMUs / Carts, Specialty Tenants, ATMs, Trash and Non-Leasable Space). |
| THE INFORMATION IN THIS STRUCTURAL AND COLLATERAL TERM SHEET IS NOT COMPLETE AND MAY BE AMENDED PRIOR TO THE TIME OF SALE. THIS TERM SHEET IS NOT AN OFFER TO SELL THESE SECURITIES AND IT IS NOT A SOLICITATION OF AN OFFER TO BUY THESE SECURITIES IN ANY JURISDICTION WHERE THE OFFER OR SALE IS NOT PERMITTED. | ||
| 89 | ||
Retail – Super Regional Mall 1 Garden State Plaza Paramus, NJ 07652 |
Collateral Asset Summary – Loan No. 8 Garden State Plaza |
Cut-off Date Balance: Cut-off Date LTV: U/W NCF DSCR: U/W NOI Debt Yield: |
$45,000,000 28.9% 2.98x 20.2% |
The following table presents certain information relating to the historical operating performance and Underwritten Net Cash Flow at the Garden State Plaza Property:
| Cash Flow Analysis | ||||||
| 2020 | 2021 | 2022 | Sept 2023 TTM | U/W | U/W Per SF | |
| Base Rent(1) | $70,561,683 | $62,653,106 | $72,900,770 | $74,113,270 | $77,677,918 | $37.75 |
| Credit Tenant Rent Steps | 0 | 0 | 0 | 0 | 479,516 | 0.23 |
| Gross Up Vacancy | 0 | 0 | 0 | 0 | 12,415,019 | 6.03 |
| Gross Potential Rent | $70,561,683 | $62,653,106 | $72,900,770 | $74,113,270 | $90,572,453 | $44.01 |
| Total Reimbursements | 41,338,653 | 41,537,014 | 43,871,404 | 45,341,052 | 45,761,082 | 22.24 |
| Other Income(2) | 18,699,061 | 25,100,491 | 19,573,269 | 20,512,274 | 20,185,999 | 9.81 |
| Net Rental Income | $130,599,397 | $129,290,611 | $136,345,443 | $139,966,597 | $156,519,534 | $76.06 |
| Vacancy/Credit Loss | (10,396,417) | 6,311,699 | (1,395,330) | (2,667,966) | (12,415,019) | (6.03) |
| Effective Gross Income | $120,202,980 | $135,602,310 | $134,950,113 | $137,298,631 | $144,104,515 | $70.02 |
| Management Fee | 1,000,000 | 1,000,000 | 1,000,000 | 1,000,000 | 1,000,000 | 0.49 |
| Real Estate Taxes | 17,474,349 | 17,095,850 | 17,793,973 | 18,650,118 | 17,347,618 | 8.43 |
| Insurance | 1,136,549 | 1,343,689 | 790,774 | 1,213,905 | 1,213,905 | 0.59 |
| Other Expenses(3) | 16,955,684 | 16,993,051 | 18,726,625 | 18,640,298 | 18,640,298 | 9.06 |
| Total Expenses | $36,566,582 | $36,432,590 | $38,311,371 | $39,504,321 | $38,201,821 | $18.56 |
| Net Operating Income | $83,636,399 | $99,169,720 | $96,638,742 | $97,794,310 | $105,902,693 | $51.46 |
| Capital Expenditures | 0 | 0 | 0 | 0 | 245,165 | 0.12 |
| TI/LC | 0 | 0 | 0 | 0 | 931,746 | 0.45 |
| Net Cash Flow | $83,636,399 | $99,169,720 | $96,638,742 | $97,794,310 | $104,725,782 | $50.89 |
| Occupancy(4) | 95.0% | 94.2% | 94.6% | N/A | 94.9% | |
| NCF DSCR(5) | 2.38x | 2.82x | 2.75x | 2.78x | 2.98x | |
| NOI Debt Yield(5) | 15.9% | 18.9% | 18.4% | 18.6% | 20.2% | |
| (1) | Based on the underwritten rent roll dated September 13, 2023, inclusive of contractual rent steps through December 31, 2024. |
| (2) | Other Income consists of overage rent, specialty revenue, storage income and parking income. |
| (3) | Other Expenses consists of utilities, repairs and maintenance, janitorial, payroll and specialty leasing expenses. |
| (4) | 2020-2022 historical occupancy is based on total mall physical occupancy, excluding Lord & Taylor. U/W occupancy is 94.9% based on the September 13, 2023 rent roll (including signed not occupied tenants and adjusted for recent leasing updates and excluding Lord & Taylor box). |
| (5) | Calculated based on the Garden State Plaza Whole Loan. |
Appraisal. According to the appraisal dated October 23, 2023, the Garden State Plaza Property had an “As-Is” value of $1,814,000,000.
Environmental. The Phase I environmental assessment dated October 31, 2023 and revised as of December 1, 2023 identified a recognized environmental condition related to the existence of seven gasoline and heating oil underground storage tanks at the Garden State Plaza Property in connection with former onsite operations of a gasoline filling station from 1963 to 1989. As of the date of the Phase I environmental assessment a remedial action plan for groundwater was still under review by the New Jersey Department of Environmental Protection. See “Description of the Mortgage Pool—Environmental Considerations” in the Preliminary Prospectus.
The Market. Located in Paramus, NJ, the Garden State Plaza Property’s trade area lies primarily within a 10-mile radius that serves a population of over 2.35 million and over 871,000 households. The Garden State Plaza Property is located in the Route 4 / 17 submarket of the Northern New Jersey market, which is considered an upper tier submarket compared to other submarkets in the Northern New Jersey market and is considered the prime retail corridor in the area according to the appraisal. Both the Route 4 / 17 submarket and the Northern New Jersey market feature vacancy rates of 2.8% and 4.0%, respectively, as of the third quarter of 2023. These vacancy rates have continued to fall post-COVID. Route 4 / 17 submarket vacancy decreased to 2.8% from 5.0% in the third quarter of 2021 while the Northern New Jersey market vacancy rates decreased to 4.0% from 4.3% in the same time period.
The Borrower and the Borrower Sponsors. The borrower is Westland Garden State Plaza Limited Partnership, a Delaware limited partnership with a general partner with two independent directors. The borrower is indirectly controlled and owned by a 50/50 joint venture between an entity controlled by Unibail-Rodamco-Westfield (“URW”) and affiliates of The Prudential Assurance Company Limited (“PACL”). Origination counsel delivered a non-consolidation opinion at origination. The borrower-sponsors are Unibail-Rodamco-Westfield and affiliates of The Prudential Assurance Company Limited. There is no non-recourse carveout guarantor with respect to the Garden State Plaza Whole Loan. URW is an owner, developer and operator of sustainable real estate assets throughout Europe and the United States. URW operates 75 shopping centers in 12 countries, that attract over 900 million visits annually. URW’s current portfolio totals €51 billion, of which 87% is retail.
| THE INFORMATION IN THIS STRUCTURAL AND COLLATERAL TERM SHEET IS NOT COMPLETE AND MAY BE AMENDED PRIOR TO THE TIME OF SALE. THIS TERM SHEET IS NOT AN OFFER TO SELL THESE SECURITIES AND IT IS NOT A SOLICITATION OF AN OFFER TO BUY THESE SECURITIES IN ANY JURISDICTION WHERE THE OFFER OR SALE IS NOT PERMITTED. | ||
| 90 | ||
Retail – Super Regional Mall 1 Garden State Plaza Paramus, NJ 07652 |
Collateral Asset Summary – Loan No. 8 Garden State Plaza |
Cut-off Date Balance: Cut-off Date LTV: U/W NCF DSCR: U/W NOI Debt Yield: |
$45,000,000 28.9% 2.98x 20.2% |
PACL is one of the UK’s leading life and pensions companies and is a significant investor in North America, owning retail and office assets in the USA and also Canadian office and industrial assets. PACL is an experienced real estate investor with £13 billion of assets under management in real estate equity.
Property Management. The Garden State Plaza Property is managed by Westfield Property Management LLC, an affiliate of URW.
Initial and Ongoing Reserves. At origination URW WEA LLC, Aldwych L.P., and Old Kingsway, L.P. (collectively, the “Reserve Guarantors”) delivered a guaranty of $27,864,885.70 to be used for tenant improvements, tenant improvement allowances and leasing commissions that were outstanding under any executed leases that are in effect as of the origination date, and $215,092.91 to be used to make deposits into the deposit account in lieu of any base rent payments abated or not yet begun pursuant to any free rent periods or gap rent periods that were still outstanding under any executed leases that are in effect as of the origination date.
Tax Reserve – During a Cash Management Sweep Period (as defined below), the borrower is required to escrow 1/12th of the estimated annual real estate tax payments or such higher amount necessary to accumulate sufficient funds to pay all such taxes at least ten (10) days prior to their respective due dates.
Insurance Reserve – During a Cash Management Sweep Period, the borrower is required to escrow 1/12th of the estimated insurance payments for the renewal of the insurance policy coverage upon the expiration thereof or such higher amount necessary to accumulate sufficient funds to pay all such insurance premiums at least thirty (30) days prior to the expiration of the applicable insurance policies. Such reserve has been conditionally waived so long as the borrower maintains a blanket policy meeting the requirements of the Garden State Plaza Whole Loan documents, no Event of Default is continuing, the property is not located in a special flood hazard area and the borrower provides evidence of the renewal of any insurance policy prior to the expiration thereof and receipts for the payment of the applicable premiums.
TI/LC Reserve – During a Cash Management Sweep Period, the borrower is required to fund monthly an amount equal to $102,151.92, subject to a cap of $1,838,734.50.
Capital Expenditure Reserve – During a Cash Management Sweep Period, the borrower is required to fund monthly an amount equal to $20,430.38, subject to a cap of $367,746.90.
Lockbox / Cash Management. The Garden State Plaza Whole Loan is structured with a hard lockbox and springing cash management. The borrower is required to direct the tenants to pay rent directly into the lockbox account, and to deposit any rents otherwise received into such account within two business days after receipt. On each monthly payment date during the continuance of a Cash Management Sweep Period, provided that no “Release Cessation Event” (generally consisting of an event of default as to which the lender has taken specified enforcement actions, the appointment of a receiver and various bankruptcy events of the borrower or guarantor, as more fully defined in the related loan agreement) has occurred and is continuing, all funds in the lockbox account are required to be swept on each business day to a cash management account under the control of the lender to be applied and disbursed in accordance with the Garden State Plaza Whole Loan documents, and, if a Trigger Period (as defined below) is continuing, all excess cash flow funds remaining in the cash management account after the application of such funds in accordance with the Garden State Plaza Whole Loan documents are required to be held by the lender in an excess cash flow reserve account as additional collateral for the Garden State Plaza Whole Loan. To the extent that no Trigger Period is continuing, all excess cash flow funds are required to be disbursed to the borrower.
“Cash Management Sweep Period” means a period:
| (a) | from and after the commencement of a Trigger Period, until such time as the related Trigger Period has terminated (provided that no Cash Management Sweep Period remains in effect pursuant to the definition thereof below); or |
| (b) | from and after the occurrence of the debt yield falling below 12.0% in any calendar quarter (tested as of the last day of each calendar quarter) (a “Low Debt Yield Event”), until such time as the debt yield is equal to or greater than 12.0% for two consecutive calendar quarters (tested as of the last day of each calendar quarter) (provided that no Cash Management Sweep Period remains in effect pursuant to clause (a) above). |
| THE INFORMATION IN THIS STRUCTURAL AND COLLATERAL TERM SHEET IS NOT COMPLETE AND MAY BE AMENDED PRIOR TO THE TIME OF SALE. THIS TERM SHEET IS NOT AN OFFER TO SELL THESE SECURITIES AND IT IS NOT A SOLICITATION OF AN OFFER TO BUY THESE SECURITIES IN ANY JURISDICTION WHERE THE OFFER OR SALE IS NOT PERMITTED. | ||
| 91 | ||
Retail – Super Regional Mall 1 Garden State Plaza Paramus, NJ 07652 |
Collateral Asset Summary – Loan No. 8 Garden State Plaza |
Cut-off Date Balance: Cut-off Date LTV: U/W NCF DSCR: U/W NOI Debt Yield: |
$45,000,000 28.9% 2.98x 20.2% |
Notwithstanding the foregoing, in the event that a Cash Management Sweep Period is continuing solely because of a Low Debt Yield Event, the borrower will have the right to cure such Cash Management Sweep Period (without waiting two calendar quarters) by (i) partially prepaying the outstanding principal balance of the Garden State Plaza Whole Loan (provided that, in connection with any such prepayment made during the open period only, no yield maintenance premium will be due on the amount prepaid) in an amount which results in the debt yield being equal to or greater than 12.0%, (ii) depositing cash with the lender as additional reserve funds to hold as additional collateral for the Garden State Plaza Whole Loan in an amount which, if applied to the then outstanding principal balance of the Garden State Plaza Whole Loan, would result in the debt yield being equal to or greater than 12.0%, or (iii) delivering a letter of credit to the lender as additional collateral for the Garden State Plaza Whole Loan in an amount which, if drawn upon and applied to the then outstanding principal balance, would result in the debt yield being equal to or greater than 12.0%.
A “Trigger Period” will commence if (x) the debt yield falls below 11.0% as of the end of any calendar quarter (a “Debt Yield Trigger”), until the debt yield equals or exceeds 11.0% as of the end of two consecutive calendar quarters thereafter or (y) an event of default has occurred until such event of default has been cured in accordance with the terms and provisions of the related loan agreement or otherwise to the lender’s satisfaction.
Notwithstanding the foregoing, in the event that a Trigger Period is continuing solely because of a Debt Yield Trigger, the borrower will have the right to cure such Trigger Period (without waiting two calendar quarters) by (i) partially prepaying the outstanding principal balance of the Garden State Plaza Whole Loan (provided that, in connection with any such prepayment made during the open period only, no yield maintenance premium will be due on the amount prepaid) in an amount which results in the debt yield being equal to or greater than 11.0%, (ii) depositing cash with the lender as additional reserve funds to hold as additional collateral for the Garden State Plaza Whole Loan in an amount which, if applied to the then outstanding principal balance of the Garden State Plaza Whole Loan, would result in the debt yield being equal to or greater than 11.0%, or (iii) delivering a letter of credit to the lender in an amount which, if drawn upon and applied to the then outstanding principal balance of the Garden State Plaza Whole Loan, would result in the debt yield being equal to or greater than 11.0%.
Current Mezzanine or Secured Subordinate Indebtedness. None.
Permitted Future Mezzanine or Secured Subordinate Indebtedness. Not permitted.
Release of Collateral. Not permitted.
Ground Lease. None.
| THE INFORMATION IN THIS STRUCTURAL AND COLLATERAL TERM SHEET IS NOT COMPLETE AND MAY BE AMENDED PRIOR TO THE TIME OF SALE. THIS TERM SHEET IS NOT AN OFFER TO SELL THESE SECURITIES AND IT IS NOT A SOLICITATION OF AN OFFER TO BUY THESE SECURITIES IN ANY JURISDICTION WHERE THE OFFER OR SALE IS NOT PERMITTED. | ||
| 92 | ||
|
Retail – Anchored 17 South Fort Lauderdale Beach Boulevard Fort Lauderdale, FL 33316
|
Collateral Asset Summary – Loan No. 9 Beach Place |
Cut-off Date Balance: Cut-off Date LTV: U/W NCF DSCR: U/W NOI Debt Yield: |
$36,000,000 67.0% 1.59x 12.2% |

| THE INFORMATION IN THIS STRUCTURAL AND COLLATERAL TERM SHEET IS NOT COMPLETE AND MAY BE AMENDED PRIOR TO THE TIME OF SALE. THIS TERM SHEET IS NOT AN OFFER TO SELL THESE SECURITIES AND IT IS NOT A SOLICITATION OF AN OFFER TO BUY THESE SECURITIES IN ANY JURISDICTION WHERE THE OFFER OR SALE IS NOT PERMITTED. | ||
| 93 | ||
Retail – Anchored 17 South Fort Lauderdale Beach Boulevard Fort Lauderdale, FL 33316
|
Collateral Asset Summary – Loan No. 9 Beach Place |
Cut-off Date Balance: Cut-off Date LTV: U/W NCF DSCR: U/W NOI Debt Yield: |
$36,000,000 67.0% 1.59x 12.2% |

| THE INFORMATION IN THIS STRUCTURAL AND COLLATERAL TERM SHEET IS NOT COMPLETE AND MAY BE AMENDED PRIOR TO THE TIME OF SALE. THIS TERM SHEET IS NOT AN OFFER TO SELL THESE SECURITIES AND IT IS NOT A SOLICITATION OF AN OFFER TO BUY THESE SECURITIES IN ANY JURISDICTION WHERE THE OFFER OR SALE IS NOT PERMITTED. | ||
| 94 | ||
Retail – Anchored 17 South Fort Lauderdale Beach Boulevard Fort Lauderdale, FL 33316
|
Collateral Asset Summary – Loan No. 9 Beach Place |
Cut-off Date Balance: Cut-off Date LTV: U/W NCF DSCR: U/W NOI Debt Yield: |
$36,000,000 67.0% 1.59x 12.2% |
| Mortgage Loan Information | Property Information | |||
| Loan Seller: | GACC | Single Asset / Portfolio: | Single Asset | |
| Loan Purpose: | Refinance | Property Type - Subtype: | Retail – Anchored | |
| Borrower Sponsor(s): | Joseph J. Sitt | Collateral: | Fee | |
| Borrower(s): | Thor Gallery at Beach Place, LLC | Location: | Fort Lauderdale, FL | |
| Original Balance: | $36,000,000 | Year Built / Renovated: | 1996 / NAP | |
| Cut-off Date Balance: | $36,000,000 | Property Management: | Stiles Corporation d/b/a Stiles Property Management | |
| % by Initial UPB: | 4.1% | Size: | 95,778 SF | |
| Interest Rate: | 7.31000% | Appraised Value / Per SF(1): | $53,700,000 / $561 | |
| Note Date: | January 5, 2024 | Appraisal Date(1): | October 10, 2023 | |
| Original Term: | 60 months | Occupancy: | 96.8% (as of November 21, 2023) | |
| Amortization: | Interest Only | UW Economic Occupancy: | 95.0% | |
| Original Amortization: | NAP | Underwritten NOI(2): | $4,394,174 | |
| Interest Only Period: | 60 months | Underwritten NCF: | $4,253,381 | |
| First Payment Date: | February 6, 2024 | |||
| Maturity Date: | January 6, 2029 | Historical NOI | ||
| Additional Debt Type: | NAP | Most Recent NOI(2): | $3,789,512 (TTM October 31, 2023) | |
| Additional Debt Balance: | NAP | 2022 NOI: | $3,534,045 | |
| Call Protection: | L(24),DorYM1(31),O(5) | 2021 NOI: | $3,419,411 | |
| Lockbox / Cash Management: | Hard / Springing | 2020 NOI: | $1,973,556 | |
| Reserves(3) | Financial Information | ||||||
| Initial | Monthly | Cap | Cut-off Date Loan Per SF: | $376 | |||
| Taxes: | $168,689 | $56,230 | NAP | Maturity Date Loan Per SF: | $376 | ||
| Insurance: | $0 | Springing | NAP | Cut-off Date LTV(1): | 67.0% | ||
| Replacement Reserve: | $0 | $3,751 | NAP | Maturity Date LTV(1): | 67.0% | ||
| TI/LC: | $859,857 | $15,221 | $1,500,000 | UW NOI DY: | 12.2% | ||
| Other(4): | $1,883,142 | Springing | NAP | UW NCF DSCR: | 1.59x | ||
| Sources and Uses | ||||||||||||
| Sources | Proceeds | % of Total | Uses | Proceeds | % of Total | |||||||
| Loan Amount | $36,000,000 | 96.7% | Loan Payoff | $31,181,027 | 83.8% | |||||||
| Principal’s New Cash Contribution | 1,216,947 | 3.3% | Closing Costs | 3,124,231 | 8.4% | |||||||
| Upfront Reserves | 2,911,688 | 7.8% | ||||||||||
| Total Sources | $37,216,947 | 100.0% | Total Uses | $37,216,947 | 100.0% | |||||||
| (1) | In addition to the as is appraised value set forth above, the appraisal included a “Prospective Market Value Upon Completion” appraised value of the Beach Place Property (as defined below) as of October 1, 2024, of $58,300,000, which results in a Cut-off Date LTV and Maturity Date LTV of 61.7% and 61.7%, respectively. The “As Is Land” appraised value of the Beach Place Property as of October 10, 2023, is $38,500,000, resulting in a Cut-off Date LTV and Maturity Date LTV of 93.5% and 93.5%, respectively. |
| (2) | The increase in Underwritten NOI compared to Most Recent NOI is primarily due the removal of the escalators and reduced expenses through new security and landscaping contracts. |
| (3) | See “Initial and Ongoing Reserves” below. |
| (4) | Other Reserves consists of a required capital expenditure work reserve ($1,453,516), rent replication reserve ($429,626.40), and a springing lease sweep reserve. See “Initial and Ongoing Reserves” below. |
| THE INFORMATION IN THIS STRUCTURAL AND COLLATERAL TERM SHEET IS NOT COMPLETE AND MAY BE AMENDED PRIOR TO THE TIME OF SALE. THIS TERM SHEET IS NOT AN OFFER TO SELL THESE SECURITIES AND IT IS NOT A SOLICITATION OF AN OFFER TO BUY THESE SECURITIES IN ANY JURISDICTION WHERE THE OFFER OR SALE IS NOT PERMITTED. | ||
| 95 | ||
Retail – Anchored 17 South Fort Lauderdale Beach Boulevard Fort Lauderdale, FL 33316
|
Collateral Asset Summary – Loan No. 9 Beach Place |
Cut-off Date Balance: Cut-off Date LTV: U/W NCF DSCR: U/W NOI Debt Yield: |
$36,000,000 67.0% 1.59x 12.2% |
The Loan. The ninth largest mortgage loan (the “Beach Place Mortgage Loan”) is secured by the borrower’s fee interest in a 95,778 SF retail property located in Fort Lauderdale, Florida (the “Beach Place Property”). The Beach Place Mortgage Loan was originated on January 5, 2024 by DBR Investments Co. Limited and accrues interest at a fixed rate of 7.31000% per annum. The Beach Place Mortgage Loan has an initial term of five-years and is interest-only for the full term.
The Property. The Beach Place Property is a 95,778 SF anchored retail beachfront shopping center located approximately 2.5 miles east of the Fort Lauderdale central business district and approximately 32.5 miles north of the Miami central business district. The Beach Place Property was originally constructed in 1996 and is situated on a 2.95-acre site. The Beach Place Property has visibility and access along the west side of South Fort Lauderdale Beach Boulevard, also referred to as State Road A1A, and occupies nearly the entire block. The Beach Place Property has approximately 280 feet of frontage along State Road A1A, which separates the Beach Place Property from Fort Lauderdale Beach and the Atlantic Ocean. In addition, The Beach Place Property is located near the Ritz Carlton hotel and Las Olas Beach Club luxury condominiums.
The Beach Place Property consists of a retail property connected to a six-level parking garage which has both above-ground and underground levels. A non-collateral condominium time share building known as Marriott Beach Place Towers condominium (the “Marriott Condominium”), is also connected to the garage, as well as to the Beach Place Property. The Beach Place Property offers 819 parking spaces in the garage, which it has rights to pursuant to an Easement, Maintenance and Operating Agreement (the “Easement Agreement”). The Easement Agreement provides for parking for the Beach Place Property on the first, second, third and fourth levels and a portion of the fifth level of the garage (580 spaces), with the remaining portion of the fifth level and all of the sixth level of the garage allocated to the Marriott Condominium (239 spaces). The Easement Agreement also allows the use of shared ramps to access both the retail and residential portions of the parking garage. Parking income at the Beach Place Property over the trailing twelve months ended October 2023 is $2,130,098, which constitutes 29.1% of the effective gross income. The Beach Place Property is 96.8% leased to a mix of 21 national, regional, and local tenants, with no tenant occupying more than 13.2% of the net rentable area. According to the November 21, 2023, rent roll, the top 10 tenants at the Beach Place Property include one third floor corner tenant, one drug store tenant, three large beachfront tenants, three additional beachfront spaces, one inline tenant, and one rear center tenant. The Beach Place Property has a history of tenant retention with lease terms ranging from 2.0 years to 30.0 years, and a weighted average lease term of 15.9 years. The leases at the Beach Place Property include a mix of full service, triple net, and modified gross leases.
Major Tenants. The three largest tenants at the Beach Place Property based on the underwritten base rent are CVS, Crystal Ballroom, and Fort Liquordale.
CVS (11,000 SF; 11.5% of NRA; 14.7% of underwritten base rent). CVS Health Corporation (Moody’s/S&P/Fitch: Baa2/BBB/NR) is one of the nation’s largest pharmacy and convenience chains. With over 9,000 stores located throughout the United States, CVS is the 4th-largest company in the Fortune 500 as of the end of 2022 and the second-largest retail company after Wal-Mart according to 2017 revenues. As with other large pharmacies, CVS offers a diverse line of over-the-counter and prescription medication, beauty supplies, and groceries. Total revenues increased 20.0% to $322.5 billion in fiscal year 2022, compared to 2020. CVS has been in occupancy at the Beach Place Property for approximately 15.7 years. The CVS lease expires on January 31, 2034, and the tenant has four, five-year renewal options upon no less than six months’ prior written notice. CVS has no termination options.
Crystal Ballroom (12,634 SF; 13.2% of NRA; 10.6% of underwritten base rent). Crystal Ballroom is an all-inclusive event and wedding venue offering event venue design services throughout Florida, North Carolina, and South Carolina. The company offers a professional, in-house design team that hand selects décor for various events. Services provided by Crystal Ballroom include birthdays, weddings, beach weddings, destination weddings, quinceañeras, banquet hall, baby showers, corporate events, and private events and celebrations. Crystal Ballroom has been in occupancy at the Beach Place Property for approximately 5.0 years. Crystal Ballroom’s lease expires on April 30, 2030, and the tenant has no renewal options or termination options.
Fort Liquordale (3,101 SF; 3.2% of NRA; 9.6% of underwritten base rent). Fort Liquordale is a bodega and liquor store centered around providing unique and immersive experiences. The venue offers a wide selection of beer, wine and spirits, as well as providing customers with the tools and ingredients to recreate a cocktail bar experience at home. Fort Liquordale has been in occupancy at the Beach Place Property since October 26, 2023. Fort Liquordale’s lease expires on April 25, 2034, and the tenant has two, five-year renewal options upon no less than 270 days’ prior written notice. Fort Liquordale has no termination options. Fort Liquordale has not yet commenced paying rent. At origination, $429,626 was deposited into a rent replication reserve for Fort Liquordale, representing approximately 11 months of free rent.
| THE INFORMATION IN THIS STRUCTURAL AND COLLATERAL TERM SHEET IS NOT COMPLETE AND MAY BE AMENDED PRIOR TO THE TIME OF SALE. THIS TERM SHEET IS NOT AN OFFER TO SELL THESE SECURITIES AND IT IS NOT A SOLICITATION OF AN OFFER TO BUY THESE SECURITIES IN ANY JURISDICTION WHERE THE OFFER OR SALE IS NOT PERMITTED. | ||
| 96 | ||
Retail – Anchored 17 South Fort Lauderdale Beach Boulevard Fort Lauderdale, FL 33316
|
Collateral Asset Summary – Loan No. 9 Beach Place |
Cut-off Date Balance: Cut-off Date LTV: U/W NCF DSCR: U/W NOI Debt Yield: |
$36,000,000 67.0% 1.59x 12.2% |
The following table presents certain information relating to historical occupancy for the Beach Place Property:
| Historical Occupancy(1)(2)(3) | ||||
| 2019 | 2020 | 2021 | 2022 | As of November 21, 2023 |
| 87.4% | 86.1% | 93.3% | 98.3% | 96.8% |
| (1) | Based on the underwritten rent roll dated November 21, 2023. |
| (2) | Historical occupancy figures include AT&T Mobility (250 SF), which is a cell tower and LAZ Parking (131,944), which operates the garage. |
| (3) | Unless otherwise stated, historical occupancy is as of December 31st of each respective year. |
The following table presents certain information relating to the tenants at the Beach Place Property:
| Tenant Summary(1) | |||||||||
Tenant |
Credit
Rating (Moody’s/ S&P/Fitch)(2) |
Net Rentable Area (SF) | % of Net Rentable Area | U/W
Base Rent |
U/W
Base Rent Per SF |
% of Total U/W Base Rent |
Lease Expiration | Termination Option (Y/N) | Renewal Options |
| CVS | Baa2/BBB/NR | 11,000 | 11.5% | $701,360 | $63.76 | 14.7% | 1/31/2034 | N | 4 x 5 Yr |
| Crystal Ballroom | NR/NR/NR | 12,634 | 13.2% | 504,145 | $39.90 | 10.6% | 4/30/2030 | N | None |
| Fort Liquordale(3) | NR/NR/NR | 3,101 | 3.2% | 458,948 | $148.00 | 9.6% | 4/25/2034 | N | 2 x 5 Yr |
| Lulu's Bait Shack | NR/NR/NR | 6,592 | 6.9% | 419,976 | $63.71 | 8.8% | 3/31/2028 | N | None |
| Maui Nix | NR/NR/NR | 7,617 | 8.0% | 414,974 | $54.48 | 8.7% | 2/28/2031 | N | None |
| Hooters | NR/NR/NR | 3,426 | 3.6% | 349,144 | $101.91 | 7.3% | 1/31/2027 | N | None |
| Dick's Last Resort(4) | NR/NR/NR | 7,614 | 7.9% | 310,121 | $40.73 | 6.5% | 3/22/2034 | N | 2 x 5 Yr |
| Con Murphy's Irish Pub | NR/NR/NR | 3,566 | 3.7% | 275,545 | $77.27 | 5.8% | 12/31/2029 | N | 1 x 5 Yr |
| Taco Bell Cantina | Ba3/BB+/NR | 5,638 | 5.9% | 264,000 | $46.83 | 5.5% | 12/31/2029 | N | 2 x 5 Yr |
| Wave | NR/NR/NR | 5,136 | 5.4% | 152,745 | $29.74 | 3.2% | 5/31/2031 | N | None |
| Largest Tenants | 66,324 | 69.2% | $3,850,958 | $58.06 | 80.7% | ||||
| Remaining Occupied | 26,398 | 27.6% | 922,973 | $34.96 | 19.3% | ||||
| Total Occupied | 92,722 | 96.8% | $4,773,931 | $51.49 | 100.0% | ||||
| Vacant | 3,056 | 3.2% | |||||||
| Total | 95,778 | 100.0% | |||||||
| (1) | Based on the underwritten rent roll dated November 21, 2023 and is inclusive of rent steps through November 1, 2024. |
| (2) | Certain ratings are those of the parent company whether or not the parent guarantees the lease. |
| (3) | Fort Liquordale has not yet commenced paying rent. At origination, $429,626 was deposited into a rent replication reserve for Fort Liquordale, representing approximately 11 months of free rent. |
| (4) | Dick’s Last Resort is not yet in occupancy or paying rent. Dick’s Last Resort is expected to open in February 2024, and has a required opening date and rent commencement date of no later than March 23, 2024. We cannot assure you that Dick’s Last Resort will take occupancy as expected or at all. |
The following table presents certain information relating to the lease rollover schedule at the Beach Place Property, based on initial lease expiration dates:
| Lease Rollover Schedule(1)(2) | ||||||||||
| Year Ending December 31 |
Expiring Owned GLA | % of Owned GLA | Cumulative % of Owned GLA | U/W Base Rent | % of Total U/W Base Rent | U/W Base Rent $ per SF | # of Expiring Leases | |||
| MTM | 0 | 0.0 | % | 0.0% | $0 | 0.0 | % | $0.00 | 0 | |
| 2024 | 2,956 | 3.1 | % | 3.1% | 121,787 | 2.6 | % | $41.20 | 1 | |
| 2025 | 437 | 0.5 | % | 3.5% | 30,590 | 0.6 | % | $70.00 | 1 | |
| 2026 | 0 | 0.0 | % | 3.5% | 0 | 0.0 | % | $0.00 | 0 | |
| 2027 | 11,757 | 12.3 | % | 15.8% | 566,665 | 11.9 | % | $48.20 | 4 | |
| 2028 | 7,957 | 8.3 | % | 24.1% | 508,116 | 10.6 | % | $63.86 | 2 | |
| 2029 | 11,284 | 11.8 | % | 35.9% | 676,745 | 14.2 | % | $59.97 | 4 | |
| 2030 | 18,527 | 19.3 | % | 55.3% | 636,149 | 13.3 | % | $34.34 | 2 | |
| 2031 | 12,753 | 13.3 | % | 68.6% | 567,719 | 11.9 | % | $44.52 | 2 | |
| 2032 | 5,336 | 5.6 | % | 74.1% | 195,732 | 4.1 | % | $36.68 | 2 | |
| 2033 | 0 | 0.0 | % | 74.1% | 0 | 0.0 | % | $0.00 | 0 | |
| 2034 | 21,715 | 22.7 | % | 96.8% | 1,470,429 | 30.8 | % | $67.71 | 3 | |
| 2035 & Thereafter | 0 | 0.0 | % | 96.8% | 0 | 0.0 | % | $0.00 | 0 | |
| Vacant | 3,056 | 3.2 | % | 100.0% | NAP | NAP | NAP | NAP | ||
| Total / Wtd. Avg. | 95,778 | 100.0 | % | $4,773,931 | 100.0 | % | $51.49 | 21 | ||
| (1) | Based on the underwritten rent roll dated November 21, 2023 and is inclusive of rent steps through November 1, 2024. |
| (2) | Certain tenants may have lease termination options that are not reflected in the Lease Rollover Schedule. |
| THE INFORMATION IN THIS STRUCTURAL AND COLLATERAL TERM SHEET IS NOT COMPLETE AND MAY BE AMENDED PRIOR TO THE TIME OF SALE. THIS TERM SHEET IS NOT AN OFFER TO SELL THESE SECURITIES AND IT IS NOT A SOLICITATION OF AN OFFER TO BUY THESE SECURITIES IN ANY JURISDICTION WHERE THE OFFER OR SALE IS NOT PERMITTED. | ||
| 97 | ||
Retail – Anchored 17 South Fort Lauderdale Beach Boulevard Fort Lauderdale, FL 33316
|
Collateral Asset Summary – Loan No. 9 Beach Place |
Cut-off Date Balance: Cut-off Date LTV: U/W NCF DSCR: U/W NOI Debt Yield: |
$36,000,000 67.0% 1.59x 12.2% |
The following table presents certain information relating to the historical operating performance and Underwritten Net Cash Flow at the Beach Place Property:
| Cash Flow Analysis(1) | |||||||
| 2019 | 2020 | 2021 | 2022(2) | TTM 10/31/2023(2) | U/W(1) | U/W Per SF | |
| Base Rent | $2,989,621 | $2,877,312 | $3,260,320 | $4,293,408 | $3,879,986 | $4,773,931 | $49.84 |
| Rent Steps | 0 | 0 | 0 | 0 | 0 | 60,302 | 0.63 |
| Gross Up Vacancy | 0 | 0 | 0 | 0 | 0 | 141,573 | 1.48 |
| Gross Potential Rent | $2,989,621 | $2,877,312 | $3,260,320 | $4,293,408 | $3,879,986 | $4,975,807 | $51.95 |
| Total Reimbursements | 533,606 | 414,729 | 359,590 | 612,670 | 987,913 | 529,586 | 5.53 |
| Other Income | 1,798,249 | 1,284,953 | 2,623,650 | 2,574,095 | 2,451,096 | 2,539,829 | 26.52 |
| (Vacancy / Credit Loss) | 0 | 0 | 0 | 0 | 0 | (402,261) | (4.20) |
| Effective Gross Income | $5,321,476 | $4,576,994 | $6,243,559 | $7,480,173 | $7,318,994 | $7,642,961 | $79.80 |
| Management Fee | 126,000 | 131,000 | 170,646 | 209,958 | 211,382 | 229,289 | 2.39 |
| Real Estate Taxes | 788,781 | 810,772 | 614,840 | 642,725 | 642,425 | 690,456 | 7.21 |
| Insurance | 72,838 | 105,660 | 143,410 | 391,704 | 435,473 | 429,387 | 4.48 |
| Other Expenses(3) | 1,918,039 | 1,556,006 | 1,895,252 | 2,701,740 | 2,240,202 | 1,899,655 | 19.83 |
| Total Expenses | 2,905,658 | 2,603,438 | 2,824,148 | 3,946,128 | 3,529,482 | 3,248,787 | 33.92 |
| Net Operating Income | $2,415,818 | $1,973,556 | $3,419,411 | $3,534,045 | $3,789,512 | $4,394,174 | $45.88 |
| Capital Expenditures | 0 | 0 | 0 | 0 | 0 | 45,016 | 0.47 |
| TI/LC | 0 | 0 | 0 | 0 | 0 | 95,778 | 1.00 |
| Net Cash Flow | $2,415,818 | $1,973,556 | $3,419,411 | $3,534,045 | $3,789,512 | $4,253,381 | $44.41 |
| Occupancy (%)(4)(5) | 87.4% | 86.1% | 93.3% | 98.3% | 95.3% | 95.0% | |
| NCF DSCR | 0.91x | 0.74x | 1.28x | 1.32x | 1.42x | 1.59x | |
| NOI Debt Yield | 6.7% | 5.5% | 9.5% | 9.8% | 10.5% | 12.2% | |
| (1) | Based on the underwritten rent roll dated November 21, 2023 and is inclusive of rent steps through November 1, 2024. |
| (2) | The increase in U/W NOI compared to TTM 10/31/2023 is primarily due the removal of the escalators and reduced expenses through new security and landscaping contracts. |
| (3) | Other Expenses include G&A, utilities, security, payroll and benefits, landscaping, escalator expenses, repair and maintenance, marketing, and non-recoverable expenses. |
| (4) | Historical occupancy figures include AT&T Mobility (250 SF), which is a cell tower and LAZ Parking (131,944), which operates the garage. |
| (5) | Occupancy (%) figures reflect annual as-of December 31 dates of their respective year, or with regard to TTM 10/31/2023 Occupancy (%), the rent roll dated October 6th, 2023. |
Appraisal. According to the appraisal, the Beach Place Property had an “as-is” appraised value of $53,700,000 as of October 10, 2023, and a "Prospective Market Value Upon Completion” appraised value of $58,300,000 as of October 1, 2024. The “Prospective Market Value Upon Completion” appraised value assumes completion of the required upfront capital expenditures at the Beach Place Property, estimated to cost $1,453,516 and also assumes additional lease up and other assumptions. At loan origination, $1,453,516 was reserved for these capital expenditure projects including a sprinkler replacement, the removal of the escalators, and compliance with a new code requirement for fire life safety/fire panel. Additionally, the Beach Place Property had an “as-is land” appraised value of $38,500,000 as of October 10, 2023.
Appraisal Approach |
Appraised Value |
Capitalization Rate |
| Income Capitalization Approach | $53,700,000 | 8.00%(1) |
| (1) | Represents the terminal Capitalization Rate. |
Environmental Matters. According to the Phase I environmental report, dated October 18, 2023, there was no evidence of any recognized environmental conditions at the Beach Place Property.
The Market. The Beach Place Property is located within the Fort Lauderdale submarket in Broward County, Florida. According to a third-party report, the 2022 estimated population in Broward County was approximately 1,900,000 people, accounting for approximately 8.7% of the state of Florida’s total population. The Broward County population had a compound annual increase of 0.71% from 2000 to 2022. According to a third-party report, the estimated 2022 population within a one, three, and five-mile radius of the Beach Place Property is 6,611, 69,073, and 183,054, respectively. According to a third-party report, the estimated 2022 average household income within a one, three, and five-mile radius of the Beach Place Property is $154,051, $126,271, and $102,497, respectively.
The Beach Place Property is situated within a dense infill location on Fort Lauderdale beach, near the downtown Fort Lauderdale central business district. As of the third quarter of 2023, the Fort Lauderdale retail submarket had a total inventory of 5,610,700 SF, average market rents of $48.31 per square foot, and a vacancy rate of 4.8%, according to a third-party report. Since the beginning of 2020, 243,006 SF have been added to the total supply. There is no new supply in the submarket. Given the developed urban core, there is limited land in the immediate surrounding areas of the Beach Place Property for new development. According to a third-party report, there have been no deliveries over the past year in the submarket. Development in the local vicinity primarily consists of hospitality and high-density housing.
| THE INFORMATION IN THIS STRUCTURAL AND COLLATERAL TERM SHEET IS NOT COMPLETE AND MAY BE AMENDED PRIOR TO THE TIME OF SALE. THIS TERM SHEET IS NOT AN OFFER TO SELL THESE SECURITIES AND IT IS NOT A SOLICITATION OF AN OFFER TO BUY THESE SECURITIES IN ANY JURISDICTION WHERE THE OFFER OR SALE IS NOT PERMITTED. | ||
| 98 | ||
Retail – Anchored 17 South Fort Lauderdale Beach Boulevard Fort Lauderdale, FL 33316
|
Collateral Asset Summary – Loan No. 9 Beach Place |
Cut-off Date Balance: Cut-off Date LTV: U/W NCF DSCR: U/W NOI Debt Yield: |
$36,000,000 67.0% 1.59x 12.2% |
The Borrower and the Borrower Sponsors. The borrower for the Beach Place Mortgage Loan is Thor Gallery at Beach Place, LLC, a Delaware limited liability company and single purpose entity with two independent directors. Legal counsel to the borrower delivered a non-consolidation opinion in connection with the origination of the Beach Place Mortgage Loan.
The borrower sponsor and non-recourse carveout guarantor is Joseph J. Sitt, chairman of Thor Equities Group. Founded in 1986 by the borrower sponsor, Thor Equities Group is a global institutional real estate investor with divisions across three continents and a focus on subniche asset classes. Thor Equities Group owns assets across the United States, Europe, and Latin America, with portfolio transactions and a development pipeline inclusive of 50 million SF. Thor Equities Group invests across various asset classes and the firm engages in investing in and restoring luxury assets around the globe, as well as investing emerging asset classes such as technology and creative offices, biotechnology and life sciences, and logistics real estate.
Property Management. The Beach Place Property is managed by Stiles Corporation d/b/a Stiles Property Management, a third-party property management company.
Initial and Ongoing Reserves. At closing, the borrower deposited an amount equal to approximately (i) $168,689 into a real estate tax reserve, (ii) $859,857 into a TI/LC reserve, (iii) $1,453,516 into a required capital expenditure reserve, and (iv) $429,626 into a gap rent reserve.
Tax Reserve – The borrower is required to deposit into a real estate tax reserve, on a monthly basis, 1/12th of the reasonably estimated real estate taxes, an amount currently equal to approximately $56,230.
Insurance Reserve – The borrower is required to escrow 1/12th of the annual estimated insurance payments on a monthly basis, unless the Beach Place Property is insured under a blanket policy meeting the requirements set forth in the related loan agreement.
Replacement Reserve – The borrower is required to deposit into a capital expenditures reserve, on a monthly basis, an amount equal to approximately $3,751.
TI/LC Reserve – The borrower is required to deposit into a tenant improvement and leasing commission reserve, on a monthly basis, an amount equal to approximately $15,221; provided that the borrower’s obligation to make such deposits is suspended if the amount on deposit in such reserve solely as a result of such monthly deposit equals or exceeds $1,500,000.
Lease Sweep Reserve – During the continuance of a Lease Sweep Period (as defined below), the borrower is required to escrow all excess cash flow into a lease sweep reserve account on a monthly basis.
Lockbox / Cash Management. The Beach Place Mortgage Loan is structured with a hard lockbox and springing cash management. The borrower is required to direct all tenants at the Beach Place Property to pay rents directly into a lockbox account controlled by the lender (the “Lockbox Account”) and to deposit any rents otherwise received by the borrower or the property manager into the Lockbox Account within two business days after receipt. Prior to a Trigger Period (as defined below), funds in the Lockbox Account will be swept to the borrower’s operating account on a daily basis. During the continuance of a Trigger Period, all funds deposited into the Lockbox Account will be swept on a daily basis into a deposit account controlled by the lender (the “Cash Management Account”), to be applied and disbursed in accordance with the loan documents to pay debt service, the reserves and escrows described above, budgeted operating expenses, and lender-approved extraordinary expenses. During the continuance of a Trigger Period, unless an event of default is continuing, any excess cash will be (i) if a Lease Sweep Period is continuing, deposited into the Lease Sweep Reserve, and (ii) if no Lease Sweep Period is continuing, deposited into an eligible account (the “Excess Cash Flow Reserve Account”) and held by the lender as additional security for the Beach Place Mortgage Loan; provided, that, funds on deposit in the Excess Cash Flow Reserve Account will be made available to the borrower for the payment of certain property-level expenses and other uses as set forth in the Beach Place Mortgage Loan documents.
| THE INFORMATION IN THIS STRUCTURAL AND COLLATERAL TERM SHEET IS NOT COMPLETE AND MAY BE AMENDED PRIOR TO THE TIME OF SALE. THIS TERM SHEET IS NOT AN OFFER TO SELL THESE SECURITIES AND IT IS NOT A SOLICITATION OF AN OFFER TO BUY THESE SECURITIES IN ANY JURISDICTION WHERE THE OFFER OR SALE IS NOT PERMITTED. | ||
| 99 | ||
Retail – Anchored 17 South Fort Lauderdale Beach Boulevard Fort Lauderdale, FL 33316
|
Collateral Asset Summary – Loan No. 9 Beach Place |
Cut-off Date Balance: Cut-off Date LTV: U/W NCF DSCR: U/W NOI Debt Yield: |
$36,000,000 67.0% 1.59x 12.2% |
A “Trigger Period” means a period commencing upon (i) an event of default, (ii) the interest only debt service coverage ratio falling below 1.30x as of the last day of any calendar quarter (a “Low DSCR Period”), (ii) the bankruptcy or insolvency of an affiliated property manager, or (iv) a Lease Sweep Period. A Trigger Period resulting from an event of default will end if and when such event of default is no longer continuing. A Trigger Period resulting from a Low DSCR Period will end if the borrower has maintained an interest only debt service coverage ratio of at least 1.35x as of the last day of two consecutive calendar quarters. The borrower may also cure a Trigger Period arising from a Low DSCR Period by delivering to the lender cash or a letter of credit in an amount which, when subtracted from the outstanding principal balance of the Beach Place Mortgage Loan, would cause the interest-only debt coverage service ratio to be at least 1.35x. A Trigger Period resulting from the bankruptcy or insolvency of an affiliated property manager will end when the affiliated property manager is replaced with an unaffiliated, qualified manager approved by the lender who has signed an assignment and subordination agreement satisfactory to lender. A Trigger Period resulting from a Lease Sweep Period will end when such Lease Sweep Period ends.
“Lease Sweep Period” means a period commencing upon (a) the earlier of (i) the date that is 12 months prior to the expiration of a Sweep Lease (as defined below) and (ii) the date required under the Sweep Lease by which the Sweep Tenant (as defined below) is required to give notice of its exercise of a renewal option thereunder (and such renewal has not been so exercised); (b) upon the valid early termination, early cancellation or early surrender of a Sweep Lease or upon the borrower’s receipt of written notice by a Sweep Tenant of its intent to effect an early termination, early cancellation or early surrender of its Sweep Lease; (c) if a Sweep Tenant discontinues its business (i.e., “goes dark”) in substantially all of its space at the Beach Place Property (unless (i) the tenant is discontinuing its business following a casualty, condemnation or force majeure event or for remodeling or alterations to its space, (ii) the discontinuance does not exceed 180 days and (iii) the tenant is not in monetary or material non-monetary default (beyond applicable notice and/or cure periods) and is paying full contractual rent); (d) upon a monetary or material non-monetary default under a Sweep Lease by a Sweep Tenant beyond any applicable notice and cure period, and (e) upon a bankruptcy or insolvency proceeding of a lease guarantor, Sweep Tenant or its (directly or indirectly) majority owned parent.
A Lease Sweep Period will terminate upon: (A) in the case of clauses (a), (b), and (c) above, the entirety of the Sweep Lease space (or applicable portion thereof) is leased pursuant to one or more qualified leases (which qualified lease(s) must be on market terms, have terms that are for at least seven years or, in connection with extending an original Sweep Lease, a lease extension that extends to term beyond the date that is two years beyond the end of the loan term) and in the lender’s reasonable judgement there are sufficient funds in the lease sweep reserve to cover all anticipated leasing expenses approved by the lender, and free or abated rent periods for such qualified leases (collectively, “Leasing Costs”), and any shortfalls in loan agreement payments or operating expenses resulting from anticipated down time prior to the commencement of payments under such qualified leases (collectively, “Shortfalls”); (B) in the case of clauses (a), (b) and (c) above, a portion of the Sweep Lease space (or applicable portion thereof) is leased pursuant to one or more qualified leases (which qualified lease(s) must be on market terms, have terms that are for at least seven years or, in connection with extending an original Sweep Lease, a lease extension that extends to term beyond the date that is two years beyond the end of the loan term), and provide for aggregate initial base rental rates which are sufficient to achieve a debt service coverage ratio of 1.45x (taking into account any cash or letters of credit that were delivered for the purposes of avoiding a Low DSCR Period)) and in the lender’s reasonable judgement there are sufficient funds in the lease sweep reserve to cover all Leasing Costs and Shortfalls; provided that to satisfy this clause with respect to the CVS lease, at least 85% of the space leased under the CVS lease as of origination must be retenanted or renewed; (C) in the case of clause (a) above, the Sweep Tenant irrevocably exercises its renewal or extension option with respect to all of its space, and in the lender’s judgement there are sufficient funds in the lease sweep reserve to cover all Leasing Costs in connection with such renewal or extension; (D) in the case of clause (b) above, the Sweep Tenant has not validly exercised its termination option or the termination option is irrevocably waived or rescinded in writing; (E) in the case of clause (c) above, either (x) the Sweep Tenant reopens for business and continuously operates for at least 60 days or (y) if the Sweep Tenant subleases its space in compliance with the loan documents to a subtenant of substantially the same credit quality and the subtenant has taken occupancy; (F) in the case of clause (d) above, the subject default has been cured and no other default under the Sweep Lease occurs for three months following such cure; (G) in the case of clause (e) above, the applicable bankruptcy or insolvency proceeding has been terminated and the applicable Sweep Lease (and any guaranty of it) has been affirmed or assumed in a manner reasonably satisfactory to the lender, and adequate assurance of future performance under the Sweep Lease (and any guaranty), as reasonably determined by the lender, has been provided; and (H) in the case of clauses (a), (b), (c), (d) and (e) above, the borrower deposits cash or a letter of credit into the Lease Sweep Reserve in an amount that is equal or greater to the total rentable square feet demised under the applicable Sweep Lease multiplied by $60.00 (the “Lease Sweep Deposit”), provided that if the applicable Sweep Lease space has been partially leased pursuant to one or more qualified leases, the amount to be deposited with respect to such portion of the Sweep Lease space that has been relet will be equal to the applicable Leasing Costs and Shortfalls, and the Lease Sweep Deposit will apply to the remaining portion of the Sweep Lease space that has not been relet. Notwithstanding the foregoing, Borrower may prevent the commencement of a Lease Sweep Period by either depositing with Lender cash or delivering a Letter of Credit in an amount equal to the Lease Sweep Deposit Amount applicable to the Lease Sweep Space in question.
“Sweep Lease” means (i) the Crystal Ballroom lease and the CVS lease, and (ii) any replacement lease of at least 9,000 SF that covers any of the space currently demised as of the origination date under the leases described in clause (i).
“Sweep Tenant” means any tenant under a Sweep Lease.
Current Mezzanine or Secured Subordinate Indebtedness. None.
| THE INFORMATION IN THIS STRUCTURAL AND COLLATERAL TERM SHEET IS NOT COMPLETE AND MAY BE AMENDED PRIOR TO THE TIME OF SALE. THIS TERM SHEET IS NOT AN OFFER TO SELL THESE SECURITIES AND IT IS NOT A SOLICITATION OF AN OFFER TO BUY THESE SECURITIES IN ANY JURISDICTION WHERE THE OFFER OR SALE IS NOT PERMITTED. | ||
| 100 | ||
Retail – Anchored 17 South Fort Lauderdale Beach Boulevard Fort Lauderdale, FL 33316
|
Collateral Asset Summary – Loan No. 9 Beach Place |
Cut-off Date Balance: Cut-off Date LTV: U/W NCF DSCR: U/W NOI Debt Yield: |
$36,000,000 67.0% 1.59x 12.2% |
Permitted Future Mezzanine or Secured Subordinate Indebtedness. Not Permitted.
Release of Collateral. Not Permitted.
Ground Lease. None.
| THE INFORMATION IN THIS STRUCTURAL AND COLLATERAL TERM SHEET IS NOT COMPLETE AND MAY BE AMENDED PRIOR TO THE TIME OF SALE. THIS TERM SHEET IS NOT AN OFFER TO SELL THESE SECURITIES AND IT IS NOT A SOLICITATION OF AN OFFER TO BUY THESE SECURITIES IN ANY JURISDICTION WHERE THE OFFER OR SALE IS NOT PERMITTED. | ||
| 101 | ||
|
Retail – Super Regional Mall 1299 Galleria at Tyler Riverside, CA 92503
|
Collateral Asset Summary – Loan No. 10 Galleria at Tyler |
Cut-off Date Balance: Cut-off Date LTV: U/W NCF DSCR: U/W NOI Debt Yield: |
$35,000,000 50.0% 1.96x 16.7% |

| THE INFORMATION IN THIS STRUCTURAL AND COLLATERAL TERM SHEET IS NOT COMPLETE AND MAY BE AMENDED PRIOR TO THE TIME OF SALE. THIS TERM SHEET IS NOT AN OFFER TO SELL THESE SECURITIES AND IT IS NOT A SOLICITATION OF AN OFFER TO BUY THESE SECURITIES IN ANY JURISDICTION WHERE THE OFFER OR SALE IS NOT PERMITTED. | ||
| 102 | ||
|
Retail – Super Regional Mall 1299 Galleria at Tyler Riverside, CA 92503
|
Collateral Asset Summary – Loan No. 10 Galleria at Tyler |
Cut-off Date Balance: Cut-off Date LTV: U/W NCF DSCR: U/W NOI Debt Yield: |
$35,000,000 50.0% 1.96x 16.7% |

| THE INFORMATION IN THIS STRUCTURAL AND COLLATERAL TERM SHEET IS NOT COMPLETE AND MAY BE AMENDED PRIOR TO THE TIME OF SALE. THIS TERM SHEET IS NOT AN OFFER TO SELL THESE SECURITIES AND IT IS NOT A SOLICITATION OF AN OFFER TO BUY THESE SECURITIES IN ANY JURISDICTION WHERE THE OFFER OR SALE IS NOT PERMITTED. | ||
| 103 | ||
|
Retail – Super Regional Mall 1299 Galleria at Tyler Riverside, CA 92503
|
Collateral Asset Summary – Loan No. 10 Galleria at Tyler |
Cut-off Date Balance: Cut-off Date LTV: U/W NCF DSCR: U/W NOI Debt Yield: |
$35,000,000 50.0% 1.96x 16.7% |

| THE INFORMATION IN THIS STRUCTURAL AND COLLATERAL TERM SHEET IS NOT COMPLETE AND MAY BE AMENDED PRIOR TO THE TIME OF SALE. THIS TERM SHEET IS NOT AN OFFER TO SELL THESE SECURITIES AND IT IS NOT A SOLICITATION OF AN OFFER TO BUY THESE SECURITIES IN ANY JURISDICTION WHERE THE OFFER OR SALE IS NOT PERMITTED. | ||
| 104 | ||
|
Retail – Super Regional Mall 1299 Galleria at Tyler Riverside, CA 92503
|
Collateral Asset Summary – Loan No. 10 Galleria at Tyler |
Cut-off Date Balance: Cut-off Date LTV: U/W NCF DSCR: U/W NOI Debt Yield: |
$35,000,000 50.0% 1.96x 16.7% |

| THE INFORMATION IN THIS STRUCTURAL AND COLLATERAL TERM SHEET IS NOT COMPLETE AND MAY BE AMENDED PRIOR TO THE TIME OF SALE. THIS TERM SHEET IS NOT AN OFFER TO SELL THESE SECURITIES AND IT IS NOT A SOLICITATION OF AN OFFER TO BUY THESE SECURITIES IN ANY JURISDICTION WHERE THE OFFER OR SALE IS NOT PERMITTED. | ||
| 105 | ||
|
Retail – Super Regional Mall 1299 Galleria at Tyler Riverside, CA 92503
|
Collateral Asset Summary – Loan No. 10 Galleria at Tyler |
Cut-off Date Balance: Cut-off Date LTV: U/W NCF DSCR: U/W NOI Debt Yield: |
$35,000,000 50.0% 1.96x 16.7% |
| Mortgage Loan Information | Property Information | |||
| Loan Seller: | GACC | Single Asset / Portfolio: | Single Asset | |
| Loan Purpose: | Refinance | Property Type - Subtype: | Retail – Super Regional Mall | |
| Borrower Sponsor(s): | Brookfield Properties Retail Holding LLC and Teachers' Retirement System of the State of Illinois | Collateral: | Fee | |
| Borrower(s): | Tyler Mall Limited Partnership | Location: | Riverside, CA | |
| Original Balance(1): | $35,000,000 | Year Built / Renovated: | 1970 / 1991, 2007 | |
| Cut-off Date Balance(1): | $35,000,000 | Property Management: | Brookfield Properties Retail Inc. | |
| % by Initial UPB: | 4.0% | Size(5): | 565,913 SF | |
| Interest Rate: | 7.91900% | Appraised Value / Per SF: | $300,000,000 / $530 | |
| Note Date: | December 13, 2023 | Appraisal Date: | October 12, 2023 | |
| Original Term: | 60 months | Occupancy: | 90.3% (as of December 18, 2023) | |
| Amortization: | Interest Only | UW Economic Occupancy: | 87.9% | |
| Original Amortization: | NAP | Underwritten NOI: | $24,985,593 | |
| Interest Only Period: | 60 months | Underwritten NCF: | $23,644,379 | |
| First Payment Date: | February 1, 2024 | |||
| Maturity Date: | January 1, 2029 | Historical NOI | ||
| Additional Debt Type(1): | Pari Passu | Most Recent NOI: | $23,997,964 (TTM November 30, 2023) | |
| Additional Debt Balance (1): | $115,000,000 | 2022 NOI: | $24,423,689 | |
| Call Protection(2): | L(24),D(29),O(7) | 2021 NOI: | $19,509,271 | |
| Lockbox / Cash Management: | Hard / Springing | 2020 NOI: | $20,929,304 | |
| Reserves(3) | Financial Information(1) | ||||||
| Initial | Monthly | Cap | Cut-off Date Loan Per SF: | $265 | |||
| Taxes: | $0 | Springing | NAP | Maturity Date Loan Per SF: | $265 | ||
| Insurance: | $0 | Springing | NAP | Cut-off Date LTV: | 50.0% | ||
| Replacement Reserve: | $0 | Springing | NAP | Maturity Date LTV: | 50.0% | ||
| TI/LC: | $0 | Springing | NAP | UW NOI DY: | 16.7% | ||
| Other(4): | $9,924,378 | $0 | NAP | UW NCF DSCR: | 1.96x | ||
| Sources and Uses | ||||||||
| Sources | Proceeds | % of Total | Uses | Proceeds | % of Total | |||
| Whole Loan | $150,000,000 | 91.8% | Loan Payoff | $152,794,561 | 93.5% | |||
| Borrower Sponsor Equity | 13,330,744 | 8.2% | Upfront Reserves | 9,924,378 | 6.1% | |||
| Closing Costs | 611,806 | 0.4% | ||||||
| Total Sources | $163,330,744 | 100.0% | Total Uses | $163,330,744 | 100.0% | |||
| (1) | The Galleria at Tyler Mortgage Loan (as defined below) is part of the Galleria at Tyler Whole Loan (as defined below) which is comprised of nine pari passu notes with an aggregate original principal balance and Cut-off Date Balance of $150,000,000. The Galleria at Tyler Whole Loan was originated by Deutsche Bank AG, acting through its New York Branch (“DBNY”), Bank of America, N.A. (“BANA”), and Société Générale Financial Corporation (“SGFC”). The Financial Information in the chart above is based on the aggregate outstanding principal balance of the Galleria at Tyler Whole Loan. |
| (2) | The lockout period will be at least 24 payment dates beginning with and including the first payment date on February 1, 2024. Defeasance of the Galleria at Tyler Whole Loan in full (but not in part) is permitted at any time following the earlier to occur of (i) December 13, 2026 or (ii) the date that is two years from the closing date of the securitization that includes the last pari passu note to be securitized. The assumed lockout period of 24 payments is based on the expected Benchmark 2024-V5 securitization closing date in January 2024. The actual lockout period may be longer. |
| (3) | See “Initial and Ongoing Reserves” below. |
| (4) | Other Reserves consists of a general reserve ($5,000,000), outstanding landlord obligations reserve ($4,687,691.09), and a gap rent reserve ($236,687). |
| (5) | The Galleria at Tyler Property (as defined below) is the collateral portion of a larger mall containing 1,188,083 SF. |
| THE INFORMATION IN THIS STRUCTURAL AND COLLATERAL TERM SHEET IS NOT COMPLETE AND MAY BE AMENDED PRIOR TO THE TIME OF SALE. THIS TERM SHEET IS NOT AN OFFER TO SELL THESE SECURITIES AND IT IS NOT A SOLICITATION OF AN OFFER TO BUY THESE SECURITIES IN ANY JURISDICTION WHERE THE OFFER OR SALE IS NOT PERMITTED. | ||
| 106 | ||
|
Retail – Super Regional Mall 1299 Galleria at Tyler Riverside, CA 92503
|
Collateral Asset Summary – Loan No. 10 Galleria at Tyler |
Cut-off Date Balance: Cut-off Date LTV: U/W NCF DSCR: U/W NOI Debt Yield: |
$35,000,000 50.0% 1.96x 16.7% |
The Loan. The tenth largest mortgage loan (the “Galleria at Tyler Mortgage Loan”) is part of a whole loan (the “Galleria at Tyler Whole Loan”) secured by the borrower’s fee interest in the Galleria at Tyler, a 565,913 SF super regional mall located at 1299 Galleria at Tyler in Riverside, California (the “Galleria at Tyler Property”). The Galleria at Tyler Whole Loan is comprised of nine pari passu notes, with an aggregate outstanding principal balance as of the Cut-off Date of $150,000,000. The Galleria at Tyler Whole Loan was originated on December 13, 2023 by DBNY, BANA, and SGFC and accrues interest at a fixed rate of 7.91900% per annum. The Galleria at Tyler Whole Loan has an initial term of five years and is interest-only for the full term. The scheduled maturity date of the Galleria at Tyler Whole Loan is on January 1, 2029. The Galleria at Tyler Mortgage Loan is evidenced by the non-controlling Notes A-2-1 and A-2-2 with an outstanding principal balance as of the Cut-off Date of $35,000,000.
The table below summarizes the promissory notes that comprise the Galleria at Tyler Whole Loan. The relationship between the holders of the Galleria at Tyler Whole Loan will be governed by a co-lender agreement as described under “Description of the Mortgage Pool— The Whole Loans—The Non-Serviced Pari Passu Whole Loans” in the Preliminary Prospectus.
| Whole Loan Summary | ||||
| Note | Original Balance | Cut-off Date Balance | Note Holder | Controlling Piece |
| A-1-1 | $30,000,000 | $30,000,000 | BANA(1) | Yes |
| A-1-2 | 20,000,000 | 20,000,000 | BANA(1) | No |
| A-1-3 | 10,000,000 | 10,000,000 | BANA(1) | No |
| A-2-1 | 20,000,000 | 20,000,000 | Benchmark 2024-V5 | No |
| A-2-2 | 15,000,000 | 15,000,000 | Benchmark 2024-V5 | No |
| A-2-3 | 10,000,000 | 10,000,000 | DBNY(1) | No |
| A-3-1 | 20,000,000 | 20,000,000 | SGFC(1) | No |
| A-3-2 | 15,000,000 | 15,000,000 | SGFC(1) | No |
| A-3-3 | 10,000,000 | 10,000,000 | SGFC(1) | No |
| Whole Loan | $150,000,000 | $150,000,000 | ||
| (1) | Expected to be contributed to one or more future securitization transactions. |
The Property. The Galleria at Tyler Property is a 565,913 SF portion of a 1,188,083 SF super regional mall (the “Galleria at Tyler Mall”) located within the Inland Empire, approximately 55 miles east of Los Angeles International Airport.
The Galleria at Tyler Mall is the largest shopping center in Riverside, California. The Galleria at Tyler Mall is comprised of eight buildings located on 29.58 acres, has over 120 tenants and has 5,679 parking spaces in total for a ratio of 4.8 spaces per 1,000 SF. The Galleria at Tyler Property is part of the Galleria at Tyler Mall, and is shadow anchored by non-collateral stores JC Penney, Macy’s, Forever 21, and Furniture City and is anchored by a collateral AMC, and includes as major tenants Barnes & Noble, Old Navy, Victoria’s Secret and H&M. The top 10 collateral tenants at the Galleria at Tyler Property represent 30.9% of total SF and generate 29.8% of underwritten rent. The Galleria at Tyler Property also features a strong restaurant lineup including Ay Mi Pa, Yard House, TGI Friday’s, Buffalo Wild Wings, and The Cheesecake Factory. Over the trailing-12 months ended October 31, 2023, the Galleria at Tyler Property generated total sales of approximately $217 million (excluding non-collateral tenants, JC Penney, and Macy’s). Over the same time period, inline tenants (less than 10,000 SF) generated sales of approximately $561 PSF, with an occupancy cost of 14.6%. The Galleria at Tyler Property has a five-year average occupancy of 95.3%, including temporary tenants, and 88.2% without temporary tenants.
The Galleria at Tyler Property was originally developed in 1970 and was most recently renovated in 2007. Since 2019, the borrower sponsors have invested approximately $16.2 million. This investment has helped maintain the occupancy and attract new tenants including Furniture City and several well performing restaurants. Several tenants have recently invested capital to their units. Existing tenant House of Hoops by Foot Locker is currently in negotiations to expand into 9,985 SF from its 5,598 SF unit. Victoria’s Secret and H&M, two top ten tenants at the Galleria at Tyler Property, recently renovated their units investing approximately $5 million ($420 PSF) and $2 million ($95 PSF), respectively. The borrower sponsors currently plan to invest an additional approximately $2.5 million through 2025. However, such investment is not required or reserved for under the Galleria at Tyler Whole Loan documents. Additionally, new tenant JD Sports opened in early December 2023 in 8,621 SF and invested approximately $1.6 million ($185 PSF) in its space.
Major Tenants. The three largest tenants by underwritten base rent are AMC, H&M, and Victoria’s Secret.
AMC (70,000 SF; 12.4% of net rentable area (“NRA”); 9.6% of underwritten base rent). AMC (NYSE: AMC) is an American movie theater chain that was founded in 1920 in Kansas City, Missouri, now headquartered in Leawood, Kansas. It has 2,826 screens in 354 European theaters and 7,648 screens in 586 American theaters. In 2006, AMC merged with Loews Cineplex Entertainment to form AMC Entertainment, and in 2017 after acquiring Odeon, UCI and Carmike Cinemas, AMC became one of the largest movie theater chains in the world. The AMC at the Galleria at Tyson Property is the number one location within the region and generates approximately $750,000 in sales per screen as of September 2023. The AMC lease expires December 31, 2028, and the tenant has two five-year renewal options and one four-year and six month renewal option.
| THE INFORMATION IN THIS STRUCTURAL AND COLLATERAL TERM SHEET IS NOT COMPLETE AND MAY BE AMENDED PRIOR TO THE TIME OF SALE. THIS TERM SHEET IS NOT AN OFFER TO SELL THESE SECURITIES AND IT IS NOT A SOLICITATION OF AN OFFER TO BUY THESE SECURITIES IN ANY JURISDICTION WHERE THE OFFER OR SALE IS NOT PERMITTED. | ||
| 107 | ||
|
Retail – Super Regional Mall 1299 Galleria at Tyler Riverside, CA 92503
|
Collateral Asset Summary – Loan No. 10 Galleria at Tyler |
Cut-off Date Balance: Cut-off Date LTV: U/W NCF DSCR: U/W NOI Debt Yield: |
$35,000,000 50.0% 1.96x 16.7% |
H&M (20,799 SF; 3.7% of NRA; 3.0% of underwritten base rent). H&M is a global fashion and design company, with over 4,000 stores in more than 70 markets and online sales in 60 markets. The brands of H&M are available through physical stores and digital channels in markets globally. H&M employs approximately 150,000 people. H&M’s lease expires in January 2032 and the tenant has two, three-year renewal options exercisable upon no less than 180 days prior written notice.
Victoria’s Secret (12,000 SF; 2.1% of NRA; 3.0% of underwritten base rent). Victoria’s Secret (NYSE: VSCO) is a specialty retailer of modern, fashion-inspired collections including signature bras, panties, lingerie, casual sleepwear, athleisure and swim as well as fragrances and body care. Victoria’s Secret was founded in 1977 and comprises two brands, Victoria’s Secret and PINK. Victoria’s Secret employs 30,000 associates across a global footprint of approximately 1,360 retail stores in approximately 70 countries. The Victoria’s Secret lease expires in January 2033
The following table presents certain information relating to historical occupancy for the Galleria at Tyler Property:
| Historical Occupancy(1) | |||||||
| 2016 | 2017 | 2018 | 2019 | 2020 | 2021 | 2022 | As of 12/18/2023(2)1) |
| 93.3% | 96.6% | 93.6% | 93.7% | 87.9% | 82.3% | 83.7% | 90.3% |
| (1) | All occupancy figures exclude anchor tenants and temporary tenants |
| (2) | Based on the borrower’s rent roll dated December 18, 2023. |
The following table presents certain information relating to the tenants (of which, certain tenants may have co-tenancy provisions) at the Galleria at Tyler Property:
| Tenant Summary(1) | ||||||||||
|
Tenant |
Credit Rating (Moody’s/ S&P/Fitch)(2) |
Net Rentable Area (SF) | % of Net Rentable Area | U/W Base Rent(3) |
U/W Base Rent Per SF(3) |
% of Total U/W Base Rent(3) | Lease Expiration | Termination Option (Y/N) | Renewal Options | |
| Non-Collateral Anchor | ||||||||||
| JC Penney | NR/NR/NR | 0 | 0.0 | % | $0 | $0.00 | 0.0% | NAP | N | |
| Macy's | NR/NR/NR | 0 | 0.0 | % | $0 | $0.00 | 0.0% | NAP | N | |
| Forever 21 | NR/NR/NR | 0 | 0.0 | % | $0 | $0.00 | 0.0% | NAP | N | |
| Furniture City | NR/NR/NR | 0 | 0.0 | $0 | $0.00 | 0.0% | NAP | N | ||
| Major Tenants | ||||||||||
| AMC(4) | Caa2/CCC+/NR | 70,000 | 12.4 | $2,098,250 | $29.97 | 9.6% | 12/31/2028 | N | Various | |
| H&M(5) | NR/BBB/NR | 20,799 | 3.7 | $663,000 | $31.88 | 3.0% | 1/31/2032 | N | 2 x 3 Yr | |
| Victoria's Secret | Ba3/BB-/NR | 12,000 | 2.1 | $644,880 | $53.74 | 3.0% | 1/31/2033 | N | None | |
| Barnes & Noble | NR/NR/NR | 25,000 | 4.4 | $625,000 | $25.00 | 2.9% | 1/31/2029 | N | None | |
| The Cheesecake Factory(6) | NR/NR/NR | 10,047 | 1.8 | $452,115 | $45.00 | 2.1% | 1/31/2027 | N | 1 x 5 Yr | |
| House of Hoops by Foot Locker | Baa2/BB/NR | 5,598 | 1.0 | $438,267 | $78.29 | 2.0% | 1/31/2024 | N | None | |
| Lenscrafters | A2/A/NR | 3,234 | 0.6 | $423,783 | $131.04 | 1.9% | 8/31/2032 | N | None | |
| Old Navy | Ba3/BB/NR | 14,504 | 2.6 | $386,725 | $26.66 | 1.8% | 6/30/2029 | N | None | |
| Vans | Baa3/BBB/NR | 3,503 | 0.6 | $376,449 | $107.46 | 1.7% | 4/30/2028 | N | None | |
| Yard House(7) | NR/NR/NR | 10,001 | 1.8 | $372,680 | $37.26 | 1.7% | 12/31/2029 | N | 1 x 5 Yr | |
| Top 10 Tenants Total/Wtd. Average | 174,686 | 30.9 | % | $6,481,149 | $37.10 | 29.8% | ||||
| Remaining Tenants | 336,356 | 59.4 | $15,295,863 | $45.48 | 70.2% | |||||
| Total Occupied | 511,042 | 90.3 | % | $21,777,012 | $42.61 | 100.0% | ||||
| Vacant | 54,871 | 9.7 | ||||||||
| Collateral Total | 565,913 | 100.0 | % | |||||||
| (1) | Based on the underwritten rent roll dated December 18, 2023 with rent steps though December 1, 2024. |
| (2) | Certain ratings are those of the parent company whether or not the parent guarantees the lease. |
| (3) | U/W Base Rent, U/W Base Rent Per SF and % of Total U/W Base Rent are inclusive of rent steps. |
| (4) | AMC has two, five-year renewal options, as well as one successive separate renewal option for 4 years and 6 months, all of which are exercisable upon no less than six months’ prior written notice. |
| (5) | H&M has two, three-year renewal options exercisable upon no less than 180 days’ prior written notice. |
| (6) | The Cheesecake Factory has one, five-year renewal option exercisable upon no less than 180 days’ prior written notice. |
| (7) | Yard House has one, five-year renewal option exercisable upon no less than 365 days’ prior written notice. |
| THE INFORMATION IN THIS STRUCTURAL AND COLLATERAL TERM SHEET IS NOT COMPLETE AND MAY BE AMENDED PRIOR TO THE TIME OF SALE. THIS TERM SHEET IS NOT AN OFFER TO SELL THESE SECURITIES AND IT IS NOT A SOLICITATION OF AN OFFER TO BUY THESE SECURITIES IN ANY JURISDICTION WHERE THE OFFER OR SALE IS NOT PERMITTED. | ||
| 108 | ||
|
Retail – Super Regional Mall 1299 Galleria at Tyler Riverside, CA 92503
|
Collateral Asset Summary – Loan No. 10 Galleria at Tyler |
Cut-off Date Balance: Cut-off Date LTV: U/W NCF DSCR: U/W NOI Debt Yield: |
$35,000,000 50.0% 1.96x 16.7% |
The following table presents certain information relating to the tenants with the highest overall sales in the order of their October 31, 2023 TTM sales.
| Top Tenants by Total Sales(1) | |||||||||
| Tenant | SF(2) | % NRA(2) | Lease Start(2) | Base Rent(2) | 2022 Sales |
2022 Sales PSF | 10/31/23 TTM Sales |
10/31/23 TTM Sales PSF | 10/23 TTM Occ Cost |
| The Cheesecake Factory | 10,047 | 1.8% | 12/21/2006 | $452,115 | $12,881,404 | $1,282 | $13,032,632 | $1,297 | 3.5% |
| AMC(3) | 70,000 | 12.4% | 12/14/2007 | $2,098,250 | $10,327,384 | $645,462 | $11,978,317 | $748,645 | 17.5% |
| Yard House | 10,001 | 1.8% | 12/16/2007 | $372,680 | $11,565,149 | $1,156 | $11,181,292 | $1,118 | 3.3% |
| Ay Mi Pa | 5,149 | 0.9% | 6/15/2022 | $148,818 | $3,482,939 | $676 | $8,286,242 | $1,609 | 1.8% |
| Sephora | 5,500 | 1.% | 2/1/2019 | $234,098 | $7,233,148 | $1,315 | $7,657,927 | $1,392 | 3.1% |
| Victoria's Secret | 12,000 | 2.1% | 9/18/2008 | $644,880 | $8,738,702 | $728 | $6,625,913 | $552 | 9.7% |
| Barnes & Noble | 25,000 | 4.4% | 10/17/2001 | $625,000 | $6,532,393 | $261 | $6,210,723 | $248 | 10.1% |
| Old Navy | 14,504 | 2.6% | 6/5/2019 | $386,725 | $5,732,004 | $395 | $5,628,525 | $388 | 6.9% |
| Buffalo Wild Wings | 7,800 | 1.4% | 12/15/2014 | $266,136 | $5,370,999 | $689 | $5,301,469 | $680 | 5.0% |
| H&M | 20,799 | 3.7% | 6/5/2007 | $663,000 | $5,697,151 | $274 | $4,929,042 | $237 | 13.5% |
| (1) | All sales information presented herein with respect to the Galleria at Tyler Property is based upon information provided by the borrower sponsors. In certain instances, sales figures represent estimates because the tenants are not required to report, or otherwise may not have reported sales information on a timely basis. Further, because sales are self-reported, such information is not independently verified by the borrower sponsors. |
| (2) | SF, % NRA, Lease Start, and Base Rent are based on underwritten rent roll dated December 18, 2023. |
| (3) | AMC sales reported are as of September 2023, and are provided by the tenant. AMC 2022 Sales PSF and 10/31/23 TTM Sales PSF are based on 16 screens. |
The following table presents certain information relating to the lease rollover schedule at the Galleria at Tyler Property, based on initial lease expiration dates:
| Lease Rollover Schedule(1)(2) | ||||||||||
| Year Ending December 31 | Expiring Owned GLA | % of Owned GLA | Cumulative % of Owned GLA | U/W Base Rent | % of Total U/W Base Rent | U/W Base Rent $ per SF | # of Expiring Leases | |||
| MTM | 13,055 | 2.3 | % | 2.3% | $378,984 | 1.7 | % | $29.03 | 6 | |
| 2024 | 74,917 | 13.2 | % | 15.5% | 3,269,725 | 15.0 | % | $43.64 | 28 | |
| 2025 | 37,350 | 6.6 | % | 22.1% | 2,141,618 | 9.8 | % | $57.34 | 16 | |
| 2026 | 41,185 | 7.3 | % | 29.4% | 1,967,484 | 9.0 | % | $47.77 | 18 | |
| 2027 | 46,819 | 8.3 | % | 37.7% | 2,298,810 | 10.6 | % | $49.10 | 13 | |
| 2028 | 113,861 | 20.1 | % | 57.8% | 4,197,159 | 19.3 | % | $36.86 | 14 | |
| 2029 | 56,031 | 9.9 | % | 67.7% | 1,708,785 | 7.8 | % | $30.50 | 5 | |
| 2030 | 35,988 | 6.4 | % | 74.1% | 1,399,744 | 6.4 | % | $38.89 | 7 | |
| 2031 | 1,663 | 0.3 | % | 74.4% | 125,333 | 0.6 | % | $75.37 | 1 | |
| 2032 | 37,540 | 6.6 | % | 81.0% | 1,555,323 | 7.1 | % | $41.43 | 5 | |
| 2033 | 20,884 | 3.7 | % | 84.7% | 1,333,208 | 6.1 | % | $63.84 | 6 | |
| 2034 | 27,581 | 4.9 | % | 89.6% | 1,227,829 | 5.6 | % | $44.52 | 6 | |
| 2035 & Thereafter | 4,168 | 0.7 | % | 90.3% | 173,010 | 0.8 | % | $41.51 | 5 | |
| Vacant | 54,871 | 9.7 | % | 100.0% | NAP | NA | NAP | NAP | ||
| Total / Wtd. Avg. | 565,913 | 100.0 | % | 100.0% | $21,777,012 | 100.0 | % | $42.61 | 130 | |
| (1) | Based on the underwritten rent roll dated December 18, 2023 with rent steps though December 1, 2024. |
| (2) | Certain tenants may have lease termination options that are not reflected in the Lease Rollover Schedule. |
| THE INFORMATION IN THIS STRUCTURAL AND COLLATERAL TERM SHEET IS NOT COMPLETE AND MAY BE AMENDED PRIOR TO THE TIME OF SALE. THIS TERM SHEET IS NOT AN OFFER TO SELL THESE SECURITIES AND IT IS NOT A SOLICITATION OF AN OFFER TO BUY THESE SECURITIES IN ANY JURISDICTION WHERE THE OFFER OR SALE IS NOT PERMITTED. | ||
| 109 | ||
|
Retail – Super Regional Mall 1299 Galleria at Tyler Riverside, CA 92503
|
Collateral Asset Summary – Loan No. 10 Galleria at Tyler |
Cut-off Date Balance: Cut-off Date LTV: U/W NCF DSCR: U/W NOI Debt Yield: |
$35,000,000 50.0% 1.96x 16.7% |
The following table presents certain information relating to the historical operating performance and Underwritten Net Cash Flow at the Galleria at Tyler Property:
| Cash Flow Analysis | ||||||||||
| 2019 | 2020 | 2021 | 2022 | TTM 11/2023 | U/W(1) | U/W Per SF | ||||
| Base Rent(1) | $21,286,629 | $19,588,464 | $16,032,131 | $18,149,491 | 20,074,413 | 21,777,012 | $38.48 | |||
| Gross Up Vacancy | 0 | 0 | 0 | 0 | 0 | 4,369,816 | 7.72 | |||
| Overage Rent | 677,626 | 191,399 | 1,929,273 | 3,020,101 | 2,148,900 | 1,576,946 | 2.79 | |||
| Percentage Rent in Lieu | 51,704 | 270,840 | 786,315 | 230,683 | 83,273 | 0 | 0.00 | |||
| Gross Potential Rent | $22,015,959 | $ 20,050,703 | $ 18,747,719 | $ 21,400,275 | $ 22,306,586 | $27,723,775 | $48.99 | |||
| Total Reimbursements | 11,622,000 | 11,301,120 | 7,997,303 | 8,797,039 | 8,326,854 | 8,750,398 | 15.46 | |||
| Total Gross Income | $33,637,959 | $31,351,823 | $26,745,022 | $30,197,314 | $30,633,440 | $36,474,173 | $64.45 | |||
| Other Income | 709,847 | 221,383 | 237,625 | 378,850 | 468,399 | 241,610 | 0.43 | |||
| Specialty Leasing | 3,548,392 | 2,384,991 | 4,059,320 | 4,086,308 | 4,057,312 | 4,135,711 | 7.31 | |||
| (Vacancy / Credit Loss) | (76,984) | (3,118,798) | (837,226) | 797,111 | 114,734 | (4,431,154) | (7.83) | |||
| Effective Gross Income | $37,819,214 | $30,839,398 | $30,204,741 | $35,459,583 | $35,273,885 | $36,420,340 | $64.36 | |||
| Management Fee | 1,000,000 | 1,000,000 | 1,000,000 | 1,000,000 | 1,000,000 | 1,000,000 | 1.77 | |||
| Real Estate Taxes(2) | 3,464,886 | 3,457,597 | 3,528,748 | 3,565,886 | 3,771,601 | 3,703,438 | 6.54 | |||
| Insurance | 231,728 | 283,173 | 473,191 | 605,908 | 594,172 | 652,715 | 1.15 | |||
| Other Expenses(3) | 5,957,543 | 5,169,325 | 5,693,531 | 5,864,099 | 5,910,148 | 6,078,594 | 10.74 | |||
| Total Expenses | $10,654,157 | $9,910,094 | $10,695,470 | $11,035,894 | $11,275,921 | $11,434,747 | $20.21 | |||
| Net Operating Income | $27,165,057 | $20,929,304 | $19,509,271 | $24,423,689 | $23,997,964 | $24,985,593 | $44.15 | |||
| Capital Expenditures | 0 | 0 | 0 | 0 | 0 | 209,388 | 0.37 | |||
| TI/LC | 0 | 0 | 0 | 0 | 0 | 1,131,826 | 2.00 | |||
| Net Cash Flow | $27,165,057 | $20,929,304 | $19,509,271 | $24,423,689 | $23,997,964 | $23,644,379 | $41.78 | |||
| Occupancy (%) | 93.7% | 87.9% | 82.3% | 83.7% | 90.3% | 87.9%(4) | ||||
| NCF DSCR(5) | 2.26x | 1.74x | 1.62x | 2.03x | 1.99x | 1.96x | ||||
| NOI Debt Yield(5) | 18.1% | 14.0% | 13.0% | 16.3% | 16.0% | 16.7% | ||||
| (1) | Based on the underwritten rent roll dated December 18, 2023 with rent steps though December 1, 2024. |
| (2) | With regards to the underwritten real estate taxes, the real estate tax obligations for the Mortgaged Property include assessments to pay debt service on revenue bonds with an original principal amount of $15,980,000 that relate to construction of parking improvements at the Galleria at Tyler Property. See “Description of the Mortgage Pool—Real Estate and Other Tax Considerations” in the Preliminary Prospectus. |
| (3) | Other Expenses include janitorial and cleaning, common area maintenance, utilities, marketing and advertising, landscaping, general and administrative, and security expenses. |
| (4) | Represents underwritten economic occupancy. |
| (5) | NCF DSCR and NOI Debt Yield are based on the Galleria at Tyler Whole Loan balance. |
Appraisal. According to the appraisal, the Galleria at Tyler Property had an “as-is” appraised value of $300,000,000 as of October 12, 2023.
Appraisal Approach |
Appraised Value |
Capitalization Rate |
| Income Capitalization Approach | $300,000,000 | 7.50%(1) |
| (1) | Represents the overall capitalization rate. |
Environmental Matters. According to the Phase I environmental report, dated October 12, 2023, there was no evidence of any recognized environmental conditions at the Galleria at Tyler Property.
The Market. The Galleria at Tyler Property is located in the Riverside, California submarket, approximately 55 miles east of Los Angeles International Airport, adjacent to Riverside Freeway and six miles east of I-15. Riverside is the largest city in the Inland Empire market, the metropolitan region inland of and adjacent to coastal Southern California, bordering Los Angeles County to the west. The Galleria at Tyler Property’s trade area consists of a population of approximately 1.4 million residents with an average household income over $98,640 as of 2022. Local industry drivers with the largest labor forces include local county and school officials, County of Riverside, March Air Force, and University of California, totaling approximately 43,000 employees. The Galleria at Tyler Property benefits from proximity to multiple colleges and universities within a fifteen-minute drive, including the University of California, Riverside, with a total student population of approximately 27,000. The Galleria at Tyler Property is the only shopping center in Riverside and is situated in between I-15 and I-215. The Galleria at Tyler Property is located approximately 17 miles from its closest competitor. The nearest Francesca’s, Yard House, The Cheesecake Factory, P.F. Chang’s, Aldo, Pandora, and AMC are located over 20 miles away, and the next closest Journeys, Miniso, Shoe Palace, Foot Locker, H&M are over 15 miles away.
| THE INFORMATION IN THIS STRUCTURAL AND COLLATERAL TERM SHEET IS NOT COMPLETE AND MAY BE AMENDED PRIOR TO THE TIME OF SALE. THIS TERM SHEET IS NOT AN OFFER TO SELL THESE SECURITIES AND IT IS NOT A SOLICITATION OF AN OFFER TO BUY THESE SECURITIES IN ANY JURISDICTION WHERE THE OFFER OR SALE IS NOT PERMITTED. | ||
| 110 | ||
|
Retail – Super Regional Mall 1299 Galleria at Tyler Riverside, CA 92503
|
Collateral Asset Summary – Loan No. 10 Galleria at Tyler |
Cut-off Date Balance: Cut-off Date LTV: U/W NCF DSCR: U/W NOI Debt Yield: |
$35,000,000 50.0% 1.96x 16.7% |
The Galleria at Tyler Property is located within the Riverside retail submarket. The Riverside retail submarket is comprised of approximately 17.7 million SF of retail space, accounting for 8.80% of the 201.6 million SF of the Inland Empire market inventory. Over the 12 months ending December 2023, the Riverside market has delivered approximately 68,600 SF of retail space and had annual rent growth of 3.0%.
The following tables presents certain information relating to the demographics of the Galleria at Tyler Property:
| Demographics Summary(1)(2) | ||||||||
| Property Name | City, State | Whole Loan Cut-off Date Balance | 1-mile Population | 3-mile Population | 5-mile Population | 1-mile Avg Household Income | 3-mile Avg Household Income | 5-mile Avg Household Income |
| Galleria at Tyler | Riverside, CA | $150,000,000 | 18,955 | 137,599 | 251,187 | $80,749 | $97,717 | $104,065 |
| (1) | Source: Appraisal. |
| (2) | Values are as of 2022. |
The Borrower and the Borrower Sponsors. The borrower for the Galleria at Tyler Whole Loan is Tyler Mall Limited Partnership, a Delaware limited partnership and single purpose entity with two independent directors. Legal counsel to the borrower delivered a non-consolidation opinion in connection with the origination of the Galleria at Tyler Whole Loan.
The borrower sponsors are Brookfield Properties Retail Holding LLC (“Brookfield Retail”) and the Teachers’ Retirement System of the State of Illinois (“TRSIL”), each of which owns a 50% interest in the borrower. The non-recourse carveout guarantor is GGP-TRS L.L.C., an affiliate of Brookfield Retail and the 100% owner of the borrower. Brookfield Retail is a fully integrated, diversified global real estate services company that has portfolio management and development capabilities across the real estate investment strategies of Brookfield Corporation. Brookfield Property Partners owns, operates and develops a large portfolio of office, retail, multifamily, industrial, hospitality, triple net lease, student housing and manufactured housing assets. Brookfield Retail owns over 160 retail properties totaling over 130 million SF throughout the United States.
TRSIL is an Illinois state government agency dealing with pensions and other financial benefits for teachers and other workers in education in Illinois. The Illinois General Assembly created TRSIL of Illinois in 1939 for the purpose of providing retirement annuities, and disability and survivor benefits for educators employed in public schools outside the city of Chicago. As of September 30, 2023, TRSIL had nearly $66.0 billion of assets under management.
Property Management. The Galleria at Tyler Property is managed by Brookfield Properties Retail Inc., a Delaware corporation, an affiliate of Brookfield Retail.
Initial and Ongoing Reserves. At origination, the borrower was required to deposit $5,000,000 into a general reserve (to be used for capital expenditures and leasing expenses), $4,687,691.09 into an outstanding landlord obligations reserve and approximately $236,687 into a gap rent reserve.
Tax Reserve – During the continuance of a Cash Management Period (as defined below) or from and after the date on which the borrower first requests a disbursement from the General Reserve (a “General Reserve Disbursement Date”), the borrower is required to escrow 1/12th of the annual estimated tax payments payable during the next ensuing 12 months on a monthly basis.
Insurance Reserve – During the continuance of a Cash Management Period, or from and after a General Reserve Disbursement Date the borrower is required to escrow 1/12th of the annual estimated insurance payments on a monthly basis, unless the Galleria at Tyler Property is insured under a blanket policy meeting the requirements of the related loan agreement (in which case no insurance escrows will be required).
Replacement Reserve – During the continuance of a Cash Management Period or from and after a General Reserve Disbursement Date, the borrower is required to deposit monthly into a replacement reserve an amount equal to $17,448.83 for repairs and replacements required to be made to the Galleria at Tyler Property during the calendar year.
TI/LC Reserve – During the continuance of a Cash Management Period or from and after a General Reserve Disbursement Date, the borrower is required to deposit into a rollover reserve $94,318, for tenant improvement, landlord work, tenant improvement allowance, leasing commission obligations, reasonable legal fees and related tenant capital costs incurred following the origination date.
| THE INFORMATION IN THIS STRUCTURAL AND COLLATERAL TERM SHEET IS NOT COMPLETE AND MAY BE AMENDED PRIOR TO THE TIME OF SALE. THIS TERM SHEET IS NOT AN OFFER TO SELL THESE SECURITIES AND IT IS NOT A SOLICITATION OF AN OFFER TO BUY THESE SECURITIES IN ANY JURISDICTION WHERE THE OFFER OR SALE IS NOT PERMITTED. | ||
| 111 | ||
|
Retail – Super Regional Mall 1299 Galleria at Tyler Riverside, CA 92503
|
Collateral Asset Summary – Loan No. 10 Galleria at Tyler |
Cut-off Date Balance: Cut-off Date LTV: U/W NCF DSCR: U/W NOI Debt Yield: |
$35,000,000 50.0% 1.96x 16.7% |
Lockbox / Cash Management. The Galleria at Tyler Whole Loan is structured with a hard lockbox and springing cash management. The borrower is required to cause all tenants at the Galleria at Tyler Property (other than tenants under Seasonal Leases (as defined below)) to pay rents (other than Non-Core Income (as defined below) directly into a lockbox account controlled by the Lender (the “Lockbox Account”), and to deposit any rents otherwise received by the borrower or the property manager (other than Non-Core Income) into the Lockbox Account within two business days after receipt. Prior to a Cash Management Period, all funds in the Lockbox Account will be disbursed to the borrower’s operating account. During the continuance of a Cash Management Period, all funds deposited into the Lockbox Account are required to be swept each business day into a deposit account controlled by the lender (the “Cash Management Account”), to be applied and disbursed in accordance with the loan documents to pay (i) the tax and insurance escrow deposits, if any, described above, (ii) , provided that no default exists as to which the lender has initiated an enforcement action, to pay budgeted operating expenses (or actual operating expenses to the extent not more than 115% of budgeted expenses), budgeted capital expenses (or actual capital expenses to the extent not more than 110% of budgeted expenses), lender-approved extraordinary expenses, and (iii) the replacement and rollover reserve deposits, if any, described above . During the continuance of a Cash Management Period, any excess cash is required to be deposited into an excess cash reserve account to be held by the lender as additional security for the Galleria at Tyler Whole Loan; provided, that, funds on deposit in such account will be made available to the borrower for the payment of certain property-level expenses and other uses, including REIT distributions up to $200,000.
“Non-Core Income” means (i) certain de minimis amounts of rents from miscellaneous revenue items such as holiday photos and change retrieved from fountains (but will not include rent from Seasonal Leases) and (ii) certain rents generated pursuant to multi-property sponsorship and advertising programs which are directly attributable to the Galleria at Tyler Property.
“Seasonal Leases” means leases or license agreements having a maximum term of one year or less.
A “Cash Management Period” means a period commencing upon (i) an event of default under the Galleria at Tyler Whole Loan, (ii) the Debt Yield is less than 14% as of the end of any two consecutive calendar quarters (a “Low Debt Yield Period”), or (iii) any Anchor (as defined below) (A) has “gone dark” (i.e., ceased to utilize its space for business purposes), other than a temporary closure in connection (x) with a restoration, repair or renovation, (y) compliance with applicable law, regulations and/or governmental mandates or (z) an event of force majeure, (B) has vacated its space; or (C) is the subject of certain bankruptcy or insolvency events (“Anchor Trigger Event”). A Cash Management Period resulting from an event of default will end if the lender has waived or the borrower has cured such event of default. A Cash Management Period resulting from a Low Debt Yield Period will end if the borrower has maintained a debt yield equal to or in excess of 14% for two consecutive calendar quarters or has either (i) prepaid the Galleria at Tyler Whole Loan (without payment of a prepayment fee or yield maintenance), (ii) delivered cash to the lender, or (iii) delivered a letter of credit to the lender, in each case in an amount which if subtracted from the outstanding principal balance of the Galleria at Tyler Whole Loan would cause the Debt Yield to equal or exceed 14%. A Cash Management Period resulting from an Anchor Trigger Event will end if (i) for any Anchor Trigger Event described in clause (A) or (B) of the definition of Anchor Trigger Event, such Anchor operates the demised premises (to the extent not subject to any permitted subletting) for a period of no less than 30 consecutive operating days; (ii) for any Anchor Trigger Event described in clause (C) of the definition of Anchor Trigger Event, (x) if such premises occupied by the Anchor are owned by the Anchor, the bankruptcy or insolvency is dismissed or the Anchor has emerged from such bankruptcy or insolvency action and is continuing to occupy its premises or a substantial portion thereof, and (y) if such premises occupied by the Anchor are leased by the borrower to the Anchor, such lease is accepted and affirmed by the Anchor in the bankruptcy or insolvency action; or (iii) for any Anchor Trigger Event, the Anchor space or a substantial portion thereof becomes owned or leased by one or more replacement occupants reasonably approved by the lender. Upon the end of a Cash Management Period (provided the General Reserve Disbursement Date has not yet occurred), all remaining funds in the Cash Management Account will be disbursed to the borrowers.
“Anchor” means any of (i) JC Penney, Macy’s, Forever 21, Furniture City and AMC, (ii) any tenant who occupies all or substantially all of the space currently occupied by the foregoing after an acquisition of such space by the borrower or one of its affiliates, and (iii) any replacement of either of the foregoing.
Current Mezzanine or Secured Subordinate Indebtedness. None.
Permitted Future Mezzanine or Secured Subordinate Indebtedness. Not Permitted.
| THE INFORMATION IN THIS STRUCTURAL AND COLLATERAL TERM SHEET IS NOT COMPLETE AND MAY BE AMENDED PRIOR TO THE TIME OF SALE. THIS TERM SHEET IS NOT AN OFFER TO SELL THESE SECURITIES AND IT IS NOT A SOLICITATION OF AN OFFER TO BUY THESE SECURITIES IN ANY JURISDICTION WHERE THE OFFER OR SALE IS NOT PERMITTED. | ||
| 112 | ||
|
Retail – Super Regional Mall 1299 Galleria at Tyler Riverside, CA 92503
|
Collateral Asset Summary – Loan No. 10 Galleria at Tyler |
Cut-off Date Balance: Cut-off Date LTV: U/W NCF DSCR: U/W NOI Debt Yield: |
$35,000,000 50.0% 1.96x 16.7% |
Release of Collateral. The borrower may obtain the release of (A) one or more vacant, non-income producing and unimproved (or improved only by landscaping, surface parking or utility facilities that are either readily re-locatable or will continue to serve the Galleria at Tyler Property) parcels (including “air rights” parcels) or outlots (provided, however, that this condition will not apply to any Galleria at Tyler Expansion Parcels (as defined below), or (B) any Galleria at Tyler Acquired Parcels (as defined below), including, if applicable, any Anchor parcel, upon satisfaction of specified conditions including, among other things, that (i) there is no event of default, (ii) the borrower delivers evidence that the parcel subject to release is not necessary for the borrower’s operation or use of the remaining Galleria at Tyler Property and may be readily separated from the Galleria at Tyler Property without a material diminution in value, (iii) the parcel subject to release has been legally subdivided and after giving effect to such transfer, the release parcel and the remaining Galleria at Tyler Property conform to legal requirements and constitute separate tax lots (or all action has been taken to effectuate the same), (iv) the parcel subject to the release is not necessary for the remaining portion of the Galleria at Tyler Property to comply with zoning or legal requirements, (v) receipt of a rating agency confirmation from the applicable rating agencies (provided that such confirmation will not be required for release of a Galleria at Tyler Expansion Parcel or if the rating agency has waived review or failed to respond within 30 days to a request for such confirmation), and (vi) the release will not result in a loan-to-value ratio that does not comply with REMIC guidelines provided that the borrower may prepay the Galleria at Tyler Whole Loan to meet such condition, with payment of a yield maintenance premium calculated based upon the amount prepaid, unless the borrower receives an opinion of counsel that the issuing entity will not fail to maintain its status as a REMIC trust as a result of the release of the Release Parcel.
In addition, the borrower has the right, at its own expense, to acquire one or more parcels of land that constitutes an integral part of, or adjoins or is proximately located near, the shopping center of which the Galleria at Tyler Property is a part, which land was not owned by the borrower on the origination date (such acquired land, a “Galleria at Tyler Expansion Parcel”), to become additional collateral for the Galleria at Tyler Whole Loan, upon satisfaction of specified conditions including, among other things, that (i) there is no event of default, (ii) the borrower acquires a fee simple or leasehold interest in the applicable Galleria at Tyler Expansion Parcel, and (iii) the borrower delivers, among other things (a) unless the Galleria at Tyler Expansion Parcel is already covered by the environmental report delivered at origination, an environmental report indicating no hazardous substances except for nominal amounts (except as permitted under clause (d) below), (b) security documents creating a mortgage lien on the Galleria at Tyler Expansion Parcel, and title insurance, (c) if the Galleria at Tyler Expansion Parcel is improved, subject to certain exceptions, a property condition report indicating that the Galleria at Tyler Expansion Parcel is in good condition and (d) if repairs are recommended by the property condition report or if the environmental report discloses the presence of hazardous materials at the Galleria at Tyler Expansion Parcel, and the cost of such repairs or remediation is reasonably likely to exceed 10% of the original principal balance of the Galleria at Tyler Whole Loan, cash or an indemnity from the guarantor, certain of its affiliates, or an entity otherwise meeting ratings or financial tests set forth in the loan documents, in an amount equal to 125% of any estimated repairs or remediation costs, as applicable.
The borrower is also permitted to obtain the release of collateral parcels (each, a “Galleria at Tyler Exchange Parcel”) from the lien of the mortgage in exchange for the substitution of new parcels in which the borrower acquires a fee or leasehold interest (each, a “Galleria at Tyler Acquired Parcel”) as collateral for the Galleria at Tyler Whole Loan upon 20 days’ prior notice, subject to the satisfaction of certain conditions, including among other things, that: (i) the Galleria at Tyler Exchange Parcel (unless it is a Galleria at Tyler Expansion Parcel) is vacant, non-income producing and unimproved or improved only by landscaping, surface parking or utility facilities that are readily re-locatable or that will continue to serve the Galleria at Tyler Property (and the borrower is able to make certain zoning representations as to the Galleria at Tyler Acquired Parcel to the same extent as made with respect to the Galleria at Tyler Exchange Parcel), (ii) the Galleria at Tyler Acquired Parcel is reasonably equivalent in value to the Galleria at Tyler Exchange Parcel, as established by a letter of value from the appraiser which appraised the Galleria at Tyler Galleria at Tyler Property or an appraiser of comparable experience selected by the borrower, (iii) with respect to the Galleria at Tyler Acquired Parcel, the borrower has delivered, among other things (a) unless the Galleria at Tyler Acquired Parcel is already covered by the environmental report delivered at origination, an environmental report indicating no hazardous substances except for nominal amounts (except as permitted under clause (d) below), (b) security documents creating a mortgage lien on the Galleria at Tyler Acquired Parcel, and title insurance, (c) if the Galleria at Tyler Acquired Parcel is improved, subject to certain exceptions, a property condition report indicating that the Galleria at Tyler Acquired Parcel is in good condition, and (d) if repairs are recommended by the property condition report or if the environmental report discloses the presence of hazardous materials at the Galleria at Tyler Acquired Parcel, and the cost of such repairs or remediation is likely to exceed 10% of the original principal balance of the Galleria at Tyler Whole Loan, cash or an indemnity from the guarantor, certain of its affiliates, or an entity otherwise meeting ratings or financial tests set forth in the Galleria at Tyler Whole Loan documents, in an amount equal to 125% of any estimated repairs or remediation costs, as applicable, (e) the loan-to-value ratio (after giving effect to such substitution) is equal to or less than 125% (in compliance with REMIC guidelines), provided that the borrower may prepay the Galleria at Tyler Whole Loan in order to meet such condition, with payment of a yield maintenance premium calculated based upon the amount prepaid, unless the borrower receives an opinion of counsel that the issuing entity will not fail to maintain its status as a REMIC trust as a result of the substitution and (f) the lender has received a rating agency confirmation from the applicable rating agencies, unless the applicable rating agency declines or fails to respond to the request for such confirmation.
Ground Lease. None.
| THE INFORMATION IN THIS STRUCTURAL AND COLLATERAL TERM SHEET IS NOT COMPLETE AND MAY BE AMENDED PRIOR TO THE TIME OF SALE. THIS TERM SHEET IS NOT AN OFFER TO SELL THESE SECURITIES AND IT IS NOT A SOLICITATION OF AN OFFER TO BUY THESE SECURITIES IN ANY JURISDICTION WHERE THE OFFER OR SALE IS NOT PERMITTED. | ||
| 113 | ||
Self Storage – Self Storage 18975 Marbach Lane San Antonio, TX 78266
|
Collateral Asset Summary – Loan No. 11 Forward Storage San Antonio |
Cut-off Date Balance: Cut-off Date LTV: U/W NCF DSCR: U/W NOI Debt Yield: |
$30,925,000 59.7% 1.27x 9.7% |
| Mortgage Loan Information | Properties Information | |||
| Loan Seller: | CREFI | Single Asset / Portfolio: | Single Asset | |
| Loan Purpose: | Refinance | Properties Type – Subtype: | Self Storage – Self Storage | |
| Borrower Sponsor(s): | Praveen Reddy and Sumeet Patel | Collateral: | Fee | |
| Borrower(s): | Evans Marbach 2 LLC | Location: | San Antonio, TX | |
| Original Balance: | $30,925,000 | Year Built / Renovated(1): | Various / NAP | |
| Cut-off Date Balance: | $30,925,000 | Property Management: | Forward Storage LLC | |
| % by Initial UPB: | 3.5% | Size: | 401,018 SF | |
| Interest Rate: | 7.42000% | Appraised Value / Per SF: | $51,800,000 / $129 | |
| Note Date: | December 13, 2023 | Appraisal Date: | October 12, 2023 | |
| Original Term: | 60 months | Occupancy: | 92.4% (as of November 1, 2023) | |
| Amortization: | Interest Only | UW Economic Occupancy: | 92.0% | |
| Original Amortization: | NAP | Underwritten NOI(2): | $3,005,232 | |
| Interest Only Period: | 60 months | Underwritten NCF: | $2,965,130 | |
| First Payment Date: | February 6, 2024 | |||
| Maturity Date: | January 6, 2029 | Historical NOI | ||
| Additional Debt Type: | NAP | Most Recent NOI(2): | $2,423,289 (TTM 11/30/2023) | |
| Additional Debt Balance: | NAP | 2022 NOI(3): | NAV | |
| Call Protection: | L(24),D(29),O(7) | 2021 NOI(3): | NAV | |
| Lockbox / Cash Management: | Springing / Springing | 2020 NOI(3): | NAV | |
| Reserves | Financial Information | ||||||
| Initial | Monthly | Cap | Cut-off Date Loan / SF: | $77 | |||
| Taxes: | $17,075 | $17,075 | NAP | Maturity Date Loan / SF: | $77 | ||
| Insurance: | $47,138 | $5,892 | NAP | Cut-off Date LTV: | 59.7% | ||
| Replacement Reserves: | $0 | $3,666 | $200,000 | Maturity Date LTV: | 59.7% | ||
| TI / LC: | $0 | $0 | NAP | UW NOI DY: | 9.7% | ||
| UW NCF DSCR: | 1.27x | ||||||
| Sources and Uses | |||||||
| Sources | Proceeds | % of Total | Uses | Proceeds | % of Total | ||
| Mortgage Loan | $30,925,000 | 100.0% | Loan Payoff | $15,879,492 | 51.3 | % | |
| Return of Equity | 13,852,210 | 44.8 | |||||
| Closing Costs(4) | 1,129,085 | 3.7 | |||||
| Upfront Reserves | 64,213 | 0.2 | |||||
| Total Sources | $30,925,000 | 100.0% | Total Uses | $30,925,000 | 100.0 | % | |
| (1) | The Forward Storage San Antonio property was built in phases in the years 1974, 1989, 1992, 1994-1995, 1997-1999, 2004, 2009, 2011, 2015 and 2021. |
| (2) | The increase from the Most Recent NOI to Underwritten NOI is primarily driven by the borrower sponsors increasing monthly rents on storage units while also increasing occupancy at the Forward Storage San Antonio property. |
| (3) | 2020 NOI, 2021 NOI and 2022 NOI are not available because the Forward Storage San Antonio property was recently acquired in June 2022. |
| (4) | Closing Costs includes a rate buydown of $309,250. |
| THE INFORMATION IN THIS STRUCTURAL AND COLLATERAL TERM SHEET IS NOT COMPLETE AND MAY BE AMENDED PRIOR TO THE TIME OF SALE. THIS TERM SHEET IS NOT AN OFFER TO SELL THESE SECURITIES AND IT IS NOT A SOLICITATION OF AN OFFER TO BUY THESE SECURITIES IN ANY JURISDICTION WHERE THE OFFER OR SALE IS NOT PERMITTED. | ||
| 114 | ||
Self Storage – Self Storage 18975 Marbach Lane San Antonio, TX 78266
|
Collateral Asset Summary – Loan No. 11 Forward Storage San Antonio |
Cut-off Date Balance: Cut-off Date LTV: U/W NCF DSCR: U/W NOI Debt Yield: |
$30,925,000 59.7% 1.27x 9.7% |
The following table presents certain information relating to the unit mix at the Forward Storage San Antonio property:
| Unit Mix(1) | ||||||
| Unit Type | Net Rentable Area (Sq. Ft.) | % of NRA (Sq. Ft.) | # of Units | Occupancy(2) | % of UW Rent by Unit Type | UW Rent per Unit |
| <500 SF | 57,968 | 14.5% | 164 | 90.2% | 12.9% | $3,426 |
| >500 SF | 343,050 | 85.5 | 190 | 89.5% | 84.8 | $19,539 |
| Parking | 0 | 0.0 | 102 | 70.6% | 2.3 | $1,245 |
| Total / Wtd Avg. | 401,018 | 100.0% | 456 | 85.5% | 100.0% | $10,047 |
| (1) | Based on the underwritten rent roll dated November 1, 2023. |
| (2) | Occupancy calculated based on # of Units. |
The following table presents certain information relating to the historical operating performance and Underwritten Net Cash Flow at the Forward Storage San Antonio property:
| Cash Flow Analysis(1)(2) | ||||
| T-12 11/30/2023 | U/W | UW Per SF | ||
| In-Place Storage Rent | $3,348,303 | $3,918,456 | $9.77 | |
| Potential Income from Vacant Units | 0 | 339,912 | $0.85 | |
| Net Rental Income | $3,348,303 | $4,258,368 | $10.62 | |
| Vacancy & Credit Loss | 0 | (339,912) | ($0.85) | |
| Effective Gross Income | $3,348,303 | $3,918,456 | $9.77 | |
| Real Estate Taxes | 221,939 | 196,114 | $0.49 | |
| Insurance | 65,585 | 67,340 | $0.17 | |
| Management Fee | 100,313 | 117,554 | $0.29 | |
| Other Operating Expenses(3) | 537,176 | 532,217 | $1.33 | |
| Total Expenses | $925,014 | $913,225 | $2.28 | |
| Net Operating Income(4) | $2,423,289 | $3,005,232 | $7.49 | |
| Replacement Reserves | 0 | 40,102 | $0.10 | |
| Net Cash Flow | $2,423,289 | $2,965,130 | $7.39 | |
| Occupancy | 86.4% | 92.0% | (5) | |
| NCF DSCR | 1.04x | 1.27x | ||
| NOI Debt Yield | 7.8% | 9.7% | ||
| (1) | Based on the underwritten rent roll dated November 1, 2023. |
| (2) | Historical financial information is not available because the Forward Storage San Antonio property was recently acquired by the borrower sponsors in June 2022. |
| (3) | Other Operating Expenses consist of personnel, advertising, general and administrative, utilities and repairs and maintenance. |
| (4) | The increase from the T-12 11/30/2023 Net Operating Income to Underwritten Net Operating Income is primarily driven by the borrower sponsors increasing monthly rents on storage units while also increasing occupancy at the Forward Storage San Antonio property. |
| (5) | U/W occupancy is based on the economic occupancy. |
| THE INFORMATION IN THIS STRUCTURAL AND COLLATERAL TERM SHEET IS NOT COMPLETE AND MAY BE AMENDED PRIOR TO THE TIME OF SALE. THIS TERM SHEET IS NOT AN OFFER TO SELL THESE SECURITIES AND IT IS NOT A SOLICITATION OF AN OFFER TO BUY THESE SECURITIES IN ANY JURISDICTION WHERE THE OFFER OR SALE IS NOT PERMITTED. | ||
| 115 | ||
Multifamily-Garden Various Various, MI
|
Collateral Asset Summary – Loan No. 12 Millennia Michigan Multi |
Cut-off Date Balance: Cut-off Date LTV: U/W NCF DSCR: U/W NOI Debt Yield: |
$30,000,000 68.0% 1.29x 9.3% |
| Mortgage Loan Information | |
| Loan Seller(s): | CREFI |
| Loan Purpose: | Refinance |
| Borrower Sponsor(s): | Frank T. Sinito |
| Borrower(s): | Portage MI Investment Holdings, LLC and Mt. Pleasant/Canterbury, LLC |
| Original Balance: | $30,000,000 |
| Cut-off Date Balance: | $30,000,000 |
| % by Initial UPB: | 3.4% |
| Interest Rate: | 6.75000% |
| Note Date: | December 15, 2023 |
| Original Term: | 60 months |
| Amortization: | Interest Only |
| Original Amortization: | NAP |
| Interest Only Period: | 60 months |
| First Payment Date: | February 6, 2024 |
| Maturity Date: | January 6, 2029 |
| Additional Debt Type: | NAP |
| Additional Debt Balance: | NAP |
| Call Protection: | L(24),D(29),O(7) |
| Lockbox / Cash Management: | Soft / Springing |
| Property Information | |
| Single Asset / Portfolio: | Portfolio |
| Property Type – Subtype: | Multifamily – Garden |
| Collateral: | Fee |
| Location(2): | Various, MI |
| Year Built / Renovated(2): | Various / Various |
| Property Management: | Millennia Housing Management, Ltd. |
| Size: | 559 Units |
| Appraised Value / Per Unit(3): | $44,150,000 / $78,980 |
| Appraisal Date(3): | October 26, 2023 |
| Occupancy: | 93.2% (as of November 1, 2023) |
| UW Economic Occupancy: | 92.4% |
| Underwritten NOI(4): | $2,804,924 |
| Underwritten NCF: | $2,654,990 |
| Historical NOI | |
| Most Recent NOI(4): | $2,517,065 (TTM September 30, 2023) |
| 2022 NOI: | $2,169,910 |
| 2021 NOI: | $1,826,579 |
| 2020 NOI: | $2,172,619 |
| Financial Information | |
| Cut-off Date Loan Per Unit: | $53,667 |
| Maturity Date Loan Per Unit: | $53,667 |
| Cut-off Date LTV(3): | 68.0% |
| Maturity Date LTV(3): | 68.0% |
| UW NOI DY: | 9.3% |
| UW NCF DSCR: | 1.29x |
| Reserves | |||
| Initial | Monthly | Cap | |
| Taxes: | $117,500 | $29,375 | NAP |
| Insurance: | $208,097 | Springing | NAP |
| Replacement Reserve: | $0 | $12,495 | NAP |
| Deferred Maintenance: | $1,246,438 | $0 | NAP |
| Other(1): | $1,900,000 | $0 | NAP |
| Sources and Uses | |||||||
| Sources | Proceeds | % of Total | Uses | Proceeds | % of Total | ||
| Loan Amount | $30,000,000 | 100.0% | Loan Payoff | $22,615,151 | 75.4 | % | |
| Upfront Reserves | 3,472,034 | 11.6 | |||||
| Closing Costs(5) | 2,221,354 | 7.4 | |||||
| Return of Equity | 1,691,461 | 5.6 | |||||
| Total Sources | $30,000,000 | 100.0% | Total Uses | $30,000,000 | 100.0 | % | |
| (1) | Other Reserves consists of a $1,900,000 reserve dedicated to walkway repairs at the Davis Creek Apartments property. |
| (2) | See ”Portfolio Summary” chart below. |
| (3) | The Appraised Value of $44,150,000 represents the aggregate of the “Hypothetical As Complete" appraised value of $30,850,000 as of October 26, 2023 for the Davis Creek Apartments property, which assumes the completion of certain improvements at the Davis Creek Apartments property and the “as is” appraised value of $13,300,000 as of October 26, 2023 for the Canterbury East Apartments property. In connection with such improvements to the Davis Creek Apartments property, the borrowers deposited $1,900,000 into an upfront reserve. The “as is” appraised value as of October 26, 2023 for the Davis Creek Apartments property is $30,000,000. Based on the Millennia Michigan Multi Portfolio properties aggregate “as-is” value of $43,300,000, the Cut-off Date LTV and Maturity Date LTV for the Millennia Michigan Multi Portfolio mortgage loan are 69.3%. |
| (4) | The increase from Most Recent NOI to Underwritten NOI is primarily attributable to the potential income from vacant space. |
| (5) | Closing Costs includes a rate buydown fee of $1,200,000. |
| THE INFORMATION IN THIS STRUCTURAL AND COLLATERAL TERM SHEET IS NOT COMPLETE AND MAY BE AMENDED PRIOR TO THE TIME OF SALE. THIS TERM SHEET IS NOT AN OFFER TO SELL THESE SECURITIES AND IT IS NOT A SOLICITATION OF AN OFFER TO BUY THESE SECURITIES IN ANY JURISDICTION WHERE THE OFFER OR SALE IS NOT PERMITTED. | ||
| 116 | ||
Multifamily-Garden Various Various, MI
|
Collateral Asset Summary – Loan No. 12 Millennia Michigan Multi |
Cut-off Date Balance: Cut-off Date LTV: U/W NCF DSCR: U/W NOI Debt Yield: |
$30,000,000 68.0% 1.29x 9.3% |
The following table presents certain information relating to the Millennia Michigan Multi Portfolio properties:
| Portfolio Summary | |||||||||
| Property Name | City, State | Year Built / Renovated | Units(1) | Occupancy(1) | Allocated Cut-off Date Balance | % of Cut-off Date Balance | Appraised Value(2)(3) | U/W NOI(1) | % of U/W NOI |
| Davis Creek Apartments | Portage, MI | 1968 / 2013 | 407 | 92.9% | $23,000,000 | 76.7% | $30,850,000 | $2,185,046 | 77.9% |
| Canterbury East Apartments | Mount Pleasant, MI | 1979 / 2003 | 152 | 94.1% | 7,000,000 | 23.3% | 13,300,000 | $619,878 | 22.1% |
| Total / Wtd. Avg. | 559 | 93.2% | $30,000,000 | 100.0% | $44,150,000 | $2,804,924 | 100.0% | ||
| (1) | Based on the underwritten rent rolls dated November 1, 2023. |
| (2) | Source: Appraisals. |
| (3) | The Appraised Value of $44,150,000 represents the aggregate of the “Hypothetical As Complete" appraised value of $30,850,000 as of October 26, 2023 for the Davis Creek Apartments mortgaged property, which assumes the completion of certain improvements at the mortgaged property and the “as is” appraised value of $13,300,000 as of October 26, 2023 for the Canterbury East Apartments mortgaged property. In connection with such improvements to the Davis Creek Apartments mortgaged property, the borrowers deposited $1,900,000 into an upfront reserve. The “as is” appraised value as of October 26, 2023 for the Davis Creek Apartments mortgaged property is $30,000,000. Based on the Millennia Michigan Multi Portfolio mortgaged properties aggregate “as is” value of $43,300,000, the Cut-off Date LTV and Maturity Date LTV for the Millennia Michigan Multi Portfolio mortgage loan are 69.3%. |
The following table presents certain information relating to the unit mix at the Davis Creek Apartments property:
| Unit Mix(1) | ||||||
| Unit Type | # of Units | % of Total Units | Occupancy | Average Unit Size (SF) | Average Monthly Rent Per Unit | Average Monthly Market Rent Per Unit(2) |
| Studio | 32 | 7.9% | 96.9% | 399 | $670 | $695 |
| 1BD | 276 | 67.8% | 95.7% | 506 | $792 | $828 |
| 2BD | 62 | 15.2% | 83.9% | 646 | $1,030 | $1,068 |
| 2BD+ | 36 | 8.8% | 83.3% | 731 | $1,096 | $1,138 |
| Office | 1 | 0.2% | 100.0% | 0 | $0 | NAV |
| Total / Wtd. Avg. | 407 | 100.0% | 92.9% | 539(3) | $840(3) | $882(3) |
| (1) | Based on the underwritten rent roll dated November 1, 2023. |
| (2) | Source: Appraisal. |
| (3) | Excludes the one office unit. |
The following table presents certain information relating to the unit mix at the Canterbury East Apartments mortgaged property:
| Unit Mix(1) | ||||||
| Unit Type | # of Units | % of Total Units | Occupancy | Average Unit Size (SF) | Average Monthly Rent Per Unit | Average Monthly Market Rent Per Unit(2) |
| 1BR/1BA | 61 | 40.1% | 95.1% | 766 | $853 | $850 |
| 1BR/1BA Deluxe | 16 | 10.5% | 100.0% | 766 | $909 | $900 |
| 1BR/1BA Heat | 5 | 3.3% | 100.0% | 766 | $886 | $875 |
| 2BR/2BA | 30 | 19.7% | 93.3% | 942 | $910 | $950 |
| 2BR/2BA Deluxe | 24 | 15.8% | 91.7% | 942 | $928 | $1,020 |
| 2BR/2BA Fireplace | 16 | 10.5% | 87.5% | 942 | $957 | $1,025 |
| Total / Wtd. Avg. | 152 | 100.0% | 94.1% | 847 | $893 | $921 |
| (1) | Based on the underwritten rent roll dated November 1, 2023. |
| (2) | Source: Appraisal. |
| THE INFORMATION IN THIS STRUCTURAL AND COLLATERAL TERM SHEET IS NOT COMPLETE AND MAY BE AMENDED PRIOR TO THE TIME OF SALE. THIS TERM SHEET IS NOT AN OFFER TO SELL THESE SECURITIES AND IT IS NOT A SOLICITATION OF AN OFFER TO BUY THESE SECURITIES IN ANY JURISDICTION WHERE THE OFFER OR SALE IS NOT PERMITTED. | ||
| 117 | ||
Multifamily-Garden Various Various, MI
|
Collateral Asset Summary – Loan No. 12 Millennia Michigan Multi |
Cut-off Date Balance: Cut-off Date LTV: U/W NCF DSCR: U/W NOI Debt Yield: |
$30,000,000 68.0% 1.29x 9.3% |
The following table presents certain information relating to the historical operating performance and Underwritten Net Cash Flow at the Millennia Michigan Multi Portfolio mortgaged properties:
| Cash Flow Analysis(1) | ||||||
| 2020 | 2021 | 2022 | T-12 9/30/2023 | U/W | U/W Per Unit | |
| Residential Rents in Place | $4,619,889 | $4,836,842 | $5,160,053 | $5,433,402 | $5,301,132 | $9,483.24 |
| Potential Income from Vacant Units | 0 | 0 | 0 | 0 | 438,600 | $784.62 |
| Gross Potential Rent | $4,619,889 | $4,836,842 | $5,160,053 | $5,433,402 | $5,739,732 | $10,267.86 |
| Other Income(2) | 393,732 | 436,268 | 460,283 | 417,420 | 417,420 | $746.73 |
| Net Rental Income | 5,013,621 | 5,273,110 | 5,620,336 | 5,850,823 | 6,157,152 | $11,014.58 |
| Vacancy | (237,138) | (340,059) | (275,016) | (425,519) | (438,600) | ($784.62) |
| Effective Gross Income | $4,776,483 | $4,933,051 | $5,345,320 | $5,425,303 | $5,718,552 | $10,229.97 |
| Real Estate Taxes | 304,992 | 349,112 | 346,305 | 314,460 | 339,016 | $606.47 |
| Insurance | 276,140 | 287,301 | 288,169 | 310,183 | 339,750 | $607.78 |
| Management Fee | 187,609 | 281,679 | 302,996 | 220,290 | 171,557 | $306.90 |
| Other Expenses(3) | 1,835,123 | 2,188,380 | 2,237,940 | 2,063,305 | 2,063,305 | $3,691.06 |
| Total Expenses | $2,603,864 | $3,106,472 | $3,175,410 | $2,908,239 | $2,913,628 | $5,212.21 |
| Net Operating Income(4) | $2,172,619 | $1,826,579 | $2,169,910 | $2,517,065 | $2,804,924 | $5,017.75 |
| Replacement Reserves | $0 | $0 | $0 | $0 | $149,934 | $268.22 |
| Net Cash Flow | $2,172,619 | $1,826,579 | $2,169,910 | $2,517,065 | $2,654,990 | $4,749.54 |
| Occupancy | 96.3% | 95.3% | 97.2% | 93.2%(5) | 92.4%(6) | |
| NCF DSCR | 1.06x | 0.89x | 1.06x | 1.23x | 1.29x | |
| NOI Debt Yield | 7.2% | 6.1% | 7.2% | 8.4% | 9.3% | |
| (1) | Based on the underwritten rent roll dated as of November 1, 2023. |
| (2) | Other Income is inclusive of garage and parking fees, month-to-month fees, application fees, laundry income and other miscellaneous income. |
| (3) | Other Expenses include payroll and benefits, repairs and maintenance, utilities, advertising and marketing and general and administrative. |
| (4) | The increase from Most Recent NOI to Underwritten NOI is primarily attributable to the potential income from vacant space. |
| (5) | Based on the current occupancy as of November 1, 2023. |
| (6) | Underwritten Occupancy is based on the economic occupancy. |
| THE INFORMATION IN THIS STRUCTURAL AND COLLATERAL TERM SHEET IS NOT COMPLETE AND MAY BE AMENDED PRIOR TO THE TIME OF SALE. THIS TERM SHEET IS NOT AN OFFER TO SELL THESE SECURITIES AND IT IS NOT A SOLICITATION OF AN OFFER TO BUY THESE SECURITIES IN ANY JURISDICTION WHERE THE OFFER OR SALE IS NOT PERMITTED. | ||
| 118 | ||
|
Industrial - Warehouse/Manufacturing Various Various, Various
|
Collateral Asset Summary – Loan No. 13 MW Industries Portfolio |
Cut-off Date Balance: Cut-off Date LTV: U/W NCF DSCR: U/W NOI Debt Yield: |
$29,616,950 48.7% 2.16x 13.4% |
| Mortgage Loan Information | Property Information | |||
| Loan Seller(s): | GSMC | Single Asset / Portfolio: | Portfolio | |
| Loan Purpose: | Recapitalization | Property Type - Subtype: | Industrial - Warehouse/Manufacturing | |
| Borrower Sponsor(s): | New Mountain Net Lease Partners II Corporation | Collateral: | Fee | |
| Borrower(s): | NM MW, L.P. | Location(2): | Various | |
| Original Balance: | $29,616,950 | Year Built / Renovated(2): | Various / Various | |
| Cut-off Date Balance: | $29,616,950 | Property Management: | Self-Managed | |
| % by Initial UPB: | 3.3% | Size: | 633,957 SF | |
| Interest Rate: | 5.69000% | Appraised Value / Per SF: | $60,870,000 / $96 | |
| Note Date: | January 10, 2024 | Appraisal Date: | Various | |
| Original Term(1): | 61 months | Occupancy: | 100.0% (as of December 6, 2023) | |
| Amortization: | Interest Only | UW Economic Occupancy: | 95.0% | |
| Original Amortization: | NAP | Underwritten NOI: | $3,981,117 | |
| Interest Only Period(1): | 61 months | Underwritten NCF: | $3,695,836 | |
| First Payment Date(1): | February 6, 2024 | |||
| Maturity Date: | February 6, 2029 | Historical NOI(3) | ||
| Additional Debt Type: | NAP | Most Recent NOI: | NAV | |
| Additional Debt Balance: | NAP | 2022 NOI: | NAV | |
| Call Protection: | L(24),DorYM1(32),O(5) | 2021 NOI: | NAV | |
| Lockbox / Cash Management: | Hard / Springing | 2020 NOI: | NAV | |
| Reserves(5) | Financial Information | ||||||
| Initial | Monthly | Cap | Cut-off Date Loan / SF: | $47 | |||
| Taxes: | $0 | Springing | NAP | Maturity Date Loan / SF: | $47 | ||
| Insurance: | $0 | Springing | NAP | Cut-off Date LTV: | 48.7% | ||
| Replacement Reserves: | $0 | Springing | $145,810 | Maturity Date LTV: | 48.7% | ||
| TI / LC: | $0 | Springing | $950,936 | UW NOI DY: | 13.4% | ||
| Other: | $0 | $0 | NAP | UW NCF DSCR: | 2.16x | ||
| Sources and Uses | |||||||
| Sources | Proceeds | % of Total | Uses | Proceeds | % of Total | ||
| Loan Amount | $29,616,950 | 100.0% | Principal Equity Distribution | $27,717,126 | 93.6 | % | |
| Closing Costs(4) | 1,899,824 | 6.4 | |||||
| Total Sources | $29,616,950 | 100.0% | Total Uses | $29,616,950 | 100.0 | % | |
| (1) | The first payment date of the MW Industries Portfolio Mortgage Loan under the MW Industries Portfolio Mortgage Loan documents is March 6, 2024. On the Closing Date, GSMC will contribute an initial interest deposit amount to the issuing entity to cover one month’s interest that would have accrued with respect to the MW Industries Portfolio mortgage loan at the related net mortgage rate, and each of Original Term and Original Interest Only Period reflects the foregoing. |
| (2) | See the “Portfolio Summary” chart below. |
| (3) | Historical financial information is not available due to the acquisition of the MW Industrial Portfolio properties in a sale-leaseback transaction in August 2023. |
| (4) | Closing Costs include an interest rate buydown of $1,480,847.50. |
| THE INFORMATION IN THIS STRUCTURAL AND COLLATERAL TERM SHEET IS NOT COMPLETE AND MAY BE AMENDED PRIOR TO THE TIME OF SALE. THIS TERM SHEET IS NOT AN OFFER TO SELL THESE SECURITIES AND IT IS NOT A SOLICITATION OF AN OFFER TO BUY THESE SECURITIES IN ANY JURISDICTION WHERE THE OFFER OR SALE IS NOT PERMITTED. | ||
| 119 | ||
|
Industrial - Warehouse/Manufacturing Various Various, Various
|
Collateral Asset Summary – Loan No. 13 MW Industries Portfolio |
Cut-off Date Balance: Cut-off Date LTV: U/W NCF DSCR: U/W NOI Debt Yield: |
$29,616,950 48.7% 2.16x 13.4% |
The following table presents certain information relating to the MW Industries Portfolio properties:
| Portfolio Summary(1) | |||||||||
| Property | City, State | Year Built / Renovated | Net Rentable Area (SF)(2) | Occupancy %(2) | Allocated Mortgage Loan Amount | % of Allocated Mortgage Loan Amount | Appraised Value | UW NCF(2) | % of UW NCF(2) |
| 3850 East Miraloma Avenue | Anaheim, California | 1973 / NAP | 35,910 | 100.00% | $6,006,000 | 20.30% | $14,700,000 | 791,168 | 21.40% |
| 260 Industrial Drive | Pontotoc, Mississippi | 1989 / 2014 | 191,311 | 100.00% | $5,633,558 | 19.00% | $10,500,000 | 671,174 | 18.20% |
| 770 Sunpark Drive | Fenton, Missouri | 1997 / NAP | 132,848 | 100.00% | $5,358,203 | 18.10% | $10,260,000 | 660,469 | 17.90% |
| 2375 Highway 101 | Greer, South Carolina | 1997 / NAP | 128,888 | 100.00% | $4,253,304 | 14.40% | $8,600,000 | 513,730 | 13.90% |
| 7-10 Audrey Place | Fairfield, New Jersey | 1972 / 2023 | 32,000 | 100.00% | $3,285,333 | 11.10% | $7,500,000 | 427,215 | 11.60% |
| N915 Craftsman Drive | Greenville, Wisconsin | 1994, 1997, 2010, 2017 / NAP | 78,000 | 100.00% | $3,091,386 | 10.40% | $5,650,000 | 380,445 | 10.30% |
| 7400 Pinemont Drive | Houston, Texas | 1977 / 1994 | 35,000 | 100.00% | $1,989,166 | 6.70% | $3,660,000 | 251,634 | 6.80% |
| Total / Wtd. Avg. | 633,957 | 100.0% | $29,616,950 | 100.0% | $60,870,000 | $3,695,836 | 100.0% | ||
| (1) | Source: Appraisals, unless otherwise indicated. |
| (2) | Based on the underwritten rent rolls dated December 6, 2023, with rent steps through January 31, 2025. |
The following table presents certain information relating to the sole tenant at the MW Industries Portfolio properties:
| Tenant Summary(1) | |||||||||
|
Tenant |
Credit Rating (Moody’s/ S&P/Fitch) |
Net Rentable Area (SF) | % of Net Rentable Area | U/W Base Rent |
U/W Base Rent Per SF |
% of Total U/W Base Rent | Lease Expiration | Termination Option (Y/N) | Renewal Options |
| MW Industries | NR/NR/NR | 633,957 | 100.0% | $4,119,449 | $6.50 | 100.0% | 8/31/2043 | N | 2 x 10 Yr(2) |
| Total Occupied | 633,957 | 100.0% | $4,119,449 | $6.50 | 100.0% | ||||
| Vacant | 0 | 0.0 | |||||||
| Total | 633,957 | 100.0% | |||||||
| (1) | Based on the underwritten rent rolls dated December 6, 2023 with rent steps through January 31, 2025. |
| (2) | The tenant at the 3850 East Miraloma Avenue property will only be entitled to exercise
one extension option for a period of 10 years and a second extension option for a period of four years and 11 months, such that the maximum
term of the applicable lease will be 34 years and 11 months. |
| THE INFORMATION IN THIS STRUCTURAL AND COLLATERAL TERM SHEET IS NOT COMPLETE AND MAY BE AMENDED PRIOR TO THE TIME OF SALE. THIS TERM SHEET IS NOT AN OFFER TO SELL THESE SECURITIES AND IT IS NOT A SOLICITATION OF AN OFFER TO BUY THESE SECURITIES IN ANY JURISDICTION WHERE THE OFFER OR SALE IS NOT PERMITTED. | ||
| 120 | ||
|
Industrial - Warehouse/Manufacturing Various Various, Various
|
Collateral Asset Summary – Loan No. 13 MW Industries Portfolio |
Cut-off Date Balance: Cut-off Date LTV: U/W NCF DSCR: U/W NOI Debt Yield: |
$29,616,950 48.7% 2.16x 13.4% |
The following table presents certain information relating to the lease rollover schedule at the MW Industries Portfolio properties, based on the initial lease expiration dates:
| Lease Rollover Schedule(1) | ||||||||||
| Year Ending December 31 | Expiring Owned GLA | % of Owned GLA(3) | Cumulative % of Owned GLA | UW Base Rent | % of Total UW Base Rent | UW Base Rent $ per SF | # of Expiring Leases | |||
| MTM | 0 | 0.0 | % | 0.0% | $0 | 0.0 | % | $0.00 | 0 | |
| 2024 | 0 | 0.0 | 0.0% | 0 | 0.0 | $0.00 | 0 | |||
| 2025 | 0 | 0.0 | 0.0% | 0 | 0.0 | $0.00 | 0 | |||
| 2026 | 0 | 0.0 | 0.0% | 0 | 0.0 | $0.00 | 0 | |||
| 2027 | 0 | 0.0 | 0.0% | 0 | 0.0 | $0.00 | 0 | |||
| 2028 | 0 | 0.0 | 0.0% | 0 | 0.0 | $0.00 | 0 | |||
| 2029 | 0 | 0.0 | 0.0% | 0 | 0.0 | $0.00 | 0 | |||
| 2030 | 0 | 0.0 | 0.0% | 0 | 0.0 | $0.00 | 0 | |||
| 2031 | 0 | 0.0 | 0.0% | 0 | 0.0 | $0.00 | 0 | |||
| 2032 | 0 | 0.0 | 0.0% | 0 | 0.0 | $0.00 | 0 | |||
| 2033 | 0 | 0.0 | 0.0% | 0 | 0.0 | $0.00 | 0 | |||
| 2034 | 0 | 0.0 | 0.0% | 0 | 0.0 | $0.00 | 0 | |||
| 2035 & Thereafter | 633,957 | 100.0 | 100.0% | 4,119,449 | 100.0 | $6.50 | 1 | |||
| Vacant | 0 | 0.0 | 100.0% | NAP | NAP | NAP | NAP | |||
| Total / Wtd. Avg. | 633,957 | 100.0 | % | $4,119,449 | 100.0 | % | $6.50 | 1 | ||
| (1) | Based on the underwritten rent rolls dated December 6, 2023 with rent steps through January 31, 2025. |
The following table presents certain information relating to the Underwritten Net Cash Flow at the MW Industries Portfolio properties:
| Cash Flow Analysis(1) | ||
| U/W | U/W Per SF | |
| Base Rent(2) | $4,119,449 | $6.50 |
| Contractual Rent Steps | 123,583 | 0.19 |
| Gross Potential Rent | $4,243,032 | $6.69 |
| Recoveries | 995,279 | 1.57 |
| Net Rental Income | $5,238,312 | $8.26 |
| Vacancy | (261,916) | (0.41) |
| Effective Gross Income | $4,976,396 | $7.85 |
| Management Fee | 149,292 | 0.24 |
| Other Expenses(3) | 845,987 | 1.33 |
| Total Expenses | 995,279 | 1.57 |
| Net Operating Income | $3,981,117 | $6.28 |
| TI / LC | 190,187 | 0.30 |
| Replacement Reserves | 95,094 | 0.15 |
| Net Cash Flow | $3,695,836 | $5.83 |
| Occupancy | 95.0% | |
| NCF DSCR | 2.16x | |
| NOI Debt Yield | 13.4% | |
| (1) | Historical financial information is not available due to the acquisition of the MW Industrial Portfolio properties in a sale-leaseback transaction in August 2023. |
| (2) | Underwritten Base Rent is based on the contractual base rent as of August 24, 2023. |
| (3) | Other Expenses is based on a 20% expense load, including the management fee. |
| THE INFORMATION IN THIS STRUCTURAL AND COLLATERAL TERM SHEET IS NOT COMPLETE AND MAY BE AMENDED PRIOR TO THE TIME OF SALE. THIS TERM SHEET IS NOT AN OFFER TO SELL THESE SECURITIES AND IT IS NOT A SOLICITATION OF AN OFFER TO BUY THESE SECURITIES IN ANY JURISDICTION WHERE THE OFFER OR SALE IS NOT PERMITTED. | ||
| 121 | ||
Multifamily - Mid Rise 311 Pine Street Jersey City, NJ 07304
|
Collateral Asset Summary – Loan No. 14 311 Pine Street |
Cut-off Date Balance: Cut-off Date LTV: U/W NCF DSCR: U/W NOI Debt Yield: |
$25,000,000 63.9% 1.20x 8.1% |
| Mortgage Loan Information | |
| Loan Seller(s): | BMO |
| Loan Purpose: | Refinance |
| Borrower Sponsor(s): | Mark Rigerman and Shimon Jacobowitz |
| Borrower(s): | 309 Pine Plaza LLC, 408 Whiton Plaza LLC and Pine Whiton Holdings LLC |
| Original Balance: | $25,000,000 |
| Cut-off Date Balance: | $25,000,000 |
| % by Initial UPB: | 2.8% |
| Interest Rate: | 6.63000% |
| Note Date: | November 21, 2023 |
| Original Term: | 60 months |
| Amortization: | Interest Only |
| Original Amortization: | NAP |
| Interest Only Period: | 60 months |
| First Payment Date: | January 6, 2024 |
| Maturity Date: | December 6, 2028 |
| Additional Debt Type: | NAP |
| Additional Debt Balance: | NAP |
| Call Protection: | L(25),D(31),O(4) |
| Lockbox / Cash Management: | Springing / Springing |
| Property Information | |
| Single Asset / Portfolio: | Single Asset |
| Property Type / Subtype: | Multifamily – Mid Rise |
| Collateral: | Fee |
| Location: | Jersey City, NJ |
| Year Built / Renovated: | 2023 / NAP |
| Property Management: | Self-Managed |
| Size: | 56 Units |
| Appraised Value / Per Unit: | $39,100,000 / $698,214 |
| Appraisal Date: | July 11, 2023 |
| Occupancy: | 85.7% (as of November 17, 2023) |
| UW Economic Occupancy(2): | 95.5% |
| Underwritten NOI(2): | $2,029,805 |
| Underwritten NCF(2): | $2,024,205 |
| Historical NOI(3) | |
| Most Recent NOI: | NAV |
| 2022 NOI: | NAV |
| 2021 NOI: | NAV |
| 2020 NOI: | NAV |
| Financial Information | |
| Cut-off Date Loan Per Unit: | $446,429 |
| Maturity Date Loan Per Unit: | $446,429 |
| Cut-off Date LTV: | 63.9% |
| Maturity Date LTV: | 63.9% |
| UW NOI DY(2): | 8.1% |
| UW NCF DSCR(2): | 1.20x |
| Reserves | |||
| Initial | Monthly | Cap | |
| Taxes: | $0 | $25,270 | NAP |
| Insurance: | $30,659 | $5,110 | NAP |
| Replacement Reserve: | $33,600 | Springing | $33,600 |
| TI/LC: | $0 | $0 | NAP |
| Other(1)(2): | $450,000 | $0 | NAP |
| Sources and Uses | ||||||
| Sources | Proceeds | % of Total | Uses | Proceeds | % of Total | |
| Mortgage Loan | $25,000,000 | 100.0% | Loan Payoff | $15,143,925 | 60.6% | |
| Return of Equity | 7,478,993 | 29.9% | ||||
| Closing Costs(4) | 1,862,823 | 7.5% | ||||
| Upfront Reserves | 514,259 | 2.1% | ||||
| Total Sources | $25,000,000 | 100.0% | Total Uses | $25,000,000 | 100.0% | |
| (1) | Other Reserves consists of a $450,000 rent reserve. On the payment date occurring in December of each year, the borrower is required to deposit $450,000 into the rent reserve until the associated release conditions (as described in the loan agreement) are satisfied. |
| (2) | The UW Economic Occupancy, Underwritten NOI and Underwritten NCF were calculated based on an “as-stabilized” basis of an appraisal concluded 4.5% vacancy. The in-place economic vacancy rate as of November 17, 2023 is 14.9%. The lender required the borrower sponsor to reserve $450,000 at closing for the rent reserve associated with the vacant units. The UW NCF DSCR calculated based on the in-place economic vacancy rate without taking into account the reserve is 1.05x. The UW NOI DY calculated based on the actual vacancy rate without taking into account the reserve is 7.1%. |
| (3) | Historical financial information is not available as the construction of the 311 Pine Street property was completed in January 2023. |
| (4) | Closing Costs include a rate buydown fee of $1,087,500. |
The following table presents certain information relating to the unit mix at the 311 Pine Street property:
| Unit Mix(1) | ||||||
| Unit Type | # of Units | % of Total Units | Occupancy | Average Unit Size (SF) | Average Monthly Rent Per Unit | Average Monthly Market Rent Per Unit(2) |
| 1BR/1BA | 1 | 1.8% | 100.0% | 894 | $2,900 | $2,900 |
| 2BR/2BA | 47 | 83.9% | 87.2% | 1,035 | $3,687 | $3,800 |
| 2BR/2BA – Penthouse | 8 | 14.3% | 75.0% | 1,412 | $4,650 | $4,500 |
| Total | 56 | 100.0% | 85.7% | 1,086 | $3,791 | $3,884 |
| (1) | Based on the underwritten rent roll dated November 17, 2023. |
| (2) | Source: Appraisal. |
| THE INFORMATION IN THIS STRUCTURAL AND COLLATERAL TERM SHEET IS NOT COMPLETE AND MAY BE AMENDED PRIOR TO THE TIME OF SALE. THIS TERM SHEET IS NOT AN OFFER TO SELL THESE SECURITIES AND IT IS NOT A SOLICITATION OF AN OFFER TO BUY THESE SECURITIES IN ANY JURISDICTION WHERE THE OFFER OR SALE IS NOT PERMITTED. | ||
| 122 | ||
Multifamily - Mid Rise 311 Pine Street Jersey City, NJ 07304
|
Collateral Asset Summary – Loan No. 14 311 Pine Street |
Cut-off Date Balance: Cut-off Date LTV: U/W NCF DSCR: U/W NOI Debt Yield: |
$25,000,000 63.9% 1.20x 8.1% |
The following table presents certain information relating to historical occupancy for the 311 Pine Street property:
| Historical Occupancy(1) | ||
| 2021 | 2022 | As of 11/17/2023(2) |
| NAV | NAV | 85.7% |
| (1) | Historical financial information is not available as construction of the 311 Pine Street property was completed in January 2023. |
| (2) | Based on the underwritten rent roll dated November 17, 2023. |
The following table presents sales comparison information relating to the 311 Pine Street property:
| Sales Comparables(1) | ||||||||
| Property Name | City, State | Year Built | # of Units | # of Beds | Avg. Unit Size | Transaction Date | Price | Price Per Unit |
| 215 East Second Street | Bound Brook, NJ | 2020 | 34 | NAP | NAV | 3/6/2023 | $10,837,500 | $318,750 |
| 1255 Magie Avenue | Union, NJ | 2021 | 153 | NAP | NAV | 10/4/2022 | $63,100,000 | $412,418 |
| 65 Maple Street | Jersey City, NJ | 2019 | 72 | NAP | NAV | 7/13/2022 | $31,900,000 | $443,056 |
| 15 West Johnson Avenue | Bergenfield, NJ | 2020 | 62 | NAP | NAV | 4/21/2022 | $22,500,000 | $362,903 |
| Average | 80 | NAP | NAV | $32,084,375 | $384,282 | |||
| 311 Pine Street | Jersey City, NJ | 2023 | 56(2) | NAP | 1,086(2) | $25,000,000 | $446,429 | |
| (1) | Source: Appraisal. |
| (2) | Based on the underwritten rent roll dated November 17, 2023. |
The following table presents certain information relating to the Underwritten Net Cash Flow at the 311 Pine Street property:
| Underwritten Cash Flow Analysis(1) | ||
| U/W | U/W Per Unit(5) | |
| Gross Potential Rent(2)(4) | $2,565,420 | $45,811 |
| Vacancy(3)(4) | (115,444) | (2,061) |
| Other Income(3) | 79,920 | 1,427 |
| Effective Gross Income | $2,529,896 | $45,177 |
| Total Expenses(3)(4) | 500,091 | 8,930 |
| Net Operating Income(4) | $2,029,805 | $36,247 |
| Replacement Reserves | 5,600 | 100 |
| Net Cash Flow(4) | $2,024,205 | $36,147 |
| Occupancy(4) | 95.5% | |
| NCF DSCR(4) | 1.20x | |
| NOI Debt Yield(4) | 8.1% | |
| (1) | Historical financial information is not available as construction of the 311 Pine Street property was completed in January 2023. |
| (2) | Based on the underwritten rent roll dated as of November 17, 2023. |
| (3) | Vacancy and Other Income are underwritten based on the appraisal. Total Expenses are underwritten based on the appraisal and actual real estate tax bills and actual annual insurance premiums. |
| (4) | Represents underwritten economic occupancy, based on an “as-stabilized” basis of an appraisal concluded 4.5% vacancy. The in-place economic vacancy rate as of November 17, 2023 is 14.9%. The lender required the borrower sponsor to reserve $450,000 at closing for the rent reserve associated with the vacant units. The NCF DSCR and NOI Debt Yield calculated based on the in-place economic vacancy rate without taking into account the reserve are 1.05x and 7.1%, respectively. |
| (5) | U/W Per Unit is based on 56 units. |
| THE INFORMATION IN THIS STRUCTURAL AND COLLATERAL TERM SHEET IS NOT COMPLETE AND MAY BE AMENDED PRIOR TO THE TIME OF SALE. THIS TERM SHEET IS NOT AN OFFER TO SELL THESE SECURITIES AND IT IS NOT A SOLICITATION OF AN OFFER TO BUY THESE SECURITIES IN ANY JURISDICTION WHERE THE OFFER OR SALE IS NOT PERMITTED. | ||
| 123 | ||
|
1441, 1445, 1447, 1449, 1451, 1453, 1455, 1457, 1459, 1461, 1463, 1465 and 1469 University Drive Burlington, NC 27215
|
Collateral Asset Summary – Loan No. 15 University Commons |
Cut-off Date Balance: Cut-off Date LTV: U/W NCF DSCR: U/W NOI Debt Yield: |
$21,750,000 52.5% 1.45x 12.7% |
| Mortgage Loan Information | Property Information | |||
| Loan Seller(s): | GSMC | Single Asset / Portfolio: | Single Asset | |
| Loan Purpose: | Recapitalization | Property Type - Subtype: | Retail – Anchored | |
| Borrower Sponsor(s): | Columbus Realty Investments, Ltd. | Collateral: | Fee | |
| Borrower(s): | PGS Burlington LLC and Tower Burlington LLC | Location: | Burlington, NC | |
| Original Balance: | $21,750,000 | Year Built / Renovated: | 2005 / NAP | |
| Cut-off Date Balance: | $21,750,000 | Property Management: | Summit Realty Group Ltd. | |
| % by Initial UPB: | 2.5% | Size: | 227,736 SF | |
| Interest Rate: | 7.95000% | Appraised Value / Per SF: | $41,400,000 / $182 | |
| Note Date: | December 15, 2023 | Appraisal Date: | December 12, 2023 | |
| Original Term: | 60 months | Occupancy: | 94.9% (as of December 7, 2023) | |
| Amortization: | Interest Only | UW Economic Occupancy: | 84.3% | |
| Original Amortization: | NAP | Underwritten NOI: | $2,763,187 | |
| Interest Only Period: | 60 months | Underwritten NCF: | $2,535,143 | |
| First Payment Date: | February 6, 2024 | |||
| Maturity Date: | January 6, 2029 | Historical NOI | ||
| Additional Debt Type: | NAP | Most Recent NOI: | $3,042,332 (TTM September 30, 2023) | |
| Additional Debt Balance: | NAP | 2022 NOI: | $3,096,644 | |
| Call Protection: | L(24),D(29),O(7) | 2021 NOI: | $3,072,404 | |
| Lockbox / Cash Management: | Springing / Springing | 2020 NOI: | NAV | |
| Reserves | Financial Information | ||||||
| Initial | Monthly | Cap | Cut-off Date Loan Per SF: | $96 | |||
| Taxes: | $0 | Springing | NAP | Maturity Date Loan Per SF: | $96 | ||
| Insurance: | $0 | Springing | NAP | Cut-off Date LTV | 52.5% | ||
| Replacement Reserves: | $0 | $2,847 | $102,481 | Maturity Date LTV: | 52.5% | ||
| TI/LC: | $500,000 | Springing | $500,000 | UW NOI DY: | 12.7% | ||
| Other(1): | $3,447,416 | Springing | NAP | UW NCF DSCR: | 1.45x | ||
| Sources and Uses | |||||||
| Sources | Proceeds | % of Total | Uses | Proceeds | % of Total | ||
| Mortgage Loan | $21,750,000 | 100.0% | Principal Equity Distribution | $17,328,151 | 79.7 | % | |
| Upfront Reserves | 3,947,416 | 18.1 | |||||
| Closing Costs | 474,434 | 2.2 | |||||
| Total Sources | $21,750,000 | 100.0% | Total Uses | $21,750,000 | 100.0 | % | |
| (1) | Other Reserves consist of an earnout reserve ($3,114,631), an unfunded obligations reserve ($332,785) and a springing critical tenant reserve. The earnout reserve funds may be disbursed to the borrowers in the event that (i) HomeGoods has taken occupancy of its space, opened for business, is paying full rent, and has provided a clean estoppel or (ii) in the event that the HomeGoods lease is terminated, the debt yield is greater than or equal to 13.4% and the DSCR is greater than or equal to 1.35x. If the borrowers are not entitled to the disbursement of the earnout funds as of December 15, 2025 the (“Stabilization Date”), the lender may, in its sole discretion, apply all funds remaining in the earnout reserve as of the Stabilization Date to prepay a portion of the outstanding principal balance of the University Commons mortgage loan subject to the applicable yield maintenance premium. The University Commons mortgage loan Cut-off Date LTV, Maturity Date LTV and UW NOI DY net of the earnout reserve are 45.0%, 45.0% and 14.8%, respectively. |
| THE INFORMATION IN THIS STRUCTURAL AND COLLATERAL TERM SHEET IS NOT COMPLETE AND MAY BE AMENDED PRIOR TO THE TIME OF SALE. THIS TERM SHEET IS NOT AN OFFER TO SELL THESE SECURITIES AND IT IS NOT A SOLICITATION OF AN OFFER TO BUY THESE SECURITIES IN ANY JURISDICTION WHERE THE OFFER OR SALE IS NOT PERMITTED. | ||
| 124 | ||
|
1441, 1445, 1447, 1449, 1451, 1453, 1455, 1457, 1459, 1461, 1463, 1465 and 1469 University Drive Burlington, NC 27215
|
Collateral Asset Summary – Loan No. 15 University Commons |
Cut-off Date Balance: Cut-off Date LTV: U/W NCF DSCR: U/W NOI Debt Yield: |
$21,750,000 52.5% 1.45x 12.7% |
The following table presents certain information relating to the major tenants at the University Commons property:
| Tenant Summary(1) | ||||||||||
|
Tenant |
Credit Rating (Moody’s/ S&P/Fitch)(2) |
Net Rentable Area (SF) | % of Net Rentable Area | U/W Base Rent |
U/W Base Rent Per SF |
% of Total U/W Base Rent | Lease Expiration | Termination Option (Y/N) | Renewal Options | |
| Best Buy | A3/BBB+/NR | 30,046 | 13.2 | % | $427,500 | $14.23 | 12.5% | 3/31/2026 | N | 1 x 5 Yr |
| Ross Dress for Less | A2/BBB+/NR | 30,056 | 13.2 | 323,102 | $10.75 | 9.5 | 1/31/2026 | N | 3 x 5 Yr | |
| PetSmart | B3/B+/NR | 20,100 | 8.8 | 311,550 | $15.50 | 9.1 | 10/31/2025 | N | 3 x 5 Yr | |
| HomeGoods(3) | A2/A/NR | 22,684 | 10.0 | 306,234 | $13.50 | 9.0 | 5/31/2034 | Y(4) | 4 x 5 Yr | |
| Michael's | Caa2/CCC+/NR | 23,800 | 10.5 | 249,900 | $10.50 | 7.3 | 2/28/2025 | N | 2 x 5 Yr | |
| TJ Maxx | A2/A/NR | 24,125 | 10.6 | 223,156 | $9.25 | 6.5 | 11/30/2026 | N | 4 x 5 Yr | |
| Rack Room Shoes | NR/NR/NR | 6,000 | 2.6 | 129,000 | $21.50 | 3.8 | 1/31/2026 | Y | 1 x 5 Yr | |
| Men's Wearhouse | NR/NR/NR | 6,026 | 2.6 | 126,546 | $21.00 | 3.7 | 3/31/2034 | Y | 2 x 5 Yr | |
| Mattress Warehouse | NR/NR/NR | 4,000 | 1.8 | 124,760 | $31.19 | 3.7 | 11/30/2026 | N | None | |
| Chili's | B1/BB-/NR | 1 | 0.0 | 119,790 | $119,790.00 | 3.5 | 8/31/2025 | N | 2 x 5 Yr | |
| Largest Tenants | 166,838 | 73.3 | % | $2,341,538 | $14.03 | 68.6% | ||||
| Remaining Occupied | 49,222 | 21.6 | 1,069,773 | $21.73 | 31.4 | |||||
| Total Occupied | 216,060 | 94.9 | % | $3,411,311 | $15.79 | 100.0% | ||||
| Vacant | 11,676 | 5.1 | ||||||||
| Total | 227,736 | 100.0 | % | |||||||
| (1) | Based on the underwritten rent roll dated December 7, 2023, with contractual rent steps through January 31, 2025. |
| (2) | Certain ratings are those of the parent company whether or not the parent guarantees the lease. |
| (3) | HomeGoods has not yet taken occupancy. |
| (4) | Provided HomeGoods has applied for permits on or before March 15, 2024, if by May 15, 2024, it has not obtained such permits to build the HomeGoods store building in accordance with its plans and specifications, despite its diligent efforts, HomeGoods may, prior to receipt of such permits, terminate its lease by giving the landlord notice on or before June 15, 2024. The University Commons mortgage loan was structured with an earnout reserve, as described in footnote (1) to the Reserves table above, in connection with the HomeGoods’ termination option. |
The following table presents certain information relating to the lease rollover schedule at the University Commons property:
| Lease Rollover Schedule(1)(2) | ||||||||||||
| Year Ending December 31 | Expiring Owned GLA | % of Owned GLA | Cumulative % of Owned GLA | UW Base Rent | % of Total UW Base Rent | UW Base Rent $ per SF | # of Expiring Leases | |||||
| MTM | 0 | 0.0 | % | 0.0% | $0 | 0.0 | % | $0.00 | 0 | |||
| 2024 | 4,100 | 1.8 | 1.8% | 114,752 | 3.4 | 27.99 | 2 | |||||
| 2025 | 47,808 | 21.0 | 22.8% | 780,849 | 22.9 | 16.33 | 5 | |||||
| 2026 | 101,436 | 44.5 | 67.3% | 1,428,550 | 41.9 | 14.08 | 9 | |||||
| 2027 | 26,262 | 11.5 | 78.9% | 459,456 | 13.5 | 17.50 | 8 | |||||
| 2028 | 4,000 | 1.8 | 80.6% | 96,000 | 2.8 | 24.00 | 1 | |||||
| 2029 | 0 | 0.0 | 80.6% | 0 | 0.0 | 0.00 | 0 | |||||
| 2030 | 1,450 | 0.6 | 81.3% | 50,750 | 1.5 | 35.00 | 1 | |||||
| 2031 | 0 | 0.0 | 81.3% | 0 | 0.0 | 0.00 | 0 | |||||
| 2032 | 2,294 | 1.0 | 82.3% | 48,174 | 1.4 | 21.00 | 1 | |||||
| 2033 | 0 | 0.0 | 82.3% | 0 | 0.0 | 0.00 | 0 | |||||
| 2034 & Thereafter | 28,710 | 12.6 | 94.9% | 432,780 | 12.7 | 15.07 | 2 | |||||
| Vacant | 11,676 | 5.1 | 100.0% | NAP | NAP | NAP | NAP | |||||
| Total / Wtd. Avg. | 227,736 | 100.0 | % | $3,411,311 | 100.0 | % | $15.79 | 29 | ||||
| (1) | Based on the underwritten rent roll dated December 7, 2023, with contractual rent steps through January 31, 2025. |
| (2) | Certain tenants may have termination options that are exercisable prior to the originally stated expiration date of the subject lease and that are not considered in the Lease Rollover Schedule. |
| THE INFORMATION IN THIS STRUCTURAL AND COLLATERAL TERM SHEET IS NOT COMPLETE AND MAY BE AMENDED PRIOR TO THE TIME OF SALE. THIS TERM SHEET IS NOT AN OFFER TO SELL THESE SECURITIES AND IT IS NOT A SOLICITATION OF AN OFFER TO BUY THESE SECURITIES IN ANY JURISDICTION WHERE THE OFFER OR SALE IS NOT PERMITTED. | ||
| 125 | ||
|
1441, 1445, 1447, 1449, 1451, 1453, 1455, 1457, 1459, 1461, 1463, 1465 and 1469 University Drive Burlington, NC 27215
|
Collateral Asset Summary – Loan No. 15 University Commons |
Cut-off Date Balance: Cut-off Date LTV: U/W NCF DSCR: U/W NOI Debt Yield: |
$21,750,000 52.5% 1.45x 12.7% |
The following table presents certain information relating to the historical operating performance and Underwritten Net Cash Flow at the University Commons property:
| Cash Flow Analysis(1) | |||||
| 2021 | 2022 | Sept 2023 TTM | U/W | U/W Per SF | |
| Base Rent(1) | $3,301,120 | $3,296,174 | $3,189,460 | $3,105,077 | $13.63 |
| Rent Steps | 0 | 0 | 0 | 0 | $0.00 |
| Gross Potential Rent | $3,301,120 | $3,296,174 | $3,189,460 | $3,105,077 | $13.63 |
| Total Reimbursements | 666,083 | 743,566 | 808,430 | 687,268 | $3.02 |
| Vacant Income(2) | 14,862 | 26,585 | (12,462) | 707,977 | $3.11 |
| Net Rental Income | $3,982,065 | $4,066,325 | $3,985,428 | $4,500,323 | $19.76 |
| (Vacancy / Credit Loss) | 0 | 0 | 0 | (707,977) | $ (3.11) |
| Effective Gross Income | $3,982,065 | $4,066,325 | $3,985,428 | $3,792,345 | $16.65 |
| Real Estate Taxes | 366,380 | 363,466 | 273,284 | 280,980 | $1.23 |
| Insurance | 49,171 | 45,726 | 45,298 | 45,155 | $0.20 |
| Management Fee | 139,917 | 141,713 | 143,017 | 132,732 | $0.58 |
| Other Expenses | 354,193 | 418,776 | 481,497 | 570,291 | $2.50 |
| Total Expenses | $909,661 | $969,681 | $943,096 | $1,029,158 | $4.52 |
| Net Operating Income | $3,072,404 | $3,096,644 | $3,042,332 | $2,763,187 | $12.13 |
| Capital Expenditures | 0 | 0 | 0 | 34160 | $0.15 |
| TI/LC | 0 | 0 | 0 | 193884 | $0.85 |
| Net Cash Flow | $3,072,404 | $3,096,644 | $3,042,332 | $2,535,143 | $11.13 |
| Occupancy (%) | 90.0%(3) | 92.0%(3) | 94.9%(4) | 84.3% | |
| NCF DSCR | 1.75x | 1.77x | 1.74x | 1.45x | |
| NOI Debt Yield | 14.1% | 14.2% | 14.0% | 12.7% | |
| (1) | Based on the underwritten rent roll dated December 7, 2023, with contractual rent steps through January 31, 2025. |
| (2) | Vacant Income includes market revenue from vacant units. |
| (3) | Source: Third party provider. |
| (4) | As of December 7, 2023. |
| THE INFORMATION IN THIS STRUCTURAL AND COLLATERAL TERM SHEET IS NOT COMPLETE AND MAY BE AMENDED PRIOR TO THE TIME OF SALE. THIS TERM SHEET IS NOT AN OFFER TO SELL THESE SECURITIES AND IT IS NOT A SOLICITATION OF AN OFFER TO BUY THESE SECURITIES IN ANY JURISDICTION WHERE THE OFFER OR SALE IS NOT PERMITTED. | ||
| 126 | ||
STATEMENT REGARDING ASSUMPTIONS AS TO SECURITIES, PRICING ESTIMATES AND OTHER INFORMATION
This material is for your information, and none of Deutsche Bank Securities Inc., Citigroup Global Markets Inc., Barclays Capital, Inc., Goldman Sachs & Co. LLC, BMO Capital Markets Corp., Academy Securities, Inc. and Drexel Hamilton, LLC or any other underwriter, (the “Underwriters”) are soliciting any action based upon it. This material is not to be construed as an offer to sell or the solicitation of any offer to buy any security in any jurisdiction where such an offer or solicitation would be illegal.
Neither this document nor anything contained herein shall form the basis for any contract or commitment whatsoever. The information contained herein is preliminary as of the date hereof. These materials are subject to change, completion or amendment from time to time. The information contained herein will be superseded by similar information delivered to you as part of the preliminary prospectus relating to the Benchmark 2024-V5 Mortgage Trust Commercial Mortgage Pass-Through Certificates, Series 2024-V5 (the "Offering Document"). The information contained herein supersedes any such information previously delivered and should be reviewed only in conjunction with the entire Offering Document. All of the information contained herein is subject to the same limitations and qualifications contained in the Offering Document. The information contained herein does not contain all relevant information relating to the underlying mortgage loans or mortgaged properties. Such information is described elsewhere in the Offering Document. The information contained herein will be more fully described elsewhere in the Offering Document. The information contained herein should not be viewed as projections, forecasts, predictions or opinions with respect to value. Prior to making any investment decision, prospective investors are strongly urged to read the Offering Document its entirety. Neither the Securities and Exchange Commission nor any state securities commission has approved or disapproved of these securities or determined if this free writing prospectus is truthful or complete. Any representation to the contrary is a criminal offense.
The attached information contains certain tables and other statistical analyses (the “Computational Materials”) which have been prepared in reliance upon information furnished by the Mortgage Loan Sellers. Numerous assumptions were used in preparing the Computational Materials, which may or may not be reflected herein. As such, no assurance can be given as to the Computational Materials’ accuracy, appropriateness or completeness in any particular context; or as to whether the Computational Materials and/or the assumptions upon which they are based reflect present market conditions or future market performance. The Computational Materials should not be construed as either projections or predictions or as legal, tax, financial or accounting advice. You should consult your own counsel, accountant and other advisors as to the legal, tax, business, financial and related aspects of a purchase of these securities. Any weighted average lives, yields and principal payment periods shown in the Computational Materials are based on prepayment and/or loss assumptions, and changes in such prepayment and/or loss assumptions may dramatically affect such weighted average lives, yields and principal payment periods. In addition, it is possible that prepayments or losses on the underlying assets will occur at rates higher or lower than the rates shown in the attached Computational Materials. The specific characteristics of the securities may differ from those shown in the Computational Materials due to differences between the final underlying assets and the preliminary underlying assets used in preparing the Computational Materials. The principal amount and designation of any security described in the Computational Materials are subject to change prior to issuance. None of Underwriters or any of their respective affiliates makes any representation or warranty as to the actual rate or timing of payments or losses on any of the underlying assets or the payments or yield on the securities.
This document contains forward-looking statements. Those statements are subject to certain risks and uncertainties that could cause the success of collections and the actual cash flow generated to differ materially from the information set forth herein. While such information reflects projections prepared in good faith based upon methods and data that are believed to be reasonable and accurate as of the dates thereof, the depositor undertakes no obligation to revise these forward-looking statements to reflect subsequent events or circumstances. Individuals should not place undue reliance on forward-looking statements and are advised to make their own independent analysis and determination with respect to the forecasted periods, which reflect the issuer’s view only as of the date hereof.
IMPORTANT NOTICE RELATING TO AUTOMATICALLY GENERATED EMAIL DISCLAIMERS
Any legends, disclaimers or other notices that may appear at the bottom of the email communication to which this free writing prospectus is attached relating to (1) these materials not constituting an offer (or a solicitation of an offer), (2) no representation being made that these materials are accurate or complete and may not be updated or (3) these materials possibly being confidential, are not applicable to these materials and should be disregarded. Such legends, disclaimers or other notices have been automatically generated as a result of these materials having been sent via Bloomberg or another system.
| THE INFORMATION IN THIS STRUCTURAL AND COLLATERAL TERM SHEET IS NOT COMPLETE AND MAY BE AMENDED PRIOR TO THE TIME OF SALE. THIS TERM SHEET IS NOT AN OFFER TO SELL THESE SECURITIES AND IT IS NOT A SOLICITATION OF AN OFFER TO BUY THESE SECURITIES IN ANY JURISDICTION WHERE THE OFFER OR SALE IS NOT PERMITTED. | ||
| 127 | ||