| FREE WRITING PROSPECTUS | ||
| FILED PURSUANT TO RULE 433 | ||
| REGISTRATION FILE NO.: 333-206705-13 | ||
May 1, 2018
FREE WRITING PROSPECTUS
STRUCTURAL AND COLLATERAL TERM SHEET
$1,006,082,811
(Approximate Total Mortgage Pool Balance)
$861,458,000
(Approximate Offered Certificates)
|
COMM 2018-COR3 |
Deutsche Mortgage & Asset Receiving Corporation
Depositor
German American Capital Corporation
LoanCore Capital Markets LLC
Citi Real Estate Funding Inc.
JPMorgan Chase Bank, National Association
Sponsors and Mortgage Loan Sellers
 |
 |
 |
|
Co-Lead Managers and Joint Bookrunners | ||
| Jefferies | Academy Securities | |
|
Co-Manager | ||
The depositor has filed a registration statement (including the prospectus) with the Securities and Exchange Commission (File No. 333-206705) for the offering to which this communication relates. Before you invest, you should read the prospectus in the registration statement and other documents the depositor has filed with the Securities and Exchange Commission for more complete information about the depositor, the issuing entity and this offering. You may get these documents for free by visiting EDGAR on the Securities and Exchange Commission website at www.sec.gov. Alternatively, the depositor or Deutsche Bank Securities Inc., any other underwriter, or any dealer participating in this offering will arrange to send you the prospectus if you request it by calling toll-free 1-800-503-4611 or by emailing: prospectus.cpdg@db.com. The offered certificates referred to in these materials, and the asset pool backing them, are subject to modification or revision (including the possibility that one or more classes of certificates may be split, combined or eliminated at any time prior to issuance or availability of a final prospectus) and are offered on a “when, as and if issued” basis. You understand that, when you are considering the purchase of these certificates, a contract of sale will come into being no sooner than the date on which the relevant class has been priced and we have verified the allocation of certificates to be made to you; any “indications of interest” expressed by you, and any “soft circles” generated by us, will not create binding contractual obligations for you or us. This free writing prospectus does not contain all information that is required to be included in the prospectus.
|
COMM 2018-COR3 Mortgage Trust
Capitalized terms used but not defined herein have the meanings assigned to them in the Preliminary Prospectus expected to be dated April 30, 2018 relating to the offered certificates (hereinafter referred to as the “Preliminary Prospectus”).
|
| KEY FEATURES OF SECURITIZATION |
| Offering Terms: | |
| Co-Lead Managers and Joint Bookrunners: | Deutsche Bank Securities Inc., Citigroup Global Markets Inc. and J.P. Morgan Securities LLC |
| Co-Manager: | Jefferies LLC and Academy Securities, Inc. |
| Mortgage Loan Sellers: | German American Capital Corporation* (“GACC”) (22.4%), LoanCore Capital Markets LLC (“LCM”) (64.0%), Citi Real Estate Funding Inc. (“CREFI”) (8.1%) and JPMorgan Chase Bank, National Association (“JPMCB”) (5.5%) and *An indirect wholly owned subsidiary of Deutsche Bank AG |
| Master Servicer: | Midland Loan Services, a Division of PNC Bank, National Association (“Midland Loan Services”) |
| Operating Advisor: | Park Bridge Lender Services LLC |
| Asset Representations Reviewer: | Park Bridge Lender Services LLC |
| Special Servicer: | Midland Loan Services |
| Certificate Administrator: | Wells Fargo Bank, National Association (“Wells Fargo”) |
| Trustee: | Wilmington Trust, National Association |
| Rating Agencies: | Moody’s Investors Service, Inc. (“Moody’s”), Fitch Ratings, Inc. (“Fitch”) and Kroll Bond Rating Agency, Inc. (“KBRA”) |
| U.S. Credit Risk Retention: | For a discussion on the manner in which the U.S. credit risk retention requirements are being satisfied by LCM, as retaining sponsor, see “Credit Risk Retention” in the Preliminary Prospectus. Note that this securitization transaction is not structured to satisfy the EU risk retention and due diligence requirements. |
| Determination Date: | 6th day of each month, or if such 6th day is not a business day, the immediately following business day, commencing in June 2018. |
| Distribution Date: | 4th business day following the Determination Date in each month, commencing in June 2018. |
| Cut-off Date: | With respect to each mortgage loan, the later of the related payment date of such mortgage loan in May 2018 (or, in the case of any mortgage loan that has its first due date subsequent to May 2018, the date that would have been its due date in May 2018 under the terms of that mortgage loan if a monthly payment were scheduled to be due in that month) and the date of origination of such mortgage loan. Unless otherwise noted, all mortgage loan statistics are based on balances as of the Cut-off Date. |
| Closing Date: | On or about May 22, 2018 |
| Settlement Terms: | DTC, Euroclear and Clearstream, same day funds, with accrued interest. |
| ERISA Eligible: | All of the Offered Certificates are expected to be ERISA eligible. |
| SMMEA Eligible: | None of the Offered Certificates will be SMMEA eligible. |
| Day Count: | 30/360 |
| Tax Treatment: | REMIC |
| Rated Final Distribution Date: | May 2051 |
| Minimum Denominations: | $10,000 (for offered principal balance certificates) and $100,000 (for Class X-A Certificates) and in each case in multiples of $1 thereafter. |
| Clean-up Call: | 1% (with certain exceptions described under “Pooling and Servicing Agreement—Termination; Retirement of Certificates” in the Preliminary Prospectus) |
| Distribution of Collateral by Property Type |

THE INFORMATION IN THIS STRUCTURAL AND COLLATERAL TERM SHEET IS NOT COMPLETE AND MAY BE AMENDED PRIOR TO THE TIME OF SALE. THIS TERM SHEET IS NOT AN OFFER TO SELL THESE SECURITIES AND IT IS NOT A SOLICITATION OF AN OFFER TO BUY THESE SECURITIES IN ANY JURISDICTION WHERE THE OFFER OR SALE IS NOT PERMITTED.
2
COMM 2018-COR3 Mortgage Trust
|
| TRANSACTION HIGHLIGHTS |
| Mortgage Loan Sellers | Number of Mortgage Loans |
Number of Mortgaged Properties |
Aggregate Cut-off Date Balance |
%
of Initial Pool Balance |
| LoanCore Capital Markets LLC | 24 | 27 | $572,718,334 | 56.9% |
| German American Capital Corporation | 4 | 4 | $154,194,472 | 15.3% |
| LoanCore Capital Markets LLC/German American Capital Corporation | 2 | 2 | $142,000,000 | 14.1% |
| Citi Real Estate Funding Inc. | 8 | 8 | $81,810,094 | 8.1% |
| JPMorgan Chase Bank, National Association | 3 | 3 | $55,359,912 | 5.5% |
| Total: | 41 | 44 | $1,006,082,811 | 100.0% |
|
Pooled Collateral Facts: |
|
| Initial Outstanding Pool Balance: | $1,006,082,811 |
| Number of Mortgage Loans: | 41 |
| Number of Mortgaged Properties: | 44 |
| Average Mortgage Loan Cut-off Date Balance: | $24,538,605 |
| Average Mortgaged Property Cut-off Date Balance: | $22,865,518 |
| Weighted Average Mortgage Rate: | 4.5764% |
| Weighted Average Mortgage Loan Original Term to Maturity Date or ARD (months)(1): | 121 |
| Weighted Average Mortgage Loan Remaining Term to Maturity Date or ARD (months)(1): | 117 |
| Weighted Average Mortgage Loan Seasoning (months): | 4 |
| % of Mortgaged Properties Leased to a Single Tenant: | 29.5% |
Credit Statistics(2): |
|
| Weighted Average Mortgage Loan U/W NCF DSCR: | 2.05x |
| Weighted Average Mortgage Loan Cut-off Date LTV(3): | 56.9% |
| Weighted Average Mortgage Loan Maturity Date or ARD LTV(1)(3): | 55.0% |
| Weighted Average U/W NOI Debt Yield: | 10.5% |
Amortization Overview: |
|
| % Mortgage Loans which pay Interest Only through Maturity Date or ARD(1): | 80.3% |
| % Mortgage Loans which pay Interest Only followed by Amortization through Maturity Date or ARD(1): | 10.6% |
| % Mortgage Loans with Amortization through Maturity Date or ARD(1): | 9.1% |
| Weighted Average Remaining Amortization Term (months)(4): | 359 |
Loan Structural Features: |
|
| % Mortgage Loans with Upfront or Ongoing Tax Reserves: | 72.1% |
| % Mortgage Loans with Upfront or Ongoing Replacement Reserves(5): | 64.7% |
| % Mortgage Loans with Upfront or Ongoing Insurance Reserves: | 51.4% |
| % Mortgage Loans with Upfront or Ongoing TI/LC Reserves(6): | 84.7% |
| % Mortgage Loans with Upfront Engineering Reserves: | 32.6% |
| % Mortgage Loans with Upfront or Ongoing Other Reserves: | 45.8% |
| % Mortgage Loans with In Place Hard Lockboxes: | 78.7% |
| % Mortgage Loans with Cash Traps Triggered at Debt Yield ≥ 5.6%: | 59.7% |
| % Mortgage Loans with Cash Traps Triggered at DSCR Levels ≥ 1.10x: | 35.8% |
| % Mortgage Loans with Defeasance Only After a Lockout Period and Prior to an Open Period: | 99.1% |
| % Mortgage Loans with Prepayment Only After a Lockout Period and Prior to an Open Period with a Yield Maintenance Charge: | 0.9% |
| (1) | With respect to the 1001 North Shoreline Boulevard Mortgage Loan (the “ARD Loan”), the Original Term to Maturity Date or ARD, Remaining Term to Maturity Date or ARD and Maturity Date or ARD LTV are calculated through the related anticipated repayment date. |
| (2) | The LTV, DSCR and Debt Yield calculations include any related pari passu companion loan(s) and exclude any related subordinate companion loan(s) and/or mezzanine loan(s). |
| (3) | With respect to four Mortgage Loans, in aggregate, representing approximately 12.3% of the Initial Outstanding Pool Balance (including 1001 North Shoreline Boulevard, Shoreline Center, Fairfield Inn Charleston Airport and Maple Ridge Plaza), the Cut-off Date LTV and Maturity Date or ARD LTV has been calculated based on other than “As Is” appraised values. For additional information please see the footnotes to Annex A-1 in the Preliminary Prospectus. |
| (4) | Excludes mortgage loans which are interest only for the full loan term. |
| (5) | Includes FF&E reserves. |
| (6) | Represents the percent of the allocated Initial Outstanding Pool Balance of office, retail, mixed use and industrial properties only. |
THE INFORMATION IN THIS STRUCTURAL AND COLLATERAL TERM SHEET IS NOT COMPLETE AND MAY BE AMENDED PRIOR TO THE TIME OF SALE. THIS TERM SHEET IS NOT AN OFFER TO SELL THESE SECURITIES AND IT IS NOT A SOLICITATION OF AN OFFER TO BUY THESE SECURITIES IN ANY JURISDICTION WHERE THE OFFER OR SALE IS NOT PERMITTED.
3
|
COMM 2018-COR3 Mortgage Trust
|
| STRUCTURE OVERVIEW |
OFFERED CERTIFICATES
| Class(1) | Ratings (Moody’s/Fitch/KBRA) |
Initial Certificate Balance or Notional |
Initial |
Weighted Average Life (years)(3) |
Principal Window (months)(3) |
Certificate Principal to Value Ratio(4) | Underwritten NOI Debt Yield(5) | |||||||||
| Class A-1 | Aaa(sf)/AAAsf/AAA(sf) | $11,703,000 | 30.000%(7) | 2.88 | 1 – 61 | 39.8% | 15.0% | |||||||||
| Class A-SB | Aaa(sf)/AAAsf/AAA(sf) | $17,303,000 | 30.000%(7) | 7.36 | 61 – 115 | 39.8% | 15.0% | |||||||||
| Class A-2 | Aaa(sf)/AAAsf/AAA(sf) | (6) | 30.000%(7) | (6) | (6) | 39.8% | 15.0% | |||||||||
| Class A-3 | Aaa(sf)/AAAsf/AAA(sf) | (6) | 30.000%(7) | (6) | (6) | 39.8% | 15.0% | |||||||||
| Class X-A(8) | Aa1(sf)/AAAsf/AAA(sf) | $760,850,000 | (9) | N/A | N/A | N/A | N/A | N/A | ||||||||
| Class A-M | Aa2(sf)/AAAsf/AAA(sf) | $56,593,000 | 24.375% | 9.88 | 119 – 119 | 43.0% | 13.9% | |||||||||
| Class B | NR/AA-sf/AA(sf) | $51,561,000 | 19.250% | 9.88 | 119 – 119 | 45.9% | 13.0% | |||||||||
| Class C | NR/A-sf/A-(sf) | $49,047,000 | 14.375% | 9.88 | 119 – 119 | 48.7% | 12.3% | |||||||||
NON-OFFERED CERTIFICATES
| Class(1) | Ratings (Moody’s/Fitch/KBRA) |
Initial Certificate Balance or Notional Amount(2) |
Initial Subordination |
Weighted Average Life (years)(3) |
Principal Window (months)(3) |
Certificate Principal to Value Ratio(4) | Underwritten NOI Debt Yield(5) | |||||||||
| Class X-B(8) | NR/AA-sf/AAA(sf) | $51,561,000 | (9) | N/A | N/A | N/A | N/A | N/A | ||||||||
| Class X-D(8) | NR/BBB-sf/BBB-(sf) | $47,340,000 | (9) | N/A | N/A | N/A | N/A | N/A | ||||||||
| Class D | NR/BBB-sf/BBB-(sf) | $47,340,000 | (10) | 9.670% | 9.93 | 119 – 120 | 51.4% | 11.6% | ||||||||
| Class E-RR(11) | NR/BBB-sf/BBB-(sf) | $11,767,000 | (10) | 8.500% | 9.97 | 120 – 120 | 52.1% | 11.5% | ||||||||
| Class F-RR(11) | NR/BBsf/BB-(sf) | $20,122,000 | 6.500% | 9.97 | 120 – 120 | 53.2% | 11.2% | |||||||||
| Class G-RR(11) | NR/B-sf/B-(sf) | $18,864,000 | 4.625% | 9.97 | 120 – 120 | 54.3% | 11.0% | |||||||||
| Class H-RR(11) | NR/NR/NR | $46,531,811 | 0.000% | 9.97 | 120 – 120 | 56.9% | 10.5% | |||||||||
| (1) | The pass-through rates applicable to the Class A-1, Class A-SB, Class A-2, Class A-3, Class A-M, Class B, Class C, Class D, Class E-RR, Class F-RR, Class G-RR and Class H-RR certificates (the “Principal Balance Certificates”) will equal one of: (i) a fixed per annum rate, (ii) the weighted average of the net mortgage rates on the mortgage loans (in each case, adjusted, if necessary, to accrue on the basis of a 360-day year consisting of twelve 30-day months) as of their respective due dates in the month preceding the month in which the related Distribution Date occurs (the “WAC” Rate”), (iii) a rate equal to the lesser of a specified pass-through rate and the WAC Rate or (iv) the WAC Rate less a specified rate. |
| (2) | Approximate; subject to a permitted variance of plus or minus 5%. |
| (3) | The weighted average life and principal window during which distributions of principal would be received as set forth in the table with respect to each class of Principal Balance Certificates is based on (i) modeling assumptions described in the Preliminary Prospectus, (ii) assumptions that there are no prepayments, delinquencies or losses on the mortgage loans and (iii) assumptions that there are no extensions of maturity dates and mortgage loans with anticipated repayment dates, if any, are repaid on the respective anticipated repayment dates. |
| (4) | “Certificate Principal to Value Ratio” for any class of Principal Balance Certificates is calculated as the product of (a) the weighted average mortgage loan Cut-off Date LTV of the mortgage pool, multiplied by (b) a fraction, the numerator of which is the total initial Certificate Balance of the related class of Principal Balance Certificates and all other classes of Principal Balance Certificates, if any, that are senior to such class, and the denominator of which is the total initial Certificate Balance of all classes of Principal Balance Certificates. The Certificate Principal to Value Ratios of the Class A-1, Class A-SB, Class A-2 and Class A-3 certificates are calculated in the aggregate for those classes as if they were a single class. |
| (5) | “Underwritten NOI Debt Yield” for any class of Principal Balance Certificates is calculated as the product of (a) the weighted average Underwritten NOI Debt Yield for the mortgage pool, multiplied by (b) a fraction, the numerator of which is the total initial Certificate Balance of classes of Principal Balance Certificates and the denominator of which is the total initial Certificate Balance of the such class of Principal Balance Certificates and all other classes of Principal Balance Certificates, if any, that are senior to such class. The Underwritten NOI Debt Yields of the Class A-1, Class A-SB, Class A-2 and Class A-3 certificates are calculated in the aggregate for those classes as if they were a single class. |
| (6) | The exact initial Certificate Balances of the Class A-2 and Class A-3 certificates are unknown and will be determined based on the final pricing of those classes of certificates. However, the respective initial Certificate Balances, weighted average lives and principal windows of the Class A-2 and Class A-3 certificates are expected to be within the applicable ranges reflected in the following chart. The aggregate initial Certificate Balance of the Class A-2 and Class A-3 certificates is expected to be approximately $675,251,000, subject to a variance of plus or minus 5.0%. |
| Class of Certificates | Expected Range of Initial Certificate Balance | Expected Range of Weighted Avg. Life (years) | Principal Window (months) |
| Class A-2 | $100,000,000 - $303,000,000 | 9.20 - 9.42 | 109 - 113 / 109 - 117 |
| Class A-3 | $372,251,000 - $575,251,000 | 9.83 - 9.73 | 117 - 119 / 113 - 119 |
| (7) | The initial subordination levels for the Class A-1, Class A-SB, Class A-2 and Class A-3 certificates are represented in the aggregate. |
| (8) | As further described in the Preliminary Prospectus, the pass-through rate applicable to the Class X-A, Class X-B and Class X-D certificates (collectively, the “Class X Certificates” and, together with the Principal Balance Certificates, the “Regular Certificates”) for each Distribution Date will generally be equal to the excess of (i) the WAC Rate over (ii)(A) with respect to the Class X-A certificates, the weighted average of the pass-through rates of the Class A-1, Class A-SB, Class A-2, Class A-3 and Class A-M certificates (based on their Certificate Balances), (B) with respect to the Class X-B certificates, the pass-through rate of the Class B certificates and (C) with respect to the Class X-D certificates, the pass-through rate of the Class D certificates. |
| (9) | The Class X Certificates will not have Certificate Balances. None of the Class X Certificates will be entitled to distributions of principal. The interest accrual amounts on the Class X-A certificates will be calculated by reference to a notional amount equal to the sum of the Certificate Balances of each of the Class A-1, Class A-SB, Class A-2, Class A-3 and Class A-M certificates. The interest accrual amounts on the Class X-B certificates will be calculated by reference to a notional amount equal to the Certificate Balance of the Class B certificates. The interest accrual amounts on the Class X-D certificates will be calculated by reference to a notional amount equal to the Certificate Balance of the Class D certificates. The notional amount of each class of the Class X Certificates is subject to change depending upon the final pricing of the Principal Balance Certificates, as follows: (1) if as a result of such pricing the pass-through rate of any class of Principal Balance Certificates whose Certificate Balance comprises such notional amount is equal to the WAC Rate, the Certificate Balance of such class of Principal Balance Certificates may not be part of, and will reduce accordingly, such notional amount of the related Class X Certificates (or, if as a result of such pricing the pass-through rate of the related Class X Certificates is equal to zero, such Class X Certificates may not be issued on the Closing Date), and/or (2) if as a result of such pricing the pass-through rate of any class of Principal Balance Certificates that does not comprise such notional amount of the related Class X Certificates is equal to less than the WAC Rate, such class of Principal Balance Certificates may become a part of, and will increase accordingly, such notional amount of the related Class X Certificates. |
| (10) | The approximate initial Certificate Balance of each of the Class D and Class E-RR certificates is subject to change based on final pricing of all classes of Principal Balance Certificates and Class X Certificates, with the ultimate initial Certificate Balance of the Class D and Class E-RR certificates determined such that, upon initial issuance the aggregate fair value of the RR Certificates (as defined below) will equal at least 5% of the fair value of all classes of Principal Balance Certificates and Class X Certificates. |
| (11) | The Class E-RR, Class F-RR, Class G-RR and Class H-RR certificates (collectively, the “RR Certificates”) are expected to be retained by LoanCore Capital Markets LLC, as “retaining sponsor”, or its “majority-owned affiliate” (in each case as defined in the credit risk retention rules) in accordance with the credit risk retention rules applicable to this securitization transaction. For more information regarding the methodology and key inputs and assumptions used to determine the sizing of the RR Certificates, see “Credit Risk Retention” in the Preliminary Prospectus. |
THE INFORMATION IN THIS STRUCTURAL AND COLLATERAL TERM SHEET IS NOT COMPLETE AND MAY BE AMENDED PRIOR TO THE TIME OF SALE. THIS TERM SHEET IS NOT AN OFFER TO SELL THESE SECURITIES AND IT IS NOT A SOLICITATION OF AN OFFER TO BUY THESE SECURITIES IN ANY JURISDICTION WHERE THE OFFER OR SALE IS NOT PERMITTED.
4
|
COMM 2018-COR3 Mortgage Trust
|
| STRUCTURE OVERVIEW |
| Principal Payments: |
Payments in respect of principal on the certificates will be distributed, first, to the Class A-SB certificates, until the Certificate Balance of such class is reduced to the planned principal balance for the related Distribution Date set forth on Annex G to the Preliminary Prospectus, then, to the Class A-1, Class A-2, Class A-3, Class A-SB, Class A-M, Class B, Class C, Class D, Class E-RR, Class F-RR, Class G-RR and Class H-RR certificates, in that order, until the Certificate Balance of each such class is reduced to zero. Notwithstanding the foregoing, if the total Certificate Balance of the Class A-M, Class B, Class C, Class D, Class E-RR, Class F-RR, Class G-RR and Class H-RR certificates have been reduced to zero as a result of loss allocation, payments in respect of principal of the certificates will be distributed, first, to the Class A-1, Class A-SB, Class A-2 and Class A-3 certificates, on a pro rata basis, based on the Certificate Balance of each such class, then, to the extent of any recoveries on realized losses, to the Class A-M, Class B, Class C, Class D, Class E-RR, Class F-RR, Class G-RR and Class H-RR certificates, in that order, in each case until the Certificate Balance of each such class is reduced to zero (or previously allocated realized losses have been fully reimbursed).
Each class of Class X Certificates will not be entitled to receive distributions of principal; however, (i) the notional amount of the Class X-A certificates will be reduced by the aggregate amount of principal distributions and realized losses allocated to the Class A-1, Class A-SB, Class A-2, Class A-3 and Class A-M certificates; (ii) the notional amount of the Class X-B certificates will be reduced by the principal distributions and realized losses allocated to the Class B certificates; and (iii) the notional amount of the Class X-D certificates will be reduced by the principal distributions and realized losses allocated to the Class D certificates.
|
|
| Interest Payments: |
On each Distribution Date, interest accrued for each class of certificates at the applicable pass-through rate will be distributed in the following order of priority, to the extent of available funds (exclusive of any portion thereof that represents (i) any yield maintenance charges and prepayment premiums and/or (ii) any excess interest accrued after the related anticipated repayment date on any mortgage loan with an anticipated repayment date): first, to the Class A-1, Class A-SB, Class A-2, Class A-3, Class X-A, Class X-B and Class X-D certificates, on a pro rata basis, based on the accrued and unpaid interest on each such class and then, to the Class A-M, Class B, Class C, Class D, Class E-RR, Class F-RR, Class G-RR and Class H-RR certificates, in that order, in each case until the interest payable to each such class is paid in full.
The pass-through rates applicable to the Class A-1, Class A-SB, Class A-2, Class A-3, Class A-M, Class B, Class C, Class D, Class E-RR, Class F-RR, Class G-RR and Class H-RR certificates for each Distribution Date will equal one of: (i) a fixed per annum rate, (ii) the WAC Rate, (iii) a rate equal to the lesser of a specified pass-through rate and the WAC Rate or (iv) the WAC Rate less a specified rate.
As further described in the Preliminary Prospectus, the pass-through rates applicable to the Class X Certificates for each Distribution Date will generally be equal to the excess of (i) the WAC Rate over (ii) (A) with respect to the Class X-A certificates, the weighted average of the pass-through rates of the Class A-1, Class A-SB, Class A-2, Class A-3 and Class A-M certificates (based on their Certificate Balances immediately prior to that Distribution Date), (B) with respect to the Class X-B certificates, the pass-through rate of the Class B certificates and (C) with respect to the Class X-D certificates, the pass-through rate of the Class D certificates.
|
|
| Prepayment Interest Shortfalls: |
Prepayment interest shortfalls will be allocated pro rata based on interest entitlements, in reduction of the interest otherwise payable with respect to each of the interest-bearing classes of certificates.
|
|
| Loss Allocation: |
Losses will be allocated to each class of the Principal Balance Certificates in reverse alphabetical order starting with Class H-RR through and including Class A-M and then to Class A-1, Class A-SB, Class A-2 and Class A-3 certificates on a pro rata basis based on the Certificate Balance of each such class. The notional amount of any class of Class X Certificates will be reduced by the aggregate amount of realized losses allocated to the class(es) of certificates that are component(s) of the notional amount of such class of Class X Certificates. |
THE INFORMATION IN THIS STRUCTURAL AND COLLATERAL TERM SHEET IS NOT COMPLETE AND MAY BE AMENDED PRIOR TO THE TIME OF SALE. THIS TERM SHEET IS NOT AN OFFER TO SELL THESE SECURITIES AND IT IS NOT A SOLICITATION OF AN OFFER TO BUY THESE SECURITIES IN ANY JURISDICTION WHERE THE OFFER OR SALE IS NOT PERMITTED.
5
|
COMM 2018-COR3 Mortgage Trust
|
| STRUCTURE OVERVIEW |
|
Prepayment Premiums:
|
All prepayment premiums (either fixed prepayment premiums or yield maintenance amounts) collected on the Mortgage Loans will be allocated to each of the Class A-1, Class A-SB, Class A-2, Class A-3, Class A-M, Class B, Class C and Class D certificates (the “YM P&I Certificates”) then entitled to principal distributions, which percentage will be equal to the product of (a) a fraction, not greater than one, the numerator of which is the amount of principal distributed to such class on such Distribution Date and the denominator of which is the total amount of principal distributed to the holders of the Class A-1, Class A-SB, Class A-2, Class A-3, Class A-M, Class B, Class C, Class D, Class E-RR, Class F-RR, Class G-RR and Class H-RR certificates on such Distribution Date, and (b) a fraction (expressed as a percentage which can be no greater than 100% nor less than 0%), the numerator of which is the excess of the pass-through rate of each such class of certificates currently receiving principal over the relevant Discount Rate, and the denominator of which is the excess of the Mortgage Rate of the related Mortgage Loan over the relevant Discount Rate.
Prepayment Premium Allocation Percentage for all YM P&I Certificates = |
|
(Pass-Through Rate - Discount Rate) |
X |
The percentage of the principal distribution amount to such class as described in (a) above | |
| (Mortgage Rate - Discount Rate) |
|
The remaining percentage of the prepayment premiums will be allocated to the Class X-A, Class X-B and Class X-D certificates in the manner described in the Preliminary Prospectus. In general, this formula provides for an increase in the percentage of prepayment premiums allocated to the YM P&I Certificates then entitled to principal distributions relative to the Class X-A, Class X-B and Class X-D certificates as Discount Rates decrease and a decrease in the percentage allocated to such classes as Discount Rates rise.
|
||
| Whole Loans: |
The mortgaged properties identified on Annex A-1 to the Preliminary Prospectus as 1001 North Shoreline Boulevard, Grand Hyatt Seattle, 315 West 36th Street, Atlantic Times Square and Lehigh Valley Mall each secure both a mortgage loan to be included in the trust fund and one or more other companion loans that will not be included in the trust fund, each of which will be pari passu and/or subordinate in right of payment with the mortgage loan included in the trust fund. We refer to each such group of related loans as a “whole loan”.
As of the Closing Date, the pari passu companion loans and the subordinate companion loans are expected to be held by the party identified below under “Companion Loan Summary”.
|
|
| Control Rights and Directing Certificateholder: |
Controlling Class Certificateholders will generally have certain control rights over servicing matters with respect to each Serviced Mortgage Loan and any related Serviced Companion Loans (other than the 1001 North Shoreline Boulevard Mortgage Loan, the Atlantic Times Square Mortgage Loan and the related Companion Loans). The majority owner or appointed representative of the class of Control Eligible Certificates that is the Controlling Class will be entitled to direct the Special Servicer to take, or refrain from taking certain actions with respect to each Serviced Mortgage Loan and any related Serviced Companion Loans (other than 1001 North Shoreline Boulevard Mortgage Loan, the Atlantic Times Square Mortgage Loan and the related Companion Loans), and the holder of the controlling note of the Atlantic Times Square Whole Loan will be entitled to direct the Special Servicer to take, or refrain from taking certain actions with respect to such Whole Loan (such holder, together with the majority owner or appointed representative of the Controlling Class, the “Directing Certificateholder”). Furthermore, the Directing Certificateholder will also have the right to receive notice and consent to certain material actions that the Master Servicer and the Special Servicer proposes to take with respect to each Serviced Mortgage Loan and any related Serviced Companion Loans.
It is expected that LoanCore Capital Markets LLC or its affiliate will be the initial Directing Certificateholder with respect to each Serviced Mortgage Loan and any related Serviced Companion Loans (other than 1001 North Shoreline Boulevard Mortgage Loan, the Atlantic Times Square Mortgage Loan and the related Serviced Companion Loans). It is expected that DBNY will be the initial Directing Certificateholder with respect to the 1001 North Shoreline Boulevard Mortgage Loan. It is expected that JPMCB will be the initial Directing Certificateholder with respect to the Atlantic Times Square Mortgage Loan. |
THE INFORMATION IN THIS STRUCTURAL AND COLLATERAL TERM SHEET IS NOT COMPLETE AND MAY BE AMENDED PRIOR TO THE TIME OF SALE. THIS TERM SHEET IS NOT AN OFFER TO SELL THESE SECURITIES AND IT IS NOT A SOLICITATION OF AN OFFER TO BUY THESE SECURITIES IN ANY JURISDICTION WHERE THE OFFER OR SALE IS NOT PERMITTED.
6
|
COMM 2018-COR3 Mortgage Trust
|
| STRUCTURE OVERVIEW |
| For a description of the directing holder for each Non-Serviced Whole Loan, see “Description of the Mortgage Pool—The Whole Loans” and “Pooling and Servicing Agreement—The Directing Certificateholder” in the Preliminary Prospectus.
|
||
| Control Eligible Certificates: |
Class E-RR, Class F-RR, Class G-RR and Class H-RR certificates.
|
|
| Controlling Class: |
The Controlling Class will be the most subordinate class of Control Eligible Certificates then outstanding that has an aggregate Certificate Balance, as notionally reduced by any appraisal reduction amounts and any collateral deficiency amounts allocable to such class, equal to at least 25% of the initial Certificate Balance of such class; provided that if at any time the Certificate Balances of all Control Eligible Certificates, as notionally reduced by any appraisal reduction amounts (but without regard to any collateral deficiency amounts) allocable to such classes, have been reduced to zero, then the “Controlling Class” will be the most subordinate class of Control Eligible Certificates that has an aggregate principal balance greater than zero; provided, further that if at any time the Certificate Balances of the Class A-1, Class A-SB, Class A-2, Class A-3, Class A-M, Class B, Class C and Class D certificates have been reduced to zero as a result of the allocation of principal payments on the Mortgage Loans, then the “Controlling Class” will be the most subordinate class of Control Eligible Certificates that has an aggregate Certificate Balance greater than zero (without regard to the application of appraisal reduction amounts or any collateral deficiency amounts to notionally reduce the Certificate Balance of such class).
The Controlling Class as of the Closing Date will be the Class H-RR certificates.
|
|
| Appraised-Out Class: |
Any class of Control Eligible Certificates that has been determined, as a result of appraisal reductions amounts and collateral deficiency amounts allocable to such class, to no longer be the Controlling Class.
|
|
| Remedies Available to Holders of an Appraised-Out Class: |
Holders of the majority of any class of Control Eligible Certificates that is determined at any time of determination to no longer be the Controlling Class as a result of an allocation of appraisal reduction amounts and collateral deficiency amounts in respect of such class will have the right, at their sole expense, to require the Special Servicer to order a second appraisal for any Serviced Mortgage Loan for which an appraisal reduction event has occurred or as to which there exists a collateral deficiency amount. Upon receipt of the second appraisal, the Special Servicer will be required to determine, in accordance with the Servicing Standard, whether, based on its assessment of the second appraisal, a recalculation of the appraisal reduction amount or collateral deficiency amount is warranted. If warranted, the Special Servicer will direct the Master Servicer to recalculate the appraisal reduction amount or collateral deficiency amount based on the second appraisal, and if required by such recalculation, the Special Servicer will reinstate the Appraised-Out Class as the Controlling Class. The Holders of an Appraised-Out Class requesting a second appraisal will not be entitled to exercise any rights of the Controlling Class until such time, if any, as the class is reinstated as the Controlling Class.
|
|
| Control Termination Event: |
Will occur (other than with respect to the 1001 North Shoreline Boulevard Mortgage Loan or the Atlantic Times Square Mortgage Loan) when (i) the Class E-RR certificates have a Certificate Balance (taking into account the application of any appraisal reduction amounts and collateral deficiency amounts to notionally reduce the Certificate Balance of such class) of less than 25% of the initial Certificate Balance of that class or (ii) a holder of the Class E-RR certificates is the majority Controlling Class Certificateholder and has irrevocably waived its right, in writing, to exercise any of the rights of the Controlling Class Certificateholder and such rights have not been reinstated to a successor Controlling Class Certificateholder (subject to “—Controlling Class” above).
Upon the occurrence and the continuance of a Control Termination Event, the Directing Certificateholder will no longer have any control rights. The Directing Certificateholder will no longer have the right to direct certain actions of the Special Servicer and will no longer have consent rights with respect to certain material actions that the Master Servicer or Special Servicer proposes to take with respect to a Serviced Mortgage Loan and any related Serviced Companion Loans.
Upon the occurrence and continuation of a Control Termination Event, the Directing Certificateholder will retain non-binding consultation rights with respect to certain material actions that the Special Servicer proposes to take with respect to a Serviced Mortgage Loan |
THE INFORMATION IN THIS STRUCTURAL AND COLLATERAL TERM SHEET IS NOT COMPLETE AND MAY BE AMENDED PRIOR TO THE TIME OF SALE. THIS TERM SHEET IS NOT AN OFFER TO SELL THESE SECURITIES AND IT IS NOT A SOLICITATION OF AN OFFER TO BUY THESE SECURITIES IN ANY JURISDICTION WHERE THE OFFER OR SALE IS NOT PERMITTED.
7
|
COMM 2018-COR3 Mortgage Trust
|
| STRUCTURE OVERVIEW |
|
and any related Serviced Companion Loans. Such consultation rights will continue until the occurrence of a Consultation Termination Event.
|
||
| Consultation Termination Event: |
Will occur (other than with respect to the 1001 North Shoreline Boulevard Mortgage Loan or the Atlantic Times Square Mortgage Loan) when (i) there is no class of Control Eligible Certificates that has a then-outstanding Certificate Balance at least equal to 25% of the initial Certificate Balance of such class, in each case, without regard to the application of any appraisal reduction amounts and collateral deficiency amounts; or (ii) a holder of the Class E-RR certificates is the majority Controlling Class Certificateholder and has irrevocably waived its right, in writing, to exercise any of the rights of the Controlling Class Certificateholder and such rights have not been reinstated to a successor Controlling Class Certificateholder (subject to “—Controlling Class” above).
Upon the occurrence and continuance of a Consultation Termination Event, the Directing Certificateholder will have no rights under the PSA other than those rights that all Certificateholders have.
|
|
| Appointment and Replacement of Special Servicer: |
The Directing Certificateholder will appoint the initial Special Servicer with respect to each Serviced Mortgage Loan and any related Serviced Companion Loans as of the Closing Date. Prior to the occurrence and continuance of a Control Termination Event, the Directing Certificateholder generally may replace the Special Servicer with respect to each Serviced Mortgage Loan and any related Serviced Companion Loans with or without cause at any time.
Upon the occurrence and during the continuance of a Control Termination Event, the Directing Certificateholder will no longer have the right to replace the Special Servicer and such replacement (other than with respect to the Non-Serviced Whole Loans) will occur based on a vote of holders of all voting eligible classes of certificates as described below. See “Description of the Mortgage Pool—The Whole Loans” and “Pooling and Servicing Agreement” in the Preliminary Prospectus for a description of the special servicer appointment and replacement rights with respect to Non-Serviced Whole Loans.
|
|
| Replacement of Special Servicer by Vote of Certificateholders: |
Other than with respect to Non-Serviced Whole Loans, if a Control Termination Event has occurred and is continuing, upon (i) the written direction of holders of certificates evidencing not less than 25% of the voting rights of all classes of certificates entitled to principal (taking into account the application of appraisal reduction amounts to notionally reduce the Certificate Balances of classes to which such appraisal reduction amounts are allocable) requesting a vote to replace the Special Servicer with a replacement special servicer, (ii) payment by such requesting holders to the Certificate Administrator of all reasonable fees and expenses to be incurred by the Certificate Administrator in connection with administering such vote and (iii) delivery by such holders to the Certificate Administrator and Trustee of written confirmations from each Rating Agency that the appointment of the replacement Special Servicer will not result in a downgrade of the certificates, the Certificate Administrator will be required to promptly post notice of such request on the Certificate Administrator’s website and concurrently provide written notice of such request by mail to all Certificateholders of such request and conduct the solicitation of votes of all certificates in such regard. Upon the written direction (within 180 days) of (i) Holders of at least 66-2/3% of a Certificateholder Quorum or (ii) Holders of at least 50% of the voting rights of all classes of certificates entitled to principal, the Trustee will immediately replace the Special Servicer with the replacement Special Servicer (other than with respect to Non-Serviced Whole Loans).
“Certificateholder Quorum” means, in connection with any solicitation of votes in connection with the replacement of the Special Servicer as described above or the Asset Representations Reviewer as described below, the holders of certificates evidencing at least 50% of the aggregate voting rights (taking into account Realized Losses and, other than with respect to the termination of the Asset Representations Reviewer, the application of any appraisal reduction amounts to notionally reduce the Certificate Balance of the certificates) of all classes of Principal Balance Certificates, on an aggregate basis.
In addition, if at any time the Operating Advisor determines, in its sole discretion exercised in good faith, that (1) the Special Servicer is not performing its duties as required under the PSA or is otherwise not acting in accordance with the Servicing Standard and (2) the replacement of the Special Servicer would be in the best interest of the Certificateholders as a collective whole, then the Operating Advisor will have the right to recommend the replacement of the Special |
THE INFORMATION IN THIS STRUCTURAL AND COLLATERAL TERM SHEET IS NOT COMPLETE AND MAY BE AMENDED PRIOR TO THE TIME OF SALE. THIS TERM SHEET IS NOT AN OFFER TO SELL THESE SECURITIES AND IT IS NOT A SOLICITATION OF AN OFFER TO BUY THESE SECURITIES IN ANY JURISDICTION WHERE THE OFFER OR SALE IS NOT PERMITTED.
8
|
COMM 2018-COR3 Mortgage Trust
|
| STRUCTURE OVERVIEW |
Servicer. The Operating Advisor’s recommendation to replace the Special Servicer (other than with respect Non-Serviced Whole Loans) must be confirmed by a majority of the aggregate voting rights of all Principal Balance Certificates on an aggregate basis (taking into account the application of appraisal reduction amounts to notionally reduce the Certificate Balances of classes to which such appraisal reduction amounts are allocable) within 180 days from the time such recommendation is posted to the Certificate Administrator website and is subject to the receipt of written confirmations from each Rating Agency that the appointment of the replacement Special Servicer will not result in a downgrade of the certificates.
See “Description of the Mortgage Pool—The Whole Loans” and “Pooling and Servicing Agreement” in the Preliminary Prospectus for a description of the special servicer appointment and replacement rights with respect to Non-Serviced Whole Loans.
|
||
| Cap on Workout and Liquidation Fees: |
The workout fees and liquidation fees payable to a Special Servicer under the PSA will be an amount equal to the lesser of: (1) 1.0% of each collection of interest and principal following a workout or liquidation and (2) $1,000,000 per workout or liquidation. All Modification Fees actually paid to the Special Servicer in connection with a workout or liquidation or in connection with any prior workout or partial liquidation that occurred within the prior 18 months will be deducted from the total workout fee and/or liquidation fees payable (other than Modification Fees earned while the Mortgage Loan was not in special servicing). In addition, the total amount of workout and liquidation fees actually payable by the Trust under the PSA will be capped in the aggregate at $1,000,000 for each related Mortgage Loan. If a new special servicer begins servicing the related Mortgage Loan, all amounts paid to the prior special servicer will be disregarded for purposes of calculating the cap.
|
|
| Special Servicer Compensation: |
The special servicing fee will equal 0.25% per annum of the stated principal balance of the related specially serviced loan or REO property, as applicable. The Special Servicer and its affiliates will be prohibited from receiving or retaining any compensation or any other remuneration under the PSA (including, without limitation, in the form of commissions, brokerage fees, rebates, or as a result of any other fee-sharing arrangement) from any person (including, without limitation, the issuing entity, any borrower, any manager, any guarantor or indemnitor in respect of a Serviced Mortgage Loan and any related Serviced Companion Loans, if any, and any purchaser of any Serviced Mortgage Loan and any related Serviced Companion Loan or REO Property) in connection with the disposition, workout or foreclosure of any Serviced Mortgage Loan and any related Serviced Companion Loans, the management or disposition of any REO Property, or the performance of any other special servicing duties under the PSA, other than as expressly permitted in the PSA and other than commercially reasonable treasury management fees, banking fees, customary title agent fees and insurance commissions or fees received or retained by the Special Servicer or any of its Affiliates in connection with any services performed by such party with respect to any Mortgage Loan. Subject to certain limited exceptions, the Special Servicer will also be required to report any compensation or other remuneration the Special Servicer or its affiliates have received from any person and such information will be disclosed in the Certificateholders’ monthly distribution date statement.
|
|
| Operating Advisor: |
With respect to the Serviced Mortgage Loans and any related Serviced Companion Loans the Operating Advisor will have access to any final asset status report and all information available with respect to the transaction on the Certificate Administrator’s website and will have certain monitoring responsibilities on behalf of the entire trust. After the occurrence and during the continuance of an Operating Advisor Consultation Event, the Operating Advisor will have consultation rights with respect to certain major decisions.
The Operating Advisor will be subject to termination if holders of at least 15% of the aggregate voting rights of the certificates (in connection with termination and replacement relating to the Mortgage Loans) vote to terminate and replace the Operating Advisor and such vote is approved by holders of more than 50% of the applicable voting rights that exercise their right to vote (in the case of each of such vote and approval, taking into account Realized Losses and the application of any appraisal reduction amounts to notionally reduce the Certificate Balance of the certificates), provided that holders of at least 50% of the applicable voting rights have exercised their right to vote. The holders initiating such vote will be responsible for the fees and expenses in connection with the vote and replacement.
The Operating Advisor will not have consultation rights in respect of Non-Serviced Mortgage Loans. |
THE INFORMATION IN THIS STRUCTURAL AND COLLATERAL TERM SHEET IS NOT COMPLETE AND MAY BE AMENDED PRIOR TO THE TIME OF SALE. THIS TERM SHEET IS NOT AN OFFER TO SELL THESE SECURITIES AND IT IS NOT A SOLICITATION OF AN OFFER TO BUY THESE SECURITIES IN ANY JURISDICTION WHERE THE OFFER OR SALE IS NOT PERMITTED.
9
|
COMM 2018-COR3 Mortgage Trust
|
| STRUCTURE OVERVIEW |
| Asset Representations Reviewer: |
The Asset Representations Reviewer will be required to review certain delinquent Mortgage Loans after a specified delinquency threshold has been exceeded and the required percentage of Certificateholders vote to direct a review of such delinquent Mortgage Loans. An asset review will occur when either (1) Mortgage Loans with an aggregate outstanding principal balance of 25% or more of the aggregate outstanding principal balance of all of the Mortgage Loans (including any REO loans (or a portion of any REO loan in the case of a whole loan)) held by the issuing entity as of the end of the applicable collection period are delinquent loans or (2)(A) prior to and including the second anniversary of the Closing Date, at least 10 Mortgage Loans are delinquent loans as of the end of the applicable collection period and the outstanding principal balance of such delinquent loans in the aggregate constitutes at least 15% of the aggregate outstanding principal balance of all of the Mortgage Loans (including any REO loans (or a portion of any REO loan in the case of a whole loan)) held by the issuing entity as of the end of the applicable collection period, or (B) after the second anniversary of the Closing Date, at least 15 Mortgage Loans are delinquent loans as of the end of the applicable collection period and the outstanding principal balance of such delinquent loans in the aggregate constitutes at least 20% of the aggregate outstanding principal balance of all of the Mortgage Loans (including any REO loans (or a portion of any REO loan in the case of a whole loan)) held by the issuing entity as of the end of the applicable collection period.
The Asset Representations Reviewer may be terminated and replaced without cause. Upon (i) the written direction of Certificateholders evidencing not less than 25% of the voting rights (taking into account Realized Losses, but without regard to the application of any appraisal reduction amounts to notionally reduce the Certificate Balance of the certificates) requesting a vote to terminate and replace the Asset Representations Reviewer with a proposed successor asset representations reviewer that is an eligible asset representations reviewer, and (ii) payment by such holders to the Certificate Administrator of the reasonable fees and expenses to be incurred by the Certificate Administrator in connection with administering such vote, the Certificate Administrator will promptly provide notice to all Certificateholders and the Asset Representations Reviewer of such request by posting such notice on its internet website, and by mailing such notice to all Certificateholders and the Asset Representations Reviewer. Upon the written direction of Certificateholders evidencing at least 75% of a Certificateholder Quorum, the Trustee will terminate all of the rights and obligations of the Asset Representations Reviewer under the PSA by written notice to the Asset Representations Reviewer, and the proposed successor Asset Representations Reviewer will be appointed. See “Pooling and Servicing Agreement—The Asset Representations Reviewer” in the Preliminary Prospectus. |
|
| Dispute Resolution Provisions: |
Each Mortgage Loan Seller will be subject to the dispute resolution provisions set forth in the PSA to the extent those provisions are triggered with respect to any Mortgage Loan sold to the depositor by such Mortgage Loan Seller and such Mortgage Loan Seller will be obligated under the related mortgage loan purchase agreement to comply with all applicable provisions and to take part in any mediation or arbitration proceedings that may result.
Generally, in the event that a repurchase request as described in the Preliminary Prospectus is not “Resolved” within 180 days after the related Mortgage Loan Seller receives such Repurchase Request, then the enforcing servicer will be required to send a notice to the initial requesting Certificateholder (if any) indicating the enforcing servicer’s intended course of action with respect to the Repurchase Request. If (a) the enforcing servicer’s intended course of action with respect to the Repurchase Request does not involve pursuing further action to exercise rights against the related Mortgage Loan Seller with respect to the Repurchase Request and the initial requesting Certificateholder, if any, or any other Certificateholder or Certificate Owner wishes to exercise its right to refer the matter to mediation (including nonbinding arbitration) or arbitration, or (b) the enforcing servicer’s intended course of action is to pursue further action to exercise rights against the related Mortgage Loan Seller with respect to the Repurchase Request but the initial requesting Certificateholder, if any, or any other Certificateholder or Certificate Owner does not agree with the dispute resolution method selected by the enforcing servicer, then the initial requesting Certificateholder, if any, or such other Certificateholder or Certificate Owner may deliver a written notice to the enforcing servicer indicating its intent to exercise its right to refer the matter to either mediation or arbitration.
“Resolved” means, with respect to a Repurchase Request, (i) that the related material defect has been cured, (ii) the related Mortgage Loan has been repurchased in accordance with the related mortgage loan purchase agreement, (iii) a mortgage loan has been substituted for the related Mortgage Loan in accordance with the related mortgage loan purchase agreement, (iv) the applicable Mortgage Loan Seller made the loss of value payment, (v) a contractually binding |
THE INFORMATION IN THIS STRUCTURAL AND COLLATERAL TERM SHEET IS NOT COMPLETE AND MAY BE AMENDED PRIOR TO THE TIME OF SALE. THIS TERM SHEET IS NOT AN OFFER TO SELL THESE SECURITIES AND IT IS NOT A SOLICITATION OF AN OFFER TO BUY THESE SECURITIES IN ANY JURISDICTION WHERE THE OFFER OR SALE IS NOT PERMITTED.
10
|
COMM 2018-COR3 Mortgage Trust
|
| STRUCTURE OVERVIEW |
agreement is entered into between the enforcing servicer, on behalf of the issuing entity, and the related Mortgage Loan Seller that settles the related Mortgage Loan Seller’s obligations under the related mortgage loan purchase agreement, or (vi) the related Mortgage Loan is no longer property of the issuing entity as a result of a sale or other disposition in accordance with the PSA. See “Pooling and Servicing Agreement—Dispute Resolution Provisions” in the Preliminary Prospectus. |
THE INFORMATION IN THIS STRUCTURAL AND COLLATERAL TERM SHEET IS NOT COMPLETE AND MAY BE AMENDED PRIOR TO THE TIME OF SALE. THIS TERM SHEET IS NOT AN OFFER TO SELL THESE SECURITIES AND IT IS NOT A SOLICITATION OF AN OFFER TO BUY THESE SECURITIES IN ANY JURISDICTION WHERE THE OFFER OR SALE IS NOT PERMITTED.
11
|
COMM 2018-COR3 Mortgage Trust
|
| OVERVIEW OF MORTGAGE POOL CHARACTERISTICS |
| Distribution of Cut-off Date Balances(1) | |||||||||||
| Range of Cut-off Date Balances | Number of Mortgage Loans |
Aggregate Cut-off Date Balance |
%
of Initial Pool |
Weighted Averages | |||||||
| Mortgage Rate | Stated Remaining Term (Mos.)(2) |
U/W
NCF DSCR |
Cut-off
Date LTV Ratio(3) |
Maturity
Date LTV(2)(3) | |||||||
| $4,030,000 | - | $7,499,999 | 7 | $39,256,012 | 3.9% | 4.7194% | 118 | 1.74x | 64.3% | 58.1% | |
| $7,500,000 | - | $14,999,999 | 15 | $164,101,828 | 16.3% | 4.8355% | 117 | 2.17x | 58.1% | 53.5% | |
| $15,000,000 | - | $24,999,999 | 6 | $119,230,500 | 11.9% | 4.7192% | 116 | 1.62x | 65.8% | 63.3% | |
| $25,000,000 | - | $49,999,999 | 7 | $262,544,472 | 26.1% | 4.5119% | 116 | 1.78x | 59.7% | 57.3% | |
| $50,000,000 | - | $100,000,000 | 6 | $420,950,000 | 41.8% | 4.4617% | 118 | 2.32x | 51.4% | 51.4% | |
| Total/Weighted Average | 41 | $1,006,082,811 | 100.0% | 4.5764% | 117 | 2.05x | 56.9% | 55.0% | |||
| Distribution of Mortgage Rates(1) | |||||||||||
| Range of Mortgage Rates | Number of Mortgage Loans |
Aggregate Cut-off Date Balance |
%
of Initial Outstanding Pool Balance |
Weighted Averages | |||||||
| Mortgage Rate | Stated Remaining Term (Mos.)(2) |
U/W NCF DSCR |
Cut-off
Date LTV Ratio(3) |
Maturity
Date LTV(2)(3) | |||||||
| 3.4649% | - | 3.9999% | 1 | $64,450,000 | 6.4% | 3.4649% | 119 | 3.52x | 37.7% | 37.7% | |
| 4.0000% | - | 4.2499% | 3 | $171,744,472 | 17.1% | 4.1337% | 117 | 2.40x | 51.7% | 50.1% | |
| 4.2500% | - | 4.4999% | 5 | $98,900,000 | 9.8% | 4.3672% | 116 | 2.05x | 63.6% | 62.5% | |
| 4.5000% | - | 4.7499% | 14 | $292,356,068 | 29.1% | 4.6384% | 116 | 1.93x | 55.1% | 53.1% | |
| 4.7500% | - | 4.9999% | 10 | $230,308,122 | 22.9% | 4.8711% | 119 | 1.89x | 59.6% | 57.7% | |
| 5.0000% | - | 5.3680% | 8 | $148,324,150 | 14.7% | 5.1312% | 118 | 1.48x | 65.9% | 62.5% | |
| Total/Weighted Average | 41 | $1,006,082,811 | 100.0% | 4.5764% | 117 | 2.05x | 56.9% | 55.0% | |||
| Property Type Distribution(1) | ||||||||||||
| Property Type | Number of Mortgaged Properties |
Aggregate Cut-off Date Balance |
%
of Initial Outstanding Pool Balance |
Number
of Rooms/Units/NRA /Spaces |
Weighted Averages | |||||||
Cut-off
Date Rooms/Units/ NRA/Space |
Mortgage Rate |
Stated Term |
Occupancy | U/W
NCF DSCR |
Cut-off Date LTV Ratio(3) |
Maturity
Date LTV(2)(3) | ||||||
| Retail | 14 | $198,837,285 | 19.8% | 1,347,437 | $529 | 4.5436% | 115 | 95.7% | 1.67x | 61.4% | 56.6% | |
| Anchored(5) | 14 | $198,837,285 | 19.8% | 1,347,437 | $529 | 4.5436% | 115 | 95.7% | 1.67x | 61.4% | 56.6% | |
| Office | 8 | $197,909,912 | 19.7% | 690,491 | $443 | 4.2382% | 118 | 97.9% | 2.34x | 54.6% | 53.2% | |
| Suburban | 4 | $126,300,000 | 12.6% | 374,616 | $435 | 4.0178% | 118 | 99.3% | 2.79x | 50.8% | 49.4% | |
| CBD | 3 | $68,309,912 | 6.8% | 305,663 | $460 | 4.6306% | 118 | 95.1% | 1.52x | 61.5% | 60.2% | |
| Medical | 1 | $3,300,000 | 0.3% | 10,212 | $378 | 4.5540% | 112 | 100.0% | 2.16x | 55.4% | 55.4% | |
| Hospitality | 6 | $191,985,848 | 19.1% | 1,507 | $206,398 | 4.8629% | 116 | 85.3% | 2.44x | 50.9% | 50.2% | |
| Full Service | 5 | $179,500,000 | 17.8% | 1,405 | $212,240 | 4.8311% | 116 | 85.8% | 2.49x | 49.8% | 49.8% | |
| Limited Service | 1 | $12,485,848 | 1.2% | 102 | $122,410 | 5.3200% | 119 | 78.1% | 1.61x | 66.4% | 55.2% | |
| Mixed Use | 8 | $189,480,000 | 18.8% | 901,043 | $349 | 4.8496% | 118 | 97.2% | 1.67x | 63.6% | 63.0% | |
| Office/Retail/Parking | 1 | $65,500,000 | 6.5% | 130,218 | $503 | 5.0660% | 117 | 100.0% | 1.29x | 68.9% | 68.9% | |
| Retail/Multifamily | 1 | $40,000,000 | 4.0% | 379,376 | $258 | 4.8450% | 119 | 96.9% | 1.86x | 59.8% | 59.8% | |
| Office/Retail/Multifamily | 2 | $38,450,000 | 3.8% | 204,287 | $281 | 4.7727% | 117 | 93.7% | 1.70x | 65.4% | 62.8% | |
| Office/Retail | 2 | $28,500,000 | 2.8% | 100,558 | $284 | 4.5459% | 119 | 100.0% | 1.94x | 56.2% | 56.2% | |
| Medical Office/Retail | 1 | $13,000,000 | 1.3% | 47,381 | $274 | 4.7200% | 119 | 87.3% | 2.00x | 63.1% | 63.1% | |
| Industrial/Office | 1 | $4,030,000 | 0.4% | 39,223 | $103 | 4.6800% | 119 | 100.0% | 2.53x | 51.0% | 51.0% | |
| Industrial | 3 | $138,800,000 | 13.8% | 798,425 | $251 | 4.3164% | 118 | 97.9% | 2.45x | 57.4% | 54.6% | |
| Warehouse/Distribution | 1 | $100,000,000 | 9.9% | 315,644 | $317 | 4.1660% | 120 | 100.0% | 2.83x | 51.3% | 51.3% | |
| Flex | 1 | $34,000,000 | 3.4% | 411,631 | $83 | 4.7300% | 114 | 91.5% | 1.44x | 74.6% | 64.1% | |
| Warehouse/Flex | 1 | $4,800,000 | 0.5% | 71,150 | $67 | 4.5210% | 116 | 100.0% | 1.62x | 64.0% | 54.7% | |
| Multifamily | 2 | $67,394,766 | 6.7% | 199 | $344,500 | 4.6609% | 119 | 85.8% | 1.59x | 44.9% | 44.1% | |
| High-Rise | 1 | $63,000,000 | 6.3% | 178 | $353,933 | 4.6335% | 119 | 84.8% | 1.60x | 43.2% | 43.2% | |
| Mid-Rise | 1 | $4,394,766 | 0.4% | 21 | $209,275 | 5.0540% | 119 | 100.0% | 1.40x | 69.2% | 57.1% | |
| Other | 3 | $21,675,000 | 2.2% | 268 | $80,877 | 4.4382% | 113 | 100.0% | 1.65x | 63.6% | 63.6% | |
| Total/Weighted Average | 44 | $1,006,082,811 | 100.0% | 4.5764% | 117 | 94.2% | 2.05x | 56.9% | 55.0% | |||
| Geographic Distribution(1)(4) | |||||||||
| State/Location | Number
of Properties |
Aggregate Cut-off Date Balance |
%
of Initial Outstanding Pool Balance |
Weighted Averages | |||||
| Mortgage Rate | Stated Remaining Term (Mos.)(2) |
U/W NCF DSCR |
Cut-off
Date LTV Ratio(3) |
Maturity
Date LTV(2)(3) | |||||
| New York | 13 | $386,584,912 | 38.4% | 4.5246% | 118 | 1.86x | 56.8% | 56.4% | |
| New York City | 10 | $366,595,000 | 36.4% | 4.5126% | 118 | 1.86x | 56.4% | 56.4% | |
| New York State | 3 | $19,989,912 | 2.0% | 4.7451% | 115 | 1.78x | 64.7% | 55.8% | |
| California | 6 | $217,850,000 | 21.7% | 4.3693% | 118 | 2.38x | 53.8% | 53.8% | |
| Northern(6) | 3 | $123,950,000 | 12.3% | 3.9813% | 118 | 2.82x | 50.0% | 50.0% | |
| Southern(6) | 3 | $93,900,000 | 9.3% | 4.8814% | 118 | 1.80x | 58.8% | 58.8% | |
| Washington | 3 | $135,170,000 | 13.4% | 4.7891% | 115 | 2.19x | 53.4% | 53.4% | |
| Florida | 5 | $49,525,000 | 4.9% | 4.5288% | 116 | 3.23x | 48.4% | 45.5% | |
| Texas | 1 | $34,000,000 | 3.4% | 4.7300% | 114 | 1.44x | 74.6% | 64.1% | |
| Other | 16 | $182,952,899 | 18.2% | 4.7595% | 117 | 1.75x | 62.0% | 55.3% | |
| Total/Weighted Average | 44 | $1,006,082,811 | 100.0% | 4.5764% | 117 | 2.05x | 56.9% | 55.0% | |
THE INFORMATION IN THIS STRUCTURAL AND COLLATERAL TERM SHEET IS NOT COMPLETE AND MAY BE AMENDED PRIOR TO THE TIME OF SALE. THIS TERM SHEET IS NOT AN OFFER TO SELL THESE SECURITIES AND IT IS NOT A SOLICITATION OF AN OFFER TO BUY THESE SECURITIES IN ANY JURISDICTION WHERE THE OFFER OR SALE IS NOT PERMITTED.
12
|
COMM 2018-COR3 Mortgage Trust
|
| OVERVIEW OF MORTGAGE POOL CHARACTERISTICS |
| Distribution of Cut-off Date LTV Ratios(1)(3) | |||||||||||
| Range of Cut-off Date LTV Ratios | Number
of Mortgage Loans |
Aggregate Cut-off Date Balance |
%
of Initial Outstanding Pool Balance |
Weighted Averages | |||||||
| Mortgage Rate | Stated Remaining Term (Mos.)(2) |
U/W
NCF DSCR |
Cut-off
Date LTV Ratio(3) |
Maturity
Date LTV(2)(3) | |||||||
| 16.7% | - | 54.9% | 12 | $462,094,472 | 45.9% | 4.3979% | 118 | 2.55x | 47.4% | 46.8% | |
| 55.0% | - | 59.9% | 5 | $118,550,000 | 11.8% | 4.5627% | 116 | 1.77x | 58.4% | 57.9% | |
| 60.0% | - | 64.9% | 9 | $189,684,912 | 18.9% | 4.5847% | 117 | 1.74x | 62.8% | 62.0% | |
| 65.0% | - | 69.9% | 9 | $154,729,182 | 15.4% | 4.9505% | 117 | 1.50x | 68.5% | 65.0% | |
| 70.0% | - | 74.6% | 6 | $81,024,246 | 8.1% | 4.8798% | 116 | 1.40x | 72.6% | 61.4% | |
| Total/Weighted Average | 41 | $1,006,082,811 | 100.0% | 4.5764% | 117 | 2.05x | 56.9% | 55.0% | |||
| Distribution of Maturity Date or ARD LTV Ratios(1)(2)(3) | |||||||||||
| Range of Maturity Date or ARD LTV Ratios | Number
of Mortgage Loans |
Aggregate Cut-off Date Balance |
%
of Initial Outstanding Pool Balance |
Weighted Averages | |||||||
| Mortgage Rate | Stated Remaining Term (Mos.)(2) |
U/W
NCF DSCR |
Cut-off
Date LTV Ratio(3) |
Maturity
Date LTV(2)(3) | |||||||
| 16.7% | - | 49.9% | 5 | $177,194,472 | 17.6% | 4.1078% | 118 | 2.79x | 38.8% | 37.3% | |
| 50.0% | - | 54.9% | 10 | $310,689,912 | 30.9% | 4.5985% | 118 | 2.35x | 53.4% | 52.8% | |
| 55.0% | - | 59.9% | 10 | $159,410,928 | 15.8% | 4.6751% | 117 | 1.66x | 61.9% | 57.8% | |
| 60.0% | - | 68.9% | 16 | $358,787,500 | 35.7% | 4.7447% | 117 | 1.60x | 66.5% | 64.3% | |
| Total/Weighted Average | 41 | $1,006,082,811 | 100.0% | 4.5764% | 117 | 2.05x | 56.9% | 55.0% | |||
| Distribution of Underwritten NCF Debt Service Coverage Ratios(1) | |||||||||||
| Range of Underwritten NCF Debt Service Coverage Ratios | Number
of Mortgage Loans |
Aggregate Cut-off Date Balance |
%
of Initial Outstanding Pool Balance |
Weighted Averages | |||||||
| Mortgage Rate | Stated Remaining Term (Mos.)(2) |
U/W
NCF DSCR |
Cut-off
Date LTV Ratio(3) |
Maturity
Date LTV(2)(3) | |||||||
| 1.25x | - | 1.44x | 10 | $206,119,012 | 20.5% | 4.8767% | 117 | 1.36x | 68.4% | 63.5% | |
| 1.45x | - | 1.49x | 1 | $9,006,068 | 0.9% | 4.5500% | 112 | 1.45x | 68.2% | 55.8% | |
| 1.50x | - | 1.74x | 11 | $245,398,348 | 24.4% | 4.6540% | 117 | 1.62x | 57.7% | 56.6% | |
| 1.75x | - | 1.99x | 5 | $109,025,000 | 10.8% | 4.8406% | 118 | 1.88x | 60.1% | 58.6% | |
| 2.00x | - | 2.49x | 9 | $248,054,383 | 24.7% | 4.5854% | 116 | 2.18x | 54.9% | 53.5% | |
| 2.50x | - | 3.49x | 2 | $104,030,000 | 10.3% | 4.1859% | 120 | 2.82x | 51.3% | 51.3% | |
| 3.50x | - | 6.07x | 3 | $84,450,000 | 8.4% | 3.7339% | 119 | 3.94x | 33.4% | 33.4% | |
| Total/Weighted Average | 41 | $1,006,082,811 | 100.0% | 4.5764% | 117 | 2.05x | 56.9% | 55.0% | |||
| Original Terms to Maturity or ARD(1)(2) | |||||||||||
| Range
of Original Terms to Maturity or ARD |
Number
of Mortgage Loans |
Aggregate Cut-off Date Balance |
%
of Initial Outstanding Pool Balance |
Weighted Averages | |||||||
| Mortgage Rate | Stated Remaining Term (Mos.)(2) |
U/W
NCF DSCR |
Cut-off
Date LTV Ratio(3) |
Maturity
Date LTV(2)(3) | |||||||
| 120 | 38 | $815,082,811 | 81.0% | 4.5367% | 117 | 2.06x | 58.4% | 56.1% | |||
| 121 | 1 | $50,000,000 | 5.0% | 4.7400% | 109 | 2.12x | 54.9% | 54.9% | |||
| 129 | - | 131 | 2 | $141,000,000 | 14.0% | 4.7477% | 119 | 1.96x | 48.3% | 48.3% | |
| Total/Weighted Average | 41 | $1,006,082,811 | 100.0% | 4.5764% | 117 | 2.05x | 56.9% | 55.0% | |||
| Distribution of Remaining Terms to Maturity or ARD(1)(2) | |||||||||||
| Range
of Remaining Terms to Maturity or ARD |
Number
of Mortgage Loans |
Aggregate Cut-off Date Balance |
%
of Initial Outstanding Pool Balance |
Weighted Averages | |||||||
| Mortgage Rate | Stated Remaining Term (Mos.)(2) |
U/W
NCF DSCR |
Cut-off
Date LTV Ratio(3) |
Maturity
Date LTV(2)(3) | |||||||
| 109 | - | 114 | 8 | $204,375,540 | 20.3% | 4.4590% | 112 | 1.79x | 59.4% | 55.4% | |
| 115 | - | 120 | 33 | $801,707,272 | 79.7% | 4.6063% | 118 | 2.12x | 56.2% | 54.8% | |
| Total/Weighted Average | 41 | $1,006,082,811 | 100.0% | 4.5764% | 117 | 2.05x | 56.9% | 55.0% | |||
THE INFORMATION IN THIS STRUCTURAL AND COLLATERAL TERM SHEET IS NOT COMPLETE AND MAY BE AMENDED PRIOR TO THE TIME OF SALE. THIS TERM SHEET IS NOT AN OFFER TO SELL THESE SECURITIES AND IT IS NOT A SOLICITATION OF AN OFFER TO BUY THESE SECURITIES IN ANY JURISDICTION WHERE THE OFFER OR SALE IS NOT PERMITTED.
13
|
COMM 2018-COR3 Mortgage Trust
|
| OVERVIEW OF MORTGAGE POOL CHARACTERISTICS |
| Distribution of Underwritten NOI Debt Yields(1) | |||||||||||
| Range of Underwritten NOI Debt Yields | Number
of Mortgage Loans |
Aggregate Cut-off Date Balance |
%
of Initial Outstanding Pool Balance |
Weighted Averages | |||||||
| Mortgage Rate | Stated Remaining Term (Mos.)(2) |
U/W
NCF DSCR |
Cut-off
Date LTV Ratio(3) |
Maturity
Date LTV(2)(3) | |||||||
| 6.8% | - | 8.9% | 10 | $324,867,500 | 32.3% | 4.6607% | 117 | 1.52x | 59.6% | 59.6% | |
| 9.0% | - | 9.9% | 12 | $165,527,080 | 16.5% | 4.7808% | 117 | 1.68x | 65.5% | 60.3% | |
| 10.0% | - | 12.4% | 12 | $358,473,848 | 35.6% | 4.3858% | 117 | 2.48x | 53.8% | 52.1% | |
| 12.5% | - | 14.9% | 5 | $137,214,383 | 13.6% | 4.6241% | 117 | 2.15x | 53.4% | 50.1% | |
| 15.0% | - | 34.9% | 2 | $20,000,000 | 2.0% | 4.6010% | 118 | 5.29x | 19.7% | 19.7% | |
| Total/Weighted Average | 41 | $1,006,082,811 | 100.0% | 4.5764% | 117 | 2.05x | 56.9% | 55.0% | |||
| Amortization Types(1) | |||||||||
| Amortization Type | Number
of Mortgage Loans |
Aggregate Cut-off Date Balance |
%
of Initial Outstanding Pool Balance |
Weighted Averages | |||||
| Mortgage Rate | Stated Remaining Term (Mos.)(2) |
U/W
NCF DSCR |
Cut-off
Date LTV Ratio(3) |
Maturity
Date LTV(2)(3) | |||||
| Interest Only | 24 | $743,637,500 | 73.9% | 4.6227% | 117 | 2.04x | 56.2% | 56.2% | |
| Interest Only, then Amortizing | 8 | $106,400,000 | 10.6% | 4.8463% | 115 | 1.55x | 69.7% | 61.3% | |
| Amortizing Balloon | 8 | $91,595,311 | 9.1% | 4.6687% | 117 | 1.71x | 60.6% | 49.6% | |
| Interest Only, ARD | 1 | $64,450,000 | 6.4% | 3.4649% | 119 | 3.52x | 37.7% | 37.7% | |
| Total/Weighted Average | 41 | $1,006,082,811 | 100.0% | 4.5764% | 117 | 2.05x | 56.9% | 55.0% | |
Footnotes:
| (1) | The U/W NCF DSCR, Cut-off Date LTV Ratio, Maturity Date or ARD LTV, Underwritten NOI Debt Yield and Cut-off Date Balance per Room/Unit/NRA/Space calculations include any related pari passu companion loan(s) and exclude any related subordinate companion loan(s) and/or mezzanine loan(s). |
| (2) | With respect to the ARD Loan, the Original Term to Maturity or ARD, Remaining Term to Maturity or ARD, LTV Ratio at Maturity or ARD, Stated Remaining Term (Mos.) and Maturity Date or ARD LTV are calculated through the related anticipated repayment date. |
| (3) | With respect to the four Mortgage Loans, in aggregate, representing approximately 12.3% of the Initial Outstanding Pool Balance (including 1001 North Shoreline Boulevard, Shoreline Center, Fairfield Inn Charleston Airport and Maple Ridge Plaza), the Cut-off Date LTV and Maturity Date or ARD LTV has been calculated based on other than “As Is” appraised values. For additional information please see the footnotes to Annex A-1 in the Preliminary Prospectus. |
| (4) | Reflects allocated loan amount for properties securing multi-property Mortgage Loans. |
| (5) | Anchored retail also includes single tenant, super regional mall and shadow anchored retail properties. |
| (6) | Northern California properties have a zip code greater than 93600. Southern California properties have a zip code less than or equal to 93600. |
THE INFORMATION IN THIS STRUCTURAL AND COLLATERAL TERM SHEET IS NOT COMPLETE AND MAY BE AMENDED PRIOR TO THE TIME OF SALE. THIS TERM SHEET IS NOT AN OFFER TO SELL THESE SECURITIES AND IT IS NOT A SOLICITATION OF AN OFFER TO BUY THESE SECURITIES IN ANY JURISDICTION WHERE THE OFFER OR SALE IS NOT PERMITTED.
14
|
COMM 2018-COR3 Mortgage Trust
|
| OVERVIEW OF MORTGAGE POOL CHARACTERISTICS |
| Ten Largest Mortgage Loans | |||||||||
| Mortgage Loan | Mortgage Loan Seller |
City, State | Property Type | Cut-off
Date Balance |
% of Initial Outstanding Pool Balance |
Cut-off
Date Balance per Room/NRA/Unit(1) |
Cut-off
Date Ratio(1)(2) |
U/W NCF DSCR after IO(1) |
U/W NOI Debt Yield(1) |
| 930 Flushing | LCM/GACC | Brooklyn, NY | Industrial | $100,000,000 | 9.9% | $317 | 51.3% | 2.83x | 12.3% |
| Hyatt @ Olive 8 | LCM | Seattle, WA | Hospitality | $78,000,000 | 7.8% | $225,434 | 52.5% | 2.25x | 13.3% |
| Kingswood Center | LCM | Brooklyn, NY | Mixed Use | $65,500,000 | 6.5% | $503 | 68.9% | 1.29x | 6.9% |
| 1001 North Shoreline Boulevard | GACC | Mountain View, CA | Office | $64,450,000 | 6.4% | $522 | 37.7% | 3.52x | 12.4% |
| Beekman Tower | LCM | New York, NY | Multifamily | $63,000,000 | 6.3% | $353,933 | 43.2% | 1.60x | 7.6% |
| Grand Hyatt Seattle | LCM | Seattle, WA | Hospitality | $50,000,000 | 5.0% | $291,028 | 54.9% | 2.12x | 11.8% |
| 315 West 36th Street | GACC | New York, NY | Office | $47,000,000 | 4.7% | $537 | 60.6% | 1.39x | 6.8% |
| 240 East 54th Street | LCM/GACC | New York, NY | Retail | $42,000,000 | 4.2% | $1,402 | 57.5% | 1.63x | 6.8% |
| Atlantic Times Square | JPMCB | Monterey Park, CA | Mixed Use | $40,000,000 | 4.0% | $258 | 59.8% | 1.86x | 9.5% |
| Shoreline Center | LCM | Redwood City, CA | Office | $38,300,000 | 3.8% | $470 | 63.8% | 2.32x | 10.6% |
| Total/Weighted Average | $588,250,000 | 58.5% | 53.9% | 2.17x | 10.2% | ||||
| (1) | The Cut-off Date Balance per Room/NRA/Unit, Cut-off Date LTV Ratio, U/W NCF DSCR after IO and U/W NOI Debt Yield calculations include any related pari passu companion loan(s) and exclude any related subordinate companion loan(s) and/or mezzanine loan(s). |
| (2) | With respect to 1001 North Shoreline Boulevard and Shoreline Center, the Cut-off Date LTV Ratio has been calculated based on the appraised values other than “As Is” respectively. For additional information please see the footnotes to Annex A-1 in the Preliminary Prospectus. |
| Existing Mezzanine Debt Summary | ||||||||
| Mortgage Loan |
Mortgage Loan Cut-off Date Balance |
Mezzanine
Debt Cut-off Date Balance |
Trust U/W NCF DSCR |
Total
Debt U/W NCF DSCR |
Trust
Cut-off Date LTV Ratio |
Total
Debt Cut-off Date LTV Ratio |
Trust U/W NOI Debt Yield |
Total
Debt U/W NOI Debt Yield |
| NYC Parking Portfolio | $21,675,000 | $1,825,000 | 1.65x | 1.44x | 63.6% | 68.9% | 7.5% | 6.9% |
| Subordinate Debt Summary | ||||||||
| Mortgage Loan | Mortgage Loan Cut-off Date Balance |
Subordinate
Debt Cut-off Date Balance |
Trust U/W NCF DSCR |
Total
Debt U/W NCF DSCR(1) |
Trust
Cut-off Date LTV Ratio |
Total
Debt Cut-off Date LTV Ratio(1) |
Trust U/W NOI Debt Yield |
Total
Debt U/W NOI Debt Yield(1) |
| 1001 North Shoreline Boulevard | $64,450,000 | $46,050,000 | 3.52x | 1.65x | 37.7% | 64.6% | 12.4% | 7.2% |
(1) |
Total Debt U/W NCF DSCR, Total Debt Cut-off Date LTV Ratio and Total Debt U/W NOI Debt Yield calculations include any related subordinate companion loan(s). |
THE INFORMATION IN THIS STRUCTURAL AND COLLATERAL TERM SHEET IS NOT COMPLETE AND MAY BE AMENDED PRIOR TO THE TIME OF SALE. THIS TERM SHEET IS NOT AN OFFER TO SELL THESE SECURITIES AND IT IS NOT A SOLICITATION OF AN OFFER TO BUY THESE SECURITIES IN ANY JURISDICTION WHERE THE OFFER OR SALE IS NOT PERMITTED.
15
|
COMM 2018-COR3 Mortgage Trust
|
| OVERVIEW OF MORTGAGE POOL CHARACTERISTICS |
| Companion Loan Summary | ||||||||
| Loan No. | Mortgage Loan | Note(s) | Original Balance ($) |
Cut-off Date Balance ($) | Holder of Note | Lead Servicer for Whole Loan (Y/N) | Master Servicer Under Lead Securitization | Special Servicer Under Lead Securitization |
| 4 | 1001 North Shoreline Boulevard(1) | A | $64,450,000 | $64,450,000 | COMM 2018-COR3 | No | Midland Loan Services | Midland Loan Services |
| B | $46,050,000 | $46,050,000 | DBNY | Yes | ||||
| Total | $110,500,000 | $110,500,000 | ||||||
| 6 | Grand Hyatt Seattle | A-1 | $50,000,000 | $50,000,000 | COMM 2017-COR2 | Yes | Midland Loan Services | Midland Loan Services |
| A-2 | $50,000,000 | $50,000,000 | COMM 2018-COR3 | No | ||||
| A-3 | $33,000,000 | $33,000,000 | LCM | No | ||||
| Total | $133,000,000 | $133,000,000 | ||||||
| 7 | 315 West 36th Street | A-1, A-3 | $47,000,000 | $47,000,000 | COMM 2018-COR3 | Yes | Midland Loan Services | Midland Loan Services |
| A-2 | $30,000,000 | $30,000,000 | Benchmark 2018-B3 | No | ||||
| Total | $77,000,000 | $77,000,000 | ||||||
| 9 | Atlantic Times Square(2) | A-1 | $40,000,000 | $40,000,000 | JPMCB | Yes | Midland Loan Services | Midland Loan Services |
| A-2 | $40,000,000 | $40,000,000 | COMM 2018-COR3 | No | ||||
| A-3 | $18,000,000 | $18,000,000 | JPMCB | No | ||||
| Total | $98,000,000 | $98,000,000 | ||||||
| 13 | Lehigh Valley Mall | A-1-A | $42,000,000 | $41,642,260 | Benchmark 2018-B1 | Yes | Wells Fargo Bank, National Association | Midland Loan Services |
| A-1-B | $50,000,000 | $49,574,119 | CSAIL 2017-CX10 | No | ||||
| A-2-A | $35,500,000 | $35,197,625 | Benchmark 2018-B2 | No | ||||
| A-2-B | $27,500,000 | $27,265,766 | CSAIL 2018-CX11 | No | ||||
| A-1-C, A-2-C-2 | $30,000,000 | $29,744,472 | COMM 2018-COR3 | No | ||||
| A-2-C-1 | $15,000,000 | $14,872,236 | DBNY | No | ||||
| Total | $200,000,000 | $198,296,477 | ||||||
| (1) | The related whole loan will be serviced pursuant to the COMM 2018-COR3 pooling and servicing agreement. However, so long as no “control appraisal period” (or similar term) has occurred and is continuing, the holder of Note B will be the controlling noteholder and will have the right to approve certain modifications and consent to certain actions taken with respect to the related whole loan. If a control appraisal period has occurred and is continuing, the holder of Note A will be the controlling noteholder, which rights may be exercised by the controlling class certificateholder (or its representative or any party assigned to exercise the rights of the controlling noteholder under the COMM 2018-COR3 pooling and servicing agreement). |
| (2) | Prior to the applicable servicing shift securitization date, the related whole loans will be serviced under the pooling and servicing agreement for this transaction. From and after the related servicing shift securitization date, the related servicing shift whole loan will be serviced under the related servicing shift pooling and servicing agreement. |
THE INFORMATION IN THIS STRUCTURAL AND COLLATERAL TERM SHEET IS NOT COMPLETE AND MAY BE AMENDED PRIOR TO THE TIME OF SALE. THIS TERM SHEET IS NOT AN OFFER TO SELL THESE SECURITIES AND IT IS NOT A SOLICITATION OF AN OFFER TO BUY THESE SECURITIES IN ANY JURISDICTION WHERE THE OFFER OR SALE IS NOT PERMITTED.
16
(THIS PAGE INTENTIONALLY LEFT BLANK)
17
930 Flushing Avenue Brooklyn, NY 11206 |
Collateral Asset Summary – Loan No. 1 930 Flushing |
Cut-off Date Balance: Cut-off Date LTV: U/W NCF DSCR: U/W NOI Debt Yield: |
$100,000,000 51.3% 2.83x 12.3% |

THE INFORMATION IN THIS STRUCTURAL AND COLLATERAL TERM SHEET IS NOT COMPLETE AND MAY BE AMENDED PRIOR TO THE TIME OF SALE. THIS TERM SHEET IS NOT AN OFFER TO SELL THESE SECURITIES AND IT IS NOT A SOLICITATION OF AN OFFER TO BUY THESE SECURITIES IN ANY JURISDICTION WHERE THE OFFER OR SALE IS NOT PERMITTED.
18
930 Flushing Avenue Brooklyn, NY 11206 |
Collateral Asset Summary – Loan No. 1 930 Flushing |
Cut-off Date Balance: Cut-off Date LTV: U/W NCF DSCR: U/W NOI Debt Yield: |
$100,000,000 51.3% 2.83x 12.3% |

THE INFORMATION IN THIS STRUCTURAL AND COLLATERAL TERM SHEET IS NOT COMPLETE AND MAY BE AMENDED PRIOR TO THE TIME OF SALE. THIS TERM SHEET IS NOT AN OFFER TO SELL THESE SECURITIES AND IT IS NOT A SOLICITATION OF AN OFFER TO BUY THESE SECURITIES IN ANY JURISDICTION WHERE THE OFFER OR SALE IS NOT PERMITTED.
19
930 Flushing Avenue Brooklyn, NY 11206 |
Collateral Asset Summary – Loan No. 1 930 Flushing |
Cut-off Date Balance: Cut-off Date LTV: U/W NCF DSCR: U/W NOI Debt Yield: |
$100,000,000 51.3% 2.83x 12.3% |
| Mortgage Loan Information | |
| Loan Seller: | LCM/GACC |
| Loan Purpose: | Refinance |
| Borrowers Sponsors: | Robert Wolf; Joseph Tabak |
| Borrowers: | 930 Flushing Holdings W LLC; JTB 930 III LLC; JTB 930 IV LLC |
| Original Balance: | $100,000,000 |
| Cut-off Date Balance: | $100,000,000 |
| % by Initial UPB: | 9.9% |
| Interest Rate: | 4.1660% |
| Payment Date: | 6th of each month |
| First Payment Date: | June 6, 2018 |
| Maturity Date: | May 6, 2028 |
| Amortization: | Interest Only |
| Additional Debt: | None |
| Call Protection: | L(24), D(92), O(4) |
| Lockbox / Cash Management: | Hard / In Place |
| Reserves(1) | ||
| Initial | Monthly | |
| Taxes: | $246,950 | $42,955 |
| Insurance: | $20,100 | $19,145 |
| Regular Replacement: | $45,612 | $2,996 |
| Supplemental Replacement: | $300,917 | $22,917 |
| Required Repairs: | $28,125 | NAP |
| Leasing Commissions: | $84,166 | NAP |
| Free Rent: | $391,492 | NAP |
| NYCEM Construction: | $3,250,000 | NAP |
| Special Rollover: | $0 | Springing |
| Financial Information | |
| Cut-off Date Balance / Sq. Ft.: | $317 |
| Balloon Balance / Sq. Ft.: | $317 |
| Cut-off Date LTV: | 51.3% |
| Balloon LTV: | 51.3% |
| Underwritten NOI DSCR: | 2.92x |
| Underwritten NCF DSCR: | 2.83x |
| Underwritten NOI Debt Yield: | 12.3% |
| Underwritten NCF Debt Yield: | 12.0% |
| Underwritten NOI Debt Yield at Balloon: | 12.3% |
| Underwritten NCF Debt Yield at Balloon: | 12.0% |
| Property Information | ||
| Single Asset / Portfolio: | Single Asset | |
| Property Type: | Warehouse/Distribution Industrial | |
| Collateral: | Fee Simple | |
| Location: | Brooklyn, NY | |
| Year Built / Renovated: | 1988 / 2009 | |
| Total Sq. Ft.: | 315,644 | |
| Property Management: | Flushing Management LLC | |
| Underwritten NOI: | $12,333,066 | |
| Underwritten NCF: | $11,973,231 | |
| Appraised Value(2): | $195,000,000 | |
| Appraisal Date: | March 28, 2018 | |
| Historical NOI(3) | ||
| Most Recent NOI: | NAP | |
| 2016 NOI: | NAP | |
| 2015 NOI: | NAP | |
| 2014 NOI: | NAP | |
| Historical Occupancy(3) | ||
| Most Recent Occupancy: | 100.0% (May 6, 2018) | |
| 2016 Occupancy: | NAP | |
| 2015 Occupancy: | NAP | |
| 2014 Occupancy: | NAP | |
| (1) | See “Initial Reserves” and “Ongoing Reserves” herein. |
| (2) | The appraiser concluded to a dark value of $147,000,000 for the 930 Flushing Property which results in a “Go Dark” Cut-off Date LTV and Balloon LTV of 68.0%. The appraised value includes the value of a release parcel. For additional information, see “Partial Release” herein. |
| (3) | The 930 Flushing Property was fully leased in January 2018 on a triple net basis by New York City Emergency Management (“NYCEM”) on a lease expiring in 2036. Prior to January 2018, NYCEM leased 112,600 sq. ft. at the 930 Flushing Property since October 2006. In June 2016, NYCEM executed a license agreement for the remaining 203,044 sq. ft. at the 930 Flushing Property, pending Uniform Land Use Review Procedure (“ULURP”) approval. ULURP was formally approved in November 2017. As such, historical occupancy and financials are not applicable. For additional information, see “The Property” herein. |
THE INFORMATION IN THIS STRUCTURAL AND COLLATERAL TERM SHEET IS NOT COMPLETE AND MAY BE AMENDED PRIOR TO THE TIME OF SALE. THIS TERM SHEET IS NOT AN OFFER TO SELL THESE SECURITIES AND IT IS NOT A SOLICITATION OF AN OFFER TO BUY THESE SECURITIES IN ANY JURISDICTION WHERE THE OFFER OR SALE IS NOT PERMITTED.
20
930 Flushing Avenue Brooklyn, NY 11206 |
Collateral Asset Summary – Loan No. 1 930 Flushing |
Cut-off Date Balance: Cut-off Date LTV: U/W NCF DSCR: U/W NOI Debt Yield: |
$100,000,000 51.3% 2.83x 12.3% |
| Tenant Summary | ||||||||||
Tenant |
Ratings (Fitch/Moody’s/S&P) |
Net Rentable Area (Sq. Ft.) |
%
of Net Rentable Area |
|
U/W Base Rent PSF(1) |
% of Total U/W Base Rent |
Lease Expiration | |||
| New York City Emergency Management(2)(3) | AA/Aa2/AA | 315,644 | 100.0% | $41.37 | 100.0% | 10/31/2036 | ||||
| Total Occupied Collateral | 315,644 | 100.0% | $41.37 | 100.0% | ||||||
| Vacant | 0 | 0% | ||||||||
| Total | 315,644 | 100.0% | ||||||||
| (1) | U/W Base Rent PSF is inclusive of the straight-line average contractual base rent over the loan term for NYCEM equal to approximately $1,439,197. |
| (2) | NYCEM has one, five-year or 10-year renewal option remaining. |
| (3) | NYCEM has a one-time termination option on July 17, 2028 with 36 months’ notice. |
| Lease Rollover Schedule(1) | ||||||||
| Year | # of Leases Expiring |
Total Expiring Sq. Ft. |
% of Total Sq. Ft. Expiring |
Cumulative Sq. Ft. Expiring |
Cumulative % of Sq. Ft. Expiring |
Annual U/W Base Rent PSF(2) |
% U/W Base Rent Rolling |
Cumulative % of U/W Base Rent |
| MTM | 0 | 0 | 0.0% | 0 | 0.0% | $0.00 | 0.0% | 0.0% |
| 2018 | 0 | 0 | 0.0% | 0 | 0.0% | $0.00 | 0.0% | 0.0% |
| 2019 | 0 | 0 | 0.0% | 0 | 0.0% | $0.00 | 0.0% | 0.0% |
| 2020 | 0 | 0 | 0.0% | 0 | 0.0% | $0.00 | 0.0% | 0.0% |
| 2021 | 0 | 0 | 0.0% | 0 | 0.0% | $0.00 | 0.0% | 0.0% |
| 2022 | 0 | 0 | 0.0% | 0 | 0.0% | $0.00 | 0.0% | 0.0% |
| 2023 | 0 | 0 | 0.0% | 0 | 0.0% | $0.00 | 0.0% | 0.0% |
| 2024 | 0 | 0 | 0.0% | 0 | 0.0% | $0.00 | 0.0% | 0.0% |
| 2025 | 0 | 0 | 0.0% | 0 | 0.0% | $0.00 | 0.0% | 0.0% |
| 2026 | 0 | 0 | 0.0% | 0 | 0.0% | $0.00 | 0.0% | 0.0% |
| 2027 | 0 | 0 | 0.0% | 0 | 0.0% | $0.00 | 0.0% | 0.0% |
| 2028 | 0 | 0 | 0.0% | 0 | 0.0% | $0.00 | 0.0% | 0.0% |
| Thereafter | 1 | 315,644 | 100.0% | 315,644 | 100.0% | $41.37 | 100.0% | 100.0% |
| Vacant | NAP | 0 | 0.0% | 315,644 | 100.0% | NAP | NAP | |
| Total / Wtd. Avg. | 1 | 315,644 | 100.0% | $41.37 | 100.0% | |||
| (1) | The sole tenant has a lease termination option that may become exercisable prior to the originally stated expiration date of the tenant’s lease that is not considered in the lease rollover schedule. |
| (2) | Annual U/W Base Rent PSF is inclusive of the straight-line average contractual base rent over the loan term for NYCEM equal to approximately $1,439,197. |
The Loan. The 930 Flushing loan (the “930 Flushing Loan”) is a $100.0 million fixed rate loan secured by the borrowers’ fee simple interest in a warehouse/distribution industrial facility totaling 315,644 sq. ft. located at 930 Flushing Avenue in Brooklyn, New York (the “930 Flushing Property”). The 930 Flushing Loan has a 10-year term and requires interest only payments for the term of the loan. The 930 Flushing Loan accrues interest at a fixed rate equal to 4.1660% and has a Cut-off Date Balance of approximately $100.0 million. Proceeds of the 930 Flushing Loan were used to retire existing debt of approximately $83.4 million, fund upfront reserves of approximately $4.4 million, pay closing costs of approximately $1.4 million and return approximately $10.9 million of equity to the borrowers sponsors. Based on the appraised value of $195.0 million as of March 28, 2018, the Cut-off Date LTV is 51.3%. The most recent prior financing of the 930 Flushing Property was not included in a securitization. The 930 Flushing Loan was originated by LCM, and is evidenced by two promissory notes, each in the amount of $50.0 million, one of which is being purchased by DBNY, and will be contributed to the COMM 2018-COR3 mortgage trust by GACC, and the other of which will be contributed to the COMM 2018-COR3 mortgage trust by LCM.
| Sources and Uses | ||||||
| Sources | Proceeds | % of Total | Uses | Proceeds | % of Total | |
| Mortgage Loan | $100,000,000 | 100.0% | Loan Payoff | $83,373,404 | 83.4% | |
| Return of Equity | $10,886,074 | 10.9% | ||||
| Upfront Reserves | $4,367,362 | 4.4% | ||||
| Closing Costs | $1,373,161 | 1.4% | ||||
| Total Sources | $100,000,000 | 100.0% | Total Uses | $100,000,000 | 100.0% | |
THE INFORMATION IN THIS STRUCTURAL AND COLLATERAL TERM SHEET IS NOT COMPLETE AND MAY BE AMENDED PRIOR TO THE TIME OF SALE. THIS TERM SHEET IS NOT AN OFFER TO SELL THESE SECURITIES AND IT IS NOT A SOLICITATION OF AN OFFER TO BUY THESE SECURITIES IN ANY JURISDICTION WHERE THE OFFER OR SALE IS NOT PERMITTED.
21
930 Flushing Avenue Brooklyn, NY 11206 |
Collateral Asset Summary – Loan No. 1 930 Flushing |
Cut-off Date Balance: Cut-off Date LTV: U/W NCF DSCR: U/W NOI Debt Yield: |
$100,000,000 51.3% 2.83x 12.3% |
The Borrowers / Borrowers Sponsors. The borrowers, 930 Flushing Holdings W LLC, JTB 930 III LLC and JTB 930 IV LLC, are structured as tenants-in-common and are each a single purpose New York limited liability company structured to be bankruptcy-remote, with two independent directors in its organizational structure. The sponsors of the borrowers and the non-recourse carve-out guarantors are Robert Wolf and Joseph Tabak, on a joint and several basis. Robert Wolf controls 930 Flushing Holdings W LLC and Joseph Tabak controls JTB 930 III LLC and JTB 930 IV LLC.
Robert Wolf is the founder of Read Property Group (“RPG”), a Brooklyn-based real estate developer that was founded in 1993. RPG has been an active real estate developer and owner in Brooklyn for over two decades. Notable investments and developments in Brooklyn include 1209 Dekalb and the Rheingold Brewery site, which includes the 930 Flushing Property.
Joseph Tabak is the founder of Princeton Holdings LLC (“Princeton”), a New York City-based real estate investment firm with a focus on investing in New York City and other major United States markets. Founded in 1991, Princeton acquires and redevelops properties outright for its own account and in partnership with third party investors. During Mr. Tabak’s 30-year career in the real estate industry, he has worked on transactions across many commercial real estate asset classes.
The Property. The 930 Flushing Property is a 315,644 sq. ft., warehouse/distribution industrial facility situated on a 5.1-acre parcel located in the Bushwick neighborhood of Brooklyn, New York. Built in 1988 and renovated in 2009, the 930 Flushing Property is comprised of a single, two-story building that is set within the natural topography such that the first floor is at grade level along Flushing Avenue and the second floor is at grade level along Noll Street. The 930 Flushing Property offers large, contiguous blocks of open warehouse space with 25-foot ceilings that can accommodate various industrial uses. Additionally, the 930 Flushing Property features a mezzanine office level located in between the first and second floors. The 930 Flushing Property is a distinct industrial warehouse facility based on its size, utility, ceiling heights, drive in capability from all four sides of the building and contiguous industrial space spanning an entire city block bound by Flushing Avenue, Noll Street, Evergreen Avenue and Stanwix Street.
As of May 6, 2018, the 930 Flushing Property was 100.0% leased on a triple net basis to NYCEM, a city agency that coordinates and executes crisis management services for the City of New York, on a lease, which commenced in January 2018 and expires in 2036. Prior to January 2018, NYCEM leased 112,600 sq. ft. (the “Original Premises”) at the 930 Flushing Property since October 2006. In June 2016, NYCEM signed a 21-year extension on the Original Premises through October 2036 and executed a license agreement for the remaining 203,044 sq. ft. (the “Expansion Premises”) at the 930 Flushing Property giving NYCEM control over 100.0% of the 930 Flushing Property, pending ULURP approval. Prior to the NYCEM license agreement being executed, the Expansion Premises was fully occupied by three tenants on leases that were allowed to expire or were terminated by the borrower to accommodate the NYCEM license agreement. Following entering into the license agreement, NYCEM took possession of the space with the intention of collapsing the Original Premises and Expansion Premises into a single long-term lease upon ULURP approval. ULURP was formally approved in November 2017 and following ULURP approval, the single long-term lease (the “NYCEM Lease”) commenced on January 17, 2018. The NYCEM Lease has a one-time option to terminate on July 17, 2028 with 36 months’ notice and also contains one, five-year or ten-year extension option.
Under the NYCEM Lease, NYCEM has the right to make substantial tenant improvements to the 930 Flushing Property, for up to $79.9 million (the “NYCEM Improvement Work”), of which the borrowers are responsible for the first $3.25 million. Proposed civil and exterior modifications work is expected to take nine months, and the interior command center and warehouse work are expected to take 24 months each. If NYCEM elects to perform the NYCEM Improvement Work, NYCEM’s one-time option to terminate the lease on July 17, 2028 would be reset to the 10.5 year anniversary of the completion of the NYCEM Improvement Work. Additionally, if NYCEM does not elect to perform the NYCEM Improvement Work by November 1, 2021, NYCEM may elect to apply the $3.25 million borrowers’ obligation to the NYCEM Improvement Work as a rent credit.
Environmental Matters. The Phase I environmental report, dated March 30, 2018, recommended no further action at the 930 Flushing Property.
Major Tenant.
New York City Emergency Management (315,644 sq. ft.; 100.0% of NRA; 100.0% of U/W Base Rent; AA/A2/AA by Fitch/Moody’s/S&P) Established in 1996, NYCEM is a coordinating agency for the City of New York. In 2001, voters elected to elevate the agency to departmental level status and it is now an independent agency headed by a Commissioner who reports directly to the Mayor. The agency is responsible for oversight and development of the City’s emergency management plans. NYCEM plans and prepares for emergencies by conducting drills and exercises, educating the public about preparedness, coordinating emergency response and recovery, and collecting and disseminating pertinent emergency information. NYCEM also oversees the City’s Emergency Operations Center where city, state and federal agencies join representatives from the private and nonprofit sectors to coordinate responses to emergencies and disasters.
THE INFORMATION IN THIS STRUCTURAL AND COLLATERAL TERM SHEET IS NOT COMPLETE AND MAY BE AMENDED PRIOR TO THE TIME OF SALE. THIS TERM SHEET IS NOT AN OFFER TO SELL THESE SECURITIES AND IT IS NOT A SOLICITATION OF AN OFFER TO BUY THESE SECURITIES IN ANY JURISDICTION WHERE THE OFFER OR SALE IS NOT PERMITTED.
22
930 Flushing Avenue Brooklyn, NY 11206 |
Collateral Asset Summary – Loan No. 1 930 Flushing |
Cut-off Date Balance: Cut-off Date LTV: U/W NCF DSCR: U/W NOI Debt Yield: |
$100,000,000 51.3% 2.83x 12.3% |
The Market. The 930 Flushing Property is located in the overall Brooklyn industrial market. As of Q4 2017, the Brooklyn industrial market contained approximately 91.5 million sq. ft. with an overall vacancy rate of 4.2%. Within the Brooklyn industrial market, the 930 Flushing Property is located within the North Brooklyn industrial submarket. As of Q4 2017, the North Brooklyn industrial submarket contained approximately 59.6 million sq. ft. with an overall vacancy rate of 3.2%. Since 2005, peak vacancy within the North Brooklyn industrial submarket was reported at 3.9% in 2009, and since 2010, vacancy in the submarket has averaged 2.8%.
The table below summarizes the comparable leases as determined by the appraisal.
| Rent Comparables(1) | |||||||||
| Address | City, State | Total
Building Size (NRA) |
Tenant Name | Year Built |
Lease Date | Size (NRA) |
Term (Years) |
Initial Rent PSF |
Lease Type |
| 930 Flushing Avenue | Brooklyn, NY | 315,644 | NYCEM | 1988 | Jan-18 | 315,644 | 21.0 | $41.37(2) | NNN |
| 14 53rd Street | Brooklyn, NY | 455,225 | Urban Soccer | 1918 | Dec-17 | 20,250 | 16.0 | $24.53 | NNN |
| 14 53rd Street | Brooklyn, NY | 455,225 | Petra | 1918 | Nov-17 | 4,202 | 10.0 | $28.00 | NNN |
| 850 Third Avenue | Brooklyn, NY | 814,905 | Kleinberg Electric | 1920 | June-17 | 9,926 | 10.0 | $25.00 | NNN |
| 850 Third Avenue | Brooklyn, NY | 814,905 | Amazon | 1920 | August-16 | 50,000 | 15.0 | $25.00 | FSG |
| Confidential | Brooklyn, NY | NAV | Confidential | NAV | July-15 | 18,000 | 10.0 | $37.00 | FSG |
| 830 Fountain Avenue | Brooklyn, NY | 278,721 | FedEx Ground | 2015 | June-15 | 278,721 | 15.0 | $37.10 | NNN |
| 145-68 228th Street | Queens, NY | 110,000 | Walmart | 1924 | June-15 | 42,438 | 15.0 | $20.00 | NNN |
| 54-35 46th Street | Queens, NY | 45,000 | All City Metal | 1959 | Feb-14 | 45,000 | 15.0 | $38.40 | NNN |
| 230-79 International Airport Center Boulevard | Queens, NY | 1,100,000 | DHL Express | 2004 | Jan-14 | 45,051 | 15.0 | $23.00 | NNN |
| 29-01 & 28-20 Borden Avenue | Queens, NY | 143,000 | FedEx Ground | 2013 | March-13 | 143,000 | 15.0 | $65.61 | NNN |
| 57-54 Page Place | Queens, NY | 56,966 | Bimbo Bakery | 1941 | Jan-13 | 56,966 | 15.0 | $42.48 | NNN |
| (1) | Source: Appraisal. |
| (2) | Initial Rent PSF is inclusive of the straight-line average contractual base rent over the loan term for NYCEM equal to approximately $1,439,197. |
Cash Flow Analysis.
| Cash Flow Analysis(1) | ||||
| Appraisal | In-Place (5/6/2018)(2) |
U/W | U/W PSF | |
| Base Rent | $11,865,870 | $11,619,117 | $11,619,117 | $36.81 |
| Contractual Base Rent Steps(3) | 0 | 0 | 1,439,197 | 4.56 |
| Gross Potential Rent | $11,865,870 | $11,619,117 | $13,058,313 | $41.37 |
| Total Recoveries | 731,703 | 1,424,562 | 1,446,643 | 4.58 |
| Less: Vacancy(4) | (125,976) | 0 | (725,248) | (2.30) |
| Effective Gross Income | $12,471,597 | $13,043,679 | $13,779,709 | $43.66 |
| Total Operating Expenses(5) | 808,953 | 1,424,562 | 1,446,643 | 4.58 |
| Net Operating Income | $11,662,644 | $11,619,117 | $12,333,066 | $39.07 |
| TI/LC | 0 | 321,957 | 321,957 | 1.02 |
| Capital Expenditures | 0 | 37,877 | 37,877 | 0.12 |
| Net Cash Flow | $11,662,644 | $11,259,283 | $11,973,231 | $37.93 |
| (1) | The 930 Flushing Property was fully leased in January 2018 on a triple net basis by NYCEM on a lease expiring in 2036. Prior to January 2018, NYCEM leased 112,600 sq. ft. at the 930 Flushing Property since October 2006. In June 2016, NYCEM executed a license agreement for the remaining 203,044 sq. ft. at the 930 Flushing Property, pending ULURP approval. ULURP was formally approved in November 2017. As such, historical occupancy and financials are not applicable. |
| (2) | In-Place represents annualized rents per the underwritten rent roll dated May 6, 2018 and is based on leases in place with no vacancy adjustment, contractual tenant reimbursements per the leases and all other U/W expenses and capital items. |
| (3) | U/W Contractual Base Rent Steps are inclusive of the straight-line average contractual base rent over the loan term for NYCEM equal to approximately $1,439,197. |
| (4) | U/W Vacancy is based on 5.0% of the combined Gross Potential Rent and Total Recoveries. |
| (5) | The 930 Flushing Property benefits from a 25-year ICIP real estate tax abatement which commenced in July 2008 and provides the 930 Flushing Property with a full tax abatement on the improvements (excluding land) through June 2024, with the abatement decreasing by 10.0% each year thereafter until the benefits are fully extinguished in July 2033. U/W Total Operating Expenses include the unabated real estate tax figure. |
THE INFORMATION IN THIS STRUCTURAL AND COLLATERAL TERM SHEET IS NOT COMPLETE AND MAY BE AMENDED PRIOR TO THE TIME OF SALE. THIS TERM SHEET IS NOT AN OFFER TO SELL THESE SECURITIES AND IT IS NOT A SOLICITATION OF AN OFFER TO BUY THESE SECURITIES IN ANY JURISDICTION WHERE THE OFFER OR SALE IS NOT PERMITTED.
23
930 Flushing Avenue Brooklyn, NY 11206 |
Collateral Asset Summary – Loan No. 1 930 Flushing |
Cut-off Date Balance: Cut-off Date LTV: U/W NCF DSCR: U/W NOI Debt Yield: |
$100,000,000 51.3% 2.83x 12.3% |
Property Management. The 930 Flushing Property is managed by Flushing Management LLC, an affiliate of the borrowers.
Lockbox / Cash Management. The 930 Flushing Loan is structured with a hard lockbox with in place cash management. All rents are required to be deposited directly by the tenants of the 930 Flushing Property into a lockbox account controlled by the lender. All amounts in the lockbox account are required to be swept to a lender-controlled cash management account every business day and applied on each payment date to the payment of debt service and the funding of required reserves. Provided no Cash Trap Period (as defined below) is continuing, all funds remaining in the cash management account after payment of the aforementioned items will be transferred on a monthly basis into the borrowers’ operating account. During a Cash Trap Period, all excess cash in the cash management account will be retained by the lender as additional collateral for the 930 Flushing Loan.
A “Cash Trap Period” will commence (i) upon an event of default, (ii) if the debt yield is less than 9.0% for any quarter (until such time that the debt yield is greater than or equal to 9.5% for two consecutive quarters) or (iii) during a Lease Sweep Period.
A “Lease Sweep Period” will commence (i) on the date that is 12 months prior to the end of the term (including any renewal terms) of any Major Lease (as defined below), (ii) on the date required under a Major Lease by which the applicable Major Tenant (as defined below) is required to give notice of its exercise of a renewal option (and such renewal option has not been so exercised), (iii) if any Major Lease is surrendered, cancelled or terminated prior to its then-current expiration date; (iv) if any Major Tenant (other than NYCEM under the NYCEM Lease) goes dark or gives notice that it intends to discontinue its business, (v) upon the occurrence of a monetary or material non-monetary default under any Major Lease, (vi) upon the occurrence of a Major Tenant insolvency proceeding or (vii) if during the last three years of the loan term, the unsecured debt rating of NYCEM is downgraded to or below B by S&P (or its functional equivalent by any other rating agency). During a Lease Sweep Period, all excess cash flow will be deposited into the special rollover reserve account.
Notwithstanding the foregoing, with respect to a Lease Sweep Period triggered solely as a result of NYCEM exercising its termination option, amounts collected during the Lease Sweep Period will be capped at $11,985,760 and will be available to lender upon the effective date of termination of the NYCEM Lease (which, assuming a 36-month notice period and inclusive of the $3.25 million NYCEM construction reserve, would be $242,660 per month provided the reserve amount is still available); provided, however, if the Release Parcel (as defined below) is released after the commencement of such Lease Sweep Period, amounts collected during the Lease Sweep Period will be uncapped and all excess cash will be retained by lender as additional collateral for the 930 Flushing Loan.
A “Major Lease” means the NYCEM Lease and any lease, which covers 100,000 or more sq. ft.
A “Major Tenant” means any tenant under a Major Lease, or under one or more leases which when taken together would constitute a Major Lease.
Initial Reserves. At origination, the borrowers deposited (i) $246,950 into a tax reserve account, (ii) $20,100 into an insurance reserve account, (iii) $45,612 into a regular replacement reserve account, (iv) $300,917 into a supplemental replacement reserve account, (v) $28,125 into a required repairs reserve account, (vi) $84,166 into a leasing commissions reserve account, (vii) $391,492 into a free rent reserve account which amount was equal to the remaining unexpired free rent under the NYCEM Lease as of origination and (viii) $3,250,000 into an NYCEM construction reserve account.
Ongoing Reserves. On a monthly basis, the borrowers are required to deposit reserves of (i) 1/12 of the estimated annual real estate taxes, which currently equates to $42,955, into a tax reserve account, (ii) 1/12 of the estimated annual insurance premiums, which currently equates to $19,145, into an insurance reserve account , (iii) $2,996 into a regular replacement reserve account, subject to a cap of $150,000 and (iv) $22,917 into a supplemental replacement reserve account through and including the payment date in April 2019.
Current Mezzanine or Subordinate Indebtedness. None.
Future Mezzanine or Subordinate Indebtedness Permitted. None.
Partial Release. The borrowers have the right under the NYCEM Lease to terminate a portion of the premises demised under the NYCEM Lease and the right under the 930 Flushing Loan documents, in connection with the exercise of this partial termination right, to obtain a release of the Release Parcel (as defined below) by defeasing the portion of the 930 Flushing Loan collateralized by the Release Parcel and delivering defeasance collateral in an amount equal to the product of (A) the original principal balance of the 930 Flushing Loan and (B) the greater of (i) the NRSF of the Release Parcel relative to the total net rentable sq. ft. (“NRSF”) of the 930 Flushing Property, (ii) the rent attributable to the Release Parcel relative to the rent for the entire 930 Flushing Property and (iii) the appraised value at origination of the Release Parcel relative to the appraised value at origination of the total 930 Flushing Property; and subject, among other things, to the satisfaction of all REMIC release requirements. The appraised value of the Release Parcel as identified in the appraisal is equal to $24.0 million based on a hypothetical maximum 40,000 NRSF Release Parcel.
The “Release Parcel” means a portion of the 930 Flushing Property located near the corner of Evergreen Avenue and Noll Street (consisting of no less than 25,000 NRSF and no more than 40,000 NRSF plus all excess development/air rights related to the entire 930 Flushing Property).
THE INFORMATION IN THIS STRUCTURAL AND COLLATERAL TERM SHEET IS NOT COMPLETE AND MAY BE AMENDED PRIOR TO THE TIME OF SALE. THIS TERM SHEET IS NOT AN OFFER TO SELL THESE SECURITIES AND IT IS NOT A SOLICITATION OF AN OFFER TO BUY THESE SECURITIES IN ANY JURISDICTION WHERE THE OFFER OR SALE IS NOT PERMITTED.
24
(THIS PAGE INTENTIONALLY LEFT BLANK)
25
1635 8th Avenue Seattle, WA 98101 |
Collateral Asset Summary – Loan No. 2 Hyatt @ Olive 8 |
Cut-off Date Balance: Cut-off Date LTV: U/W NCF DSCR: U/W NOI Debt Yield: |
$78,000,000 52.5% 2.25x 13.3% |

THE INFORMATION IN THIS STRUCTURAL AND COLLATERAL TERM SHEET IS NOT COMPLETE AND MAY BE AMENDED PRIOR TO THE TIME OF SALE. THIS TERM SHEET IS NOT AN OFFER TO SELL THESE SECURITIES AND IT IS NOT A SOLICITATION OF AN OFFER TO BUY THESE SECURITIES IN ANY JURISDICTION WHERE THE OFFER OR SALE IS NOT PERMITTED.
26
1635 8th Avenue Seattle, WA 98101 |
Collateral Asset Summary – Loan No. 2 Hyatt @ Olive 8 |
Cut-off Date Balance: Cut-off Date LTV: U/W NCF DSCR: U/W NOI Debt Yield: |
$78,000,000 52.5% 2.25x 13.3% |
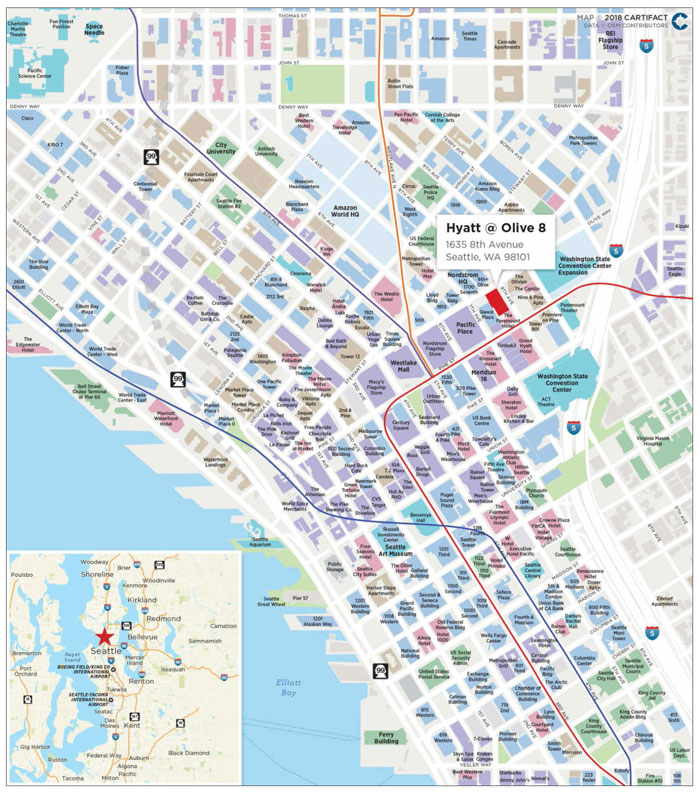
THE INFORMATION IN THIS STRUCTURAL AND COLLATERAL TERM SHEET IS NOT COMPLETE AND MAY BE AMENDED PRIOR TO THE TIME OF SALE. THIS TERM SHEET IS NOT AN OFFER TO SELL THESE SECURITIES AND IT IS NOT A SOLICITATION OF AN OFFER TO BUY THESE SECURITIES IN ANY JURISDICTION WHERE THE OFFER OR SALE IS NOT PERMITTED.
27
1635 8th Avenue Seattle, WA 98101 |
Collateral Asset Summary – Loan No. 2 Hyatt @ Olive 8 |
Cut-off Date Balance: Cut-off Date LTV: U/W NCF DSCR: U/W NOI Debt Yield: |
$78,000,000 52.5% 2.25x 13.3% |
| Mortgage Loan Information | |
| Loan Seller: | LCM |
| Loan Purpose: | Refinance |
| Borrower Sponsor(1): | Hedreen Holdings LLC |
| Borrower: | Hedreen Hotel Two LLC |
| Original Balance: | $78,000,000 |
| Cut-off Date Balance: | $78,000,000 |
| % by Initial UPB: | 7.8% |
| Interest Rate: | 4.8400% |
| Payment Date: | 6th of each month |
| First Payment Date: | June 6, 2017 |
| Maturity Date: | April 6, 2028 |
| Amortization: | Interest Only |
| Additional Debt: | None |
| Call Protection: | L(36), D(91), O(4) |
| Lockbox / Cash Management: | Hard / Springing |
| Reserves(2) | ||
| Initial | Monthly | |
| Taxes: | $0 | Springing |
| Insurance: | $0 | Springing |
| FF&E: | $0 | Springing |
| Financial Information | ||
| Cut-off Date Balance / Room: | $225,434 | |
| Balloon Balance / Room: | $225,434 | |
| Cut-off Date LTV(3): | 52.5% | |
| Balloon LTV(3): | 52.5% | |
| Underwritten NOI DSCR: | 2.72x | |
| Underwritten NCF DSCR: | 2.25x | |
| Underwritten NOI Debt Yield: | 13.3% | |
| Underwritten NCF Debt Yield: | 11.0% | |
| Underwritten NOI Debt Yield at Balloon: | 13.3% | |
| Underwritten NCF Debt Yield at Balloon: | 11.0% | |
| Property Information | ||
| Single Asset / Portfolio: | Single Asset | |
| Property Type: | Full Service Hospitality | |
| Collateral: | Fee Simple | |
| Location: | Seattle, WA | |
| Year Built / Renovated: | 2009 / NAP | |
| Total Rooms: | 346 | |
| Property Management: | Hyatt Corporation | |
| Underwritten NOI: | $10,401,352 | |
| Underwritten NCF: | $8,608,783 | |
| “As is” Appraised Value: | $148,700,000 | |
| “As is” Appraisal Date: | March 8, 2017 | |
| “As Stabilized” Appraised Value(3): | $163,000,000 | |
| “As Stabilized” Appraisal Date(3): | April 1, 2021 | |
| Historical NOI | ||
| Most Recent NOI: | $10,472,558 (December 31, 2017) | |
| 2016 NOI: | $9,308,001 (December 31, 2016) | |
| 2015 NOI: | $9,762,179 (December 31, 2015) | |
| 2014 NOI: | $7,773,797 (December 31, 2014) | |
| Historical Occupancy | ||
| Most Recent Occupancy: | 86.8% (December 31, 2017) | |
| 2016 Occupancy: | 84.9% (December 31, 2016) | |
| 2015 Occupancy: | 87.5% (December 31, 2015) | |
| 2014 Occupancy: | 82.3% (December 31, 2014) | |
| (1) | The borrower sponsor is also the borrower sponsor of the mortgage loan identified on Annex A-1 to the Preliminary Prospectus as Grand Hyatt Seattle, which has a Cut-off Date Balance of $50.0 million. |
| (2) | See “Initial Reserves” and “Ongoing Reserves” herein. |
| (3) | The “As Stabilized” Appraised Value assumes the Hyatt @ Olive 8 Property has achieved a stabilized occupancy of 84.0% and an ADR of $279.86. Based on the “As Stabilized” Appraised Value of $163,000,000 as of April 1, 2021, the Cut-off Date LTV and Balloon LTV are equal to 47.9%. There are no assurances that the Hyatt @ Olive 8 Property will achieve the appraiser’s stabilized occupancy and ADR assumptions in April 2021, or at all. The Hyatt @ Olive 8 Loan was underwritten based on the “As is” Appraised Value of $148,700,000. |
THE INFORMATION IN THIS STRUCTURAL AND COLLATERAL TERM SHEET IS NOT COMPLETE AND MAY BE AMENDED PRIOR TO THE TIME OF SALE. THIS TERM SHEET IS NOT AN OFFER TO SELL THESE SECURITIES AND IT IS NOT A SOLICITATION OF AN OFFER TO BUY THESE SECURITIES IN ANY JURISDICTION WHERE THE OFFER OR SALE IS NOT PERMITTED.
28
1635 8th Avenue Seattle, WA 98101 |
Collateral Asset Summary – Loan No. 2 Hyatt @ Olive 8 |
Cut-off Date Balance: Cut-off Date LTV: U/W NCF DSCR: U/W NOI Debt Yield: |
$78,000,000 52.5% 2.25x 13.3% |
| Historical Occupancy, ADR, RevPAR | |||||||||
| Hyatt @ Olive 8 Property(1) | Competitive Set(2) | Penetration Factor | |||||||
| Year | Occupancy | ADR | RevPAR | Occupancy | ADR | RevPAR | Occupancy | ADR | RevPAR |
| 2014 | 82.3% | $201.26 | $165.60 | 83.6% | $219.94 | $183.89 | 98.4% | 91.5% | 90.1% |
| 2015 | 87.5% | $217.30 | $190.12 | 80.7% | $234.97 | $189.66 | 108.4% | 92.5% | 100.2% |
| 2016 | 84.9% | $227.01 | $192.64 | 77.4% | $245.42 | $189.92 | 109.7% | 92.5% | 101.4% |
| 2017 | 86.8% | $236.34 | $205.21 | 85.7% | $258.08 | $221.13 | 101.3% | 91.6% | 92.8% |
| (1) | Source: Borrower provided financials. |
| (2) | Source: Hospitality research report. |
The Loan. The Hyatt @ Olive 8 loan (the “Hyatt @ Olive 8 Loan”) is a fixed rate loan secured by the borrower’s fee simple condominium interest in a 346-room full-service hotel located at 1635 8th Avenue in downtown Seattle, Washington (the “Hyatt @ Olive 8 Property”) with an original principal balance of $78.0 million. The Hyatt @ Olive 8 Loan has an approximately 11-year term and requires interest only payments for the term of the loan. The Hyatt @ Olive 8 Loan accrues interest at a fixed rate equal to 4.8400% and has a Cut-off Date Balance of $78.0 million. Proceeds of the Hyatt @ Olive 8 Loan were used to retire existing debt of approximately $66.5 million, pay closing costs of approximately $316,000, and return approximately $11.2 million of equity to the borrower sponsor. Based on the “As is” appraised value of $148.7 million as of March 8, 2017, the Cut-off Date LTV ratio is 52.5%. The most recent prior financing of the Hyatt @ Olive 8 Property was not included in a securitization.
| Sources and Uses | ||||||
| Sources | Proceeds | % of Total | Uses | Proceeds | % of Total | |
| Mortgage Loan | $78,000,000 | 100.0% | Loan Payoff | $66,481,412 | 85.2% | |
| Return of Equity | $11,202,646 | 14.4% | ||||
| Closing Costs | $315,943 | 0.4% | ||||
| Total Sources | $78,000,000 | 100.0% | Total Uses | $78,000,000 | 100.0% | |
The Borrower / Borrower Sponsor. The borrower, Hedreen Hotel Two LLC, is a single purpose Delaware limited liability company structured to be bankruptcy-remote, with two independent directors in its organizational structure. The sponsor of the borrower and the nonrecourse carve-out guarantor is Hedreen Holdings LLC.
Hedreen Holdings LLC is a subsidiary of R.C. Hedreen Co. Richard Hedreen, the CEO of R.C. Hedreen Co., has over 50 years of experience in real estate development, acquisition and management. R.C. Hedreen Co. has shifted its focus primarily to luxury hotels over the past decade, but its portfolio of projects includes retail, high-rise office buildings and single and multi-family homes. Mr. Hedreen’s current real estate portfolio includes the Hyatt @ Olive 8 Property, the Grand Hyatt Seattle (also an asset in the COMM 2018-COR3 mortgage trust), the Renaissance Seattle and the 7th & Pine retail and parking property which is located directly below the Grand Hyatt Seattle hotel (but is not collateral for the Grand Hyatt Seattle Loan). All of the properties in Mr. Hedreen’s current portfolio are located in downtown Seattle and all were originally developed by Mr. Hedreen.
Other notable developments by Mr. Hedreen include the Hilton Seattle, the Crowne Plaza Seattle Downtown hotel, and the Olive 8 Condominiums which are 229 residential condominium units located above the Hyatt @ Olive 8 Property (but are not collateral for the Hyatt @ Olive 8 Loan) which were sold to individual owners after completion in 2009. The 40-story Hyatt @ Olive 8 tower has one of the largest green roofs in downtown Seattle (8,355 sq. ft.) and is LEED certified. The borrower sponsor’s current portfolio is valued in excess of $750.0 million.
The Property. The Hyatt @ Olive 8 Property is a 346-room, AAA Four-Diamond rated, full-service hotel comprising the first 16 floors of a 40-story high-rise located at 1635 8th Avenue in downtown Seattle, Washington, within the Seattle central business district, and represents the first LEED Silver-certified hotel in Seattle. The borrower developed the Hyatt @ Olive 8 Property in 2009 as part of a larger mixed use development. The Hyatt @ Olive 8 Property consists of one condominium interest, the 346-room Hyatt @ Olive 8 Property (the “Hotel Unit”). A second condominium interest, the Olive 8 Residences which is not part of the Hyatt @ Olive 8 Property, contains 229 residential condominium units located above the Hyatt @ Olive 8 Property which were sold to individual owners after completion in 2009 (the “Residential Unit”). The Hotel Unit spans the first 16 floors while the Residential Unit is located on floors 17 through 40.
The Hyatt @ Olive 8 Property features 346 guestrooms and suites, a full service banquet kitchen on the third floor, a full service Urbane Restaurant, located on the first floor, the Urban Market café located off the lobby, a concierge, a 24 hour StayFitTM Gym with yoga studio, a whirlpool, the full service Elaia Spa, an indoor pool with city views, a business center, and valet parking. The Hyatt @ Olive 8 Property offers five guestroom configurations and suites. The configurations include 249 king guestrooms (380 sq. ft.), 82 queen guestrooms (380 sq. ft.), 13 one-bedroom suites (500 sq. ft.), 1 ambassador suite (970 sq. ft.), and 1 presidential suite (1,130 sq. ft.). Each guestroom at
THE INFORMATION IN THIS STRUCTURAL AND COLLATERAL TERM SHEET IS NOT COMPLETE AND MAY BE AMENDED PRIOR TO THE TIME OF SALE. THIS TERM SHEET IS NOT AN OFFER TO SELL THESE SECURITIES AND IT IS NOT A SOLICITATION OF AN OFFER TO BUY THESE SECURITIES IN ANY JURISDICTION WHERE THE OFFER OR SALE IS NOT PERMITTED.
29
1635 8th Avenue Seattle, WA 98101 |
Collateral Asset Summary – Loan No. 2 Hyatt @ Olive 8 |
Cut-off Date Balance: Cut-off Date LTV: U/W NCF DSCR: U/W NOI Debt Yield: |
$78,000,000 52.5% 2.25x 13.3% |
the Hyatt @ Olive 8 Property includes either a king or two double Hyatt Grand Beds, 37” LG flat-screen TV, a mini-fridge, a coffeemaker, work area with desk, iron and ironing board, in-room safe, alarm clock radio, complimentary Wi-Fi throughout, and expansive floor-to-ceiling windows offering views of the city. Suites include a foyer and separate sitting area.
The Hyatt @ Olive 8 Property is located approximately two blocks from to the Washington State Convention Center (“WSCC”). The Hyatt @ Olive 8 Property offers approximately 10,500 sq. ft. of flexible meeting space located on the third floor.
The Hyatt @ Olive 8 Property is subject to a management agreement with Hyatt Corporation who serves as the property manager for the Hyatt @ Olive 8 Property. The management agreement was established on April 20, 2001, currently runs through January 31, 2044, and contains one, five-year renewal option.
Environmental Matters. The Phase I environmental report dated March 19, 2017 recommended no further action at the Hyatt @ Olive 8 Property.
The Market. The Hyatt @ Olive 8 Property is located in the area known as the retail core neighborhood in downtown Seattle, a fine dining restaurant and shopping district just south of the Denny Triangle, situated near South Lake Union. According to the appraiser, the Hyatt @ Olive 8 Property is located near the area’s primary generators of lodging demand including dozens of upscale retailers and restaurants, major department stores, shopping centers, hotels, office buildings, and the WSCC. Because of its central location, the retail core has a substantial daytime population throughout the week. According to the appraiser, the nearby neighborhoods Denny Triangle and South Lake Union represent two of the city’s fastest growing neighborhoods. Amazon’s corporate headquarters was relocated to South Lake Union in 2015.
According to the Downtown Seattle Association, Amazon’s footprint totals 7.6 million sq. ft. with another 3.1 million sq. ft. under development. Amazon reportedly will occupy a total of 12.0 million sq. ft. by 2022, or equal to about a fifth of the inventory of downtown’s best-in-class office space. The company’s growth has allowed it to expand its headquarters in Seattle; in 2016, Amazon reportedly employed about 300,000 globally (24,000 in Washington), compared to 230,000 in 2015.
In 2015, Expedia announced plans to relocate its headquarters from Bellevue to Downtown Seattle. The development plans will allow Expedia to transition its 3,500 employees to the Seattle campus, with full occupancy by 2019. Additionally, several Silicon Valley high-tech companies, such as Google and Facebook, also have a presence in Seattle. In 2016, Google announced plans to relocate its Fremont campus to South Lake Union by 2019. Google’s new campus, which began construction in the second quarter of 2017, will occupy 607,000 sq. ft. of office space and will be able to accommodate 3,000 to 4,000 employees.
The borrower sponsor is currently in the process of developing Seattle’s largest hotel, the Hyatt Regency located at 8th & Howell. The 1,260 room Hyatt Regency hotel broke ground in 2016, on a site previously owned by an affiliate of the borrower sponsor and has an estimated completion date in 2019. The Hyatt Regency will be adjacent to the Washington State Convention Center Addition (“WSCC Addition”), which is scheduled to open in 2020. The preliminary cost of the WSCC Addition project is estimated at over $1.5 billion, and the expansion is expected to more than double the size of the existing WSCC, with an additional 440,000 sq. ft. of meeting space planned for the project. The WSCC Addition project is expected to provide several economic benefits, including as much as $240.0 million annually in visitor spending, as many as 3,900 direct and indirect jobs, and some 6,000 jobs during construction.
The demand segmentation for the Hyatt @ Olive 8 Property consists of 35.0% corporate demand, 35.0% meeting and group demand, and 30.0% leisure demand. The Hyatt @ Olive 8 Property’s top corporate accounts include the Sounders Soccer Headquarters, IBM, Amazon, Microsoft, Netjets and Oracle.
The Hyatt @ Olive 8 Property’s primary competitive set contains eight properties. The eight primary competitors range in size from 237 to 891 rooms and including the Hyatt @ Olive 8 Property, the overall competitive set collectively contains an aggregate of 4,137 rooms.
In total, the borrower sponsor has developed approximately 55.6% of the appraiser’s competitive set by number of hotels (five of nine) and 48.6% by number of rooms (2,012 of 4,137), and currently owns 33.3% of the appraiser’s competitive set by number of hotels (three of nine) and 32.9% by number of rooms (1,360 of 4,137). The appraiser’s primary competitors for the Hyatt @ Olive 8 Property are summarized in the table below:
THE INFORMATION IN THIS STRUCTURAL AND COLLATERAL TERM SHEET IS NOT COMPLETE AND MAY BE AMENDED PRIOR TO THE TIME OF SALE. THIS TERM SHEET IS NOT AN OFFER TO SELL THESE SECURITIES AND IT IS NOT A SOLICITATION OF AN OFFER TO BUY THESE SECURITIES IN ANY JURISDICTION WHERE THE OFFER OR SALE IS NOT PERMITTED.
30
1635 8th Avenue Seattle, WA 98101 |
Collateral Asset Summary – Loan No. 2 Hyatt @ Olive 8 |
Cut-off Date Balance: Cut-off Date LTV: U/W NCF DSCR: U/W NOI Debt Yield: |
$78,000,000 52.5% 2.25x 13.3% |
Primary Competitive Set(1) | ||||||
| Property | Rooms | Year Opened | Meeting Space (Sq. Ft.) |
Estimated 2016 Occupancy |
Estimated 2016 ADR |
Estimated 2016 RevPAR |
| Hyatt @ Olive 8 Property(3) | 346 | 2009 | 10,500 | 84.9%(2) | $227.01(2) | $192.64(2) |
| Renaissance Seattle(3) | 557 | 1978 | 28,000 | 80-85% | $190-200 | $160-170 |
| Hilton Seattle(4) | 237 | 1970 | 6,000 | 90-95% | $210-220 | $200-210 |
| Fairmont Olympic Hotel Seattle | 450 | 1924 | 17,500 | 65-70% | $250-260 | $180-190 |
| Westin Seattle | 891 | 1929 | 48,000 | 80-85% | $210-220 | $170-180 |
| Marriott Seattle Waterfront Hotel | 358 | 2003 | 11,000 | 80-85% | $260-270 | $210-220 |
| Grand Hyatt Seattle(3) | 457 | 2001 | 22,000 | 80-85% | $230-240 | $200-210 |
| Crowne Plaza Seattle Downtown(4) | 415 | 1983 | 8,500 | 80-85% | $170-180 | $140-150 |
| W Hotel Seattle | 426 | 1999 | 10,000 | 70-75% | $230-240 | $170-180 |
| Total / Wtd. Avg.(5) | 4,137 | 81.6% | $221.90 | $181.18 | ||
| (1) | Source: Appraisal. |
| (2) | Source: Borrower provided financials. |
| (3) | Originally developed and currently owned by the borrower sponsor. |
| (4) | Originally developed by the borrower sponsor and subsequently sold to a third party. |
| (5) | The Hyatt @ Olive 8 Property is included in the calculations. |
Cash Flow Analysis.
| Cash Flow Analysis | |||||||
| 2014 | 2015 | 2016 | 2017 | U/W | U/W per Room | ||
| Occupancy | 82.3% | 87.5% | 84.9% | 86.8% | 86.4% | ||
| ADR | $201.26 | $217.30 | $227.01 | $236.34 | $236.31 | ||
| RevPAR | $165.60 | $190.12 | $192.64 | $205.21 | $204.17 | ||
| Room Revenue | $20,913,167 | $24,010,124 | $24,395,342 | $25,915,998 | $25,784,946 | $74,523 | |
| F&B Revenue | 6,621,502 | 7,042,028 | 6,928,838 | 7,581,869 | 7,581,869 | 21,913 | |
| Other Revenue(1) | 2,181,924 | 2,311,498 | 2,335,532 | 2,484,561 | 2,484,561 | 7,181 | |
| Total Revenue | $29,716,593 | $33,363,650 | $33,659,712 | $35,982,428 | $35,851,376 | $103,617 | |
| Operating Expenses | 13,076,353 | 13,378,293 | 13,944,012 | 14,555,035 | 14,522,841 | 41,974 | |
| Undistributed Expenses | 6,053,927 | 7,076,816 | 7,090,170 | 7,290,485 | 7,281,738 | 21,045 | |
| Gross Operating Profit | $10,586,313 | $12,908,541 | $12,625,530 | $14,136,908 | $14,046,797 | $40,598 | |
| Management Fee | 891,498 | 1,009,247 | 1,009,793 | 1,226,917 | 1,222,448 | 3,533 | |
| Franchise Fee | 348,151 | 349,536 | 367,600 | 360,771 | 359,457 | 1,039 | |
| Total Fixed Charges | 1,572,868 | 1,787,579 | 1,940,136 | 2,076,662 | 2,063,540 | 5,964 | |
| Net Operating Income | $7,773,797 | $9,762,179 | $9,308,001 | $10,472,558 | $10,401,352 | $30,062 | |
| FF&E(2) | 1,188,664 | 1,334,555 | 1,682,990 | 1,798,499 | 1,792,569 | 5,181 | |
| Net Cash Flow | $6,585,133 | $8,427,624 | $7,625,011 | $8,674,059 | $8,608,783 | $24,881 | |
| (1) | Other Revenue includes telephone revenue, spa revenue, condo management revenue, parking revenue, and miscellaneous other revenue. |
| (2) | U/W FF&E represents approximately 5.0% of U/W Total Revenue. |
Property Management. The Hyatt @ Olive 8 Property is managed by Hyatt Corporation (“Hyatt”).
Lockbox / Cash Management. The Hyatt @ Olive 8 Loan is structured with a hard lockbox and springing cash management. Pursuant to the management agreement, Hyatt has established operating accounts for the Hyatt @ Olive 8 Property which are currently with U.S. Bank. The operating accounts are in the name of borrower, but Hyatt has sole signature authority over the operating accounts and is entitled to draw funds from the operating accounts in accordance with the hotel management agreement. Gross revenue from the Hyatt @ Olive 8 Property is deposited into a Hyatt controlled clearing account and is transferred on a daily basis to the Hyatt-controlled operating accounts unless a Cash Management Period (as defined below) is continuing. Hyatt has sole signature authority over the clearing account. The clearing account is in the name of the borrower but is pledged to lender as security for the Hyatt @ Olive 8 Loan and a deposit account control agreement was executed by the depository bank, the borrower, Hyatt, and lender in order to perfect the pledge. The lender can only take control of the clearing account after the termination of the hotel management agreement. During a Cash Management Period, all funds in the clearing account are required to be deposited into a lender-controlled cash management account and will be applied to pay monthly amounts due as required under the Hyatt @ Olive 8 Loan, and any excess amounts will be retained by lender as additional collateral for the Hyatt @ Olive 8 Loan.
THE INFORMATION IN THIS STRUCTURAL AND COLLATERAL TERM SHEET IS NOT COMPLETE AND MAY BE AMENDED PRIOR TO THE TIME OF SALE. THIS TERM SHEET IS NOT AN OFFER TO SELL THESE SECURITIES AND IT IS NOT A SOLICITATION OF AN OFFER TO BUY THESE SECURITIES IN ANY JURISDICTION WHERE THE OFFER OR SALE IS NOT PERMITTED.
31
1635 8th Avenue Seattle, WA 98101 |
Collateral Asset Summary – Loan No. 2 Hyatt @ Olive 8 |
Cut-off Date Balance: Cut-off Date LTV: U/W NCF DSCR: U/W NOI Debt Yield: |
$78,000,000 52.5% 2.25x 13.3% |
A “Cash Management Period” will occur (i) during the continuation of an event of default or (ii) if the debt yield is less than 7.5% as of the last day of a calendar quarter (until such time that the debt yield is at least 7.5% for two consecutive quarters).
Initial Reserves. None.
Ongoing Reserves. On a monthly basis, so long as the hotel management agreement is in effect, the borrower is required to deposit 1/12 of 5.0% of the gross income for the preceding month, into an FF&E reserve account held by Hyatt. In the event the hotel management agreement with Hyatt is no longer in effect, the FF&E reserve will be transferred into a lender-controlled FF&E reserve account. Additionally, Hyatt is required to pay all real estate taxes and insurance premiums from amounts collected from the Hyatt @ Olive 8 Property and deposited into the clearing account while the hotel management agreement is in effect. In the event Hyatt fails to make payments when due and payable, the borrower is required to deposit (i) 1/12 of the annual taxes into the tax reserve account and (ii) 1/12 of the annual insurance premiums into the insurance reserve account.
Current Mezzanine or Subordinate Indebtedness. None.
Future Mezzanine or Subordinate Indebtedness Permitted. None.
THE INFORMATION IN THIS STRUCTURAL AND COLLATERAL TERM SHEET IS NOT COMPLETE AND MAY BE AMENDED PRIOR TO THE TIME OF SALE. THIS TERM SHEET IS NOT AN OFFER TO SELL THESE SECURITIES AND IT IS NOT A SOLICITATION OF AN OFFER TO BUY THESE SECURITIES IN ANY JURISDICTION WHERE THE OFFER OR SALE IS NOT PERMITTED.
32
(THIS PAGE INTENTIONALLY LEFT BLANK)
33
1630 East 15th Street Brooklyn, NY 11229 |
Collateral Asset Summary – Loan No. 3 Kingswood Center |
Cut-off Date Balance: Cut-off Date LTV: U/W NCF DSCR: U/W NOI Debt Yield: |
$65,500,000 68.9% 1.29x 6.9% |
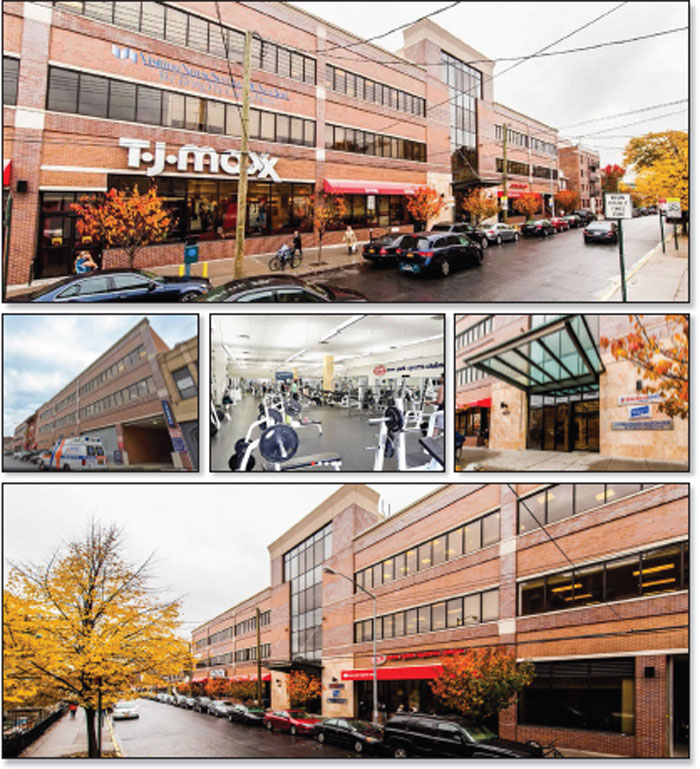
THE INFORMATION IN THIS STRUCTURAL AND COLLATERAL TERM SHEET IS NOT COMPLETE AND MAY BE AMENDED PRIOR TO THE TIME OF SALE. THIS TERM SHEET IS NOT AN OFFER TO SELL THESE SECURITIES AND IT IS NOT A SOLICITATION OF AN OFFER TO BUY THESE SECURITIES IN ANY JURISDICTION WHERE THE OFFER OR SALE IS NOT PERMITTED.
34
1630 East 15th Street Brooklyn, NY 11229 |
Collateral Asset Summary – Loan No. 3 Kingswood Center |
Cut-off Date Balance: Cut-off Date LTV: U/W NCF DSCR: U/W NOI Debt Yield: |
$65,500,000 68.9% 1.29x 6.9% |

THE INFORMATION IN THIS STRUCTURAL AND COLLATERAL TERM SHEET IS NOT COMPLETE AND MAY BE AMENDED PRIOR TO THE TIME OF SALE. THIS TERM SHEET IS NOT AN OFFER TO SELL THESE SECURITIES AND IT IS NOT A SOLICITATION OF AN OFFER TO BUY THESE SECURITIES IN ANY JURISDICTION WHERE THE OFFER OR SALE IS NOT PERMITTED.
35
1630 East 15th Street Brooklyn, NY 11229 |
Collateral Asset Summary – Loan No. 3 Kingswood Center |
Cut-off Date Balance: Cut-off Date LTV: U/W NCF DSCR: U/W NOI Debt Yield: |
$65,500,000 68.9% 1.29x 6.9% |
| Mortgage Loan Information | |
| Loan Seller: | LCM |
| Loan Purpose: | Refinance |
| Borrowers Sponsors: | Elchonon Schwartz; Simon Singer; Isaac S. Franco; Steven J. Kassin |
| Borrowers(1): | Various |
| Original Balance: | $65,500,000 |
| Cut-off Date Balance: | $65,500,000 |
| % by Initial UPB: | 6.5% |
| Interest Rate: | 5.0660% |
| Payment Date: | 6th of each month |
| First Payment Date: | March 6, 2018 |
| Maturity Date: | February 6, 2028 |
| Amortization: | Interest Only |
| Additional Debt: | None |
| Call Protection: | L(27), D(89), O(4) |
| Lockbox / Cash Management: | Hard / In Place |
| Reserves(2) | ||
| Initial | Monthly | |
| Taxes: | $125,000 | $50,000 |
| Insurance: | $3,000 | $3,700 |
| Replacement: | $0 | $2,170 |
| Rollover: | $0 | Springing |
| NYSC TI/LC(3): | $500,000 | NAP |
| VNS Earnout: | $1,600,000 | NAP |
| Special Rollover: | $0 | Springing |
| Financial Information | |
| Cut-off Date Balance / Sq. Ft.: | $503 |
| Balloon Balance / Sq. Ft.: | $503 |
| Cut-off Date LTV: | 68.9% |
| Balloon LTV: | 68.9% |
| Underwritten NOI DSCR: | 1.34x |
| Underwritten NCF DSCR: | 1.29x |
| Underwritten NOI Debt Yield: | 6.9% |
| Underwritten NCF Debt Yield: | 6.6% |
| Underwritten NOI Debt Yield at Balloon: | 6.9% |
| Underwritten NCF Debt Yield at Balloon: | 6.6% |
| Property Information | ||
| Single Asset / Portfolio: | Single Asset | |
| Property Type(4): | Mixed Use Office / Retail / Parking | |
| Collateral: | Fee Simple | |
| Location: | Brooklyn, NY | |
| Year Built / Renovated: | 2007 / NAP | |
| Total Sq. Ft.(4): | 130,218 | |
| Property Management: | Nightingale Realty, LLC | |
| Underwritten NOI: | $4,522,357 | |
| Underwritten NCF: | $4,324,426 | |
| Appraised Value: | $95,000,000 | |
| Appraisal Date: | October 12, 2017 | |
| Historical NOI | ||
| Most Recent NOI: | $4,754,856 (T-12 November 30, 2017) | |
| 2016 NOI: | $4,422,847 (December 31, 2016) | |
| 2015 NOI: | $4,259,740 (December 31, 2015) | |
| 2014 NOI: | NAP | |
| Historical Occupancy | ||
| Most Recent Occupancy: | 100.0% (March 1, 2018) | |
| 2016 Occupancy | 100.0% (December 31, 2016) | |
| 2015 Occupancy: | 100.0% (December 31, 2015) | |
| 2014 Occupancy: | NAP | |
| (1) | The borrowers for the Kingswood Center Loan are NG Kingswood Center, LLC; Kassin Brothers Kingswood, LLC; I Like Ike Kingswood, LLC; Infinity S Kingswood, LLC, as tenants-in-common. |
| (2) | See “Initial Reserves” and “Ongoing Reserves” herein. |
| (3) | Of the $500,000 initial NYSC TI/LC reserve, $200,000 is in the form of a letter of credit held by lender. |
| (4) | The Kingswood Center Property includes a 257-space, 97,102 sq.ft. subterranean parking garage which is not included in the Total Sq. Ft. |
THE INFORMATION IN THIS STRUCTURAL AND COLLATERAL TERM SHEET IS NOT COMPLETE AND MAY BE AMENDED PRIOR TO THE TIME OF SALE. THIS TERM SHEET IS NOT AN OFFER TO SELL THESE SECURITIES AND IT IS NOT A SOLICITATION OF AN OFFER TO BUY THESE SECURITIES IN ANY JURISDICTION WHERE THE OFFER OR SALE IS NOT PERMITTED.
36
1630 East 15th Street Brooklyn, NY 11229 |
Collateral Asset Summary – Loan No. 3 Kingswood Center |
Cut-off Date Balance: Cut-off Date LTV: U/W NCF DSCR: U/W NOI Debt Yield: |
$65,500,000 68.9% 1.29x 6.9% |
| Tenant Summary | |||||||
Tenant |
Ratings (Fitch/Moody’s/S&P)(1) |
Net Rentable Area (Sq. Ft.) |
%
of Net |
U/W
Base Rent PSF(2) |
%
of Total |
Lease Expiration | |
| Office Tenants | |||||||
| Visiting Nurse Service of NY(3) | NR/NR/NR | 58,387 | 44.8% | $35.29 | 43.9% | 6/30/2022 | |
| ElderServe Health, Inc.(3) | NR/NR/NR | 14,551 | 11.2% | $31.90 | 9.9% | 11/30/2024 | |
| GuildNet - Lighthouse Guild(3) | NR/NR/NR | 6,440 | 4.9% | $32.78 | 4.5% | 6/12/2026 | |
| New York Eye and Ear Infirmary of Mount Sinai(3) | A/A3/A- | 3,952 | 3.0% | $39.25 | 3.3% | 1/31/2025 | |
| Total Occupied Office Tenants | 83,330 | 64.0% | $34.69 | 61.6% | |||
| Vacant Office | 0 | 0.0% | |||||
| Total Office | 83,330 | 64.0% | |||||
| Retail Tenants | |||||||
| TJ Maxx(3) | NR/A2/A+ | 26,644 | 20.5% | $37.09 | 21.1% | 10/31/2030 | |
| New York Sports Club(3) | NR/NR/NR | 20,244 | 15.5% | $40.17 | 17.3% | 7/31/2032 | |
| Total Occupied Retail Tenants | 46,888 | 36.0% | $38.42 | 38.4% | |||
| Vacant Retail | 0 | 0.0% | |||||
| Total Retail | 46,888 | 36.0% | |||||
| Total Occupied Collateral | 130,218 | 100.0% | $36.04 | 100.0% | |||
| Total Vacant | 0 | 0.0% | |||||
| Total | 130,218 | 100.0% | |||||
| (1) | Certain ratings are those of the parent company whether or not the parent company guarantees the lease. |
| (2) | U/W Base Rent PSF is inclusive of approximately $17,470 in base rent steps taken through January 1, 2019, the straight-line average contractual base rent over the lease term for New York Eye and Ear Infirmary of Mount Sinai equal to approximately $13,559 and the straight-line average contractual base rent over the loan term for TJ Maxx equal to approximately $89,106. |
| (3) | Visiting Nurse Service of NY has one, five-year extension option and two, five-year extension options or one, 10-year extension option remaining. ElderServe Health, Inc. has two, five-year extension options remaining. GuildNet - Lighthouse Guild has two, five-year extension options remaining. New York Eye and Ear Infirmary of Mount Sinai has one, five-year extension option remaining. TJ Maxx has three, five-year extension options remaining. New York Sports Club has three, five-year extension options remaining. |
| Lease Rollover Schedule | ||||||||
| Year | # of Leases Expiring |
Total Expiring Sq. Ft. |
% of Total Sq. Ft. Expiring |
Cumulative Sq. Ft. Expiring |
Cumulative % of Sq. Ft. Expiring |
Annual U/W Base Rent PSF(1) |
% U/W Base Rent Rolling |
Cumulative % of U/W Base Rent |
| MTM | 0 | 0 | 0.0% | 0 | 0.0% | $0.00 | 0.0% | 0.0% |
| 2018 | 0 | 0 | 0.0% | 0 | 0.0% | $0.00 | 0.0% | 0.0% |
| 2019 | 0 | 0 | 0.0% | 0 | 0.0% | $0.00 | 0.0% | 0.0% |
| 2020 | 0 | 0 | 0.0% | 0 | 0.0% | $0.00 | 0.0% | 0.0% |
| 2021 | 0 | 0 | 0.0% | 0 | 0.0% | $0.00 | 0.0% | 0.0% |
| 2022 | 1 | 58,387 | 44.8% | 58,387 | 44.8% | $35.29 | 43.9% | 43.9% |
| 2023 | 0 | 0 | 0.0% | 58,387 | 44.8% | $0.00 | 0.0% | 43.9% |
| 2024 | 1 | 14,551 | 11.2% | 72,938 | 56.0% | $31.90 | 9.9% | 53.8% |
| 2025 | 1 | 3,952 | 3.0% | 76,890 | 59.0% | $39.25 | 3.3% | 57.1% |
| 2026 | 1 | 6,440 | 4.9% | 83,330 | 64.0% | $32.78 | 4.5% | 61.6% |
| 2027 | 0 | 0 | 0.0% | 83,330 | 64.0% | $0.00 | 0.0% | 61.6% |
| 2028 | 0 | 0 | 0.0% | 83,330 | 64.0% | $0.00 | 0.0% | 61.6% |
| Thereafter | 2 | 46,888 | 36.0% | 130,218 | 100.0% | $38.42 | 38.4% | 100.0% |
| Vacant | NAP | 0 | 0.0% | 130,218 | 100.0% | NAP | NAP | |
| Total / Wtd. Avg. | 6 | 130,218 | 100.0% | $36.04 | 100.0% | |||
| (1) | Annual U/W Base Rent PSF is inclusive of approximately $17,470 in base rent steps taken through January 1, 2019, the straight-line average contractual base rent over the lease term for New York Eye and Ear Infirmary equal to approximately $13,559 and the straight-line average contractual base rent over the loan term for TJ Maxx equal to approximately $89,106. |
THE INFORMATION IN THIS STRUCTURAL AND COLLATERAL TERM SHEET IS NOT COMPLETE AND MAY BE AMENDED PRIOR TO THE TIME OF SALE. THIS TERM SHEET IS NOT AN OFFER TO SELL THESE SECURITIES AND IT IS NOT A SOLICITATION OF AN OFFER TO BUY THESE SECURITIES IN ANY JURISDICTION WHERE THE OFFER OR SALE IS NOT PERMITTED.
37
1630 East 15th Street Brooklyn, NY 11229 |
Collateral Asset Summary – Loan No. 3 Kingswood Center |
Cut-off Date Balance: Cut-off Date LTV: U/W NCF DSCR: U/W NOI Debt Yield: |
$65,500,000 68.9% 1.29x 6.9% |
The Loan. The Kingswood Center loan (the “Kingswood Center Loan”) is a $65.5 million fixed rate loan secured by the borrowers’ fee simple interest in a 130,218 sq. ft. mixed use building comprised of 83,330 sq. ft. of office space, 46,888 sq. ft. of retail space and includes a 257-space subterranean parking garage located at 1630 East 15th Street in Brooklyn, New York (the “Kingswood Center Property”). The Kingswood Center Loan has a 10-year term and requires interest only payments for the term of the loan. The Kingswood Center Loan accrues interest at a fixed rate equal to 5.0660% and has a Cut-off Date Balance of $65.5 million. Proceeds of the Kingswood Center Loan, along with approximately $1.7 million of borrow sponsors equity, were used to retire existing debt of approximately $63.8 million, fund upfront reserves of approximately $2.2 million and pay closing costs of approximately $1.2 million. Based on the appraised value of approximately $95.0 million as of October 12, 2017, the Cut-off Date LTV is 68.9%. The most recent prior financing of the Kingswood Center Property was not included in a securitization.
| Sources and Uses | ||||||
| Sources | Proceeds | % of Total | Uses | Proceeds | % of Total | |
| Loan Amount | $65,500,000 | 97.4% | Loan Payoff | $63,835,900 | 95.0% | |
| Borrowers Sponsors Equity | $1,720,255 | 2.6% | Reserves | $2,228,000 | 3.3% | |
| Closing Costs | $1,156,355 | 1.7% | ||||
| Total Sources | $67,220,255 | 100.0% | Total Uses | $67,220,255 | 100.0% | |
The Borrowers / Borrowers Sponsors. The borrowers, NG Kingswood Center, LLC, Kassin Brothers Kingswood, LLC, I Like Ike Kingswood, LLC and Infinity S Kingswood, LLC, are structured as tenants-in-common and are each a single purpose Delaware limited liability company structured to be bankruptcy-remote, with two independent directors in its organizational structure. The sponsors of the borrowers and the non-recourse carve-out guarantors are Elchonon Schwartz, Simon Singer, Isaac S. Franco and Steven J. Kassin on a joint and several basis.
Elchonon Schwartz and Simon Singer are founders of The Nightingale Group (“Nightingale”), a privately held vertically integrated commercial real estate investment firm. Founded in 2005, Nightingale seeks investments with repositioning or redevelopment opportunities in core and non-core markets across the United States. Headquartered in New York City, Nightingale’s portfolio holdings currently span across 22 states with over 11.0 million sq. ft. of office and retail commercial space under management.
Isaac S. Franco and Steven J. Kassin are managing partners of the Infinity Group – Holding Company, LLC (“Infinity”). Infinity was founded in 1957 and is based in New York City with additional offices in Hong Kong, Mainland China, the Philippines and Pakistan. Through its subsidiaries, Infinity invests in businesses and investment ventures in real estate, consumer products, and retail-targeted brands. The company’s portfolio includes over 50 individual properties representing over 2.5 million sq. ft. of commercial space and over 1,000 urban multi-family rental apartments. Through its affiliates and portfolio companies, Infinity has managed in excess of 115 properties representing over 20.0 million sq. ft.
The Property. The Kingswood Center Property is a 130,218 sq. ft. mixed use building built in 2007 and located at 1630 East 15th Street in Brooklyn, New York. The three-story building was purchased by the borrower’s sponsors in August 2014. Since acquiring the Kingswood Center Property, the borrower’s sponsors have negotiated early extensions with the Kingswood Center Property’s two retail tenants, TJ Maxx and New York Sports Club, extending each of their lease terms 10 years through October 2030 and July 2032, respectively.
The Kingswood Center Property consists of 83,330 sq. ft. of office space and 46,888 sq. ft. of retail space. The Kingswood Center Property also includes a 257-space subterranean parking garage providing approximately 1.97 spaces per 1,000 sq. ft. of rentable area. As of March 1, 2018, the Kingswood Center Property was 100.0% leased. The office space at the Kingswood Center Property is 100.0% leased to four tenants which occupy approximately 64.0% of total net rentable area (“NRA”) and account for approximately 61.6% of underwritten base rent. The retail space at the Kingswood Center Property is 100.0% leased to two tenants which occupy approximately 36.0% of total NRA and account for approximately 38.4% of underwritten base rent.
Environmental Matters. The Phase I environmental report dated October 6, 2017 recommended no further action.
Major Office Tenants.
Visiting Nurse Service of NY (58,387 sq. ft.; 44.8% of NRA; 43.9% of U/W Base Rent) Founded in 1893, the Visiting Nurse Service of NY (“VNS”) is the largest not-for-profit home- and community-based health care organization in the United States, serving the five boroughs of New York City, and Nassau, Suffolk, and Westchester counties. VNS focuses on promoting the health and well-being of patients and families by providing care in their homes and communities. VNS offers a wide range of services, programs, and health plans to meet the needs of their patients, members, and clients from before birth to the end of life. In 2017, VNS served more than 135,000 patients with over 1.36 million professional (clinical) visits and over 32.8 million paraprofessional (home health aide) hours. VNS has one, five-year extension option and two, additional five-year extension options (or one, 10-year extension option) remaining at the Kingswood Center Property.
THE INFORMATION IN THIS STRUCTURAL AND COLLATERAL TERM SHEET IS NOT COMPLETE AND MAY BE AMENDED PRIOR TO THE TIME OF SALE. THIS TERM SHEET IS NOT AN OFFER TO SELL THESE SECURITIES AND IT IS NOT A SOLICITATION OF AN OFFER TO BUY THESE SECURITIES IN ANY JURISDICTION WHERE THE OFFER OR SALE IS NOT PERMITTED.
38
1630 East 15th Street Brooklyn, NY 11229 |
Collateral Asset Summary – Loan No. 3 Kingswood Center |
Cut-off Date Balance: Cut-off Date LTV: U/W NCF DSCR: U/W NOI Debt Yield: |
$65,500,000 68.9% 1.29x 6.9% |
ElderServe Health, Inc. (14,551 sq. ft.; 11.2% of NRA; 9.9% of U/W Base Rent) ElderServe Health, Inc. (“ElderServe”) is a New York State managed long term care program that is designed to help patients with chronic conditions remain in their own homes and live as independently as possible. ElderServe has two, five-year extension options remaining at the Kingswood Center Property.
Major Retail Tenants.
TJ Maxx (26,644 sq. ft.; 20.5% of NRA; 21.1% of U/W Base Rent; NR/A2/A+ by Fitch/Moody’s/S&P) TJ Maxx is a wholly-owned subsidiary of TJX Companies (NASDAQ: TJX; NR/A2/A+ by Fitch/Moody’s/S&P) (“TJX”). TJX is a retailer of apparel and home fashions in the U.S. and worldwide. TJX operates T.J. Maxx, Marshalls, HomeGoods, Sierra Trading Post and Homesense in the United States, Canada, the United Kingdom, Ireland, Germany, Poland, Austria, the Netherlands and Australia. As of the January 28, 2017, TJX reported over $33.0 billion in sales and operated more than 3,800 stores in nine countries, across three continents. In 2017, TJX ranked #87 in the Fortune 500 listings. TJ Maxx has three, five-year extension options remaining at the Kingswood Center Property.
New York Sports Club (20,244 sq. ft.; 15.5% of NRA; 17.3% of U/W Base Rent) New York Sports Club (“NYSC”) is a wholly-owned subsidiary of Town Sports International Holdings, Inc. (NASDAQ: CLUB) (“TSI”). TSI is a diversified holding company with subsidiaries engaged in a number of business and investment activities. The company has been involved in the fitness industry since 1973 and has grown to become one of the largest owners and operators of fitness clubs in the Northeast region of the United States. TSI operates four club brands including New York Sports Clubs (NYSC), Boston Sports Clubs (BSC), Washington Sports Clubs (WSC) and Philadelphia Sports Clubs (PSC). NYSC has three, five-year extension options remaining at the Kingswood Center Property.
The Market. The Kingswood Center Property is located in the South Brooklyn office and retail submarket within the overall Brooklyn market. As of Q4 2017, the South Brooklyn office submarket contained 985 properties totaling approximately 16.6 million sq. ft. with an overall vacancy rate of 7.3%. As of Q4 2017, the South Brooklyn retail submarket contained 7,286 properties totaling approximately 40.6 million sq. ft. with an overall vacancy rate of 2.5%. According to the appraiser, the Kingswood Center Property’s office tenants are subject to leases that are on average approximately 13.3% below market while the Kingswood Center Property’s retail tenants are subject to leases that are on average approximately 15.6% below market. The remaining appraisal assumptions for the Kingswood Center Property are below.
| Appraisal Market Rent Assumptions(1) | ||
| Office | Retail | |
| Sq. Ft.(2) | 83,330 | 46,888 |
| Appraiser Market Rent (PSF) | $40.00 | $45.00 |
| Rent Type | NNN | NNN |
| (1) | Source: Appraisal. |
| (2) | Based on rent roll dated March 1, 2018. |
THE INFORMATION IN THIS STRUCTURAL AND COLLATERAL TERM SHEET IS NOT COMPLETE AND MAY BE AMENDED PRIOR TO THE TIME OF SALE. THIS TERM SHEET IS NOT AN OFFER TO SELL THESE SECURITIES AND IT IS NOT A SOLICITATION OF AN OFFER TO BUY THESE SECURITIES IN ANY JURISDICTION WHERE THE OFFER OR SALE IS NOT PERMITTED.
39
1630 East 15th Street Brooklyn, NY 11229 |
Collateral Asset Summary – Loan No. 3 Kingswood Center |
Cut-off Date Balance: Cut-off Date LTV: U/W NCF DSCR: U/W NOI Debt Yield: |
$65,500,000 68.9% 1.29x 6.9% |
Cash Flow Analysis.
| Cash Flow Analysis | ||||||
| 2015 | 2016 | T-12 11/30/2017 | In-Place (3/1/2018)(1) | U/W | U/W PSF | |
| Base Rent(2) | $4,037,405 | $4,140,709 | $4,425,345 | $4,572,443 | $4,572,443 | $35.11 |
| Contractual Base Rent Steps | 0 | 0 | 0 | 0 | 120,136 | 0.92 |
| Gross Potential Rent | $4,037,405 | $4,140,709 | $4,425,345 | $4,572,443 | $4,692,578 | $36.04 |
| Total Recoveries | 766,086 | 763,448 | 772,571 | 819,830 | 1,324,803 | 10.17 |
| Parking Income | 404,525 | 495,871 | 604,308 | 606,739 | 606,739 | 4.66 |
| Other Income | 4,207 | 1,510 | 400 | 400 | 400 | 0.00 |
| Less: Vacancy(3) | 0 | 0 | 0 | 0 | (300,869) | (2.31) |
| Effective Gross Income | $5,212,223 | $5,401,538 | $5,802,624 | $5,999,411 | $6,323,651 | $48.56 |
| Total Operating Expenses(4) | 952,483 | 978,691 | 1,047,768 | 1,112,388 | 1,801,293 | 13.83 |
| Net Operating Income | $4,259,740 | $4,422,847 | $4,754,856 | $4,887,023 | $4,522,357 | $34.73 |
| TI/LC | 0 | 0 | 0 | 171,888 | 171,888 | 1.32 |
| Capital Expenditures | 0 | 0 | 0 | 26,044 | 26,044 | 0.20 |
| Net Cash Flow | $4,259,740 | $4,422,847 | $4,754,856 | $4,689,092 | $4,324,426 | $33.21 |
| (1) | In-Place represents annualized rents per the underwritten rent roll dated March 1, 2018 and is based on leases in place with no vacancy adjustment, contractual tenant reimbursements per the leases, U/W parking income, U/W other income, in place actual abated real estate taxes and all other U/W expenses and capital items. |
| (2) | U/W Base Rent is inclusive of approximately $17,470 in base rent steps taken through January 1, 2019, the straight-line average contractual base rent over the lease term for New York Eye and Ear Infirmary of Mount Sinai equal to approximately $13,559 and the straight-line average contractual base rent over the loan term for TJ Maxx equal to approximately $89,106. |
| (3) | U/W Vacancy is based on 5.0% of the combined Gross Potential Rent and Total Recoveries. |
| (4) | The Kingswood Center Property benefits from a 15-year ICIP real estate tax abatement which commenced in July 2007 and provides the Kingswood Center Property with a full tax abatement on the improvements (excluding land) through June 2018, with the abatement decreasing by 10.0% each year thereafter until the benefits are fully extinguished in July 2022. U/W Total Operating Expenses include the unabated real estate tax figure. |
Property Management. The Kingswood Center Property is managed Nightingale Realty, LLC, an affiliate of the borrowers.
Lockbox / Cash Management. The Kingswood Center Loan is structured with a hard lockbox with in place cash management. All rents are required to be deposited directly by the tenants of the Kingswood Center Property into a lockbox account controlled by the lender. All amounts in the lockbox account are required to be swept to a lender-controlled cash management account every business day and applied on each payment date to the payment of debt service and the funding of required reserves. Provided no Cash Trap Period (as defined below) is continuing, all funds remaining in the cash management account after payment of the aforementioned items will be transferred on a monthly basis into the borrowers’ operating account. During a Cash Trap Period, all excess cash in the cash management account will be retained by the lender as additional collateral for the Kingswood Center Loan.
A “Cash Trap Period” will commence (i) upon an event of default, (ii) if the debt yield is less than 6.0% (until such time that the debt yield is greater than or equal to 6.0% for two consecutive quarters) or (iii) during a Lease Sweep Period (as defined below).
A “Lease Sweep Period” will commence (i) on the date that is (x) 12 months prior to the end of the term (including any renewal terms) of any Lease Sweep Lease (as defined below), other than the VNS lease, or (y) 18 months prior to the end of the term (including any renewal terms) of the VNS lease, (ii) on the date required under a Lease Sweep Lease or the VNS lease by which the applicable Lease Sweep Tenant (as defined below) is required to give notice of its exercise of a renewal option (and such renewal option has not been so exercised), (iii) if any Lease Sweep Lease is surrendered, cancelled or terminated prior to its then-current expiration date; (iv) if any Lease Sweep Tenant goes dark or gives notice that it intends to discontinue its business, (v) upon the occurrence of a monetary or material non-monetary default under any Lease Sweep Lease or (vi) upon the occurrence of a Lease Sweep Tenant insolvency proceeding. During a Lease Sweep Period, all excess cash flow will be deposited into a special rollover reserve account.
A “Lease Sweep Lease” means the TJ Maxx lease, the NYSC lease, the VNS lease and any lease which covers 20,000 or more sq. ft. or represents greater than or equal to 15.0% of the total rental income of the Kingswood Center Property.
A “Lease Sweep Tenant” means any tenant under a Lease Sweep Lease.
THE INFORMATION IN THIS STRUCTURAL AND COLLATERAL TERM SHEET IS NOT COMPLETE AND MAY BE AMENDED PRIOR TO THE TIME OF SALE. THIS TERM SHEET IS NOT AN OFFER TO SELL THESE SECURITIES AND IT IS NOT A SOLICITATION OF AN OFFER TO BUY THESE SECURITIES IN ANY JURISDICTION WHERE THE OFFER OR SALE IS NOT PERMITTED.
40
1630 East 15th Street Brooklyn, NY 11229 |
Collateral Asset Summary – Loan No. 3 Kingswood Center |
Cut-off Date Balance: Cut-off Date LTV: U/W NCF DSCR: U/W NOI Debt Yield: |
$65,500,000 68.9% 1.29x 6.9% |
Initial Reserves. At origination, the borrowers deposited (i) $1,600,000 into a VNS earnout reserve account, (ii) $500,000 into a NYSC TI/LC reserve account, (iii) $125,000 into a tax reserve account and (iv) $3,000 into an insurance reserve account.
In connection with the $1,600,000 VNS earnout reserve account and $200,000 of the $500,000 NYSC TI/LC reserve account deposits, in lieu of cash, the borrowers provided to lender a letter of credit (“LOC”) with Deutsche Bank AG New York Branch in the amount of $1,800,000 which is held by lender as collateral for the Kingswood Center Loan. Provided no default or event of default has occurred and is continuing, lender will return the LOC to the borrowers upon (i) borrowers entering into a fully executed amendment to the VNS lease which provides for (A) an extension term of the lesser of (x) 10 years or (y) a term that expires no earlier than two years beyond the stated maturity date, (B) is either (x) on a triple net basis, including that the tenant is required to pay its proportionate share of all real estate taxes or (y) on a gross lease basis where the contractual rent increase (over the current contractual rent under the VNS lease) is sufficient to cover such real estate tax obligations, and, in either case, is otherwise on terms and conditions reasonably acceptable to lender and (ii) the Kingswood Center Property achieving a debt yield equal to or greater than 7.00%; provided, however, if upon satisfaction of such conditions the amount of the NYSC TI/LC reserve deposit has not been increased by an additional $200,000 and the requirement to pay such funds is still in effect, then (x) $200,000 of the proceeds of the LOC may be drawn on by lender and deposited into the rollover reserve and held as part of the NYSC TI/LC reserve deposit and (y) the remainder of the LOC will be returned to borrowers.
Ongoing Reserves. On a monthly basis, the borrowers are required to deposit reserves of (i) 1/12 of the estimated annual real estate taxes, which currently equates to $50,000, into a tax reserve account, (ii) 1/12 of the annual insurance premiums, which currently equates to $3,700, into an insurance reserve account and (iii) $2,170 into a replacement reserve account, subject to a cap of $100,000. In addition, during the continuance of a Rollover Reserve Deposit Period (as defined below), the borrowers are required to deposit $16,277 into a rollover reserve account.
A “Rollover Reserve Deposit Period” will exist (i) during the continuation of a default of any tenant under a Lease Sweep Lease or (ii) during the time any tenant under a lease demising at least 10,000 more sq. ft. goes dark or gives notice that it intends to discontinue its business (provided that with respect to any office tenant, the foregoing will only apply if the tenant goes dark or gives notice of its intention to go dark in more than 20.0% of its premises) until the date on which all of the space has been fully leased pursuant to a replacement lease and all approved leasing expenses have been paid in full.
Current Mezzanine or Subordinate Indebtedness. None.
Future Mezzanine or Subordinate Indebtedness Permitted. None.
THE INFORMATION IN THIS STRUCTURAL AND COLLATERAL TERM SHEET IS NOT COMPLETE AND MAY BE AMENDED PRIOR TO THE TIME OF SALE. THIS TERM SHEET IS NOT AN OFFER TO SELL THESE SECURITIES AND IT IS NOT A SOLICITATION OF AN OFFER TO BUY THESE SECURITIES IN ANY JURISDICTION WHERE THE OFFER OR SALE IS NOT PERMITTED.
41
1001 North Shoreline Boulevard Mountain View, CA 95051 |
Collateral Asset Summary – Loan No. 4 1001 North Shoreline Boulevard |
Cut-off Date Balance: Cut-off Date LTV: U/W NCF DSCR: U/W NOI Debt Yield: |
$64,450,000 37.7% 3.52x 12.4% |

THE INFORMATION IN THIS STRUCTURAL AND COLLATERAL TERM SHEET IS NOT COMPLETE AND MAY BE AMENDED PRIOR TO THE TIME OF SALE. THIS TERM SHEET IS NOT AN OFFER TO SELL THESE SECURITIES AND IT IS NOT A SOLICITATION OF AN OFFER TO BUY THESE SECURITIES IN ANY JURISDICTION WHERE THE OFFER OR SALE IS NOT PERMITTED.
42
1001 North Shoreline Boulevard Mountain View, CA 95051 |
Collateral Asset Summary – Loan No. 4 1001 North Shoreline Boulevard |
Cut-off Date Balance: Cut-off Date LTV: U/W NCF DSCR: U/W NOI Debt Yield: |
$64,450,000 37.7% 3.52x 12.4% |
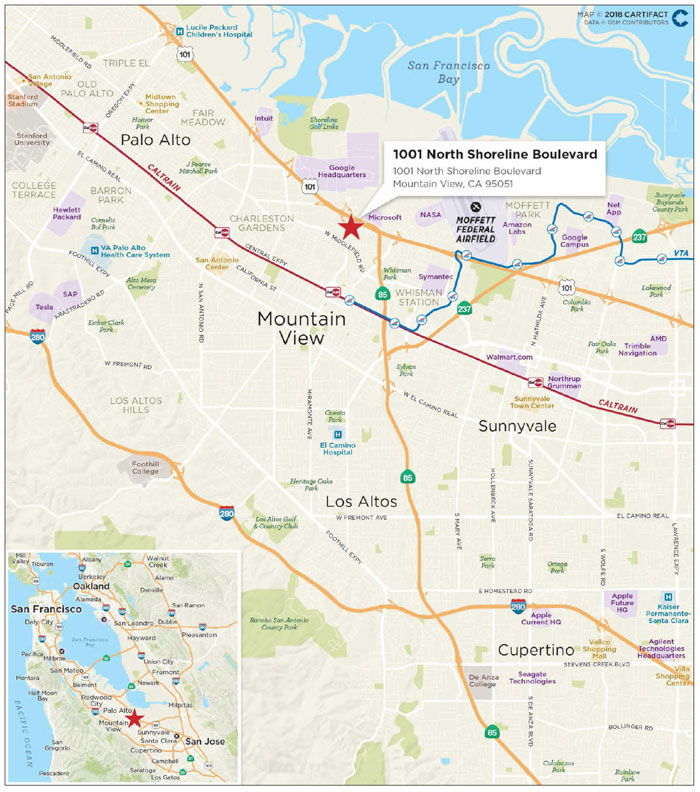
THE INFORMATION IN THIS STRUCTURAL AND COLLATERAL TERM SHEET IS NOT COMPLETE AND MAY BE AMENDED PRIOR TO THE TIME OF SALE. THIS TERM SHEET IS NOT AN OFFER TO SELL THESE SECURITIES AND IT IS NOT A SOLICITATION OF AN OFFER TO BUY THESE SECURITIES IN ANY JURISDICTION WHERE THE OFFER OR SALE IS NOT PERMITTED.
43
1001 North Shoreline Boulevard Mountain View, CA 95051 |
Collateral Asset Summary – Loan No. 4 1001 North Shoreline Boulevard |
Cut-off Date Balance: Cut-off Date LTV: U/W NCF DSCR: U/W NOI Debt Yield: |
$64,450,000 37.7% 3.52x 12.4% |
| Mortgage Loan Information | |
| Loan Seller: | GACC |
| Loan Purpose: | Acquisition |
Credit Assessment (Fitch):(1) |
BBB-sf |
| Borrower Sponsor(2): | Lighthouse Real Estate Holdings LLC |
| Borrower: | LH Shoreline LP |
| Original Balance(3): | $64,450,000 |
| Cut-off Date Balance(3): | $64,450,000 |
| % by Initial UPB: | 6.4% |
| Interest Rate(4)(5): | 3.464880% |
| Payment Date: | 6th of each month |
| First Payment Date: | May 6, 2018 |
| Anticipated Repayment Date: | April 6, 2028 |
| Final Maturity Date: | April 6, 2030 |
| Amortization: | Interest Only, ARD |
| Additional Debt(3): | $46,050,000 B Note |
| Call Protection (6): | L(25), D(88), O(7) |
| Lockbox / Cash Management: | Hard / Springing |
| Reserves(7) | ||
| Initial | Monthly | |
| Taxes: | $0 | Springing |
| Insurance: | $0 | Springing |
| Replacement: | $0 | Springing |
| TI/LC: | $0 | Springing |
| Outstanding TI: | $5,726,059 | NAP |
| Lease Sweep: | $0 | Springing |
| Financial Information | ||||
| Senior Note(8) | Total Debt(9) | |||
| Cut-off Date Balance / Sq. Ft.: | $522 | $896 | ||
| Balloon Balance / Sq. Ft.: | $522 | $896 | ||
| Cut-off Date LTV(10): | 37.7% | 64.6% | ||
| Balloon LTV(10): | 37.7% | 64.6% | ||
| Underwritten NOI DSCR: | 3.52x | 1.65x | ||
| Underwritten NCF DSCR: | 3.52x | 1.65x | ||
| Underwritten NOI Debt Yield: | 12.4% | 7.2% | ||
| Underwritten NCF Debt Yield: | 12.4% | 7.2% | ||
| Underwritten NOI Debt Yield at Balloon: | 12.4% | 7.2% | ||
| Underwritten NCF Debt Yield at Balloon: | 12.4% | 7.2% | ||
| (1) | Fitch provided the above rating for the 1001 North Shoreline Boulevard Loan, in the context of inclusion in the mortgage pool. |
| (2) | There is no nonrecourse carve-out guarantor or environmental indemnitor, other than the borrower, for the 1001 North Shoreline Whole Loan. |
| (3) | The Original Balance and Cut-off Date Balance of $64.45 million represents the senior non-controlling Note A, which together with the subordinate Note B, with an original principal balance of $46.05 million, comprises the 1001 North Shoreline Whole Loan with an aggregate original principal balance of $110.5 million. For additional information regarding the senior note and subordinate note, see “The Loan” herein. |
| (4) | Interest Rate reflects the interest rate with respect to the Note A. The interest rate on the Note B is 5.5000%. |
| (5) | From and after April 6, 2028, the 1001 North Shoreline Whole Loan will accrue interest at a fixed rate that is equal to the greater of (i) 6.8130% and (ii) the swap rate (based on the linear interpolation of mid-market swap yields with maturities most nearly approximating April 6, 2030) plus 3.9000%. |
| Property Information | |
| Single Asset / Portfolio: | Single Asset |
| Property Type: | Suburban Office |
| Collateral: | Fee Simple |
| Location: | Mountain View, CA |
| Year Built / Renovated: | 2017 / NAP |
| Total Sq. Ft.: | 123,374 |
| Property Management: | Self-managed |
| Underwritten NOI: | $7,967,106 |
| Underwritten NCF: | $7,967,106 |
| Appraised Value(10): | $171,000,000 |
| Appraisal Date(10): | April 1, 2018 |
| Historical NOI(11) | |
| Most Recent NOI: | NAP |
| 2016 NOI: | NAP |
| 2015 NOI: | NAP |
| 2014 NOI: | NAP |
| Historical Occupancy(11) | |
| Most Recent Occupancy(12): | 100.0% (May 6, 2018) |
| 2016 Occupancy: | NAP |
| 2015 Occupancy: | NAP |
| 2014 Occupancy: | NAP |
| (6) | The borrower has the option to obtain the release of an approximately 5.64 acre parcel on which unimproved land and a parking lot are located. If at the time of such release, the loan to value ratio for the remaining property is greater than 65.0%, the borrower is required to prepay or, if after the defeasance lockout period, defease the loan by an amount that, when applied to the outstanding principal balance, would cause the loan to value ratio to be no greater than 65.0%. See “Partial Release” herein. |
| (7) | See “Initial and Ongoing Reserves” herein. |
| (8) | Senior Note DSCR, LTV, Debt Yield and Balance / Sq. Ft. calculations are based on the Note A only, which has an original principal balance of $64.45 million. |
| (9) | Total Debt DSCR, LTV, Debt Yield and Balance / Sq. Ft. calculations are based on the 1001 North Shoreline Whole Loan, which has an aggregate original principal balance of $110.5 million, and which includes a $46.05 million Note B. |
| (10) | Represents the appraiser’s “As Stabilized” Appraised Value, which assumes the contractual tenant improvement obligations of the borrower, per the Google lease, have been entirely paid. At loan origination, the borrower reserved approximately $5.7 million, which amount represents the total cost for remaining outstanding tenant improvements. The “As-Is” Appraised Value is $165.0 million, which represents a Cut-off Date LTV and Balloon LTV of 39.1% and 39.1%, respectively, based on the 1001 North Shoreline Senior Note. Based on the 1001 North Shoreline Whole Loan and the “As-Is” Appraised Value of $165.0 million, the Cut-off Date LTV and Balloon LTV are 67.0% and 67.0%, respectively. The appraised value includes the value of a release parcel, which is permitted to be released as described under “Partial Release” below. In addition, the appraiser concluded a dark value of $135.8 million, which provides a loan to dark value ratio of 81.4% based on the Total Debt and 47.5% based on the 1001 North Shoreline Senior Note. |
| (11) | The 1001 North Shoreline Property was built in 2017. As such, historical occupancy and historical NOI are not available. |
| (12) | The 1001 North Shoreline Property finished construction and was delivered to Google in late 2017. Google’s lease has commenced with no outs and the tenant is in the process of completing tenant improvements, which are expected to be finished mid-2018. The rent commencement date was March 30, 2018. |
THE INFORMATION IN THIS STRUCTURAL AND COLLATERAL TERM SHEET IS NOT COMPLETE AND MAY BE AMENDED PRIOR TO THE TIME OF SALE. THIS TERM SHEET IS NOT AN OFFER TO SELL THESE SECURITIES AND IT IS NOT A SOLICITATION OF AN OFFER TO BUY THESE SECURITIES IN ANY JURISDICTION WHERE THE OFFER OR SALE IS NOT PERMITTED.
44
1001 North Shoreline Boulevard Mountain View, CA 95051 |
Collateral Asset Summary – Loan No. 4 1001 North Shoreline Boulevard |
Cut-off Date Balance: Cut-off Date LTV: U/W NCF DSCR: U/W NOI Debt Yield: |
$64,450,000 37.7% 3.52x 12.4% |
| Tenant Summary(1) | |||||||
Tenant |
Ratings (Fitch/Moody’s/S&P) (2) |
Net Rentable Area (Sq. Ft.) |
% of Net Rentable Area |
U/W Base Rent PSF |
% of Total U/W Base Rent |
Lease Expiration | |
| Google LLC(3)(4) | NAP / Aa2 / AA+ | 123,374 | 100.0% | $60.00 | 100.0% | 3/31/2030 | |
| Total / Wtd. Avg. Occupied | 123,374 | 100.0% | $60.00 | 100.0% | |||
| Vacant | 0 | 0.0% | |||||
| Total | 123,374 | 100.0% | |||||
| (1) | Based on the underwritten rent roll as of May 6, 2018. |
| (2) | Certain ratings are those of the parent company, Alphabet Inc., which does not guaranty the Google lease at the 1001 North Shoreline Property. |
| (3) | Google took possession of the building in late 2017 and is in the process of completing the tenant improvement build-out. Google has indicated a desired move-in date of June 15, 2018. |
| (4) | Google has two seven-year extension options at fair market rent, with 13 months prior notice. Google does not have any early termination options. |
| Lease Rollover Schedule(1) | ||||||||
| Year | # of Leases Expiring |
Total Expiring Sq. Ft. |
% of Total Sq. Ft. Expiring |
Cumulative Sq. Ft. Expiring |
Cumulative % of Sq. Ft. Expiring |
Annual U/W Base Rent PSF |
% U/W Base Rent Rolling |
Cumulative % of U/W Base Rent |
| MTM | 0 | 0 | 0.0% | 0 | 0.0% | $0.00 | 0.0% | 0.0% |
| 2018 | 0 | 0 | 0.0% | 0 | 0.0% | $0.00 | 0.0% | 0.0% |
| 2019 | 0 | 0 | 0.0% | 0 | 0.0% | $0.00 | 0.0% | 0.0% |
| 2020 | 0 | 0 | 0.0% | 0 | 0.0% | $0.00 | 0.0% | 0.0% |
| 2021 | 0 | 0 | 0.0% | 0 | 0.0% | $0.00 | 0.0% | 0.0% |
| 2022 | 0 | 0 | 0.0% | 0 | 0.0% | $0.00 | 0.0% | 0.0% |
| 2023 | 0 | 0 | 0.0% | 0 | 0.0% | $0.00 | 0.0% | 0.0% |
| 2024 | 0 | 0 | 0.0% | 0 | 0.0% | $0.00 | 0.0% | 0.0% |
| 2025 | 0 | 0 | 0.0% | 0 | 0.0% | $0.00 | 0.0% | 0.0% |
| 2026 | 0 | 0 | 0.0% | 0 | 0.0% | $0.00 | 0.0% | 0.0% |
| 2027 | 0 | 0 | 0.0% | 0 | 0.0% | $0.00 | 0.0% | 0.0% |
| 2028 | 0 | 0 | 0.0% | 0 | 0.0% | $0.00 | 0.0% | 0.0% |
| Thereafter | 1 | 123,374 | 100.0% | 123,374 | 100.0% | $60.00 | 100.0% | 100.0% |
| Vacant | NAP | 0 | 0.0% | 123,374 | 100.0% | NAP | NAP | |
| Total / Wtd. Avg. | 1 | 123,374 | 100.0% | $60.00 | 100.0% | |||
| (1) | Based on the underwritten rent roll as of May 6, 2018. |
The Loan. The 1001 North Shoreline Boulevard mortgage loan (the “1001 North Shoreline Loan”) is a fixed rate loan secured by the borrower’s fee simple interest in a 123,374 sq. ft. office building located in Mountain View, California (the “1001 North Shoreline Property”). The 1001 North Shoreline Loan is evidenced by the Note A with an original principal balance of $64.45 million (the “1001 North Shoreline Senior Note”), which is part of a $110.5 million whole loan that is evidenced by the 1001 North Shoreline Senior Loan and the subordinate Note B with an original principal balance of $46.05 million (together, the “1001 North Shoreline Whole Loan”). Only the 1001 North Shoreline Senior Note will be included in the COMM 2018-COR3 mortgage trust.
The relationship between the holders of the 1001 North Shoreline Whole Loan is governed by a co-lender agreement as described under “Description of the Mortgage Pool–The Whole Loans–The Serviced AB Whole Loan” in the Preliminary Prospectus.
| Whole Loan Summary | |||||
| Note | Original Balance | Cut-off Date Balance | Note Holder | Controlling Piece | |
| A | $64,450,000 | $64,450,000 | COMM 2018-COR3 | No | |
| B | $46,050,000 | $46,050,000 | DBNY | Yes(1) | |
| Total | $110,500,000 | $110,500,000 | |||
| (1) | The related whole loan will be serviced pursuant to the COMM 2018-COR3 pooling and servicing agreement. However, so long as no “control appraisal period” (or similar term) has occurred and is continuing, the holder of Note B will be the controlling noteholder and will have the right to approve certain modifications and consent to certain actions taken with respect to the related whole loan. If a control appraisal period has occurred and is continuing, the holder of Note A will be the controlling noteholder, which rights may be exercised by the controlling class certificateholder (or its representative or any party assigned to exercise the rights of the controlling noteholder under the COMM 2018-COR3 pooling and servicing agreement). |
THE INFORMATION IN THIS STRUCTURAL AND COLLATERAL TERM SHEET IS NOT COMPLETE AND MAY BE AMENDED PRIOR TO THE TIME OF SALE. THIS TERM SHEET IS NOT AN OFFER TO SELL THESE SECURITIES AND IT IS NOT A SOLICITATION OF AN OFFER TO BUY THESE SECURITIES IN ANY JURISDICTION WHERE THE OFFER OR SALE IS NOT PERMITTED.
45
1001 North Shoreline Boulevard Mountain View, CA 95051 |
Collateral Asset Summary – Loan No. 4 1001 North Shoreline Boulevard |
Cut-off Date Balance: Cut-off Date LTV: U/W NCF DSCR: U/W NOI Debt Yield: |
$64,450,000 37.7% 3.52x 12.4% |
The 1001 North Shoreline Whole Loan has a 12-year term with an anticipated repayment date (“ARD”) in year 10, and is interest only for the entire term. The 1001 North Shoreline Senior Note accrues interest at a fixed rate equal to 3.464880% per annum through the ARD and has a Cut-off Date Balance of $64.45 million. The 1001 North Shoreline Whole Loan is structured with an ARD of April 6, 2028, and a final maturity date of April 6, 2030. From and after the ARD, the 1001 North Shoreline Whole Loan accrues interest at a blended fixed rate equal to the greater of (i) 6.8130% and (ii) the swap rate (based on the linear interpolation of mid-market swap yields with maturities most nearly approximating April 6, 2030) plus 3.9000%.
The 1001 North Shoreline Whole Loan proceeds along with approximately $68.1 million in borrower sponsor equity were used to (i) acquire the 1001 North Shoreline Property for approximately $169.9 million, (ii) fund upfront reserves of approximately $5.7 million (for which a seller credit was provided as an offset to the purchase price) and (iii) pay closing costs. Based on the aggregate “As Stabilized” appraised value of $171.0 million as of April 1, 2018, the Cut-off Date LTV for the 1001 North Shoreline Senior Note is 37.7% and for the 1001 North Shoreline Whole Loan is 64.6%. In addition, the appraiser concluded a dark value of $135.8 million which provides a loan to dark value ratio of 81.4% based on the 1001 North Shoreline Whole Loan and 47.5% based on the 1001 North Shoreline Senior Note.
The most recent prior financing of the 1001 North Shoreline Property was not included in a securitization.
| Sources and Uses | ||||||
| Sources | Proceeds | % of Total | Uses | Proceeds | % of Total | |
| Whole Loan Amount | $110,500,000 | 61.9% | Purchase Price(1) | $169,946,278 | 95.1% | |
| Borrower Sponsor Equity | $68,112,865 | 38.1% | Reserves | $5,726,059 | 3.2% | |
| Closing Costs | $2,940,528 | 1.6% | ||||
| Total Sources | $178,612,865 | 100.0% | Total Uses | $178,612,865 | 100.0% | |
| (1) | At loan closing, the seller credited the approximately $5.7 million in remaining tenant improvements to the borrower, which amount was held back in an upfront outstanding tenant improvement reserve, resulting in a net purchase price of $164,220,219. |
The Borrower / Borrower Sponsor. The borrower, LH Shoreline LP, is a single purpose Delaware limited partnership structured to be bankruptcy-remote with two independent directors in its organizational structure. The sponsor of the borrower is Lighthouse Real Estate Holdings LLC. There is no separate nonrecourse carve-out guarantor, and the borrower is the sole party to the environmental indemnity.
Lighthouse Real Estate Holdings LLC is ultimately owned by a prominent Asian industrial family. The borrower sponsor is being advised by Stockbridge Capital, a real estate investment management firm that has approximately $11.3 billion of assets under management, as of December 31, 2017, spanning major real estate types throughout the United States.
The Property. The 1001 North Shoreline Property is a newly constructed Class A four-story building located one mile north of downtown Mountain View, California. The 1001 North Shoreline Property is 100.0% leased to Google through March 2030. Google’s global headquarters, the approximately 1.0 million sq. ft. Googleplex, is located approximately 1 mile from the 1001 North Shoreline Property. The 1001 North Shoreline Property is expected to house a substantial portion of Google’s worldwide legal team. Improvements were completed in 2017 and feature 30,000 sq. ft. floor plates with energy efficient heating, cooling and lighting systems. Amenities include floor to ceiling windows with panoramic views of Silicon Valley, balconies, outdoor basketball courts, volleyball courts and sitting areas. In addition, Google has the option to build out a cafeteria and fitness center. The 1001 North Shoreline Property has 371 surface parking spaces for a ratio of 3.0 spaces per 1,000 sq. ft. Under the Google lease, the borrower is required to provide 371 parking spaces to Google at no cost to the tenant.
Direct access from the 1001 North Shoreline Property to the Googleplex headquarters is provided via an all-day shuttle that runs multiple times per hour, as well as a walking and biking path. Additionally, the 1001 North Shoreline Property is also located one mile from the Mountain View CalTrain station. The CalTrain provides access from San Jose to the south, through Mountain View, Palo Alto and Redwood City to downtown San Francisco. The Mountain View station is one of four stations in Silicon Valley that is serviced by the “Baby Bullet”, a high-speed train that stops at only four locations south of San Francisco and thus provides faster commuting times for employees traveling from the San Francisco area.
Google executed its lease at the end of 2015 and took possession of the building in late 2017. Google is still in the process of carrying out the tenant improvement build-out, and has indicated an expected move in date of June 15, 2018. The tenant improvement build-out began in late November 2017, and the remaining work consists of finishing floors and walls, installing fixtures and making other upgrades to the interior of the building. At closing, approximately $5.7 million was deposited into an outstanding tenant improvement reserve, which represents the remaining tenant improvement allowance owed to Google per their lease.
The 1001 North Shoreline Property contains approximately 5.64 acres of unentitled land (which includes the parking lot and unimproved land), and the borrower sponsor has represented that they will likely pursue entitlements and a subdivision of the 1001 North Shoreline Property to allow for the development of multifamily buildings (consisting of rental and/or condominium units) on such land. The Loan Agreement allows for a free release of this land from the lien of the 1001 North Shoreline Whole Loan so long as certain conditions are met (see the “Partial Release” section herein).
THE INFORMATION IN THIS STRUCTURAL AND COLLATERAL TERM SHEET IS NOT COMPLETE AND MAY BE AMENDED PRIOR TO THE TIME OF SALE. THIS TERM SHEET IS NOT AN OFFER TO SELL THESE SECURITIES AND IT IS NOT A SOLICITATION OF AN OFFER TO BUY THESE SECURITIES IN ANY JURISDICTION WHERE THE OFFER OR SALE IS NOT PERMITTED.
46
1001 North Shoreline Boulevard Mountain View, CA 95051 |
Collateral Asset Summary – Loan No. 4 1001 North Shoreline Boulevard |
Cut-off Date Balance: Cut-off Date LTV: U/W NCF DSCR: U/W NOI Debt Yield: |
$64,450,000 37.7% 3.52x 12.4% |
Major Tenant.
Google LLC (123,374 sq. ft.; 100.0% of NRA; 100.0% of U/W Base Rent, Aa2/AA+ by Moody’s/S&P) Google LLC (“Google”) is a global technology company. Google’s web search website is highly trafficked and its brand is widely known. The company provides its products and services, such as Search, Maps, Ads, Gmail, Android, Chrome and YouTube, in approximately 100 languages and in 50 countries, regions and territories.
On October 2, 2015, Google announced plans to create a new public holding company, Alphabet Inc. (“Alphabet”). Alphabet is now the second largest publicly traded company (NASDAQ: GOOG) in the world as measured by market capitalization and is rated Aa2 and AA+ by Moody’s and S&P, respectively. Under the new operating structure, its main Google business will include Search, Maps, Ads, Apps, YouTube and Android and the related technical infrastructure. Google represents over 99.0% of Alphabet’s total revenues. Google’s revenues come from advertising, sales of digital content products, hardware sales and licensing.
Google has two seven-year extension options at fair market value, with 13 months prior notice. Google does not have any early termination options.
Environmental Matters. The Phase I environmental report dated December 15, 2017 identified two controlled recognized environmental conditions related to volatile organic compounds in soil gas and groundwater, and the prior use of a neutralization sump at the 1001 North Shoreline Property. At loan origination, the borrower purchased an environmental policy through March 15, 2028, with a four-year policy tail period (which has been paid for in full for the full term, including tail period). See “Description of the Mortgage Pool—Environmental Considerations” in the Preliminary Prospectus.
The Market. The 1001 North Shoreline Property is located in Mountain View, California, within Silicon Valley. Silicon Valley encompasses 1,740 square miles of land and is comprised of San Mateo County and Santa Clara County, with professional and business services accounting for 21.8% of employment. Silicon Valley is home to 12 Fortune 500 corporations, including Apple Inc., Hewlett-Packard Company, Google/Alphabet, Intel Corporation, Cisco Systems, Oracle Corporation, Synnex, Applied Materials, EBay, Symantec, Sanmina-SCI Corporation and NetApp. Google, Inc. is Silicon Valley’s largest private employer. The Greater Silicon Valley office market, totaling 115.3 million sq. ft., encompasses both the Silicon Valley and San Francisco Peninsula markets. The majority of the office space, 80.9 million sq. ft. (70.2%), is located in the Silicon Valley office market. As of the third quarter 2017, the overall vacancy rate in Greater Silicon Valley was 11.8%, up from 11.2% in the prior quarter. Employment growth in Silicon Valley over the last decade exceeded growth in the United States. Silicon Valley’s annual average employment growth was 3.8% between 2012 and 2016, the most in a decade. The unemployment rate of 3.6% as of March 2017 for the San Jose-Sunnyvale-Santa Clara metropolitan statistical area was down slightly from 4.1% a year prior to that, and below California’s unemployment rate of 5.1% and the U.S. unemployment rate of 4.6%. According to the appraisal, Silicon Valley has an average household income of $140,432.
Approximately 5.5 million sq. ft. of new office space was completed in the third quarter of 2017 in Greater Silicon Valley (approximately 4.9 million sq. ft. in Silicon Valley and 588,000 sq. ft. along the Peninsula). In Silicon Valley, new product under construction stands at approximately 2.6 million sq. ft., with 666,000 sq. ft. of that build-to-suit space and 2.0 million sq. ft. of speculative space. After several years of construction, the Apple Park was delivered in the Cupertino submarket in the second quarter of 2017. The primary building is 2.8 million sq. ft. and there are several associated new research and development buildings on the campus, bringing the total size to 3.4 million sq. ft.
Mountain View encompasses approximately 12 square miles and is home to approximately 73,000 people. The city is situated between the Santa Cruz Mountains and San Francisco Bay, 10 miles north of San Jose and 35 miles south of San Francisco. Mountain View is bordered by Palo Alto, Los Altos and Sunnyvale. According to a third party market research report, as of the fourth quarter of 2017, the Mountain View submarket has approximately 8.7 million sq. ft. of Class A office space, with an overall vacancy of 5.5% and average rents of $72.00 PSF NNN. Rents in Mountain View have increased since 2011 in large part due to the growth of Google and other blue-chip technology firms such as LinkedIn and Tesla. Additionally, Mountain View is in proximity to nearby universities such as Stanford University, Santa Clara University and San Jose State University.
According to a third party market research report, the 1001 North Shoreline Property is located in the Shoreline Corridor South submarket, which has approximately 346,929 sq. ft. of office space as of year-end 2017. Historical vacancy in the submarket has ranged between 0.3% and 9.6% from 2008 to 2016, but the delivery of 111,443 sq. ft. of Class A office space in 2017 generated an approximately 47.3% increase in inventory, and caused the vacancy rate to increase to approximately 35.9%. Additionally, the 1001 North Shoreline Property is located on the border of the Shoreline Corridor North submarket, which includes the Google headquarters building. As of year-end 2017, the Shoreline Corridor North submarket has approximately 2.6 million sq. ft. of office space with approximately half owned or leased by Google. According to a third party research report, the Shoreline Corridor North submarket has had 0.0% vacancy since 2011.
The appraiser identified five comparable office leases ranging in size from 21,084 sq. ft. to 220,156 sq. ft. All are located in buildings similar in class and located in the same market as the 1001 North Shoreline Property. The comparable leases have terms ranging from five to 15 years, with an average rental rate of $65.56 PSF. Based on the existing lease and the comparable analysis, the appraiser
THE INFORMATION IN THIS STRUCTURAL AND COLLATERAL TERM SHEET IS NOT COMPLETE AND MAY BE AMENDED PRIOR TO THE TIME OF SALE. THIS TERM SHEET IS NOT AN OFFER TO SELL THESE SECURITIES AND IT IS NOT A SOLICITATION OF AN OFFER TO BUY THESE SECURITIES IN ANY JURISDICTION WHERE THE OFFER OR SALE IS NOT PERMITTED.
47
1001 North Shoreline Boulevard Mountain View, CA 95051 |
Collateral Asset Summary – Loan No. 4 1001 North Shoreline Boulevard |
Cut-off Date Balance: Cut-off Date LTV: U/W NCF DSCR: U/W NOI Debt Yield: |
$64,450,000 37.7% 3.52x 12.4% |
concluded to a market rent of $69.00 PSF for the 1001 North Shoreline Property. The current rent of $60.00 PSF is approximately 13.0% below the appraiser’s concluded market rent. The following table represents comparable market leases:
| Comparable Office Leases(1) | ||||||
| Property Name | City, State | Tenant Name | Lease Start Date | GLA (sq. ft.) |
Lease Term (years) | Initial Rent PSF |
| 1001 North Shoreline Property(2) | Mountain View, CA | Google LLC | Mar-2018 | 123,374 | 12.0 | $60.00 |
| 2850 Delaware Street | San Mateo, CA | Guidewire | Jan-2018 | 189,000 | 10.4 | $60.60 |
| 2000 University Avenue | East Palo Alto, CA | DLA Piper | Sept-2017 | 118,821 | 5.0 | $85.20 |
| 2535 Augustine Drive | Santa Clara, CA | Hitachi | Dec-2017 | 220,156 | 10.1 | $42.20 |
| 100 Independence Drive | Menlo Park, CA | Aug-2017 | 205,222 | 15.0 | $72.00 | |
| 2440 El Camino Real | Mountain View, CA | GetGo Inc. | May-2017 | 21,084 | 6.0 | $67.80 |
| (1) | Source: Appraisal. |
| (2) | Based on the underwritten rent roll as of May 6, 2018. |
The appraiser identified five comparable office sales for the 1001 North Shoreline Property. The appraiser did not include a vacancy and collection loss for the 1001 North Shoreline Property and analyzed the comparable sales with no vacancy applied. The following table represents the comparable sales identified by the appraiser:
Office Building Sales Comparables(1) | |||||
| Property Name | City, State | Rentable Area (Sq. Ft.) |
Sale Date | Sale Price | Price PSF |
| 1001 North Shoreline Property | Mountain View, CA | 123,374 | Mar-2018 | $171,000,000(2) | $1,386 |
| 385 Sherman Avenue | Palo Alto, CA | 67,974 | Jan-2018 | $138,000,000 | $2,030 |
| 1450 Page Mill Road | Palo Alto, CA | 77,814 | Jun-2017 | $85,300,000 | $1,096 |
| 275 Middlefield Road | Menlo Park, CA | 145,600 | Nov-2016 | $175,250,000 | $1,204 |
| 100 View Street | Mountain View, CA | 42,876 | Apr-2016 | $55,000,000 | $1,283 |
| 100-150-200 West Evelyn Avenue | Mountain View, CA | 114,809 | Nov-2015 | $148,500,000 | $1,293 |
| (1) | Source: Appraisal. |
| (2) | Based on the “As Stabilized” Appraised Value. The actual sale price was $169,946,278 ($1,377 PSF), and actual sale price net of an approximately $5.7 million credit provided by the seller for a tenant improvement allowance was $164,220,219 ($1,331 PSF). |
Cash Flow Analysis.
| Cash Flow Analysis(1) | ||
| U/W | U/W PSF | |
| Base Rent | $7,402,440 | $60.00 |
| Credit Tenant Step Rents(2) | 1,338,210 | 10.85 |
| Value of Vacant Space | 0 | 0.00 |
| Gross Potential Rent | $8,740,650 | $70.85 |
| Total Recoveries | 2,463,728 | 19.97 |
| Other Income | 0 | 0.00 |
| Less: Vacancy(3) | (560,219) | (4.54) |
| Effective Gross Income | $10,644,159 | $86.28 |
| Total Variable Expenses | 615,423 | 4.99 |
| Total Fixed Expenses | 2,061,630 | 16.71 |
| Net Operating Income | $7,967,106 | $64.58 |
| TI/LC | 0 | 0.00 |
| Capital Expenditures | 0 | 0.00 |
| Net Cash Flow | $7,967,106 | $64.58 |
| (1) | The 1001 North Shoreline Property was built in 2017. As such, historical occupancy and historical NOI are not available |
| (2) | Credit Tenant Step Rents are the straight line average of contractual rent steps for Google through the term of the 1001 North Shoreline Whole Loan. |
| (3) | U/W Vacancy is underwritten to 5.0%, which is greater than the stabilized vacancy conclusion per the appraisal (0.0%). The 1001 North Shoreline Property is 100.0% leased by Google. |
THE INFORMATION IN THIS STRUCTURAL AND COLLATERAL TERM SHEET IS NOT COMPLETE AND MAY BE AMENDED PRIOR TO THE TIME OF SALE. THIS TERM SHEET IS NOT AN OFFER TO SELL THESE SECURITIES AND IT IS NOT A SOLICITATION OF AN OFFER TO BUY THESE SECURITIES IN ANY JURISDICTION WHERE THE OFFER OR SALE IS NOT PERMITTED.
48
1001 North Shoreline Boulevard Mountain View, CA 95051 |
Collateral Asset Summary – Loan No. 4 1001 North Shoreline Boulevard |
Cut-off Date Balance: Cut-off Date LTV: U/W NCF DSCR: U/W NOI Debt Yield: |
$64,450,000 37.7% 3.52x 12.4% |
Property Management. The 1001 North Shoreline Property is self-managed by Google.
Lockbox / Cash Management. The 1001 North Shoreline Whole Loan is structured with a hard lockbox with springing cash management. All rents are required to be directly deposited by the tenants of the 1001 North Shoreline Property into a clearing account controlled by the lender. So long as no Trigger Event (as defined below) has occurred and is then continuing, all sums deposited into the clearing account will be transferred into the borrower’s operating account on a daily basis. Following the occurrence of a Trigger Event and while such Trigger Event is then continuing, all sums in the clearing account are required to be transferred on a daily basis to an account controlled by the lender, at a financial institution selected by the lender, to be applied to payments as directed by the 1001 North Shoreline Whole Loan documents. During the continuance of a Trigger Event, all excess funds are required to be swept (i) if a Lease Sweep Period (as defined below) is continuing, into a lease sweep reserve and (ii) in the case of any other Trigger Event, into an account to be held as additional collateral for the 1001 North Shoreline Whole Loan during such Trigger Event.
A “Trigger Event” will commence upon the occurrence of (i) an event of default, (ii) a Low Debt Service Period (as defined below), (iii) a Lease Sweep Period (as defined below) or (iv) the anticipated repayment date, and will end upon (a) with respect to clause (i), the date on which such event of default is cured and such cure is accepted by the lender, (b) with respect to clause (ii), the date on which the Low Debt Service Period has ended, (c) with respect to clause (iii) such Lease Sweep Period has ended and (d) with respect to clause (iv) the date on which the 1001 North Shoreline Whole Loan is paid in full.
A “Low Debt Service Period” (i) will commence if, as of the last day of each calendar quarter, the actual debt service coverage ratio on the 1001 North Shoreline Whole Loan falls below 1.40x, and (ii) will end when the actual debt service coverage ratio is at least 1.45x for two consecutive calendar quarters, provided that for so long that the 1001 North Shoreline Property is leased entirely to a single tenant and such tenant (or its parent entity) maintains an investment grade rating (“BBB-” or equivalent) from at least two of Fitch, Inc., Moody’s Investors Service, Inc. and Standard & Poor’s Ratings Group, a division of the McGraw-Hill Companies (an “Investment Grade Entity”), the debt service coverage ratio will not be tested and a Low Debt Service Period will in no event commence.
A “Lease Sweep Period” will commence (a) upon the first monthly payment date (provided such monthly payment date is prior to the ARD) following any of the following: (i) March 31, 2029 with respect to the Google Lease, or the date that is 12 months prior to the expiration of a Lease Sweep Lease (as defined below) or (ii) upon the date required under the Lease Sweep Lease by which the tenant under such Lease Sweep Lease is required to give notice of its exercise of a renewal option thereunder (and such renewal has not been so exercised); (b) upon the early termination, early cancellation or early surrender of a Lease Sweep Lease (or a notice from the tenant under such Lease Sweep Lease that it will be terminating its lease), (c) solely during a period when the tenant under such Lease Sweep Lease (or its parent company) is not an Investment Grade Entity, if the tenant has ceased operating its business or goes dark at substantially all of its space at the 1001 North Shoreline Property, (d) upon a bankruptcy or insolvency or similar proceeding or action of a tenant under a Lease Sweep Lease or its parent, or (e) upon the date that the tenant under a Lease Sweep Lease (or its parent company) is not an Investment Grade Entity.
A Lease Sweep Period will end upon the earliest to occur of: (i) in the case of clauses (a), (b) or (c) above, all or a portion of the 1001 North Shoreline Property has been re-tenanted pursuant to one or more qualified leases such that the debt service coverage ratio exceeds 1.40x at such time and, in lender’s reasonable judgment, sufficient funds have been accumulated in a lease sweep reserve to cover all anticipated tenant improvement and leasing commissions and free and/or abated rent in connection therewith (and any operating shortfalls relating to the delay in the commencement of full rent payments), or (ii) in the case of clause (a) above, the applicable Lease Sweep Lease has been renewed pursuant to its terms and, in the lender’s reasonable judgment, sufficient funds have been accumulated in a lease sweep reserve to cover all anticipated tenant improvement and leasing commissions and free and/or abated rent in connection therewith, or (iii) in the case of clause (b) above, such termination option is not validly exercised or is waived in writing by the tenant, (iv) in the case of clause (c) or (e) above, the tenant under the Lease Sweep Lease (or its parent) has its rating restored to at least BBB- by the relevant rating agencies or (iv) in the case of clause (d) above, either (X) the applicable Lease Sweep Lease bankruptcy, insolvency or similar proceeding has terminated and the applicable Lease Sweep Lease has been affirmed, assumed or assigned in a manner reasonably satisfactory to the lender or (Y) the applicable Lease Sweep Lease has been assumed and assigned to a third party in a manner reasonably satisfactory to the lender or (v) in the case of any of clauses (a) through (e) above, an amount equal to $50.00 PSF of the applicable Lease Sweep Lease space has been funded into a lease sweep reserve (or such greater amount as determined by lender if any new leases require tenant improvements, free rent, or other leasing expenses in excess of $50.00 PSF).
A “Lease Sweep Lease” means either the Google lease or any replacement lease or leases to any one tenant or group of affiliated tenants covering at least 60,000 sq. ft. of space currently demised under such Google lease.
Initial Reserves. At loan origination, the borrower deposited $5,726,059 into an outstanding tenant improvement reserve to be used for the remaining tenant improvement work on the Google space.
Ongoing Reserves. The borrower’s requirement to make monthly deposits equal to 1/12 of estimated annual taxes into a real estate tax reserve is waived so long as (i) there is no event of default, (ii) the Lease Sweep Lease remains in full force and effect, (iii) the tenant under the Lease Sweep Lease (or its parent company) remains an Investment Grade Entity and (iv) the borrower provides evidence (at lender’s request) that all taxes are paid on time.
THE INFORMATION IN THIS STRUCTURAL AND COLLATERAL TERM SHEET IS NOT COMPLETE AND MAY BE AMENDED PRIOR TO THE TIME OF SALE. THIS TERM SHEET IS NOT AN OFFER TO SELL THESE SECURITIES AND IT IS NOT A SOLICITATION OF AN OFFER TO BUY THESE SECURITIES IN ANY JURISDICTION WHERE THE OFFER OR SALE IS NOT PERMITTED.
49
1001 North Shoreline Boulevard Mountain View, CA 95051 |
Collateral Asset Summary – Loan No. 4 1001 North Shoreline Boulevard |
Cut-off Date Balance: Cut-off Date LTV: U/W NCF DSCR: U/W NOI Debt Yield: |
$64,450,000 37.7% 3.52x 12.4% |
The borrower’s requirement to make monthly deposits equal to 1/12 of estimated annual insurance premiums into an insurance premiums reserve is waived so long as (i) there is no event of default, (ii) the Lease Sweep Lease remains in full force and effect, (iii) the tenant under the Lease Sweep Lease (or its parent company) remains an Investment Grade Entity, and (iv) the borrower provides evidence (at lender’s request) that all insurance premiums are paid on time.
The borrower’s requirement to make monthly deposits equal to $2,570.29 (subject to a reserve cap of $61,687) into a replacement reserve is waived so long as (i) there is no event of default, (ii) the Lease Sweep Lease remains in full force and effect and (iii) the tenant under the Lease Sweep Lease (or its parent company) remains an Investment Grade Entity.
The borrower’s requirement to make monthly deposits equal to $35,521.04 (subject to a reserve cap of $852,505) into a tenant improvement and leasing commissions reserve is waived so long as (i) there is no event of default, (ii) the Lease Sweep Lease remains in full force and effect and (iii) the tenant under the Lease Sweep Lease (or its parent company) remains an Investment Grade Entity.
Current Mezzanine or Subordinate Indebtedness. The 1001 North Shoreline Whole Loan includes a subordinate Note B with an original principal balance of $46,050,000. Note B is interest only through the term of the 1001 North Shoreline Whole Loan and carries an initial interest rate of 5.5000% per annum. The holders of the 1001 North Shoreline Senior Note and the Note B entered into a co-lender agreement that provides for the holder of the Note B to have consent rights, cure rights and the right to purchase the 1001 North Shoreline Senior Note if defaulted. The Note B was originated by Deutsche Bank AG, acting through its New York Branch, and is expected to be sold to a third party purchaser.
Future Mezzanine or Subordinate Indebtedness Permitted. None.
Partial Release. At any time, the borrower may obtain the release of an approximately 5.64 acre parcel at the 1001 North Shoreline Property that is comprised of a parking lot and unimproved land (the “Release Parcel”); provided, among other things, (i) no event of default has occurred and is continuing, (ii) the loan to value ratio for the 1001 North Shoreline Whole Loan based on the remaining 1001 North Shoreline Property is no greater than 65.0%; provided that in the event the loan to value ratio is greater than 65.0%, the borrower is required to either (1) prepay the loan by an amount that, when applied to the outstanding principal balance, would cause the loan to value ratio to be no greater than 65.0%, together with a yield maintenance premium or (2) if the release occurs after the expiration of the defeasance lockout period, the borrower may partially defease the loan in an amount that, when applied to the outstanding principal balance, would cause the loan to value ratio to be no greater than 65.0%, (iii) the Release Parcel is legally subdivided from the remaining 1001 North Shoreline Property, (iv) the borrower enters into a reciprocal easement agreement, subject to the lender’s reasonable approval, which allows access from the remaining 1001 North Shoreline Property to the Release Parcel with a parking area for Google on the Release Parcel that satisfies the Google lease requirement and all legal and zoning requirements, (v) evidence that the release does not violate the Google lease and (vi) an anti-poaching agreement must be put in place between the remaining 1001 North Shoreline Property and the Release Parcel prohibiting the transferee of the Release Parcel from soliciting Google to relocate from the remaining 1001 North Shoreline Property to any newly constructed buildings on the Release Parcel; however, this anti-poaching agreement will not prohibit Google from having an unsolicited right of first offer to lease any commercial office space, which is an option under Google’s lease. The Release Parcel was assigned a value of $10,600,000 in the appraisal obtained in connection with origination of the 1001 North Shoreline Whole Loan. Such appraised value was based on numerous assumptions, including a deduction of (i) costs for constructing a parking garage on the Release Parcel to provide the parking spaces under the lease requirement and (ii) costs of obtaining a zoning entitlement and utilities for multifamily development.
THE INFORMATION IN THIS STRUCTURAL AND COLLATERAL TERM SHEET IS NOT COMPLETE AND MAY BE AMENDED PRIOR TO THE TIME OF SALE. THIS TERM SHEET IS NOT AN OFFER TO SELL THESE SECURITIES AND IT IS NOT A SOLICITATION OF AN OFFER TO BUY THESE SECURITIES IN ANY JURISDICTION WHERE THE OFFER OR SALE IS NOT PERMITTED.
50
(THIS PAGE INTENTIONALLY LEFT BLANK)
51
3 Mitchell Place New York, NY 10017 |
Collateral Asset Summary – Loan No. 5 Beekman Tower |
Cut-off Date Balance: Cut-off Date LTV: U/W NCF DSCR: U/W NOI Debt Yield: |
$63,000,000 43.2% 1.60x 7.6% |

THE INFORMATION IN THIS STRUCTURAL AND COLLATERAL TERM SHEET IS NOT COMPLETE AND MAY BE AMENDED PRIOR TO THE TIME OF SALE. THIS TERM SHEET IS NOT AN OFFER TO SELL THESE SECURITIES AND IT IS NOT A SOLICITATION OF AN OFFER TO BUY THESE SECURITIES IN ANY JURISDICTION WHERE THE OFFER OR SALE IS NOT PERMITTED.
52
3 Mitchell Place New York, NY 10017 |
Collateral Asset Summary – Loan No. 5 Beekman Tower |
Cut-off Date Balance: Cut-off Date LTV: U/W NCF DSCR: U/W NOI Debt Yield: |
$63,000,000 43.2% 1.60x 7.6% |

THE INFORMATION IN THIS STRUCTURAL AND COLLATERAL TERM SHEET IS NOT COMPLETE AND MAY BE AMENDED PRIOR TO THE TIME OF SALE. THIS TERM SHEET IS NOT AN OFFER TO SELL THESE SECURITIES AND IT IS NOT A SOLICITATION OF AN OFFER TO BUY THESE SECURITIES IN ANY JURISDICTION WHERE THE OFFER OR SALE IS NOT PERMITTED.
53
3 Mitchell Place New York, NY 10017 |
Collateral Asset Summary – Loan No. 5 Beekman Tower |
Cut-off Date Balance: Cut-off Date LTV: U/W NCF DSCR: U/W NOI Debt Yield: |
$63,000,000 43.2% 1.60x 7.6% |
| Mortgage Loan Information | |
| Loan Seller: | LCM |
| Loan Purpose: | Refinance |
| Borrower Sponsors: | Yakov Yakubov; Thomas Yakubaros; Yakubov US Trust 2013 |
| Borrower: | Beekman Towers Holdings, LLC |
| Original Balance: | $63,000,000 |
| Cut-off Date Balance: | $63,000,000 |
| % by Initial UPB: | 6.3% |
| Interest Rate: | 4.6335% |
| Payment Date: | 6th of each month |
| First Payment Date: | August 6, 2017 |
| Maturity Date: | April 6, 2028 |
| Amortization: | Interest Only |
| Additional Debt: | None |
| Call Protection: | L(34), D(92), O(3) |
| Lockbox / Cash Management: | Soft / Springing |
| Reserves(1) | ||
| Initial | Monthly | |
| Taxes: | $345,200 | $172,600 |
| Insurance: | $74,400 | $18,600 |
| Replacement: | $0 | $5,933 |
| Financial Information | |||
| Cut-off Date Balance / Unit: | $353,933 | ||
| Balloon Balance / Unit: | $353,933 | ||
| Cut-off Date LTV: | 43.2% | ||
| Balloon LTV: | 43.2% | ||
| Underwritten NOI DSCR: | 1.62x | ||
| Underwritten NCF DSCR: | 1.60x | ||
| Underwritten NOI Debt Yield: | 7.6% | ||
| Underwritten NCF Debt Yield: | 7.5% | ||
| Underwritten NOI Debt Yield at Balloon: | 7.6% | ||
| Underwritten NCF Debt Yield at Balloon: | 7.5% | ||
| Property Information | |
| Single Asset / Portfolio: | Single Asset |
| Property Type: | High-Rise Multifamily |
| Collateral: | Fee Simple |
| Location: | New York, NY |
| Year Built / Renovated: | 1928 / 2014 |
| Total Units: | 178 |
| Property Management: | Reside Worldwide Management Service, Inc. |
| Underwritten NOI: | $4,795,740 |
| Underwritten NCF: | $4,724,540 |
| Appraised Value: | $146,000,000 |
| Appraisal Date: | March 20, 2018 |
| Historical NOI | |
| Most Recent NOI(2): | $4,881,094 (T-9 December 31, 2017 Ann.) |
| 2017 NOI(2): | $4,054,610 (December 31, 2017) |
| 2016 NOI: | $2,815,801 (December 31, 2016) |
| 2015 NOI(3): | $1,956,050 (December 31, 2015) |
| Historical Occupancy(4) | |
| Most Recent Occupancy: | 84.8% (T-9 December 31, 2017 Ann.) |
| 2017 Occupancy: | 80.9% (December 31, 2017) |
| 2016 Occupancy: | NAP |
| 2015 Occupancy: | NAP |
| (1) | See “Initial Reserves” and “Ongoing Reserves” herein. |
| (2) | The Beekman Tower Property was in ramp up during the first quarter of the 2017 calendar year. |
| (3) | 2015 NOI represents figures for only July through December 2015. No amounts were recorded prior to July 2015 as the Beekman Tower Property was vacant when purchased. |
| (4) | The Beekman Tower Property was purchased vacant in July 2015 after a full renovation. The borrower did not track occupancy until calendar year 2017. As such, historical occupancy prior to calendar year 2017 is not available. |
THE INFORMATION IN THIS STRUCTURAL AND COLLATERAL TERM SHEET IS NOT COMPLETE AND MAY BE AMENDED PRIOR TO THE TIME OF SALE. THIS TERM SHEET IS NOT AN OFFER TO SELL THESE SECURITIES AND IT IS NOT A SOLICITATION OF AN OFFER TO BUY THESE SECURITIES IN ANY JURISDICTION WHERE THE OFFER OR SALE IS NOT PERMITTED.
54
3 Mitchell Place New York, NY 10017 |
Collateral Asset Summary – Loan No. 5 Beekman Tower |
Cut-off Date Balance: Cut-off Date LTV: U/W NCF DSCR: U/W NOI Debt Yield: |
$63,000,000 43.2% 1.60x 7.6% |
The Loan. The Beekman Tower loan (the “Beekman Tower Loan”) is a fixed rate loan secured by the borrower’s fee simple interest in a 178-unit, high-rise apartment property located at 3 Mitchell Place in New York, New York (the “Beekman Tower Property”) with a current principal balance of $63.0 million. The Beekman Tower Loan has an approximately 11-year term and requires interest only payments for the term of the loan. The Beekman Tower Loan accrues interest at a fixed rate equal to 4.6335% and has a Cut-off Date Balance of $63.0 million. The Beekman Tower Loan proceeds, along with approximately $14.9 million of borrow sponsor equity, were used to retire previous debt of approximately $75.2 million, fund reserves of approximately $420,000 and pay closing costs of approximately $2.2 million. Based on the appraised value of $146.0 million as of March 20, 2018, the Cut-off Date LTV is 43.2%. The most recent prior financing of the Beekman Tower Property was not included in a securitization.
| Sources and Uses | ||||||
| Sources | Proceeds | % of Total | Uses | Proceeds | % of Total | |
| Mortgage Loan | $63,000,000 | 80.9% | Loan Payoff | $75,201,700 | 96.6% | |
| Borrower Sponsor Equity | $14,850,617 | 19.1% | Closing Costs | $2,229,317 | 2.9% | |
| Upfront Reserves | $419,600 | 0.5% | ||||
| Total Sources | $77,850,617 | 100.0% | Total Uses | $77,850,617 | 100.0% | |
The Borrower / Borrower Sponsors. The borrower, Beekman Towers Holdings, LLC, is a single purpose Delaware limited liability company structured to be bankruptcy-remote with two independent directors in its organizational structure. The sponsors of the borrower and the non-recourse carve-out guarantors are Yakov Yakubov, Thomas Yakubaros and the Yakubov US Trust 2013, on a joint and several basis.
The Yakubov family has over 30 years of experience developing, managing and investing in various types of real estate assets throughout the Russian Federation and the United States. The family’s United States real estate portfolio consists of approximately 5.0 million sq. ft. of retail, residential and office properties.
The Property. The Beekman Tower Property is a landmarked, 178-unit, interconnected 26-story and 10-story apartment complex located on the northeast corner of First Avenue and Mitchell Place in the Turtle Bay neighborhood of Midtown Manhattan, approximately one block north from the United Nations building. Completed in 1928, the Beekman Tower Property underwent an extensive renovation in 2014 totaling approximately $24.2 million ($136,230 per unit) which converted the Beekman Tower Property from a transient hotel to a luxury residential building with furnished corporate housing units that can accommodate demand from the United Nations building and other corporate users, furnished short-term units that can accommodate extended-stay users, as well as traditional long-term unfurnished rentals (which can be rented furnished for an additional charge). The borrower sponsors purchased the Beekman Tower Property vacant in July 2015 for $138,850,000, following the completion of the prior owner’s $24.2 million renovation. A summary and breakdown of the renovation costs at the Beekman Tower Property are provided in the chart below.
| Renovation Costs(1) | ||
| Item | Total | Per Unit |
| FF&E | $4,488,748 | $25,218 |
| Wall / Ceiling Finishes | $3,820,105 | $21,461 |
| Mechanicals / Electrical / Plumbing | $3,222,865 | $18,106 |
| Exterior Façade Replacements | $2,064,047 | $11,596 |
| Cabinetry / Other Carpentry | $2,001,834 | $11,246 |
| Elevator Replacement | $1,856,477 | $10,430 |
| Lobby Renovations | $1,645,334 | $9,243 |
| Appliances | $1,340,397 | $7,530 |
| Flooring | $1,162,667 | $6,532 |
| BOH / Life Safety Improvements | $957,247 | $5,378 |
| Demolition | $426,463 | $2,396 |
| Information Technology | $392,918 | $2,207 |
| Doors and Hardware | $333,123 | $1,871 |
| Fitness and Business Centers | $285,173 | $1,602 |
| Laundry Room | $251,500 | $1,413 |
| Total | $24,248,898 | $136,230 |
| (1) | Source: Borrower. |
Of the 178 units, a maximum of 24 furnished units are rented as short-term extended-stay with the remaining units divided between corporate housing furnished units and traditional long-term unfurnished units (which can be rented furnished for an additional charge). The number of corporate units and long-term units shifts monthly based on demand for each segment. For the calendar year 2017, the number of corporate units and long-term units averaged 97 and 57, respectively. The short-term units are typically reserved for the lower floors, the corporate users tend to occupy the five middle floors and the long-term traditional residential units tend to be located on the top floors. The borrower sponsors typically maintain full floors dedicated to one type of tenant. The Beekman Tower Property’s unit mix
THE INFORMATION IN THIS STRUCTURAL AND COLLATERAL TERM SHEET IS NOT COMPLETE AND MAY BE AMENDED PRIOR TO THE TIME OF SALE. THIS TERM SHEET IS NOT AN OFFER TO SELL THESE SECURITIES AND IT IS NOT A SOLICITATION OF AN OFFER TO BUY THESE SECURITIES IN ANY JURISDICTION WHERE THE OFFER OR SALE IS NOT PERMITTED.
55
3 Mitchell Place New York, NY 10017 |
Collateral Asset Summary – Loan No. 5 Beekman Tower |
Cut-off Date Balance: Cut-off Date LTV: U/W NCF DSCR: U/W NOI Debt Yield: |
$63,000,000 43.2% 1.60x 7.6% |
is comprised of 59 studio units averaging 439 sq. ft., 115 one-bedroom units averaging 672 sq. ft., three two-bedroom units averaging 1,109 sq. ft. and one, 1,743 sq. ft. three-bedroom unit.
| Unit Mix Summary(1) | ||||
| Unit Configuration | # of Units |
% of Total | Average
Unit Size (Sq. Ft.) | |
| Studio | 59 | 33.1% | 439 | |
| One-Bedroom | 115 | 64.6% | 672 | |
| Two-Bedroom | 3 | 1.7% | 1,109 | |
| Three-Bedroom | 1 | 0.6% | 1,743 | |
| Total / Wtd. Avg. | 178 | 100.0% | 608 | |
| (1) | Source: Borrower. |
| Occupancy and Rent By Unit Type(1)(2) | |||||||||
| 2017 | T-9 12/31/2017 Ann. | ||||||||
| Unit Type(3)(4) | Avg.
# of Units |
Avg. Occupancy |
Avg.
Monthly Rent per Unit |
Avg.
Monthly Rent per Occupied Unit |
Avg.
# of Units |
Avg. Occupancy |
Avg.
Monthly Rent per Unit |
Avg.
Monthly Rent per Occupied Unit | |
| Corporate Units | 97 | 80.9% | $4,432 | $5,376 | 92 | 86.1% | $4,953 | $5,707 | |
| Long-term Units | 57 | 83.0% | $3,360 | $4,054 | 62 | 85.3% | $3,396 | $3,987 | |
| Short-term Units | 24 | 79.9% | $5,422 | $6,788 | 24 | 80.1% | $5,954 | $7,443 | |
| Total / Avg. | 178 | 80.9% | $4,192 | $5,127 | 178 | 84.8% | $4,571 | $5,361 | |
| (1) | Source: Borrower. |
| (2) | The borrower did not track occupancy until calendar year 2017. |
| (3) | Prior to calendar year 2017, income was not broken out by unit type. |
| (4) | Corporate units include units leased by a single corporate user or an employer for use by employees for varying terms, long-term units are generally leased for a term of six months to two years and short-term units are generally leased for a term of anywhere from one day to 120 days. |
In addition to the 178 residential units, the Beekman Tower Property contains a 4,000 sq. ft. vacant street level commercial space and a 2,500 sq. ft. rooftop lounge with 30 foot ceilings and 360 degree panoramic views of the East River and Midtown skyline, which is fully leased to Beekman Rooftop LLC pursuant to a lease expiring on November 30, 2036. Additional amenities at the Beekman Tower Property include a doorman and concierge, a business center adjacent to a conference room, a fitness center, a laundry room and a housekeeping service that is outsourced with a third party. The vacant street level commercial space is currently zoned for a community related tenant; however, the borrower is pursuing rezoning for a traditional retail tenant which would command higher rents than a community related tenant.
Environmental Matters. The Phase I environmental report, dated June 16, 2017, recommended no further actions at the Beekman Tower Property.
The Market. According to the appraiser, the corporate housing/extended-stay market is a unique segment of the New York City housing market and is concentrated primarily in Manhattan’s Midtown East and Upper East Side neighborhoods. Corporate housing/extended-stay residences provide an alternative to transient hotel accommodations. Although this segment of the industry has existed for several years in New York City, the corporate housing/extended-stay market has seen a greater focus in the past few years. This market was created from a demand by travelers, residents and employees seeking alternative short-term housing and contains attributes of both the residential apartment market and transient hotel market. According to the appraiser, the length of stay for a long-term resident at an extended-stay facility generally exceeds one month and frequently lasts 12 months. The most common term for an interim stay is typically between 90 and 120 days. A summary of the appraiser’s competitive set is provided in the chart below.
| Competitive Set(1) | ||||||
| Name | Beekman
Tower Property |
AKA United Nations | AKA
Sutton Place |
Marmara | Sutton
Court Hotel Residences |
Bristol Plaza |
| Neighborhood | Midtown East | Midtown East | Midtown East | Upper East Side | Midtown East | Upper East Side |
| Number of Units | 178 | 95 | 76 | 109 | 107 | 130 |
| Year Built | 1928 | 1986 | 1929/2006 | 1989 | 1974 | 1987 |
| Facility Amenities | Doorman, concierge, fitness center, business center, roof top lounge | Doorman, concierge, fitness center, business center | Doorman, concierge, fitness center, roof deck, business center | Doorman, concierge, fitness center, business center | Doorman, concierge, fitness center, business center, café | Doorman, concierge, fitness center, roof deck, swimming pool |
| (1) | Source: Appraisal. |
THE INFORMATION IN THIS STRUCTURAL AND COLLATERAL TERM SHEET IS NOT COMPLETE AND MAY BE AMENDED PRIOR TO THE TIME OF SALE. THIS TERM SHEET IS NOT AN OFFER TO SELL THESE SECURITIES AND IT IS NOT A SOLICITATION OF AN OFFER TO BUY THESE SECURITIES IN ANY JURISDICTION WHERE THE OFFER OR SALE IS NOT PERMITTED.
56
3 Mitchell Place New York, NY 10017 |
Collateral Asset Summary – Loan No. 5 Beekman Tower |
Cut-off Date Balance: Cut-off Date LTV: U/W NCF DSCR: U/W NOI Debt Yield: |
$63,000,000 43.2% 1.60x 7.6% |
Cash Flow Analysis.
| Cash Flow Analysis | ||||||
| 2015(1) | 2016 | 2017(2) | T-9 12/31/2017 Ann.(2) | U/W | U/W per Unit | |
| Base Rent Corporate Units(3)(4) | $4,259,804 | $8,104,659 | $5,157,118 | $5,590,448 | $5,590,448 | $31,407 |
| Base Rent Long-Term Units(3)(4) | 0 | 0 | 2,235,028 | 2,457,761 | 2,457,761 | 13,808 |
| Base Rent Short-Term Units(3)(4) | 0 | 0 | 1,561,600 | 1,714,608 | 1,714,608 | 9,633 |
| Gross Up Vacancy | 0 | 0 | 0 | 0 | 1,754,278 | 9,855 |
| Gross Potential Rent | $4,259,804 | $8,104,659 | $8,953,746 | $9,762,817 | $11,517,095 | $64,703 |
| Less: Vacancy, Collection Loss, Concessions(5) | 0 | 0 | 0 | 0 | (1,754,278) | (9,855) |
| Commercial Income(6) | 0 | 0 | 80,000 | 106,667 | 240,000 | 1,348 |
| Total Other Income(7) | 13,939 | 64,915 | 96,480 | 102,895 | 102,895 | 578 |
| Effective Gross Income | $4,273,743 | $8,169,573 | $9,130,225 | $9,972,378 | $10,105,712 | $56,774 |
| Total Expenses | 2,317,693 | 5,353,773 | 5,075,616 | 5,091,284 | 5,309,972 | 29,831 |
| Net Operating Income | $1,956,050 | $2,815,801 | $4,054,610 | $4,881,094 | $4,795,740 | $26,942 |
| Capital Expenditures | 0 | 0 | 0 | 0 | 71,200 | 400 |
| Net Cash Flow | $1,956,050 | $2,815,801 | $4,054,610 | $4,881,094 | $4,724,540 | $26,542 |
| (1) | 2015 represents figures for only July through December 2015. No amounts were recorded prior to July 2015 as the Beekman Tower Property was vacant when purchased. |
| (2) | The Beekman Tower Property was in ramp up during the first quarter of the 2017 calendar year. |
| (3) | U/W Base Rent represents the actual T-9 annualized base rent per unit type for the Beekman Tower Property as of December 31, 2017. |
| (4) | Prior to 2017, income was not broken out by unit type. |
| (5) | U/W Vacancy, Collection Loss, Concessions represents 15.2% of Gross Potential Rent and is equal to 100.0% of the Gross Up Vacancy. |
| (6) | U/W Commercial Income is based on the annual in-place contractual rent under the Beekman Rooftop LLC lease. No income was underwritten for the 4,000 sq. ft. street level commercial space as it is currently vacant as the borrower pursues rezoning for a traditional retail tenant which would command higher rents than a community related tenant. |
| (7) | U/W Total Other Income includes management office lease rent, revenue related to damage, cable revenue and additional cleaning services revenue. |
Property Management. The Beekman Tower Property is managed by Reside Worldwide Management Service, Inc.
Lockbox / Cash Management. The Beekman Tower Loan is structured with a soft lockbox with springing cash management. All rents are required to be deposited into a lockbox account within one business day of receipt by the borrower or property manager. Amounts on deposit in the lockbox account will be transferred daily to an account controlled by the borrower unless a Cash Management Period (as defined below) is continuing. Upon the occurrence of a Cash Management Period, funds in the lockbox account will be swept daily into a lender-controlled account, from which account such funds will be disbursed in accordance with the loan agreement and any excess cash will be retained by the lender as additional collateral for the Beekman Tower Loan.
A “Cash Management Period” will commence (i) upon an event of default or (ii) if the debt yield is less than 6.0% (until such time that the debt yield is greater than or equal to 6.0% for two consecutive quarters).
Initial Reserves. At loan origination, the borrower deposited (i) $345,200 into a tax reserve account and (ii) $74,400 into an insurance reserve account.
Ongoing Reserves. On a monthly basis, the borrower is required to deposit reserves of (i) 1/12 of the estimated annual real estate taxes, which currently equates to $172,600, into a tax reserve account, (ii) 1/12 of the estimated annual insurance premiums into an insurance reserve account, which currently equates to $18,600 and (iii) $5,933 into a replacement reserve account.
Current Mezzanine or Subordinate Indebtedness. None.
Future Mezzanine or Subordinate Indebtedness Permitted. None.
THE INFORMATION IN THIS STRUCTURAL AND COLLATERAL TERM SHEET IS NOT COMPLETE AND MAY BE AMENDED PRIOR TO THE TIME OF SALE. THIS TERM SHEET IS NOT AN OFFER TO SELL THESE SECURITIES AND IT IS NOT A SOLICITATION OF AN OFFER TO BUY THESE SECURITIES IN ANY JURISDICTION WHERE THE OFFER OR SALE IS NOT PERMITTED.
57
721 Pine Street Seattle, WA 98101 |
Collateral Asset Summary – Loan No. 6 Grand Hyatt Seattle |
Cut-off Date Balance: Cut-off Date LTV: U/W NCF DSCR: U/W NOI Debt Yield: |
$50,000,000 54.9% 2.12x 11.8% |

THE INFORMATION IN THIS STRUCTURAL AND COLLATERAL TERM SHEET IS NOT COMPLETE AND MAY BE AMENDED PRIOR TO THE TIME OF SALE. THIS TERM SHEET IS NOT AN OFFER TO SELL THESE SECURITIES AND IT IS NOT A SOLICITATION OF AN OFFER TO BUY THESE SECURITIES IN ANY JURISDICTION WHERE THE OFFER OR SALE IS NOT PERMITTED.
58
721 Pine Street Seattle, WA 98101 |
Collateral Asset Summary – Loan No. 6 Grand Hyatt Seattle |
Cut-off Date Balance: Cut-off Date LTV: U/W NCF DSCR: U/W NOI Debt Yield: |
$50,000,000 54.9% 2.12x 11.8% |

THE INFORMATION IN THIS STRUCTURAL AND COLLATERAL TERM SHEET IS NOT COMPLETE AND MAY BE AMENDED PRIOR TO THE TIME OF SALE. THIS TERM SHEET IS NOT AN OFFER TO SELL THESE SECURITIES AND IT IS NOT A SOLICITATION OF AN OFFER TO BUY THESE SECURITIES IN ANY JURISDICTION WHERE THE OFFER OR SALE IS NOT PERMITTED.
59
721 Pine Street Seattle, WA 98101 |
Collateral Asset Summary – Loan No. 6 Grand Hyatt Seattle |
Cut-off Date Balance: Cut-off Date LTV: U/W NCF DSCR: U/W NOI Debt Yield: |
$50,000,000 54.9% 2.12x 11.8% |
| Mortgage Loan Information | |
| Loan Seller: | LCM |
| Loan Purpose: | Refinance |
| Borrower Sponsor(1): | Hedreen Holdings LLC |
| Borrower: | Hedreen Hotel LLC |
| Original Balance(2): | $50,000,000 |
| Cut-off Date Balance(2): | $50,000,000 |
| % by Initial UPB: | 5.0% |
| Interest Rate: | 4.7400% |
| Payment Date: | 6th of each month |
| First Payment Date: | June 6, 2017 |
| Maturity Date: | June 6, 2027 |
| Amortization: | Interest Only |
| Additional Debt(2): | $83,000,000 Pari Passu Debt |
| Call Protection(3): | L(36), D(81), O(4) |
| Lockbox / Cash Management: | Hard / Springing |
| Reserves(4) | ||
| Initial | Monthly | |
| Taxes: | $0 | Springing |
| Insurance: | $0 | Springing |
| FF&E: | $0 | Springing |
| Financial Information(5) | |
| Cut-off Date Balance / Room: | $291,028 |
| Balloon Balance / Room: | $291,028 |
| Cut-off Date LTV(6): | 54.9% |
| Balloon LTV(6): | 54.9% |
| Underwritten NOI DSCR: | 2.45x |
| Underwritten NCF DSCR: | 2.12x |
| Underwritten NOI Debt Yield: | 11.8% |
| Underwritten NCF Debt Yield: | 10.2% |
| Underwritten NOI Debt Yield at Balloon: | 11.8% |
| Underwritten NCF Debt Yield at Balloon: | 10.2% |
| Property Information | ||
| Single Asset / Portfolio: | Single Asset | |
| Property Type: | Full Service Hospitality | |
| Collateral: | Fee Simple | |
| Location: | Seattle, WA | |
| Year Built / Renovated: | 2001 / 2014 | |
| Total Rooms: | 457 | |
| Property Management: | Hyatt Corporation | |
| Underwritten NOI: | $15,690,855 | |
| Underwritten NCF: | $13,550,974 | |
| “As is” Appraised Value: | $242,300,000 | |
| “As is” Appraisal Date: | March 8, 2017 | |
| “As Stabilized” Appraised Value(6): | $267,000,000 | |
| “As Stabilized” Appraisal Date(6): | April 1, 2021 | |
| Historical NOI | ||
| Most Recent NOI: | $16,018,146 (December 31, 2017) | |
| 2016 NOI: | $15,332,692 (December 31, 2016) | |
| 2015 NOI: | $14,518,134 (December 31, 2015) | |
| 2014 NOI: | $12,233,256 (December 31, 2014) | |
| Historical Occupancy | ||
| Most Recent Occupancy: | 87.4% (December 31, 2017) | |
| 2016 Occupancy: | 85.3% (December 31, 2016) | |
| 2015 Occupancy: | 86.3% (December 31, 2015) | |
| 2014 Occupancy: | 82.4% (December 31, 2014) | |
| (1) | The borrower sponsor is also the borrower sponsor of the mortgage loan identified on Annex A-1 to the Preliminary Prospectus as Hyatt @ Olive 8, which has a Cut-off Date Balance of $78.0 million. |
| (2) | The Original Balance and Cut-off Date Balance of $50.0 million represents the non-controlling Note A-2 which, together with the $50.0 million pari passu controlling Note A-1 and the $33.0 million pari passu non-controlling Note A-3 comprise the Grand Hyatt Seattle Whole Loan with an aggregate original principal amount of $133.0 million. For additional information regarding the pari passu notes, see “The Loan” herein. |
| (3) | The lockout period will be at least 36 payment dates beginning with and including the first payment date of June 6, 2017. Defeasance of the full Grand Hyatt Seattle Whole Loan is permitted after the date that is the earlier to occur of (i) two years after the closing date of the securitization that includes the last pari passu note to be securitized and (ii) November 6, 2020. The assumed lockout period of 36 payments is based on the expected COMM 2018-COR3 securitization closing date in May 2018. The actual lockout period may be longer. |
| (4) | See “Initial Reserves” and “Ongoing Reserves” herein. |
| (5) | DSCR, LTV, Debt Yield, and Balance / Room calculations are based on the aggregate Grand Hyatt Seattle Whole Loan balance of $133.0 million. |
| (6) | The “As Stabilized” Appraised Value assumes the Grand Hyatt Seattle Property has achieved a stabilized occupancy of 84.0% and an ADR of $291.66. Based on the “As Stabilized” Appraised Value of $267,000,000 as of April 1, 2021, the Cut-off Date LTV and Balloon LTV are equal to 49.8%. There are no assurances that the Grand Hyatt Seattle Property will achieve the appraiser’s stabilized occupancy and ADR assumptions in April 2021, or at all. The Grand Hyatt Seattle Loan was underwritten based on the “As is” Appraised Value of $242,300,000. |
THE INFORMATION IN THIS STRUCTURAL AND COLLATERAL TERM SHEET IS NOT COMPLETE AND MAY BE AMENDED PRIOR TO THE TIME OF SALE. THIS TERM SHEET IS NOT AN OFFER TO SELL THESE SECURITIES AND IT IS NOT A SOLICITATION OF AN OFFER TO BUY THESE SECURITIES IN ANY JURISDICTION WHERE THE OFFER OR SALE IS NOT PERMITTED.
60
721 Pine Street Seattle, WA 98101 |
Collateral Asset Summary – Loan No. 6 Grand Hyatt Seattle |
Cut-off Date Balance: Cut-off Date LTV: U/W NCF DSCR: U/W NOI Debt Yield: |
$50,000,000 54.9% 2.12x 11.8% |
| Historical Occupancy, ADR, RevPAR | |||||||||
| Grand Hyatt Seattle Property(1)(2) | Competitive Set(3) | Penetration Factor | |||||||
| Year | Occupancy | ADR | RevPAR | Occupancy | ADR | RevPAR | Occupancy | ADR | RevPAR |
| 2014 | 82.4% | $208.97 | $172.21 | 82.0% | $197.56 | $161.98 | 100.5% | 105.8% | 106.3% |
| 2015 | 86.3% | $224.53 | $193.81 | 82.4% | $212.12 | $174.72 | 104.7% | 105.8% | 110.9% |
| 2016 | 85.3% | $236.60 | $201.86 | 81.2% | $215.96 | $175.43 | 105.0% | 109.6% | 115.1% |
| 2017 | 87.4% | $244.92 | $214.11 | 84.3% | $227.49 | $191.75 | 103.7% | 107.7% | 111.7% |
| (1) | Beginning in 2014, the borrower converted 32 suites into 64 standard guestrooms, increasing the number of rooms from 425 to 446 in 2014 and from 446 to 457 in 2015. Per the borrower, the cost to convert the suites into standard guestrooms was equal to $4,171,754 ($65,184 per room based on 64 standard guestrooms). |
| (2) | Source: Borrower provided financials. |
| (3) | Source: Hospitality research report. |
The Loan. The Grand Hyatt Seattle mortgage loan (the “Grand Hyatt Seattle Loan”) is evidenced by a $50.0 million fixed rate pari passu note that is part of a whole loan (the “Grand Hyatt Seattle Whole Loan”) secured by the borrower’s fee simple interest in two condominium units comprised of a 457-room full-service hotel located at 721 Pine Street in downtown Seattle, Washington (the “Grand Hyatt Seattle Property”). The Grand Hyatt Seattle Loan is evidenced by the non-controlling Note A-2, with an original principal balance of $50.0 million. The Grand Hyatt Seattle Whole Loan with an aggregate original principal balance of $133.0 million is evidenced by three promissory notes. Only the Grand Hyatt Seattle Note A-2 will be included in the COMM 2018-COR3 mortgage trust. The controlling Note A-1 with an aggregate original principal balance of $50.0 million was contributed to the COMM 2017-COR2 mortgage trust. The non-controlling Note A-3 with an aggregate original principal balance of $33.0 million is currently held by LCM or an affiliate and is expected to be contributed to a future securitization.
The relationship between the holders of the Note A-1, Note A-2, and Note A-3 is governed by a co-lender agreement as described under “Description of the Mortgage Pool—The Whole Loans—The Non-Serviced Pari Passu Whole Loans” in the Preliminary Prospectus.
| Whole Loan Summary | |||||
| Original Balance | Cut-off Date Balance | Note Holder | Controlling Piece | ||
| Note A-1 | $50,000,000 | $50,000,000 | COMM 2017-COR2 | Yes | |
| Note A-2 | $50,000,000 | $50,000,000 | COMM 2018-COR3 | No | |
| Note A-3 | $33,000,000 | $33,000,000 | LCM | No | |
| Total | $133,000,000 | $133,000,000 | |||
The Grand Hyatt Seattle Loan has an approximately 10-year term and requires interest only payments for the term of the loan. The Grand Hyatt Seattle Loan accrues interest at a fixed rate equal to 4.7400% and has a Cut-off Date Balance of $50.0 million. Proceeds of the Grand Hyatt Seattle Whole Loan were used to retire existing debt of approximately $92.7 million, pay closing costs of approximately $339,000 and return approximately $40.0 million of equity to the borrower sponsor. Based on the “As is” appraised value of $242.3 million as of March 8, 2017, the Cut-off Date LTV ratio is 54.9%. The most recent prior financing of the Grand Hyatt Seattle Property was not included in a securitization.
| Sources and Uses | ||||||
| Sources | Proceeds | % of Total | Uses | Proceeds | % of Total | |
| Whole Loan Amount | $133,000,000 | 100.0% | Loan Payoff | $92,671,898 | 69.7% | |
| Return of Equity | $39,989,192 | 30.1% | ||||
| Closing Costs | $338,910 | 0.3% | ||||
| Total Sources | $133,000,000 | 100.0% | Total Uses | $133,000,000 | 100.0% | |
The Borrower / Borrower Sponsor. The borrower, Hedreen Hotel LLC, is a single purpose Delaware limited liability company structured to be bankruptcy-remote, with two independent directors in its organizational structure. The sponsor of the borrower and the nonrecourse carve-out guarantor is Hedreen Holdings LLC.
Hedreen Holdings LLC is a subsidiary of R.C. Hedreen Co. Richard Hedreen, the CEO of R.C. Hedreen Co., has over 50 years of experience in real estate development, acquisition and management. R.C. Hedreen Co. has shifted its focus primarily to luxury hotels over the past decade, but its portfolio of projects includes retail, high-rise office buildings and single and multi-family homes. Mr. Hedreen’s current real estate portfolio includes the Grand Hyatt Seattle Property, the Hyatt @ Olive 8 (also an asset in the COMM 2018-COR3 mortgage trust), the Renaissance Seattle and the 7th & Pine retail and parking property, which is located directly below the Grand Hyatt Seattle Property (but is not collateral for the Grand Hyatt Seattle Loan). All of the properties in Mr. Hedreen’s current portfolio are located in downtown Seattle and all were originally developed by Mr. Hedreen.
THE INFORMATION IN THIS STRUCTURAL AND COLLATERAL TERM SHEET IS NOT COMPLETE AND MAY BE AMENDED PRIOR TO THE TIME OF SALE. THIS TERM SHEET IS NOT AN OFFER TO SELL THESE SECURITIES AND IT IS NOT A SOLICITATION OF AN OFFER TO BUY THESE SECURITIES IN ANY JURISDICTION WHERE THE OFFER OR SALE IS NOT PERMITTED.
61
721 Pine Street Seattle, WA 98101 |
Collateral Asset Summary – Loan No. 6 Grand Hyatt Seattle |
Cut-off Date Balance: Cut-off Date LTV: U/W NCF DSCR: U/W NOI Debt Yield: |
$50,000,000 54.9% 2.12x 11.8% |
Other notable developments by Mr. Hedreen include the Hilton Seattle, the Crowne Plaza Seattle Downtown hotel and the Olive 8 Condominiums which are 229 residential condominium units located above the Hyatt @ Olive 8 Property (but are not collateral for the Hyatt @ Olive 8 Loan), which were sold to individual owners after completion in 2009. Mr. Hedreen’s current portfolio is valued in excess of $750.0 million.
The Property. The Grand Hyatt Seattle Property is a 457-room, 30-story, AAA Four-Diamond rated, full-service hotel located at 721 Pine Street in downtown Seattle, Washington, within the Seattle central business district. The borrower completed the construction of the Grand Hyatt Seattle Property in 2001. Beginning in 2014, the borrower converted 32 suites into 64 standard guestrooms, increasing the number of rooms from 425 to 446 in 2014 and from 446 to 457 in 2015. Per the borrower, the cost to convert the suites into standard guestrooms was equal to $4,171,754 ($65,184 per room based on 64 standard guestrooms). The Grand Hyatt Seattle Property comprises two condominium interests, the 457-room Grand Hyatt Seattle Property (the “Hotel Unit”) and the air rights above the Hotel Unit (the “Air Unit”). A third condominium interest, which is not part of the Grand Hyatt Seattle Property, contains 361,650 sq. ft. and includes 24,140 sq. ft. of ground floor retail space and a 337,510 sq. ft. multi-level parking garage which contains 950 stalls (the “7th & Pine Retail and Garage Unit”). The 7th & Pine Retail and Garage Unit is located directly below the Grand Hyatt Seattle Property and is also owned by the borrower sponsor. A loan secured by the 7th & Pine Retail and Garage Unit was included in the CFCRE 2016-C6 securitization.
The Grand Hyatt Seattle Property features 457 guestrooms and suites, a full banquet kitchen on the first floor which offers room service as well as catering services for events and meetings, an approximately 14,300 sq. ft. Ruth’s Chis Steak House located at the east end of the lobby, a concierge, a Stay Fit Fitness Center with sauna, steam room, whirlpool and fitness equipment, a gift shop, a business center and valet parking. The Grand Hyatt Seattle Property offers five guestroom configurations and suites. The configurations include 350 king guestrooms (380 sq. ft.), 74 double/double guestrooms (380 sq. ft.), 21 corner suites (500 sq. ft.), 11 emerald suites (500 sq. ft.) and 1 presidential suite (1,000 sq. ft.). Each guestroom at the Grand Hyatt Seattle Property includes either a king or two double Hyatt Grand Beds, at least one LG flat-screen TV, a mini-fridge, a coffeemaker, work area with desk, dual line phones with voicemail, iron and ironing board, in-room safe, alarm clock radio, complimentary Wi-Fi throughout and expansive floor-to-ceiling windows offering views of the city. Suites include a foyer and separate sitting area.
The Grand Hyatt Seattle Property is located adjacent to the Washington State Convention Center (“WSCC”) and contains a skywalk bridge located above Pike Street that connects the Grand Hyatt Seattle Property to the WSCC. The Grand Hyatt Seattle Property offers approximately 22,000 sq. ft. of flexible meeting space located on the lobby, sixth and seventh floors. Meeting space is comprised of two ballrooms, nine breakout rooms, a boardroom, an amphitheater and pre-function space.
The Grand Hyatt Seattle Property is subject to a management agreement with Hyatt Corporation who serves as the property manager for the Grand Hyatt Seattle Property. The management agreement commenced on April 20, 2001, currently runs through January 31, 2044 and contains one, five-year renewal option.
Environmental Matters. The Phase I environmental report, dated March 15, 2017, recommended no further action at the Grand Hyatt Seattle Property.
The Market. The Grand Hyatt Seattle Property is located in the area known as the retail core neighborhood in downtown Seattle, a fine dining restaurant and shopping district just south of the Denny Triangle, situated near South Lake Union. According to the appraiser, the Grand Hyatt Seattle Property is located near the area’s primary generators of lodging demand including dozens of upscale retailers and restaurants, major department stores, shopping centers, hotels, office buildings and the WSCC. Because of its central location, the retail core has a substantial daytime population throughout the week. According to the appraiser, the nearby neighborhoods Denny Triangle and South Lake Union represent two of the city’s fastest growing neighborhoods. Amazon’s corporate headquarters was relocated to South Lake Union in 2015.
According to the Downtown Seattle Association, Amazon’s footprint totals 7.6 million sq. ft. with another 3.1 million sq. ft. under development. Amazon reportedly will occupy a total of 12.0 million sq. ft. by 2022, or equal to about a fifth of the inventory of downtown’s best-in-class office space. The company’s growth has allowed it to expand its headquarters in Seattle; in 2016, Amazon reportedly employed about 300,000 globally (24,000 in Washington), compared to 230,000 in 2015.
In 2015, Expedia announced plans to relocate its headquarters from Bellevue to Downtown Seattle. The development plans will allow Expedia to transition its 3,500 employees to the Seattle campus, with full occupancy by 2019. Additionally, several Silicon Valley high-tech companies, such as Google and Facebook, also have a presence in Seattle. In 2016, Google announced plans to relocate its Fremont campus to South Lake Union by 2019. Google’s new campus, which began construction in the second quarter of 2017, will occupy 607,000 sq. ft. of office space and will be able to accommodate 3,000 to 4,000 employees.
The borrower sponsor is currently in the process of developing Seattle’s largest hotel, the Hyatt Regency located at 8th & Howell. The 1,260 room Hyatt Regency hotel broke ground in 2016, on a site previously owned by an affiliate of the borrower sponsor and has an estimated completion date in 2019. The Hyatt Regency will be adjacent to the Washington State Convention Center Addition (“WSCC Addition”), which is scheduled to open in 2020. The preliminary cost of the WSCC Addition project is estimated at over $1.5 billion, and
THE INFORMATION IN THIS STRUCTURAL AND COLLATERAL TERM SHEET IS NOT COMPLETE AND MAY BE AMENDED PRIOR TO THE TIME OF SALE. THIS TERM SHEET IS NOT AN OFFER TO SELL THESE SECURITIES AND IT IS NOT A SOLICITATION OF AN OFFER TO BUY THESE SECURITIES IN ANY JURISDICTION WHERE THE OFFER OR SALE IS NOT PERMITTED.
62
721 Pine Street Seattle, WA 98101 |
Collateral Asset Summary – Loan No. 6 Grand Hyatt Seattle |
Cut-off Date Balance: Cut-off Date LTV: U/W NCF DSCR: U/W NOI Debt Yield: |
$50,000,000 54.9% 2.12x 11.8% |
the expansion is expected to more than double the size of the existing WSCC, with an additional 440,000 sq. ft. of meeting space planned for the project. The WSCC Addition project is expected to provide several economic benefits, including as much as $240.0 million annually in visitor spending, as many as 3,900 direct and indirect jobs, and some 6,000 jobs during construction.
The demand segmentation for the Grand Hyatt Seattle Property consists of 35.0% corporate demand, 40.0% meeting and group demand and 25.0% leisure demand. The Grand Hyatt Seattle Property’s top corporate accounts include the National Basketball Association, the National Football League, Microsoft, Facebook, Amazon, IBM and Boeing.
The Grand Hyatt Seattle Property’s primary competitive set contains eight properties. The eight primary competitors range in size from 237 to 891 rooms and including the Grand Hyatt Seattle Property, the overall competitive set collectively contains an aggregate of 4,137 rooms.
In total, the borrower sponsor has developed approximately 55.6% of the appraiser’s competitive set by number of hotels (five of nine) and 48.6% by number of rooms (2,012 of 4,137), and currently owns 33.3% of the appraiser’s competitive set by number of hotels (three of nine) and 32.9% by number of rooms (1,360 of 4,137). The appraiser’s primary competitors for the Grand Hyatt Seattle Property are summarized in the table below:
| Primary Competitive Set(1) | ||||||
| Property | Rooms | Year Opened | Meeting Space (Sq. Ft.) |
Estimated 2016 Occupancy |
Estimated 2016 ADR |
Estimated 2016 RevPAR |
| Grand Hyatt Seattle Property(3) | 457 | 2001 | 22,000 | 85.3%(2) | $236.60(2) | $201.86(2) |
| Renaissance Seattle(3) | 557 | 1978 | 28,000 | 80-85% | $190-200 | $160-170 |
| Hilton Seattle(4) | 237 | 1970 | 6,000 | 90-95% | $210-220 | $200-210 |
| Fairmont Olympic Hotel Seattle | 450 | 1924 | 17,500 | 65-70% | $250-260 | $180-190 |
| Westin Seattle | 891 | 1929 | 48,000 | 80-85% | $210-220 | $170-180 |
| Marriott Seattle Waterfront Hotel | 358 | 2003 | 11,000 | 80-85% | $260-270 | $210-220 |
| Hyatt @ Olive 8(3) | 346 | 2009 | 10,500 | 80-85% | $220-230 | $190-200 |
| Crowne Plaza Seattle Downtown(4) | 415 | 1983 | 8,500 | 80-85% | $170-180 | $140-150 |
| W Hotel Seattle | 426 | 1999 | 10,000 | 70-75% | $230-240 | $170-180 |
| Total / Wtd. Avg.(5) | 4,137 | 81.6% | $221.90 | $181.18 | ||
| (1) | Source: Appraisal. |
| (2) | Source: Borrower provided financials. |
| (3) | Originally developed and currently owned by the borrower sponsor. |
| (4) | Originally developed by the borrower sponsor and subsequently sold to a third party. |
| (5) | The Grand Hyatt Seattle Property is included in the calculations. |
THE INFORMATION IN THIS STRUCTURAL AND COLLATERAL TERM SHEET IS NOT COMPLETE AND MAY BE AMENDED PRIOR TO THE TIME OF SALE. THIS TERM SHEET IS NOT AN OFFER TO SELL THESE SECURITIES AND IT IS NOT A SOLICITATION OF AN OFFER TO BUY THESE SECURITIES IN ANY JURISDICTION WHERE THE OFFER OR SALE IS NOT PERMITTED.
63
721 Pine Street Seattle, WA 98101 |
Collateral Asset Summary – Loan No. 6 Grand Hyatt Seattle |
Cut-off Date Balance: Cut-off Date LTV: U/W NCF DSCR: U/W NOI Debt Yield: |
$50,000,000 54.9% 2.12x 11.8% |
Cash Flow Analysis.
| Cash Flow Analysis(1) | |||||||
| 2014 | 2015 | 2016 | 2017 | U/W | U/W per Room | ||
| Occupancy | 82.4% | 86.3% | 85.3% | 87.4% | 86.4% | ||
| ADR | $208.97 | $224.53 | $236.60 | $244.92 | $244.92 | ||
| RevPAR | $172.21 | $193.81 | $201.86 | $214.11 | $211.48 | ||
| Room Revenue | $28,034,836 | $32,328,718 | $33,764,041 | $35,714,908 | $35,276,692 | $77,192 | |
| F&B Revenue | 7,242,088 | 6,624,923 | 6,960,095 | 6,015,827 | 6,015,827 | 13,164 | |
| Other Revenue(2) | 1,530,584 | 1,457,566 | 1,344,993 | 1,505,097 | 1,505,097 | 3,293 | |
| Total Revenue | $36,807,508 | $40,411,207 | $42,069,129 | $43,235,832 | $42,797,616 | $93,649 | |
| Operating Expenses | 13,585,491 | 13,377,852 | 13,717,262 | 13,617,583 | 13,512,997 | 29,569 | |
| Undistributed Expenses | 7,582,757 | 8,847,528 | 9,025,147 | 9,390,911 | 9,360,645 | 20,483 | |
| Gross Operating Profit | $15,639,260 | $18,185,827 | $19,326,720 | $20,227,338 | $19,923,974 | $43,597 | |
| Management Fee | 1,100,353 | 1,208,355 | 1,258,116 | 1,381,236 | 1,367,237 | 2,992 | |
| Franchise Fee | 450,453 | 461,846 | 485,524 | 476,692 | 471,860 | 1,033 | |
| Total Fixed Charges | 1,855,198 | 1,997,492 | 2,250,388 | 2,351,264 | 2,394,022 | 5,239 | |
| Net Operating Income | $12,233,256 | $14,518,134 | $15,332,692 | $16,018,146 | $15,690,855 | $34,334 | |
| FF&E(3) | 1,840,375 | 2,013,926 | 2,096,863 | 2,154,091 | 2,139,881 | 4,682 | |
| Net Cash Flow | $10,392,881 | $12,504,207 | $13,235,829 | $13,864,055 | $13,550,974 | $29,652 | |
| (1) | Beginning in 2014, the borrower converted 32 suites into 64 standard guestrooms, increasing the number of rooms from 425 to 446 in 2014 and from 446 to 457 in 2015. Per the borrower, the cost to convert the suites into standard guestrooms was equal to $4,171,754 ($65,184 per room based on 64 standard guestrooms). |
| (2) | Other Revenue includes telephone revenue, restaurant lease revenue, parking revenue, and miscellaneous other revenue. |
| (3) | U/W FF&E represents approximately 5.0% of U/W Total Revenue. |
Property Management. The Grand Hyatt Seattle Property is managed by Hyatt Corporation (“Hyatt”).
Lockbox / Cash Management. The Grand Hyatt Seattle Loan is structured with a hard lockbox and springing cash management. Pursuant to the management agreement, Hyatt has established operating accounts for the Grand Hyatt Seattle Property which are currently with U.S. Bank. The operating accounts are in the name of borrower, but Hyatt has sole signature authority over the operating accounts and is entitled to draw funds from the operating accounts in accordance with the hotel management agreement. Gross revenue from the Grand Hyatt Seattle Property is deposited into a Hyatt controlled clearing account and is transferred on a daily basis to the Hyatt-controlled operating accounts unless a Cash Management Period (as defined below) is continuing. Hyatt has sole signature authority over the clearing account. The clearing account is in the name of the borrower but is pledged to the lender as security for the Grand Hyatt Seattle Loan and a deposit account control agreement was executed by the depository bank, the borrower, Hyatt and the lender in order to perfect the pledge. The lender can only take control of the clearing account after the termination of the hotel management agreement. During a Cash Management Period, all funds in the clearing account are required to be deposited into a lender-controlled cash management account and will be applied to pay monthly amounts due as required under the Grand Hyatt Seattle Loan, and any excess amounts will be retained by the lender as additional collateral for the Grand Hyatt Seattle Loan.
A “Cash Management Period” will occur (i) during the continuation of an event of default or (ii) if the debt yield is less than 7.5% as of the last day of a calendar quarter (until such time that the debt yield is at least 7.5% for two consecutive quarters).
Initial Reserves. None.
Ongoing Reserves. On a monthly basis, so long as the hotel management agreement is in effect, the borrower is required to deposit 1/12 of 5.0% of the gross income for the preceding month, into an FF&E reserve account held by Hyatt. In the event the hotel management agreement with Hyatt is no longer in effect, the FF&E reserve will be transferred into a lender-controlled FF&E reserve account. Additionally, Hyatt is required to pay all real estate taxes and insurance premiums from amounts collected from the Grand Hyatt Seattle Property and deposited into the clearing account while the hotel management agreement is in effect. In the event Hyatt fails to make payments when due and payable, the borrower is required to deposit (i) 1/12 of the annual taxes into the tax reserve account and (ii) 1/12 of the annual insurance premiums into the insurance reserve account.
Current Mezzanine or Subordinate Indebtedness. None.
Future Mezzanine or Subordinate Indebtedness Permitted. None.
THE INFORMATION IN THIS STRUCTURAL AND COLLATERAL TERM SHEET IS NOT COMPLETE AND MAY BE AMENDED PRIOR TO THE TIME OF SALE. THIS TERM SHEET IS NOT AN OFFER TO SELL THESE SECURITIES AND IT IS NOT A SOLICITATION OF AN OFFER TO BUY THESE SECURITIES IN ANY JURISDICTION WHERE THE OFFER OR SALE IS NOT PERMITTED.
64
(THIS PAGE INTENTIONALLY LEFT BLANK)
65
315 West 36th Street New York, NY 10018 |
Collateral Asset Summary – Loan No. 7 315 West 36th Street |
Cut-off Date Balance: Cut-off Date LTV: U/W NCF DSCR: U/W NOI Debt Yield: |
$47,000,000 60.6% 1.39x 6.8% |

THE INFORMATION IN THIS STRUCTURAL AND COLLATERAL TERM SHEET IS NOT COMPLETE AND MAY BE AMENDED PRIOR TO THE TIME OF SALE. THIS TERM SHEET IS NOT AN OFFER TO SELL THESE SECURITIES AND IT IS NOT A SOLICITATION OF AN OFFER TO BUY THESE SECURITIES IN ANY JURISDICTION WHERE THE OFFER OR SALE IS NOT PERMITTED.
66
315 West 36th Street New York, NY 10018 |
Collateral Asset Summary – Loan No. 7 315 West 36th Street |
Cut-off Date Balance: Cut-off Date LTV: U/W NCF DSCR: U/W NOI Debt Yield: |
$47,000,000 60.6% 1.39x 6.8% |

THE INFORMATION IN THIS STRUCTURAL AND COLLATERAL TERM SHEET IS NOT COMPLETE AND MAY BE AMENDED PRIOR TO THE TIME OF SALE. THIS TERM SHEET IS NOT AN OFFER TO SELL THESE SECURITIES AND IT IS NOT A SOLICITATION OF AN OFFER TO BUY THESE SECURITIES IN ANY JURISDICTION WHERE THE OFFER OR SALE IS NOT PERMITTED.
67
315 West 36th Street New York, NY 10018 |
Collateral Asset Summary – Loan No. 7 315 West 36th Street |
Cut-off Date Balance: Cut-off Date LTV: U/W NCF DSCR: U/W NOI Debt Yield: |
$47,000,000 60.6% 1.39x 6.8% |
| Mortgage Loan Information | |
| Loan Seller: | GACC |
| Loan Purpose: | Refinance |
| Borrower Sponsor: | David Berley |
| Borrower: | Walsam 36 Delaware LLC |
| Original Balance(1): | $47,000,000 |
| Cut-off Date Balance(1): | $47,000,000 |
| % by Initial UPB: | 4.7% |
| Interest Rate: | 4.5050% |
| Payment Date: | 6th of each month |
| First Payment Date: | April 6, 2018 |
| Maturity Date: | March 6, 2028 |
| Amortization: | Interest Only |
| Additional Debt(1): | $30,000,000 Pari Passu Debt |
| Call Protection: | L(26), D(90), O(4) |
| Lockbox / Cash Management: | Hard / Springing |
| Reserves(2) | ||
| Initial | Monthly | |
| Taxes: | $220,266 | $73,422 |
| Insurance: | $0 | Springing |
| Replacement: | $0 | Springing |
| Outstanding TI/LC: | $852,848 | NAP |
| TI/LC: | $0 | Springing |
| Lease Sweep: | $0 | Springing |
| Financial Information(3) | |
| Cut-off Date Balance / Sq. Ft.: | $537 |
| Balloon Balance / Sq. Ft.: | $537 |
| Cut-off Date LTV: | 60.6% |
| Balloon LTV: | 60.6% |
| Underwritten NOI DSCR: | 1.49x |
| Underwritten NCF DSCR: | 1.39x |
| Underwritten NOI Debt Yield: | 6.8% |
| Underwritten NCF Debt Yield: | 6.4% |
| Underwritten NOI Debt Yield at Balloon: | 6.8% |
| Underwritten NCF Debt Yield at Balloon: | 6.4% |
| Property Information | ||
| Single Asset / Portfolio: | Single Asset | |
| Property Type: | CBD Office | |
| Collateral: | Fee Simple | |
| Location: | New York, NY | |
| Year Built / Renovated: | 1926 / 2015 | |
| Total Sq. Ft.: | 143,479 | |
| Property Management: | Walter & Samuels, Inc. | |
| Underwritten NOI(4): | $5,256,409 | |
| Underwritten NCF: | $4,895,685 | |
| Appraised Value(3(5)): | $127,000,000 | |
| Appraisal Date: | January 22, 2018 | |
| Historical NOI(6) | ||
| Most Recent NOI(4): | $4,199,083 (December 31, 2017) | |
| 2016 NOI: | $2,448,965 (December 31, 2016) | |
| 2015 NOI: | NAP | |
| 2014 NOI: | NAP | |
| Historical Occupancy(6) | ||
| Most Recent Occupancy: | 97.0% (December 31, 2017) | |
| 2016 Occupancy: | 85.8% (December 31, 2016) | |
| 2015 Occupancy: | NAP | |
| 2014 Occupancy: | NAP | |
| (1) | The Original Balance and Cut-off Date Balance of $47.0 million represents the controlling Note A-1 and non-controlling Note A-3 which, together with the $30.0 million remaining pari passu Note A-2 comprises the 315 West 36th Street Whole Loan with an aggregate original principal balance of $77.0 million. |
| (2) | See “Initial and Ongoing Reserves” herein. |
| (3) | Balance / Sq. Ft., LTV, DSCR and Debt Yield calculations are based on the $77.0 million 315 West 36th Street Whole Loan. |
| (4) | The increase in Underwritten NOI over historical periods is primarily driven by the signing of the WeWork leases on 92.8% of the then vacant net rentable area in 2015 and 2017. |
| (5) | The appraiser concluded a dark value of $95.7 million, which equates to a loan to dark value ratio of 80.5% based on the 315 West 36th Street Whole Loan. |
| (6) | Historical NOI and Historical Occupancy information for 2014 and 2015 is not available because the 315 West 36th Street Property was in a period of transition between 2014 and 2015, after a new lease was signed with WeWork of the then-vacant space. |
THE INFORMATION IN THIS STRUCTURAL AND COLLATERAL TERM SHEET IS NOT COMPLETE AND MAY BE AMENDED PRIOR TO THE TIME OF SALE. THIS TERM SHEET IS NOT AN OFFER TO SELL THESE SECURITIES AND IT IS NOT A SOLICITATION OF AN OFFER TO BUY THESE SECURITIES IN ANY JURISDICTION WHERE THE OFFER OR SALE IS NOT PERMITTED.
68
315 West 36th Street New York, NY 10018 |
Collateral Asset Summary – Loan No. 7 315 West 36th Street |
Cut-off Date Balance: Cut-off Date LTV: U/W NCF DSCR: U/W NOI Debt Yield: |
$47,000,000 60.6% 1.39x 6.8% |
| Tenant Summary(1) | |||||||||||
Tenant |
Ratings (Fitch/Moody’s/S&P) |
Net Rentable Area (Sq. Ft.) |
%
of Net Rentable Area |
|
U/W Base Rent PSF(2) |
% of Total U/W Base Rent |
Lease Expiration | ||||
| WeWork(2) | NR / NR / NR | 133,208 | 92.8% | $50.67 | 96.9% | 6/30/2031 | |||||
| CrossFit LLC | NR / NR / NR | 3,446 | 2.4% | 45.73 | 2.3% | 11/30/2018 | |||||
| Staghorn Steakhouse | NR / NR / NR | 2,450 | 1.7% | 23.08 | 0.8% | 4/30/2020 | |||||
| Total Occupied Collateral | 139,104 | 97.0% | $50.06 | 100.0% | |||||||
| Vacant | 4,375 | 3.0% | |||||||||
| Total | 143,479 | 100.0% | |||||||||
| (1) | Based on the underwritten rent roll dated December 31, 2017. |
| (2) | The tenant is 315 W 36th Street Tenant LLC, which has a lease guaranteed by WeWork Companies Inc. The corporate guarantee is initially capped at an amount approximately equal to the annual rent for the first year of the lease, and such cap (and therefore the guaranteed amount) reduces over time. |
| Lease Rollover Schedule(1) | ||||||||
| Year | # of Leases Expiring |
Total Expiring Sq. Ft. |
% of Total Sq. Ft. Expiring |
Cumulative Sq. Ft. Expiring |
Cumulative %
of Sq. Ft. |
Annual
U/W PSF |
%
U/W Rolling |
Cumulative % of U/W Base Rent |
| MTM | 0 | 0 | 0.0% | 0 | 0.0% | $0.00 | 0.0% | 0.0% |
| 2018 | 1 | 3,446 | 2.4% | 3,446 | 2.4% | $45.73 | 2.3% | 2.3% |
| 2019 | 0 | 0 | 0.0% | 3,446 | 2.4% | 0.00 | 0.0% | 2.3% |
| 2020 | 1 | 2,450 | 1.7% | 5,896 | 4.1% | 23.08 | 0.8% | 3.1% |
| 2021 | 0 | 0 | 0.0% | 5,896 | 4.1% | 0.00 | 0.0% | 3.1% |
| 2022 | 0 | 0 | 0.0% | 5,896 | 4.1% | 0.00 | 0.0% | 3.1% |
| 2023 | 0 | 0 | 0.0% | 5,896 | 4.1% | 0.00 | 0.0% | 3.1% |
| 2024 | 0 | 0 | 0.0% | 5,896 | 4.1% | 0.00 | 0.0% | 3.1% |
| 2025 | 0 | 0 | 0.0% | 5,896 | 4.1% | 0.00 | 0.0% | 3.1% |
| 2026 | 0 | 0 | 0.0% | 5,896 | 4.1% | 0.00 | 0.0% | 3.1% |
| 2027 | 0 | 0 | 0.0% | 5,896 | 4.1% | 0.00 | 0.0% | 3.1% |
| 2028 | 0 | 0 | 0.0% | 5,896 | 4.1% | 0.00 | 0.0% | 3.1% |
| Thereafter | 1 | 133,208 | 92.8% | 139,104 | 97.0% | 50.67 | 96.9% | 100.0% |
| Vacant | NAP | 4,375 | 3.0% | 143,479 | 100.0% | NAP | NAP | |
| Total / Wtd. Avg. | 3 | 143,479 | 100.0% | $50.06 | 100.0% | |||
| (1) | Based on the underwritten rent roll dated December 31, 2017. |
The Loan. The 315 West 36th Street loan (the “315 West 36th Street Loan”) is a fixed rate loan secured by the borrower’s fee simple interest in the commercial (office and retail) component of a mixed-use building located within the Times Square South neighborhood of Manhattan, which commercial component is comprised of portions of the sub-basement, basement and floors 1-10 and totals 143,479 sq. ft. (the “315 West 36th Street Property”). The 315 West 36th Street Loan is evidenced by the controlling Note A-1 and the non-controlling Note A-3 with an aggregate Original and Cut-off Date Balance of $47.0 million. The 315 West 36th Street Loan is part of a Whole Loan (the “315 West 36th Street Whole Loan”), which is evidenced by three promissory notes with an aggregate Original and Cut-off principal balance of $77.0 million. Only the 315 West 36th Street Loan will be included in the COMM 2018-COR3 mortgage trust. The remaining Note A-2 was contributed to the Benchmark 2018-B3 securitization, as illustrated in the “Whole Loan Summary” table below.
The relationship between the holders of the 315 West 36th Street Whole Loan is governed by a co-lender agreement as described under the “Description of the Mortgage Pool—The Whole Loans—The Serviced Pari Passu Whole Loans” in the Preliminary Prospectus.
| Whole Loan Summary | |||||
| Note | Original Balance | Cut-off Date Balance | Note Holder | Controlling Piece | |
| A-1, A-3 | $47,000,000 | $47,000,000 | COMM 2018-COR3 | Yes | |
| A-2 | $30,000,000 | $30,000,000 | Benchmark 2018-B3 | No | |
| Total | $77,000,000 | $77,000,000 | |||
The 315 West 36th Street Whole Loan has a 10-year term and requires interest only monthly payments for the entire term of the loan. The 315 West 36th Street Loan accrues interest at a fixed rate equal to 4.5050%. Proceeds of the 315 West 36th Street Loan, along with approximately $1.7 million of borrower sponsor equity were used to retire existing debt of approximately $72.1 million, fund upfront reserves of approximately $1.1 million, pay closing costs of approximately $1.7 million and return approximately $3.9 million of equity to the borrower sponsor. Based on the appraised value of $127.0 million as of January 22, 2018, the Cut-off Date LTV is 60.6%. The most recent prior financing of the 315 West 36th Street Property was not included in a securitization.
THE INFORMATION IN THIS STRUCTURAL AND COLLATERAL TERM SHEET IS NOT COMPLETE AND MAY BE AMENDED PRIOR TO THE TIME OF SALE. THIS TERM SHEET IS NOT AN OFFER TO SELL THESE SECURITIES AND IT IS NOT A SOLICITATION OF AN OFFER TO BUY THESE SECURITIES IN ANY JURISDICTION WHERE THE OFFER OR SALE IS NOT PERMITTED.
69
315 West 36th Street New York, NY 10018 |
Collateral Asset Summary – Loan No. 7 315 West 36th Street |
Cut-off Date Balance: Cut-off Date LTV: U/W NCF DSCR: U/W NOI Debt Yield: |
$47,000,000 60.6% 1.39x 6.8% |
| Sources and Uses | ||||||
| Sources | Proceeds | % of Total | Uses | Proceeds | % of Total | |
| Mortgage Loan | $77,000,000 | 97.9% | Loan Payoff | $72,086,200 | 91.6% | |
| Other Sources(1) | 1,690,000 | 2.1% | Upfront Reserves | 1,073,114 | 1.4% | |
| Closing Costs | 1,663,298 | 2.1% | ||||
| Return of Equity | 3,867,388 | 4.9% | ||||
| Total Sources | $78,690,000 | 100.0% | Total Uses | $78,690,000 | 100.0% | |
| (1) | Other sources represents the borrower’s rate lock deposit and good faith deposit. |
The Borrower / Borrower Sponsor. The borrower is Walsam 36 Delaware LLC, a single-purpose Delaware limited liability company structured to be bankruptcy remote with two independent directors. The nonrecourse carveout guarantor of the 315 West 36th Street Loan is David Berley, the chairman of Walter & Samuels, Inc., who has owned or operated over 250 buildings in his career. Walter & Samuels, Inc. is a privately held, full-service real estate firm located in New York City that was founded in 1933 and acts as the property manager for the 315 West 36th Street Property and provides building and asset management for third party building owners as well as leasing services for over 3.0 million SF of commercial office space for its own portfolio as well as for third parties. Walter & Samuels, Inc. has been involved in development projects with partners such as GE Capital, iStar, and RREEF/DB Real Estate Opportunity Group, as well as high net worth private investors.
The Property. The 315 West 36th Street Property consists of the commercial (office and retail) component of a 17-story, Class B mixed-use building (the “315 West 36th Street Building”). The 315 West 36th Street Property is located on approximately 0.3 acres of land (which is included in the collateral) within the Times Square South neighborhood of Manhattan. Floors 11 through 17 of the 315 West 36th Street Building are not part of the collateral and are improved with 120 residential condominium units that are subject to a condominium regime. The borrower and the condominium (each an owner of a separate parcel and tax lot at the 315 West 36th Street Building) entered into a Reciprocal Easement and Operating Agreement granting one another a non-exclusive easement at the 315 West 36th Street Building for egress, ingress, and access to other common components of the building such as stairs, pipes, HVAC, etc. See “Description of the Mortgage Pool—Mortgage Pool Characteristics—Condominium Interests” within the Preliminary Prospectus.
The 315 West 36th Street Property was built in 1926 and renovated in 2015, when the ownership invested approximately $15 million (approximately $105 PSF) in base building improvements including upgrades to the lobby, elevator mechanicals, new HVAC units and new bathrooms on floors two through ten.
The 315 West 36th Street Property includes 133,208 sq. ft. of office space (approximately 92.8% of NRA), the entirety of which is leased to WeWork and contributes 96.9% of annual underwritten rent. The remaining 10,271 sq. ft. is comprised of retail space (approximately 7.2% of NRA). The retail space on the ground and mezzanine levels is leased to CrossFit LLC and Staghorn Steakhouse. As of December 31, 2017, the 315 West 36th Street Property was 97.0% occupied, with the remaining vacant 3.0% of NRA comprised of ground floor retail space.
Environmental Matters. The Phase I environmental report, dated January 11, 2018, recommended no further action.
Major Tenant. WeWork 133,208 sq. ft.; 92.8% of NRA; 96.9% of U/W Base Rent) WeWork, a provider of shared workspace for entrepreneurs, freelancers, startups and small businesses, occupies its space at the 315 West 36th Street Property through two leases. The first lease (117,411 sq. ft.) commenced on July 1, 2015 and the second lease (15,797 sq. ft.) commenced on March 1, 2017, after space on the second floor became available. Both leases provide the tenant with one, ten-year renewal option after the June 30, 2031 expiration date and do not provide the tenant with any termination options.
The Market. The 315 West 36th Street Property is located along West 36th Street between Eighth and Ninth Avenues in the Times Square South office submarket of the Midtown West office market in Manhattan. The 315 West 36th Street Property is two blocks south from Penn Station, one of the largest transportation hubs in New York City which provides access to the A, C, E, 1, 2, 3, NJ Transit, LIRR and Amtrak train lines.
The 315 West 36th Street Property is located in the Times Square South office submarket and competes with Class B office properties. According to the appraisal, as of the fourth quarter 2017, the vacancy rate for Class B office space in the Times Square South submarket was 8.7% and the average annual rental rate was $60.48 PSF.
The appraiser identified nine comparable office leases signed between June 2016 and December 2017 relative to the leases signed at the 315 West 36th Street Property. The comparable leases had rents ranging from $54.60 to $67.03 PSF on an adjusted basis, with an average of $57.85 PSF, which is higher than the underwritten base office rent of $50.67 PSF for the office lease at the 315 West 36th Street Property.
THE INFORMATION IN THIS STRUCTURAL AND COLLATERAL TERM SHEET IS NOT COMPLETE AND MAY BE AMENDED PRIOR TO THE TIME OF SALE. THIS TERM SHEET IS NOT AN OFFER TO SELL THESE SECURITIES AND IT IS NOT A SOLICITATION OF AN OFFER TO BUY THESE SECURITIES IN ANY JURISDICTION WHERE THE OFFER OR SALE IS NOT PERMITTED.
70
315 West 36th Street New York, NY 10018 |
Collateral Asset Summary – Loan No. 7 315 West 36th Street |
Cut-off Date Balance: Cut-off Date LTV: U/W NCF DSCR: U/W NOI Debt Yield: |
$47,000,000 60.6% 1.39x 6.8% |
The subsequent table summarizes the comparable office leases as determined by the appraisal.
| Rent Comparables(1) | ||||||||
| Address | Total Building Size (NRA) |
Floor Leased | Tenant Name | Year Built/ Renovated |
Lease Date | Size (NRA) |
Term (Years) |
Base Rent PSF |
| 315 West 36th Street(2) | 143,479 | Ent. 2nd-10th | WeWork | 1926/2015 | Jul-15 | 133,208 | 15.0 | $50.67 |
| 1400 Broadway | 686,000 | Ent. 8th-10th | Fragomen, Del Rey, Bernsen & Loewy | 1939/NAV | Dec-17 | 107,680 | 15.0 | $58.67 |
| 25 West 45th Street | 160,000 | Ent.11th | Cross Over Health | 1912/NAV | Jun-17 | 11,357 | 10.0 | $67.03 |
| 320 West 37th Street | 121,125 | Ent. 13th | Roivant Sciences | 1925/NAV | Apr-17 | 6,162 | 10.0 | $54.80 |
| 130 West 42nd Street | 196,650 | Ent. 5th-8th | WeWork | 1918/NAV | Mar-17 | 64,389 | 15.0 | $59.35 |
| 1375 Broadway | 401,559 | Ent. 11th | Vroom | 1927/NAV | Feb-17 | 22,220 | 8.0 | $57.94 |
| 132 West 31st Street | 348,946 | Pt. 13th | The Credit Junction | 1924/NAV | Dec-16 | 7,819 | 5.0 | $60.19 |
| 225 West 34th Street | 394,145 | Pt. 11th | GRB Environmental Services | 1924/NAV | Sep-16 | 2188 | 10.0 | $54.60 |
| 119 West 40th Street | 261,000 | Ent. 4th-5th | Quartet Health | 1915/NAV | Jun-16 | 31,862 | 10.0 | $66.08 |
| 22 West 38th Street | 60,000 | Ent. 2nd - 7th | Knotel | 1912/NAV | Jul-16 | 35,286 | 15.0 | $55.10 |
| (1) | Source: Appraisal. |
| (2) | Per underwritten rent roll dated December 31, 2017. |
Cash Flow Analysis.
| Cash Flow Analysis(1) | ||||
| 2016(2) | 2017(2) | U/W(2) | U/W PSF | |
| Base Rent | $4,044,627 | $6,020,240 | $6,963,905 | $48.54 |
| Base Rent Steps(3) | 0 | 0 | 137,290 | 0.96 |
| Value of Vacant Space | 0 | 0 | 393,750 | 2.74 |
| Total Recoveries | 252,559 | 246,077 | 246,077 | 1.72 |
| Gross Potential Rent | $4,297,186 | $6,266,317 | $7,741,021 | $53.95 |
| Less: Vacancy(4) | 0 | 0 | (393,750) | (2.74) |
| Effective Gross Income | $4,297,186 | $6,266,317 | $7,347,271 | $51.21 |
| Total Operating Expenses | 1,848,221 | 2,067,234 | 2,090,863 | 14.57 |
| Net Operating Income | $2,448,965 | $4,199,083 | $5,256,409 | $36.64 |
| TI/LC | 0 | 0 | 332,028 | 2.31 |
| Capital Expenditures | 0 | 0 | 28,696 | 0.20 |
| Net Cash Flow | $2,448,965 | $4,199,083 | $4,895,685 | $34.12 |
| (1) | Cash flow analysis prior to 2016 is not available because the 315 West 36th Street Property was in a period of transition between 2014 and 2015, after a new lease was signed with WeWork of the then-vacant space. |
| (2) | The increase in Underwritten NOI over historical periods is primarily driven by the signing of the WeWork leases on 92.8% of the then vacant net rentable area in 2015 and 2017. |
| (3) | Contractual Rent Steps are underwritten based upon the actual scheduled rent increases through July 31, 2018. |
| (4) | Underwritten vacancy reflects the in-place economic vacancy of 5.1%. |
Property Management. The 315 West 36th Street Property is managed by Walter & Samuels, Inc., an affiliate of the borrower.
Lockbox / Cash Management. The 315 West 36th Street Whole Loan documents require a hard lockbox (which is in place) and springing cash management, which is required to commence during the continuance of a Trigger Period (as defined below). During the continuance of a Trigger Period, funds deposited into the lockbox account are required to be swept daily into a lender controlled cash management account and all excess funds in the cash management account (after distribution of monthly amounts due under the 315 West 36th Street Whole Loan) are required to be retained by the lender.
A “Trigger Period” will commence upon (i) an event of default, (ii) failure after the end of one calendar quarter to maintain a debt yield of at least 5.6%, until the debt yield is at least 5.6% for two consecutive quarters, or (iii) the occurrence of any Lease Sweep Period (as defined below).
A “Lease Sweep Period” will commence upon the earliest to occur of (a) the date required under the WeWork lease by which the tenant is required to give notice of its exercise of a renewal option thereunder (December 2029), (b) the date that the WeWork lease is surrendered, cancelled or terminated prior to its then current expiration date or the receipt of notice from the tenant of its intent to surrender, cancel or terminate the WeWork lease (or any material portion thereof prior to its then current expiration date), (c) if the WeWork tenant goes dark or gives notice that it intends to discontinue its business at the 315 West 36th Street Property (or any material portion thereof), (d) a default by the tenant under the WeWork lease that continues beyond any applicable notice or cure period, or (e) if the WeWork tenant becomes subject to a bankruptcy , insolvency or similar proceeding or action. The Lease Sweep Period will end, in the case of clause (a), if the WeWork tenant irrevocably exercises its renewal or extension option or otherwise enters into an extension
THE INFORMATION IN THIS STRUCTURAL AND COLLATERAL TERM SHEET IS NOT COMPLETE AND MAY BE AMENDED PRIOR TO THE TIME OF SALE. THIS TERM SHEET IS NOT AN OFFER TO SELL THESE SECURITIES AND IT IS NOT A SOLICITATION OF AN OFFER TO BUY THESE SECURITIES IN ANY JURISDICTION WHERE THE OFFER OR SALE IS NOT PERMITTED.
71
315 West 36th Street New York, NY 10018 |
Collateral Asset Summary – Loan No. 7 315 West 36th Street |
Cut-off Date Balance: Cut-off Date LTV: U/W NCF DSCR: U/W NOI Debt Yield: |
$47,000,000 60.6% 1.39x 6.8% |
agreement acceptable to the lender and sufficient funds have been accumulated to cover all anticipated leasing expenses, free rent periods, and/or rent abatement periods, in the case of clauses (a), (b) and (c), if the entirety of the WeWork space is leased pursuant to one or more qualified leases and sufficient funds have been accumulated to cover all anticipated leasing expenses, free rent periods, and/or rent abatement periods, in the case of clause (d), the date on which the tenant default has been cured and no other default occurs for a period of six consecutive months; and in the case of clause (e), if the bankruptcy or insolvency or similar proceeding or action has terminated and the WeWork leases have been affirmed, assumed or assigned in a manner reasonably satisfactory to the lender.
Initial Reserves. On the origination date of the 315 West 36th Street Whole Loan, the borrower funded a reserve of $852,848 for the amount of tenant improvements due under the WeWork lease for completed build-out, which work has been completed and which reserve is expected to be released upon borrower request. In addition, on the origination date of the 315 West 36th Street Whole Loan, the borrower funded a reserve of $220,266 for annual real estate taxes.
Ongoing Reserves. On a monthly basis, the borrower is required to deposit reserves of 1/12 of the estimated annual real estate taxes, which currently equates to $73,422, into a tax reserve.
Insurance escrows are waived so long as the 315 West 36th Street Property is covered by an acceptable blanket policy (which is currently maintained). If such condition is no longer satisfied, on each due date, the borrower will be required to fund an insurance reserve in a monthly amount equal to 1/12 of the amount that the lender estimates will be necessary to pay annual insurance premiums.
Rollover reserves are waived so long as no Trigger Period is continuing. If a Trigger Period is continuing, on each due date the borrower is required to deposit $23,913 for tenant improvements and leasing commissions.
Replacement Reserves are waived so long as no Trigger Period is continuing. If a Trigger Period is continuing, on each due date the borrower will be required to deposit $2,391 into a replacement reserve for capital expenditures.
Current Mezzanine or Subordinate Indebtedness. None.
Future Mezzanine or Subordinate Indebtedness Permitted. None.
THE INFORMATION IN THIS STRUCTURAL AND COLLATERAL TERM SHEET IS NOT COMPLETE AND MAY BE AMENDED PRIOR TO THE TIME OF SALE. THIS TERM SHEET IS NOT AN OFFER TO SELL THESE SECURITIES AND IT IS NOT A SOLICITATION OF AN OFFER TO BUY THESE SECURITIES IN ANY JURISDICTION WHERE THE OFFER OR SALE IS NOT PERMITTED.
72
(THIS PAGE INTENTIONALLY LEFT BLANK)
73
240 East 54th Street New York, NY 10022 |
Collateral Asset Summary – Loan No. 8 240 East 54th Street |
Cut-off Date Balance: Cut-off Date LTV: U/W NCF DSCR: U/W NOI Debt Yield: |
$42,000,000 57.5% 1.63x 6.8% |
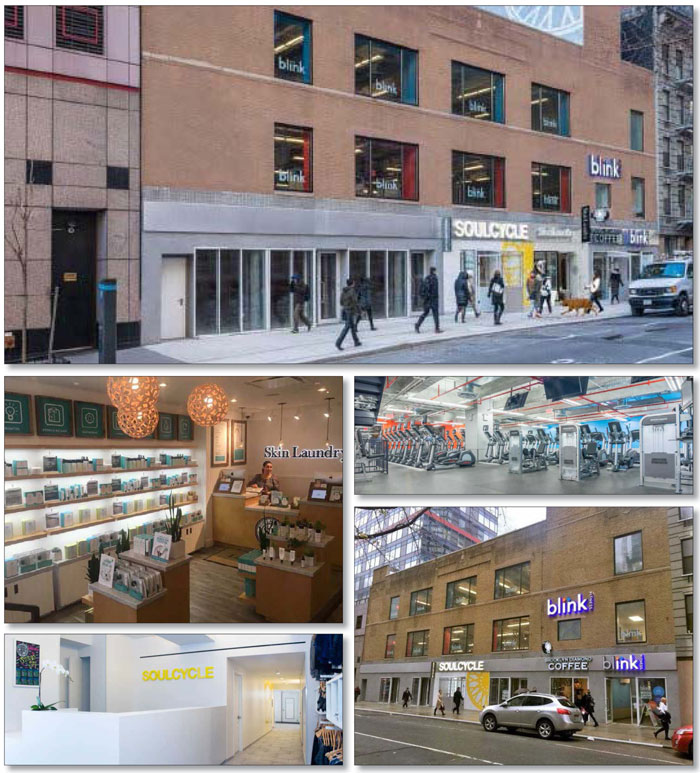
THE INFORMATION IN THIS STRUCTURAL AND COLLATERAL TERM SHEET IS NOT COMPLETE AND MAY BE AMENDED PRIOR TO THE TIME OF SALE. THIS TERM SHEET IS NOT AN OFFER TO SELL THESE SECURITIES AND IT IS NOT A SOLICITATION OF AN OFFER TO BUY THESE SECURITIES IN ANY JURISDICTION WHERE THE OFFER OR SALE IS NOT PERMITTED.
74
240 East 54th Street New York, NY 10022 |
Collateral Asset Summary – Loan No. 8 240 East 54th Street |
Cut-off Date Balance: Cut-off Date LTV: U/W NCF DSCR: U/W NOI Debt Yield: |
$42,000,000 57.5% 1.63x 6.8% |
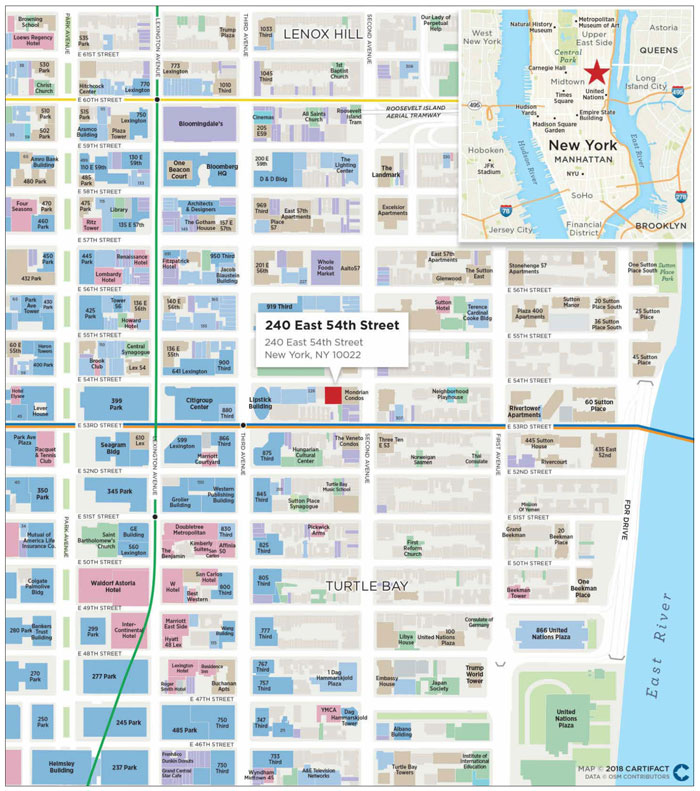
THE INFORMATION IN THIS STRUCTURAL AND COLLATERAL TERM SHEET IS NOT COMPLETE AND MAY BE AMENDED PRIOR TO THE TIME OF SALE. THIS TERM SHEET IS NOT AN OFFER TO SELL THESE SECURITIES AND IT IS NOT A SOLICITATION OF AN OFFER TO BUY THESE SECURITIES IN ANY JURISDICTION WHERE THE OFFER OR SALE IS NOT PERMITTED.
75
240 East 54th Street New York, NY 10022 |
Collateral Asset Summary – Loan No. 8 240 East 54th Street |
Cut-off Date Balance: Cut-off Date LTV: U/W NCF DSCR: U/W NOI Debt Yield: |
$42,000,000 57.5% 1.63x 6.8% |
| Mortgage Loan Information | |
| Loan Seller: | LCM/GACC |
| Loan Purpose: | Refinance |
| Borrower Sponsor: | Jack Terzi |
| Borrower: | JTRE 240 East 54th Street LLC |
| Original Balance: | $42,000,000 |
| Cut-off Date Balance: | $42,000,000 |
| % by Initial UPB: | 4.2% |
| Interest Rate: | 4.1120% |
| Payment Date: | 6th of each month |
| First Payment Date: | November 6, 2017 |
| Maturity Date: | October 6, 2027 |
| Amortization: | Interest Only |
| Additional Debt: | None |
| Call Protection: | L(31), D(85), O(4) |
| Lockbox / Cash Management: | Hard / Springing |
| Reserves(1) | ||
| Initial | Monthly | |
| Taxes: | $175,464 | $50,133 |
| Insurance: | $0 | $5,113 |
| Replacement: | $0 | $499 |
| Special Rollover: | $0 | Springing |
| Financial Information | |
| Cut-off Date Balance / Sq. Ft.: | $1,402 |
| Balloon Balance / Sq. Ft.: | $1,402 |
| Cut-off Date LTV: | 57.5% |
| Balloon LTV: | 57.5% |
| Underwritten NOI DSCR: | 1.64x |
| Underwritten NCF DSCR: | 1.63x |
| Underwritten NOI Debt Yield: | 6.8% |
| Underwritten NCF Debt Yield: | 6.8% |
| Underwritten NOI Debt Yield at Balloon: | 6.8% |
| Underwritten NCF Debt Yield at Balloon: | 6.8% |
| Property Information | ||
| Single Asset / Portfolio: | Single Asset | |
| Property Type: | Anchored Retail | |
| Collateral: | Fee Simple | |
| Location: | New York, NY | |
| Year Built / Renovated: | 1925 / 2015 | |
| Total Sq. Ft.: | 29,950 | |
| Property Management: | JTRE LLC | |
| Underwritten NOI: | $2,863,224 | |
| Underwritten NCF: | $2,846,752 | |
| Appraised Value: | $73,000,000 | |
| Appraisal Date: | August 24, 2017 | |
| Historical NOI(2) | ||
| Most Recent NOI: | $2,204,074 (T-12 August 31, 2017) | |
| 2016 NOI: | NAP | |
| 2015 NOI: | NAP | |
| 2014 NOI: | NAP | |
| Historical Occupancy(2) | ||
| Most Recent Occupancy: | 100.0% (November 1, 2017) | |
| 2016 Occupancy: | NAP | |
| 2015 Occupancy: | NAP | |
| 2014 Occupancy: | NAP | |
| (1) | See “Initial Reserves” and “Ongoing Reserves” herein. |
| (2) | The 240 East 54th Street Property was purchased by the borrower sponsor in 2015 as a parking garage and underwent a full redevelopment converting the use to anchored retail. As such, historical occupancy and financials are not applicable. |
THE INFORMATION IN THIS STRUCTURAL AND COLLATERAL TERM SHEET IS NOT COMPLETE AND MAY BE AMENDED PRIOR TO THE TIME OF SALE. THIS TERM SHEET IS NOT AN OFFER TO SELL THESE SECURITIES AND IT IS NOT A SOLICITATION OF AN OFFER TO BUY THESE SECURITIES IN ANY JURISDICTION WHERE THE OFFER OR SALE IS NOT PERMITTED.
76
240 East 54th Street New York, NY 10022 |
Collateral Asset Summary – Loan No. 8 240 East 54th Street |
Cut-off Date Balance: Cut-off Date LTV: U/W NCF DSCR: U/W NOI Debt Yield: |
$42,000,000 57.5% 1.63x 6.8% |
| Tenant Summary | |||||||
Tenant |
Ratings (Fitch/Moody’s/S&P)(1) |
Net Rentable Area (Sq. Ft.) |
% of Net Rentable Area |
U/W Base Rent PSF | % of Total U/W Base Rent |
Lease Expiration | |
| Blink Fitness | NR/B2/B | 20,500 | 68.4% | $68.29 | 45.1% | 1/31/2035 | |
| Clean Market(2) | NR/NR/NR | 3,800 | 12.7% | $203.29 | 24.9% | 1/31/2035 | |
| Soul Cycle | NR/B2/B | 3,800 | 12.7% | $139.53 | 17.1% | 1/31/2035 | |
| Skin Laundry | NR/NR/NR | 1,500 | 5.0% | $205.81 | 10.0% | 12/1/2027 | |
| Brooklyn Diamond Coffee | NR/NR/NR | 350 | 1.2% | $257.14 | 2.9% | 11/1/2035 | |
| Total Occupied Collateral | 29,950 | 100.0% | $103.55 | 100.0% | |||
| Vacant | 0 | 0.0% | |||||
| Total | 29,950 | 100.0% | |||||
| (1) | Certain ratings are those of the parent company whether or not the parent company guarantees the lease. |
| (2) | Clean Market’s rent commenced on October 1, 2017, but the tenant is not yet in occupancy and is anticipated to take occupancy of its space on or around May 1, 2018. |
| Lease Rollover Schedule | ||||||||
| Year | # of Leases Expiring |
Total Expiring Sq. Ft. |
% of Total Sq. Ft. Expiring |
Cumulative Sq. Ft. Expiring |
Cumulative % of Sq. Ft. Expiring |
Annual U/W Base Rent PSF |
% U/W Base Rent Rolling |
Cumulative % of U/W Base Rent |
| MTM | 0 | 0 | 0.0% | 0 | 0.0% | $0.00 | 0.0% | 0.0% |
| 2018 | 0 | 0 | 0.0% | 0 | 0.0% | $0.00 | 0.0% | 0.0% |
| 2019 | 0 | 0 | 0.0% | 0 | 0.0% | $0.00 | 0.0% | 0.0% |
| 2020 | 0 | 0 | 0.0% | 0 | 0.0% | $0.00 | 0.0% | 0.0% |
| 2021 | 0 | 0 | 0.0% | 0 | 0.0% | $0.00 | 0.0% | 0.0% |
| 2022 | 0 | 0 | 0.0% | 0 | 0.0% | $0.00 | 0.0% | 0.0% |
| 2023 | 0 | 0 | 0.0% | 0 | 0.0% | $0.00 | 0.0% | 0.0% |
| 2024 | 0 | 0 | 0.0% | 0 | 0.0% | $0.00 | 0.0% | 0.0% |
| 2025 | 0 | 0 | 0.0% | 0 | 0.0% | $0.00 | 0.0% | 0.0% |
| 2026 | 0 | 0 | 0.0% | 0 | 0.0% | $0.00 | 0.0% | 0.0% |
| 2027 | 1 | 1,500 | 5.00% | 1,500 | 5.0% | $205.81 | 10.0% | 10.0% |
| 2028 | 0 | 0 | 0.0% | 1,500 | 5.0% | $0.00 | 0.0% | 10.0% |
| Thereafter | 4 | 28,450 | 95.0% | 29,950 | 100.0% | $98.16 | 90.0% | 100.0% |
| Vacant | NAP | 0 | 0.0% | 29,950 | 100.0% | NAP | NAP | |
| Total / Wtd. Avg. | 5 | 29,950 | 100.0% | $103.55 | 100.0% | |||
The Loan. The 240 East 54th Street loan (the “240 East 54th Street Loan”) is a $42.0 million fixed rate loan secured by the borrower’s fee simple interest in a 29,950 sq. ft. anchored retail building located at 240 East 54th Street in midtown New York, New York (the “240 East 54th Street Property”). The 240 East 54th Street Loan has a 10-year term and requires interest only payments for the term of the loan. The 240 East 54th Street Loan accrues interest at a fixed rate equal to 4.1120% and has a Cut-off Date Balance of $42.0 million. Proceeds of the 240 East 54th Street Loan were used to retire existing debt of approximately $30.1 million, fund upfront reserves of approximately $175,000, pay closing costs of approximately $1.0 million and return approximately $10.8 million of equity to the borrower sponsor. Based on the appraised value of approximately $73.0 million as of August 24, 2017, the Cut-off Date LTV is 57.5%. The most recent prior financing of the 240 East 54th Street Property was not included in a securitization. The 240 East 54th Loan was originated by LCM, and is evidenced by two promissory notes, each in the amount of $21.0 million, one of which is being purchased by DBNY, and will be contributed to the COMM 2018-COR3 mortgage trust by GACC, and the other of which will be contributed to the COMM 2018-COR3 mortgage trust by LCM.
| Sources and Uses | ||||||
| Sources | Proceeds | % of Total | Uses | Proceeds | % of Total | |
| Mortgage Loan | $42,000,000 | 100.0% | Loan Payoff | $30,057,109 | 71.6% | |
| Return of Equity | $10,798,224 | 25.7% | ||||
| Closing Costs | $969,203 | 2.3% | ||||
| Upfront Reserves | $175,464 | 0.4% | ||||
| Total Sources | $42,000,000 | 100.0% | Total Uses | $42,000,000 | 100.0% | |
THE INFORMATION IN THIS STRUCTURAL AND COLLATERAL TERM SHEET IS NOT COMPLETE AND MAY BE AMENDED PRIOR TO THE TIME OF SALE. THIS TERM SHEET IS NOT AN OFFER TO SELL THESE SECURITIES AND IT IS NOT A SOLICITATION OF AN OFFER TO BUY THESE SECURITIES IN ANY JURISDICTION WHERE THE OFFER OR SALE IS NOT PERMITTED.
77
240 East 54th Street New York, NY 10022 |
Collateral Asset Summary – Loan No. 8 240 East 54th Street |
Cut-off Date Balance: Cut-off Date LTV: U/W NCF DSCR: U/W NOI Debt Yield: |
$42,000,000 57.5% 1.63x 6.8% |
The Borrower / Borrower Sponsor. The borrower, JTRE 240 East 54th Street LLC, is a single purpose Delaware limited liability company structured to be bankruptcy-remote with one independent director in its organizational structure. The sponsor of the borrower and the non-recourse carve-out guarantor is Jack Terzi.
Jack Terzi is the founder of JTRE Holdings, a private commercial real estate investment firm engaged in acquisition, brokerage and consulting. The company represents landlords and tenants in the commercial, retail, and industrial fields as well as property assessment, marketing services and negotiation tactics.
The Property. The 240 East 54th Street Property is a 29,950 sq. ft. anchored retail building built in 1925 and redeveloped in 2015. The borrower sponsor purchased the 240 East 54th Street Property in 2015 when it was a parking garage. After acquisition the borrower sponsor redeveloped the 240 East 54th Street Property into its current use as a health and fitness themed anchored retail building and was also responsible for bringing in Blink Fitness, Skin Laundry and Soul Cycle as tenants. Blink Fitness and Soul Cycle are both subsidiaries of Equinox Holdings (“Equinox”).
Located on East 54th Street between 2nd and 3rd Avenues in midtown Manhattan, the 240 East 54th Street Property is 100.0% leased to five tenants with only 5.0% of the net rentable area expiring during the term of the 240 East 54th Street Loan. According to the appraisal, the 240 East 54th Street Property’s land value is equal to $65.0 million or approximately 154.8% of the 240 East 54th Street Loan balance.
Environmental Matters. The Phase I environmental report dated September 27, 2017 recommended no further action at the 240 East 54th Street Property other than to implement an operations and maintenance plan for asbestos and a mold and moisture plan, which are currently in place.
Major Tenants.
Blink Fitness (20,500 sq. ft.; 68.4% of NRA; 45.1% of U/W Base Rent; NR/B2/B by Fitch/Moody’s/S&P) Blink Fitness is a subsidiary of Equinox Holdings (NASDAQ: EQIX; NR/B2/B by Fitch/Moody’s/S&P). Founded in 2011, Blink Fitness is a fitness studio with more than 90 locations open or in development throughout New York, New Jersey, Pennsylvania and California. The company currently has 12 locations in Manhattan.
Clean Market (3,800 sq. ft.; 12.7% of NRA; 24.9% of U/W Base Rent) Clean Market is a retail company that provides wellness services including IV drip, infrared saunas, cryotherapy, a functional tonic bar/café and a modern apothecary market. Clean Market’s rent commenced on October 1, 2017 but the tenant is not yet in occupancy and is anticipated to take occupancy of its space on or around May 1, 2018.
The Market. The 240 East 54th Street Property is located in the Midtown retail submarket within the overall New York City retail market. As of Q4 2017, the Midtown retail submarket contained 810 properties totaling approximately 16.7 million sq. ft. with an overall vacancy rate of 3.5%. The 240 East 54th Street Property is further categorized within the Plaza District micro-submarket within the overall Midtown retail submarket. As of Q4 2017, the Plaza District micro-submarket contained 259 properties totaling approximately 4.6 million sq. ft. with an overall vacancy rate of 5.2%.
The appraisal market rent assumptions for the 240 East 54th Street Property are below.
| Appraisal Market Rent Assumptions(1) | |||
| Health Club | Ground Floor Large |
Ground Floor Small | |
| Sq. Ft.(2) | 20,500 | 9,100 | 350 |
| Appraiser Market Rent (PSF) | $80.00 | $225.00 | $275.00 |
| Rent Type | Gross | Gross | Gross |
| Lease Term (years) | 10 | 10 | 10 |
| (1) | Source: Appraisal. |
| (2) | Based on rent roll dated November 1, 2017. |
THE INFORMATION IN THIS STRUCTURAL AND COLLATERAL TERM SHEET IS NOT COMPLETE AND MAY BE AMENDED PRIOR TO THE TIME OF SALE. THIS TERM SHEET IS NOT AN OFFER TO SELL THESE SECURITIES AND IT IS NOT A SOLICITATION OF AN OFFER TO BUY THESE SECURITIES IN ANY JURISDICTION WHERE THE OFFER OR SALE IS NOT PERMITTED.
78
240 East 54th Street New York, NY 10022 |
Collateral Asset Summary – Loan No. 8 240 East 54th Street |
Cut-off Date Balance: Cut-off Date LTV: U/W NCF DSCR: U/W NOI Debt Yield: |
$42,000,000 57.5% 1.63x 6.8% |
Cash Flow Analysis.
| Cash Flow Analysis(1) | |||||
| T-12 8/31/2017 | Appraisal | In-Place (11/1/2017)(2) | U/W | U/W PSF | |
| Base Rent | $2,302,190 | $3,099,174 | $3,101,422 | $3,101,422 | $103.55 |
| Contractual Base Rent Steps | 0 | 0 | 0 | 0 | 0.00 |
| Value of Vacant Space | 0 | 0 | 0 | 0 | 0.00 |
| Gross Potential Rent | $2,302,190 | $3,099,174 | $3,101,422 | $3,101,422 | $103.55 |
| Total Recoveries | 533,954 | 541,140 | 637,461 | 637,461 | 21.28 |
| Other Income | 0 | 0 | 0 | 0 | 0.00 |
| Less: Vacancy(3) | 0 | (105,347) | 0 | (186,944) | (6.24) |
| Effective Gross Income | $2,836,144 | $3,534,967 | $3,738,883 | $3,551,939 | $118.60 |
| Total Operating Expenses | 632,070 | 591,751 | 694,323 | 688,715 | 23.00 |
| Net Operating Income | $2,204,074 | $2,943,216 | $3,044,560 | $2,863,224 | $95.60 |
| TI/LC | 0 | 0 | 10,483 | 10,483 | 0.35 |
| Capital Expenditures | 0 | 0 | 5,990 | 5,990 | 0.20 |
| Net Cash Flow | $2,204,074 | $2,943,216 | $3,028,088 | $2,846,752 | $95.05 |
| (1) | The 240 East 54th Street Property was purchased by the borrower sponsor in 2015 as a parking garage and underwent a full redevelopment converting the use to anchored retail. As such, historical occupancy and financials are not applicable. |
| (2) | In-Place represents annualized rents per the underwritten rent roll dated November 1, 2017 and is based on leases in place with no vacancy adjustment, contractual tenant reimbursements per the leases and all other U/W expenses and capital items. |
| (3) | U/W Vacancy is based on 5.0% of the combined Gross Potential Rent and Total Recoveries. |
Property Management. The 240 East 54th Street Property is managed by JTRE LLC, an affiliate of the borrower.
Lockbox / Cash Management. The 240 East 54th Street Loan is structured with a hard lockbox and springing cash management. All rents are required to be deposited directly by the tenants of the 240 East 54th Street Property into a lockbox account controlled by the lender. Amounts on deposit in the lockbox accounts will be transferred daily to an account controlled by the borrower unless a Cash Management Period (as defined below) is continuing. Upon the occurrence of a Cash Management Period and/or a Lease Sweep Period (as defined below), all funds in the lockbox account will be swept into a lender-controlled cash management account, from which account such funds will be disbursed in accordance with the loan agreement. During the continuance of a Cash Management Period and/or Lease Sweep Period, all excess cash in the lockbox account will be retained by the lender as additional collateral for the 240 East 54th Street Loan.
A “Cash Management Period” will commence (i) upon an event of default or (ii) if the debt yield is less than 6.5% (until such time that the debt yield is greater than or equal to 6.5% for two consecutive quarters). Notwithstanding the foregoing, the borrower may post with lender, as additional collateral and security for the 240 East 54th Street Loan, cash and/or an acceptable letter of credit (“DY Maintenance Funds”) in each instance an aggregate amount that, if deemed to have been applied to the outstanding principal balance of the 240 East 54th Street Loan, would have been sufficient to cause the debt yield to equal or exceed 6.5%. Any DY Maintenance Funds deposited with lender will be held and applied in accordance with the loan agreement.
A “Lease Sweep Period” will commence (i) on the date that is 12 months prior to the end of the term (including any renewal terms) of any Lease Sweep Lease (as defined below), (ii) on the date required under a Lease Sweep Lease by which the applicable Lease Sweep Tenant (as defined below) is required to give notice of its exercise of a renewal option (and such renewal option has not been so exercised), (iii) if any Lease Sweep Lease is surrendered, cancelled or terminated prior to its then-current expiration date; (iv) if any Lease Sweep Tenant goes dark or gives notice that it intends to discontinue its business, (v) upon the occurrence of a monetary or material non-monetary default under any Lease Sweep Lease or (vi) upon the occurrence of a Lease Sweep Tenant insolvency proceeding. During a Lease Sweep Period, all excess cash flow will be deposited into a special rollover reserve account.
A “Lease Sweep Lease” means the Blink Fitness Lease, the Clean Market Lease, the Soul Cycle Lease and any lease that covers 3,800 or more sq. ft.
A “Lease Sweep Tenant” means any tenant under a Lease Sweep Lease.
Initial Reserves. At origination, the borrower deposited $175,464 into a tax reserve account.
Ongoing Reserves. On a monthly basis, the borrower is required to deposit reserves of (i) 1/12 of the estimated annual real estate taxes, which currently equates to $50,133, into a tax reserve account, (ii) 1/12 of the annual insurance premiums, which currently equates to $5,113, into an insurance reserve account and (iii) $499 into a replacement reserve account, subject to a cap of $1,500.
THE INFORMATION IN THIS STRUCTURAL AND COLLATERAL TERM SHEET IS NOT COMPLETE AND MAY BE AMENDED PRIOR TO THE TIME OF SALE. THIS TERM SHEET IS NOT AN OFFER TO SELL THESE SECURITIES AND IT IS NOT A SOLICITATION OF AN OFFER TO BUY THESE SECURITIES IN ANY JURISDICTION WHERE THE OFFER OR SALE IS NOT PERMITTED.
79
240 East 54th Street New York, NY 10022 |
Collateral Asset Summary – Loan No. 8 240 East 54th Street |
Cut-off Date Balance: Cut-off Date LTV: U/W NCF DSCR: U/W NOI Debt Yield: |
$42,000,000 57.5% 1.63x 6.8% |
Current Mezzanine or Subordinate Indebtedness. None.
Future Mezzanine or Subordinate Indebtedness Permitted. None.
THE INFORMATION IN THIS STRUCTURAL AND COLLATERAL TERM SHEET IS NOT COMPLETE AND MAY BE AMENDED PRIOR TO THE TIME OF SALE. THIS TERM SHEET IS NOT AN OFFER TO SELL THESE SECURITIES AND IT IS NOT A SOLICITATION OF AN OFFER TO BUY THESE SECURITIES IN ANY JURISDICTION WHERE THE OFFER OR SALE IS NOT PERMITTED.
80
(THIS PAGE INTENTIONALLY LEFT BLANK)
81
500 North Atlantic Boulevard Monterey Park, CA 91754 |
Collateral Asset Summary – Loan No. 9 Atlantic Times Square |
Cut-off Date Balance: Cut-off Date LTV: U/W NCF DSCR: U/W NOI Debt Yield: |
$40,000,000 59.8% 1.86x 9.5% |
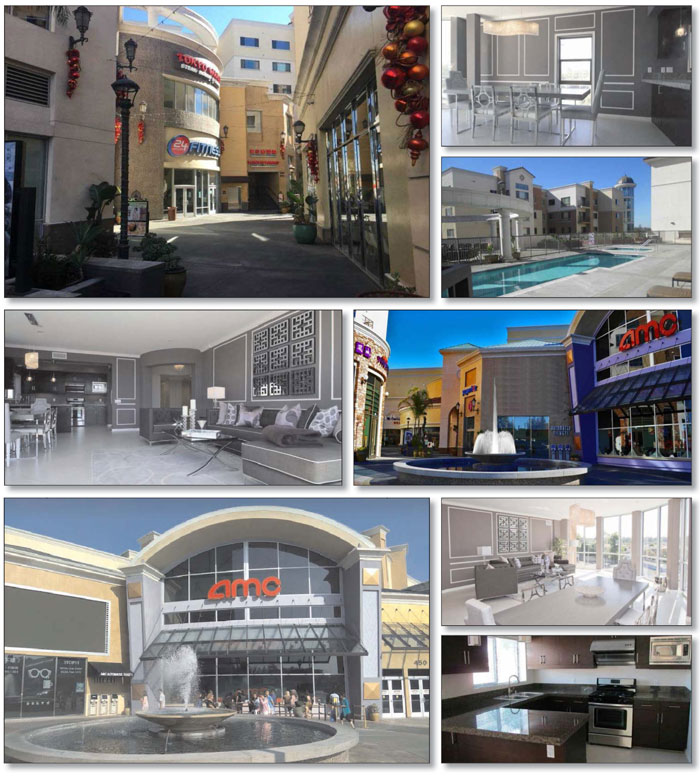
THE INFORMATION IN THIS STRUCTURAL AND COLLATERAL TERM SHEET IS NOT COMPLETE AND MAY BE AMENDED PRIOR TO THE TIME OF SALE. THIS TERM SHEET IS NOT AN OFFER TO SELL THESE SECURITIES AND IT IS NOT A SOLICITATION OF AN OFFER TO BUY THESE SECURITIES IN ANY JURISDICTION WHERE THE OFFER OR SALE IS NOT PERMITTED.
82
500 North Atlantic Boulevard Monterey Park, CA 91754 |
Collateral Asset Summary – Loan No. 9 Atlantic Times Square |
Cut-off Date Balance: Cut-off Date LTV: U/W NCF DSCR: U/W NOI Debt Yield: |
$40,000,000 59.8% 1.86x 9.5% |
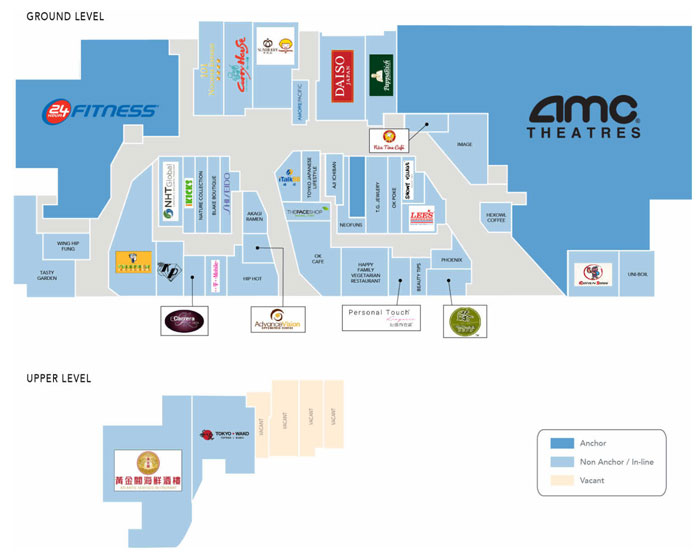
THE INFORMATION IN THIS STRUCTURAL AND COLLATERAL TERM SHEET IS NOT COMPLETE AND MAY BE AMENDED PRIOR TO THE TIME OF SALE. THIS TERM SHEET IS NOT AN OFFER TO SELL THESE SECURITIES AND IT IS NOT A SOLICITATION OF AN OFFER TO BUY THESE SECURITIES IN ANY JURISDICTION WHERE THE OFFER OR SALE IS NOT PERMITTED.
83
500 North Atlantic Boulevard Monterey Park, CA 91754 |
Collateral Asset Summary – Loan No. 9 Atlantic Times Square |
Cut-off Date Balance: Cut-off Date LTV: U/W NCF DSCR: U/W NOI Debt Yield: |
$40,000,000 59.8% 1.86x 9.5% |

THE INFORMATION IN THIS STRUCTURAL AND COLLATERAL TERM SHEET IS NOT COMPLETE AND MAY BE AMENDED PRIOR TO THE TIME OF SALE. THIS TERM SHEET IS NOT AN OFFER TO SELL THESE SECURITIES AND IT IS NOT A SOLICITATION OF AN OFFER TO BUY THESE SECURITIES IN ANY JURISDICTION WHERE THE OFFER OR SALE IS NOT PERMITTED.
84
500 North Atlantic Boulevard Monterey Park, CA 91754 |
Collateral Asset Summary – Loan No. 9 Atlantic Times Square |
Cut-off Date Balance: Cut-off Date LTV: U/W NCF DSCR: U/W NOI Debt Yield: |
$40,000,000 59.8% 1.86x 9.5% |
| Mortgage Loan Information | |
| Loan Seller: | JPMCB |
| Loan Purpose: | Refinance |
| Borrower Sponsor: | Ronnie Lam |
| Borrower: | Atlantic Times Square X, LLC |
| Original Balance(1): | $40,000,000 |
| Cut-off Date Balance(1): | $40,000,000 |
| % by Initial UPB: | 4.0% |
| Interest Rate: | 4.8450% |
| Payment Date: | 1st of each month |
| First Payment Date: | May 1, 2018 |
| Maturity Date: | April 1, 2028 |
| Amortization: | Interest Only |
| Additional Debt(1): | $58,000,000 Pari Passu Debt |
| Call Protection(2): | L(25), D(91), O(4) |
| Lockbox / Cash Management: | Springing Hard / Springing |
| Reserves(3) | ||
| Initial | Monthly | |
| Taxes: | $483,974 | $161,325 |
| Insurance: | $140,595 | $15,622 |
| Replacement: | $4,744 | $4,744 |
| TI/LC: | $11,487 | $11,487 |
| AMC Reserve: | $0 | Springing |
| Financial Information(4) | ||
| Cut-off Date Balance / Sq. Ft.(5): | $258 | |
| Balloon Balance / Sq. Ft.(5): | $258 | |
| Cut-off Date LTV: | 59.8% | |
| Balloon LTV: | 59.8% | |
| Underwritten NOI DSCR: | 1.94x | |
| Underwritten NCF DSCR: | 1.86x | |
| Underwritten NOI Debt Yield: | 9.5% | |
| Underwritten NCF Debt Yield: | 9.2% | |
| Underwritten NOI Debt Yield at Balloon: | 9.5% | |
| Underwritten NCF Debt Yield at Balloon: | 9.2% | |
| (1) | The Atlantic Times Square whole loan is evidenced by three pari passu notes with an aggregate original principal balance of $98.0 million (the “Atlantic Times Square Whole Loan”). The non-controlling Note A-2, with an original principal balance of $40.0 million, will be included in the COMM 2018-COR3 mortgage trust. The controlling note A-1, with an original principal balance of $40.0 million, and non-controlling note A-3, with an original principal balance of $18.0 million, are held by JPMCB and are expected to be contributed to one or more future securitization trusts. For additional information regarding the pari passu notes, see “The Loan” herein. |
| (2) | Defeasance of the full $98.0 million Atlantic Times Square Whole Loan is permitted after the date that is two years after the closing date of the securitization that includes the last pari passu note to be securitized (the “REMIC Prohibition Period”). If the REMIC Prohibition Period has not expired by May 1, 2021, the borrower is permitted to prepay the Atlantic Times Square Whole Loan with a yield maintenance premium. The assumed lockout period of 25 payments is based on the expected COMM 2018-COR3 securitization closing date in May 2018. The actual lockout period may be longer. |
| Property Information | |
| Single Asset / Portfolio: | Single Asset |
| Property Type: | Mixed Use Retail / Multifamily |
| Collateral: | Fee Simple |
| Location: | Monterey Park, CA |
| Year Built / Renovated: | 2010 / NAP |
| Total Sq. Ft.(6): | 379,376 |
| Property Management: | Kam Sang Company, Inc. |
| Underwritten NOI(7): | $9,337,011 |
| Underwritten NCF: | $8,967,236 |
| Appraised Value: | $163,800,000 |
| Appraisal Date: | 2/1/2018 |
| Historical NOI(8) | |
| Most Recent NOI: | $9,977,969 (T-12 February 28, 2018) |
| 2017 NOI: | $9,919,162 (December 31, 2017) |
| 2016 NOI: | $9,280,553 (December 31, 2016) |
| 2015 NOI: | $8,042,730 (December 31, 2015) |
| Historical Occupancy(9) | |
| Most Recent Occupancy: | 96.9% (March 1, 2018) |
| 2017 Occupancy: | 94.3% (December 31, 2017) |
| 2016 Occupancy: | 98.4% (December 31, 2016) |
| 2015 Occupancy: | 92.5% (December 31, 2015) |
| (3) | See “Initial and Ongoing Reserves” herein. |
| (4) | DSCR, LTV, Debt Yield and Balance / Sq. Ft. calculations are based on the aggregate balance of the Atlantic Times Square Whole Loan. |
| (5) | Cut-off Date Balance / Sq. Ft. and Balloon Balance / Sq. Ft. are each calculated based on the 379,376 combined sq. ft. of retail and multifamily space. |
| (6) | Total Sq. Ft. of 379,376 sq. ft. represents 212,838 sq. ft. of retail space and 166,538 sq. ft. of multifamily space (100 units). |
| (7) | Approximately 28.4% of the Underwritten NOI is attributable to the multifamily component of the Atlantic Times Square Property. |
| (8) | The increase in Most Recent NOI from 2015 NOI is driven predominantly by a lease up of the retail component of the Atlantic Times Square Property totaling 33,919 sq. ft. across 16 new and renewal leases since June 2015. |
| (9) | Historical Occupancy reflects the weighted average occupancy of both the retail and multifamily components of the Atlantic Times Square Property. |
THE INFORMATION IN THIS STRUCTURAL AND COLLATERAL TERM SHEET IS NOT COMPLETE AND MAY BE AMENDED PRIOR TO THE TIME OF SALE. THIS TERM SHEET IS NOT AN OFFER TO SELL THESE SECURITIES AND IT IS NOT A SOLICITATION OF AN OFFER TO BUY THESE SECURITIES IN ANY JURISDICTION WHERE THE OFFER OR SALE IS NOT PERMITTED.
85
500 North Atlantic Boulevard Monterey Park, CA 91754 |
Collateral Asset Summary – Loan No. 9 Atlantic Times Square |
Cut-off Date Balance: Cut-off Date LTV: U/W NCF DSCR: U/W NOI Debt Yield: |
$40,000,000 59.8% 1.86x 9.5% |
| Tenant Summary(1) | |||||||
Tenant |
Ratings (Fitch/Moody’s/S&P)(2) |
Net Rentable Area (Sq. Ft.) |
% of Net Rentable Area |
|
U/W Base Rent PSF |
% of Total U/W Base Rent |
Lease Expiration |
Anchor / Major Tenants |
|||||||
| AMC Theater | B/B2/B+ | 75,000 | 35.2% | $22.82 | 25.0% | 8/31/2030 | |
| 24 Hour Fitness | NR/B2/B | 30,842 | 14.5% | $26.88 | 12.1% | 8/31/2025 | |
| Subtotal / Wtd. Avg. | 105,842 | 49.7% | $24.01 | 37.1% | |||
| In-line Retail Tenants | 101,854 | 47.9% | $42.21 | 62.9% | |||
| Vacant | 5,142 | 2.4% | |||||
| Total | 212,838 | 100.0% | |||||
| (1) | Based on the underwritten rent roll dated as of March 1, 2018 for the retail component of the Atlantic Times Square Property. |
| (2) | Certain ratings are those of the parent company whether or not the parent company guarantees the lease. |
| Lease Rollover Schedule(1) | ||||||||
| Year | # of Leases Expiring |
Total Expiring Sq. Ft. |
% of Total Sq. Ft. Expiring |
Cumulative Sq. Ft. Expiring |
Cumulative % of Sq. Ft. Expiring |
Annual
U/W PSF |
%
U/W Rolling |
Cumulative % of U/W Base Rent |
| MTM(2) | 1 | 0 | 0.0% | 0 | 0.0% | $120,000.00 | 1.8% | 1.8% |
| 2018 | 3 | 2,327 | 1.1% | 2,327 | 1.1% | $53.79 | 1.8% | 3.6% |
| 2019 | 6 | 15,060 | 7.1% | 17,387 | 8.2% | $39.64 | 8.7% | 12.3% |
| 2020 | 13 | 29,831 | 14.0% | 47,218 | 22.2% | $42.56 | 18.6% | 30.9% |
| 2021 | 10 | 18,570 | 8.7% | 65,788 | 30.9% | $43.18 | 11.7% | 42.6% |
| 2022 | 7 | 22,662 | 10.6% | 88,450 | 41.6% | $37.17 | 12.3% | 54.9% |
| 2023 | 0 | 0 | 0.0% | 88,450 | 41.6% | $0.00 | 0.0% | 54.9% |
| 2024 | 1 | 2,274 | 1.1% | 90,724 | 42.6% | $48.71 | 1.6% | 56.5% |
| 2025 | 1 | 30,842 | 14.5% | 121,566 | 57.1% | $26.88 | 12.1% | 68.7% |
| 2026 | 1 | 6,205 | 2.9% | 127,771 | 60.0% | $33.00 | 3.0% | 71.6% |
| 2027 | 0 | 0 | 0.0% | 127,771 | 60.0% | $0.00 | 0.0% | 71.6% |
| 2028 | 1 | 4,925 | 2.3% | 132,696 | 62.3% | $46.26 | 3.3% | 75.0% |
| Thereafter | 1 | 75,000 | 35.2% | 207,696 | 97.6% | $22.82 | 25.0% | 100.0% |
| Vacant | NAP | 5,142 | 2.4% | 212,838 | 100.0% | NAP | NAP | |
| Total / Wtd. Avg. | 45 | 212,838 | 100.0% | $32.93 | 100.0% | |||
| (1) | Certain tenants have lease termination options that may become exercisable prior to the originally stated expiration date of the tenant lease and that are not considered in the lease rollover schedule or the stacking plan. |
| (2) | MTM represents signage at the property, for which there is no sq. ft. attributable but $120,000 in annual U/W base rent. |
The Loan. The Atlantic Times Square Whole Loan is a fixed rate loan secured by the borrower’s fee simple interest in a mixed-use development with 379,376 sq. ft., comprised of 212,838 sq. ft. of retail space and 100 multifamily units, consisting of 166,538 sq. ft. of space, located in Monterey Park, California (the “Atlantic Times Square Property”). The Atlantic Times Square Whole Loan is evidenced by the non-controlling Note A-2, with an original principal balance of $40.0 million, which will be included in the COMM 2018-COR3 mortgage trust. The controlling Note A-1, with an original principal balance of $40.0 million, and non-controlling Note A-3, with an original principal balance of $18.0 million, are expected to be contributed to one or more future mortgage trusts.
The relationship between the holders of the Atlantic Times Square Whole Loan is governed by a co-lender agreement as described under the “Description of the Mortgage Pool--The Whole Loans—The Serviced Pari Passu Whole Loans” and “—The Non-Serviced Pari Passu Whole Loans” in the Preliminary Prospectus.
| Whole Loan Summary | |||||
| Original Balance | Cut-off Date Balance | Note Holder | Controlling Piece | ||
| Note A-1 | $40,000,000 | $40,000,000 | JPMCB | Yes | |
| Note A-2 | $40,000,000 | $40,000,000 | COMM 2018-COR3 | No | |
| Note A-3 | $18,000,000 | $18,000,000 | JPMCB | No | |
| Total | $98,000,000 | $98,000,000 | |||
THE INFORMATION IN THIS STRUCTURAL AND COLLATERAL TERM SHEET IS NOT COMPLETE AND MAY BE AMENDED PRIOR TO THE TIME OF SALE. THIS TERM SHEET IS NOT AN OFFER TO SELL THESE SECURITIES AND IT IS NOT A SOLICITATION OF AN OFFER TO BUY THESE SECURITIES IN ANY JURISDICTION WHERE THE OFFER OR SALE IS NOT PERMITTED.
86
500 North Atlantic Boulevard Monterey Park, CA 91754 |
Collateral Asset Summary – Loan No. 9 Atlantic Times Square |
Cut-off Date Balance: Cut-off Date LTV: U/W NCF DSCR: U/W NOI Debt Yield: |
$40,000,000 59.8% 1.86x 9.5% |
| Sources and Uses | ||||||
| Sources | Proceeds | % of Total | Uses | Proceeds | % of Total | |
| Loan Amount | $98,000,000 | 100.0% | Loan Payoff | $66,380,388 | 67.7% | |
| Closing Costs | $1,333,259 | 1.4% | ||||
| Reserves | $640,799 | 0.7% | ||||
| Return of Equity | $29,645,553 | 30.3% | ||||
| Total Sources | $98,000,000 | 100.0% | Total Uses | $98,000,000 | 100.0% | |
The Borrower / Sponsor. The borrowing entity for the loan is Atlantic Times Square X, LLC, a Delaware limited liability company and special purpose entity. The loan’s sponsor and nonrecourse carve-out guarantor is Ronnie Lam. Mr. Lam is the founder and current CEO of Kam Sang Company, Inc. (“Kam Sang”). Kam Sang, established in 1979, is a privately held real estate development and management firm with a portfolio consisting of hospitality, retail, residential, restaurant, and mixed-use properties. The company currently owns and manages a portfolio of 17 properties, 16 of which are located in the greater Los Angeles, California area and one located in Las Vegas, Nevada. Kam Sang’s hotel and residential properties include The Embassy Suites Glendale, The Sheraton Hotel Anaheim, Courtyard Marriott Baldwin Park, Residence Inn by Marriott in La Mirada and Rancho Cielo Estates in Rancho Santé Fe. Retail properties include Puente Hills East in City of Industry, Kaleidoscope in Mission Viejo and Simi Valley Town Center in Simi Valley. Additionally, according to Kam Sang, there are an additional eight projects in the construction pipeline.
The Property. The Atlantic Times Square Property is a mixed-use development that was constructed in 2010 for approximately $183.0 million by Kam Sang. The property was built on a 6.60 acre site and consists of three multifamily buildings with a total of 210 units along with 212,838 sq. ft. of ground floor retail and a 1,649 space subterranean parking garage. The property is subject to two condominium declarations affecting the commercial and residential components of the property. The borrower owns both units in the commercial condominium. One of the multifamily buildings, containing 110 units, is not included as collateral for the Atlantic Times Square Whole Loan, as the units were sold as condominiums to third parties. As of the trailing 12-month period ended February 2018, the Atlantic Times Square Property generated approximately 72.8% of revenues from the retail component and approximately 27.2% of revenues from the multifamily component.
| Multifamily Unit Mix | |||||
| Unit Type | Total Units | Occupied Units | Occupancy % | Average Unit Size (SF) | In-Place Average Rent per Month |
| 2 BR | 40 | 39 | 97.5% | 1,437 | $2,911 |
| 3 BR | 60 | 57 | 95.0% | 1,818 | $3,359 |
| Total/Wtd. Avg. | 100 | 96 | 96.0% | 1,665 | $3,177 |
The multifamily portion serving as collateral for the Atlantic Times Square Whole Loan consists of 100 units totaling 166,538 sq. ft. and is comprised of 40 two-bedroom and 60 three-bedroom layouts that were 96.0% occupied as of March 1, 2018. Amenities at the Atlantic Times Square Property include a full service concierge, 24-hour doorman, outdoor swimming pool and sundecks, health spa, clubhouse lounge and outdoor garden and lounge area. According to the appraisal, the property falls within the East LA/Alhambra/Montebello/Pico Rivera apartment submarket, which reported a total inventory of 24,722 units as of year-end 2017. The submarket reported a vacancy rate of 2.9% with average asking rents of $1,428 per unit, which is up from $1,163 in 2013. Additionally, the Class A average asking rents in the submarket were $1,878 per unit, up from $1,512 in 2013. The appraisal identified seven competitive multifamily properties built between 1962 and 2016, ranging from 109 units to 391 units and ranging in size from 83,256 sq. ft. to 327,448 sq. ft. The competitive properties reported occupancies ranging from 94.3% to 97.3% with a weighted average occupancy of approximately 96.1% as of year-end 2017. There are currently 122 apartment units under construction in the submarket across two projects.
The 212,838 sq. ft. of ground floor retail is currently 97.6% leased by 45 tenants, as of March 1, 2018. The retail component is anchored by a 14-screen AMC Theater (“AMC”), which is leased by an affiliate of the borrower and is managed by AMC pursuant to a management agreement, a 30,842 square foot 24 Hour Fitness, and a variety of in-line and restaurant tenants. According to the appraisal, the Atlantic Times Square Property falls within the San Gabriel Valley-West retail submarket. As of year-end 2017, the submarket was comprised of approximately 5.7 million sq. ft. of space with a vacancy rate of 2.8% with average asking rental rates for retail space of $33.79 PSF The appraisal identified 10 comparable retail leases ranging in size from 627 sq. ft. to 2,366 sq. ft. Base rents for the comparable leases ranged from $32.40 PSF to $54.00 PSF, with a weighted average of $44.76 PSF The appraisal concluded retail market rents of between $24.00 PSF for anchor space to $57.00 PSF for small shop inline space. Additionally, the appraisal identified approximately 81,500 sq. ft. of new construction in the submarket.
Environmental Matters. The Phase I environmental report dated February 7, 2018 recommended no further action at the Atlantic Times Square Property.
THE INFORMATION IN THIS STRUCTURAL AND COLLATERAL TERM SHEET IS NOT COMPLETE AND MAY BE AMENDED PRIOR TO THE TIME OF SALE. THIS TERM SHEET IS NOT AN OFFER TO SELL THESE SECURITIES AND IT IS NOT A SOLICITATION OF AN OFFER TO BUY THESE SECURITIES IN ANY JURISDICTION WHERE THE OFFER OR SALE IS NOT PERMITTED.
87
500 North Atlantic Boulevard Monterey Park, CA 91754 |
Collateral Asset Summary – Loan No. 9 Atlantic Times Square |
Cut-off Date Balance: Cut-off Date LTV: U/W NCF DSCR: U/W NOI Debt Yield: |
$40,000,000 59.8% 1.86x 9.5% |
Major Tenants.
AMC (75,000 sq. ft.; 35.2% of retail NRA; 25.0% of U/W Base Rent; B/B2/B+ by Fitch/Moody’s/S&P). AMC owns, operates and has interests in 649 theaters totaling 8,224 screens across 44 states and the District of Columbia within the United States and 365 theaters with 2,945 screens in 14 international countries AMC was founded in 1920 and is headquartered in Leawood, Kansas. The lease with the affiliate of the borrower does not contain renewal options. The expiration date of the current AMC management agreement is August 31, 2020. AMC, which has 14 screens at the Atlantic Times Square Property, reported year-end 2017 sales of $533,390 per screen.
24 Hour Fitness (30,842 sq. ft.; 14.5% of retail NRA; 12.1% of U/W Base Rent; NA/B2/B). 24 Hour Fitness is the world’s largest privately owned and operated fitness center chain. The company owns and operates over 400 fitness centers located across the United States and Asia. 24 Hour Fitness has over 4 million members and in 2014, the company was sold to private equity firm AEA Investors. 24 Hour Fitness’s lease contains three, five-year renewal options.
The Market. The Atlantic Times Square Property is located in Monterey Park, California which is situated in greater Los Angeles approximately 10.0 miles northeast of downtown Los Angeles. The local area around the property consists of a mix of residential and commercial use properties and is in close proximity to attractions such as the Pacific Ocean, Disneyland, Dodger Stadium, the Coliseum, the Rose Bowl and several universities. The property is located on Atlantic Boulevard less than one mile off of Interstate 10. Interstate 10 connects the property to downtown Los Angeles and Santa Monica to the west and Ontario to the east. Atlantic Boulevard, which runs north/south, connects to Pasadena approximately six miles to the north of the property. Los Angeles International Airport is approximately 25.0 miles from the property. As of 2017, the population within a one-, three- and five- mile radius was approximately 40,509, 290,496 and 781,501, respectively. The average household income within a one-, three- and five- mile radius is $71,503, $74,572 and $76,299, respectively. According to the appraisal, as of year-end 2017 the vacancy rate for class A multifamily properties within Los Angeles was 5.5% while the vacancy rate for multifamily properties within the East LA/Alhambra/Montebello/Pico Rivera submarket was 1.9%. Further, according to the appraisal, as of year-end 2017 the vacancy rate for retail properties within Los Angeles was 6.0% while the vacancy rate for retail properties within the San Gabriel Valley-West submarket was 2.8%.
Cash Flow Analysis.
| Cash Flow Analysis | ||||||
| 2015 | 2016 | 2017 | T-12 2/28/2018 | U/W | U/W PSF(1) | |
| Base Rent(2) | $9,021,233 | $10,202,637 | $10,483,266 | $10,759,602 | $10,500,341 | $27.68 |
| Value of Vacant Space | 0 | 0 | 0 | 0 | 373,532 | 0.98 |
| Gross Potential Rent | $9,021,233 | $10,202,637 | $10,483,266 | $10,759,602 | $10,873,873 | $28.66 |
| Total Recoveries | 2,333,796 | 2,505,209 | 2,471,754 | 2,475,782 | 3,124,391 | 8.24 |
| Total Other Income | 710,377 | 807,714 | 1,462,316 | 1,269,244 | 952,154 | 2.51 |
| Less: Vacancy | 0 | 0 | 0 | 0 | (699,913) | (1.84) |
| Effective Gross Income | $12,065,407 | $13,515,561 | $14,417,336 | $14,504,628 | $14,250,505 | $37.56 |
| Total Operating Expenses | 4,022,677 | 4,235,008 | 4,498,174 | 4,526,659 | 4,913,493 | 12.95 |
| Net Operating Income(3) | $8,042,730 | $9,280,553 | $9,919,162 | $9,977,969 | $9,337,011 | $24.61 |
| TI/LC | 0 | 0 | 0 | 0 | 312,849 | 0.82 |
| Capital Expenditures | 0 | 0 | 0 | 0 | 56,926 | 0.15 |
| Net Cash Flow | $8,042,730 | $9,280,553 | $9,919,162 | $9,977,969 | $8,967,236 | $23.64 |
| (1) | U/W PSF is based on 379,376 sq. ft., which represents 212,838 sq. ft. of retail space and 166,538 sq. ft. of multifamily space. |
| (2) | Underwritten Base Rent includes $6,840,257 of retail income (65.1%) and $3,660,084 of multifamily income (34.9%). |
| (3) | The increase in T-12 2/28/2018 Net Operating Income from 2015 Net Operating Income is driven predominantly by a general lease up of the retail component of the property totaling 33,919 sq. ft. across 16 new and renewal leases since June 2015. |
Property Management. The property is managed by Kam Sang Company, Inc., a California corporation and an affiliate of the loan sponsor.
Lockbox / Cash Management. The Atlantic Times Square Whole Loan is structured with a springing hard lockbox and springing cash management. Upon the occurrence and continuance of a Lockbox Event (as defined below), the borrower is required to deliver tenant direction letters to all tenants under commercial leases directing such tenants to deliver all rents directly to the lockbox account controlled by the lender. Following a Lockbox Event until the occurrence of a Cash Sweep Event (as defined below) and a permitted Cash Sweep Event Cure (as defined below), funds in the lockbox account are required to be transferred daily to an account controlled by the borrower. During the continuance of a Cash Sweep Event, all funds are required to be transferred each business day to the cash management account and disbursed in accordance with the loan documents. The lender has been granted a first priority security interest in the cash management account.
THE INFORMATION IN THIS STRUCTURAL AND COLLATERAL TERM SHEET IS NOT COMPLETE AND MAY BE AMENDED PRIOR TO THE TIME OF SALE. THIS TERM SHEET IS NOT AN OFFER TO SELL THESE SECURITIES AND IT IS NOT A SOLICITATION OF AN OFFER TO BUY THESE SECURITIES IN ANY JURISDICTION WHERE THE OFFER OR SALE IS NOT PERMITTED.
88
500 North Atlantic Boulevard Monterey Park, CA 91754 |
Collateral Asset Summary – Loan No. 9 Atlantic Times Square |
Cut-off Date Balance: Cut-off Date LTV: U/W NCF DSCR: U/W NOI Debt Yield: |
$40,000,000 59.8% 1.86x 9.5% |
A “Lockbox Event” means the occurrence of (i) a Cash Sweep Event (as defined below) or (ii) the date the debt service coverage ratio based on the trailing twelve month period (as calculated in the loan documents) is less than 1.15x.
“Cash Sweep Event” means the occurrence of (a) an event of default, (b) any voluntary or collusive involuntary bankruptcy or insolvency action of the borrower or the property manager (unless, with respect to any involuntary non-collusive action, such action is dismissed within 60 days of filing), (c) the date the debt service coverage ratio based on the trailing twelve-month period falls below 1.10x, or (d) an AMC Trigger Event (as defined below).
“AMC Trigger Event” means AMC fails to renew its management agreement (during the initial term or any extension term) with respect to the theater space on or before the date that is one year prior to the then-current expiration of the AMC management agreement. The expiration date of the current AMC management agreement is August 31, 2020.
“Cash Sweep Event Cure” means (i) with respect to clause (a) above, the acceptance of a cure by the lender of the related event of default, (ii) with respect to clause (b) above, solely with respect to a bankruptcy or insolvency of the property manager, if the borrower replaces such property manager within 60 days of such action in accordance with the loan documents, and (iii) with respect to clause (c) above, the achievement of a debt service coverage ratio (as calculated in the loan documents and based on the trailing three month period) of at least 1.15x for two consecutive calendar quarters, and with respect to clause (d) above, an (A) AMC Trigger Event Cure (as defined below) or (B) the balance of the AMC reserve fund reaches the AMC Reserve Fund Cap (as defined below).
“AMC Trigger Event Cure” means either the (i) execution of a replacement management agreement with AMC or other theater manager acceptable to the lender for a term of no less than five years, and AMC or such other theater manager is operating the theater pursuant to such replacement management agreement or (ii) the theater has been re-let to one or more replacement tenant(s) pursuant to replacement lease(s) and the borrower has delivered to the lender a tenant estoppel certificate(s) from each such replacement tenant(s) in form and substance reasonably acceptable to the lender stating that such replacement tenant(s) are in occupancy and paying full contractual rent.
Initial Reserves. At loan origination, the borrower deposited into escrow approximately $483,974 for real estate taxes, approximately $140,595 for insurance, $11,487 for ongoing tenant improvements and leasing commissions costs and approximately $4,744 for replacement reserves.
Ongoing Reserves. On a monthly basis, the borrower is required to escrow (i) 1/12 of annual estimated tax payments, which currently equates to $161,325, into a tax reserve account, (ii) $11,487 (approximately $0.65 PSF of commercial space annually) for tenant improvements and leasing commissions costs, subject to a reserve cap of $344,595 (approximately $1.62 PSF of commercial space annually), into a tenant improvement and leasing commission reserve account and (iii) $4,744 for replacement reserves, comprised of $2,660 for the retail component (approximately $0.15 PSF of commercial space annually) and $2,083 for the multifamily component (approximately $249.96 per unit of multifamily space annually), into a replacement reserve account.
To the extent there is no event of default and the borrower has provided satisfactory evidence that the Atlantic Times Square Property is insured pursuant to a blanket insurance acceptable to the lender in its reasonable discretion, the borrower’s obligation to deposit 1/12 of the annual estimated insurance premiums monthly, which currently equates to $15,622, into an insurance reserve account will be waived.
If an AMC Trigger Event has occurred and no AMC Trigger Event Cure has occurred, all excess cash flow is required to be deposited with the lender, subject to a cap of $2,000,000 (“AMC Reserve Fund Cap”).
Current Mezzanine or Subordinate Indebtedness Permitted. None.
Partial Release. None.
THE INFORMATION IN THIS STRUCTURAL AND COLLATERAL TERM SHEET IS NOT COMPLETE AND MAY BE AMENDED PRIOR TO THE TIME OF SALE. THIS TERM SHEET IS NOT AN OFFER TO SELL THESE SECURITIES AND IT IS NOT A SOLICITATION OF AN OFFER TO BUY THESE SECURITIES IN ANY JURISDICTION WHERE THE OFFER OR SALE IS NOT PERMITTED.
89
130-150 Shoreline Drive Redwood City, CA 94065 |
Collateral Asset Summary – Loan No. 10 Shoreline Center |
Cut-off Date Balance: Cut-off Date LTV: U/W NCF DSCR: U/W NOI Debt Yield: |
$38,300,000 63.8% 2.32x 10.6% |
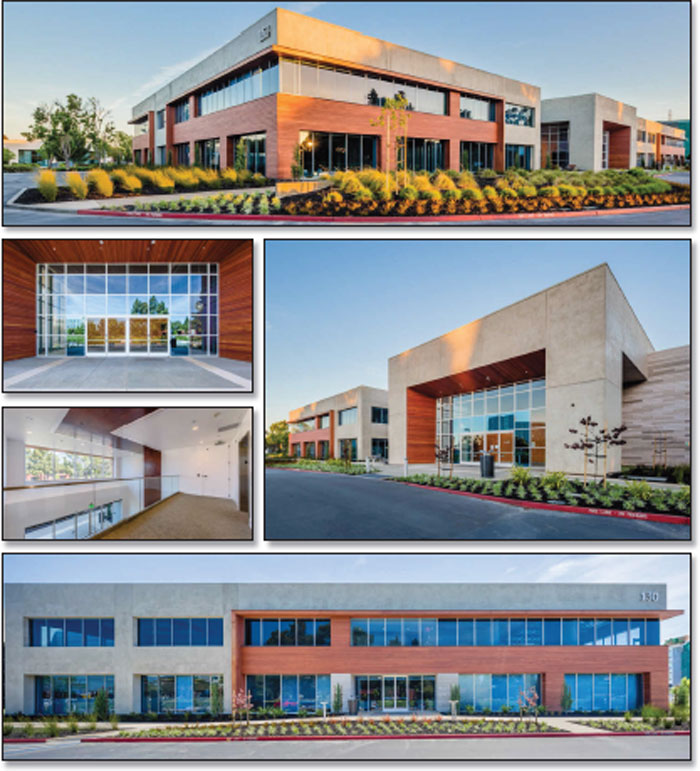
THE INFORMATION IN THIS STRUCTURAL AND COLLATERAL TERM SHEET IS NOT COMPLETE AND MAY BE AMENDED PRIOR TO THE TIME OF SALE. THIS TERM SHEET IS NOT AN OFFER TO SELL THESE SECURITIES AND IT IS NOT A SOLICITATION OF AN OFFER TO BUY THESE SECURITIES IN ANY JURISDICTION WHERE THE OFFER OR SALE IS NOT PERMITTED.
90
130-150 Shoreline Drive Redwood City, CA 94065 |
Collateral Asset Summary – Loan No. 10 Shoreline Center |
Cut-off Date Balance: Cut-off Date LTV: U/W NCF DSCR: U/W NOI Debt Yield: |
$38,300,000 63.8% 2.32x 10.6% |
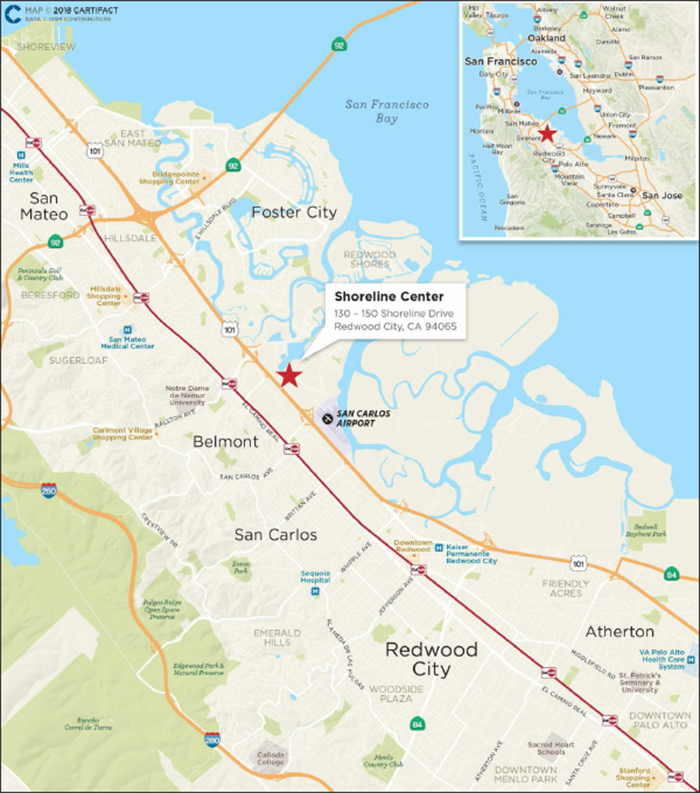
THE INFORMATION IN THIS STRUCTURAL AND COLLATERAL TERM SHEET IS NOT COMPLETE AND MAY BE AMENDED PRIOR TO THE TIME OF SALE. THIS TERM SHEET IS NOT AN OFFER TO SELL THESE SECURITIES AND IT IS NOT A SOLICITATION OF AN OFFER TO BUY THESE SECURITIES IN ANY JURISDICTION WHERE THE OFFER OR SALE IS NOT PERMITTED.
91
130-150 Shoreline Drive Redwood City, CA 94065 |
Collateral Asset Summary – Loan No. 10 Shoreline Center |
Cut-off Date Balance: Cut-off Date LTV: U/W NCF DSCR: U/W NOI Debt Yield: |
$38,300,000 63.8% 2.32x 10.6% |
| Mortgage Loan Information | |
| Loan Seller: | LCM |
| Loan Purpose: | Acquisition |
| Borrower Sponsor: | Joseph J. Sitt |
| Borrower: | Thor 130-150 Shoreline LLC |
| Original Balance: | $38,300,000 |
| Cut-off Date Balance: | $38,300,000 |
| % by Initial UPB: | 3.8% |
| Interest Rate: | 4.2880% |
| Payment Date: | 6th of each month |
| First Payment Date: | March 6, 2018 |
| Maturity Date: | February 6, 2028 |
| Amortization: | Interest Only |
| Additional Debt: | None |
| Call Protection: | L(27), D(88), O(5) |
| Lockbox / Cash Management: | Hard / In Place |
| Reserves(1) | ||
| Initial | Monthly | |
| Taxes: | $87,000 | $57,000 |
| Insurance: | $0 | Springing |
| Free Rent(2): | $89,317 | NAP |
| Outstanding TI/LC: | $1,376,021 | NAP |
| Roof Reserve: | $540,000 | NAP |
| Special Rollover: | $0 | Springing |
| Financial Information | |
| Cut-off Date Balance / Sq. Ft.: | $470 |
| Balloon Balance / Sq. Ft.: | $470 |
| Cut-off Date LTV: | 63.8% |
| Balloon LTV: | 63.8% |
| Underwritten NOI DSCR: | 2.44x |
| Underwritten NCF DSCR: | 2.32x |
| Underwritten NOI Debt Yield: | 10.6% |
| Underwritten NCF Debt Yield: | 10.1% |
| Underwritten NOI Debt Yield at Balloon: | 10.6% |
| Underwritten NCF Debt Yield at Balloon: | 10.1% |
| Property Information | |
| Single Asset / Portfolio: | Single Asset |
| Property Type: | Suburban Office |
| Collateral: | Fee Simple |
| Location: | Redwood City, CA |
| Year Built / Renovated: | 1985 / 2017 |
| Total Sq. Ft.: | 81,569 |
| Property Management: | G&E Real Estate Management Services, Inc. |
| Underwritten NOI: | $4,054,715 |
| Underwritten NCF: | $3,866,290 |
| Appraised Value(3): | $60,000,000 |
| Appraisal Date: | March 1, 2018 |
| Historical NOI(4) | |
| Most Recent NOI: | NAP |
| 2016 NOI: | NAP |
| 2015 NOI: | NAP |
| 2014 NOI: | NAP |
| Historical Occupancy(4) | |
| Most Recent Occupancy: | 100.0% (May 6, 2018) |
| 2016 Occupancy: | NAP |
| 2015 Occupancy: | NAP |
| 2014 Occupancy: | NAP |
| (1) | See “Initial Reserves” and “Ongoing Reserves” herein. |
| (2) | The free rent period for the sole tenant, Auris Surgical Robotics, Inc., has since expired and the initial balance of $89,317 has been disburse to the borrower. |
| (3) | The appraisal concluded to an “as is” value of $58,000,000 as of November 17, 2017 and an “as stabilized” value of $60,000,000 as of March 1, 2018. The Shoreline Center Property satisfied the “as stabilized” conditions on or prior to March 1, 2018. In addition, the appraiser concluded to a dark value of $46,000,000 for the Shoreline Center Property which results in a “Go Dark” Cut-off Date LTV and Balloon LTV of 83.3%. |
| (4) | The Shoreline Center Property was recently purchased after a full renovation. As such, historical occupancy and financials are not available. |
THE INFORMATION IN THIS STRUCTURAL AND COLLATERAL TERM SHEET IS NOT COMPLETE AND MAY BE AMENDED PRIOR TO THE TIME OF SALE. THIS TERM SHEET IS NOT AN OFFER TO SELL THESE SECURITIES AND IT IS NOT A SOLICITATION OF AN OFFER TO BUY THESE SECURITIES IN ANY JURISDICTION WHERE THE OFFER OR SALE IS NOT PERMITTED.
92
130-150 Shoreline Drive Redwood City, CA 94065 |
Collateral Asset Summary – Loan No. 10 Shoreline Center |
Cut-off Date Balance: Cut-off Date LTV: U/W NCF DSCR: U/W NOI Debt Yield: |
$38,300,000 63.8% 2.32x 10.6% |
| Tenant Summary | |||||||||||
Tenant |
Ratings (Fitch/Moody’s/S&P) |
Net Rentable Area (Sq. Ft.) |
%
of Net Rentable Area |
|
U/W Base Rent PSF(1) |
% of Total U/W Base Rent |
Lease Expiration | ||||
| Auris Surgical Robotics, Inc.(2) | NR/NR/NR | 81,569 | 100.0% | $56.87 | 100.0% | 4/30/2025 | |||||
| Total Occupied Collateral | 81,569 | 100.0% | $56.87 | 100.0% | |||||||
| Vacant | 0 | 0% | |||||||||
| Total | 81,569 | 100.0% | |||||||||
| (1) | U/W Base Rent PSF is inclusive of approximately $240,314 in base rent steps taken through November 1, 2018. |
| (2) | Auris Surgical Robotics, Inc. has one, five-year renewal option remaining. |
| Lease Rollover Schedule | ||||||||
| Year | # of Leases Expiring |
Total Expiring Sq. Ft. |
% of Total Sq. Ft. Expiring |
Cumulative Sq. Ft. Expiring |
Cumulative % of Sq. Ft. Expiring |
Annual U/W Base Rent PSF(1) |
% U/W Base Rent Rolling |
Cumulative % of U/W Base Rent |
| MTM | 0 | 0 | 0.0% | 0 | 0.0% | $0.00 | 0.0% | 0.0% |
| 2018 | 0 | 0 | 0.0% | 0 | 0.0% | $0.00 | 0.0% | 0.0% |
| 2019 | 0 | 0 | 0.0% | 0 | 0.0% | $0.00 | 0.0% | 0.0% |
| 2020 | 0 | 0 | 0.0% | 0 | 0.0% | $0.00 | 0.0% | 0.0% |
| 2021 | 0 | 0 | 0.0% | 0 | 0.0% | $0.00 | 0.0% | 0.0% |
| 2022 | 0 | 0 | 0.0% | 0 | 0.0% | $0.00 | 0.0% | 0.0% |
| 2023 | 0 | 0 | 0.0% | 0 | 0.0% | $0.00 | 0.0% | 0.0% |
| 2024 | 0 | 0 | 0.0% | 0 | 0.0% | $0.00 | 0.0% | 0.0% |
| 2025 | 1 | 81,569 | 100.0% | 81,569 | 100.0% | $56.87 | 100.0% | 100.0% |
| 2026 | 0 | 0 | 0.0% | 81,569 | 100.0% | $0.00 | 0.0% | 100.0% |
| 2027 | 0 | 0 | 0.0% | 81,569 | 100.0% | $0.00 | 0.0% | 100.0% |
| 2028 | 0 | 0 | 0.0% | 81,569 | 100.0% | $0.00 | 0.0% | 100.0% |
| Thereafter | 0 | 0 | 0.0% | 81,569 | 100.0% | $0.00 | 0.0% | 100.0% |
| Vacant | NAP | 0 | 0.0% | 81,569 | 100.0% | NAP | NAP | |
| Total / Wtd. Avg. | 1 | 81,569 | 100.0% | $56.87 | 100.0% | |||
| (1) | Annual U/W Base Rent PSF is inclusive of approximately $240,314 in base rent steps taken through November 1, 2018. |
The Loan. The Shoreline Center loan (the “Shoreline Center Loan”) is a $38.3 million fixed rate loan secured by the borrower’s fee simple interest in a newly renovated, office and research and development (“R&D”) building totaling 81,569 sq. ft. located at 130-150 Shoreline Drive in Redwood City, California (the “Shoreline Center Property”). The Shoreline Center Loan has a 10-year term and requires interest only payments for the term of the loan. The Shoreline Center Loan accrues interest at a fixed rate equal to 4.2880% and has a Cut-off Date Balance of approximately $38.3 million. Proceeds of the Shoreline Center Loan, along with approximately $21.7 million of borrow sponsor equity, were used to acquire the Shoreline Center Property for approximately $58.0 million, fund upfront reserves of approximately $2.1 million and pay closing costs of approximately $1.8 million. Based on the appraised value of $60.0 million as of March 1, 2018, the Cut-off Date LTV is 63.8%. The most recent prior financing of the Shoreline Center Property was not included in a securitization.
| Sources and Uses | ||||||
| Sources | Proceeds | % of Total | Uses | Proceeds | % of Total | |
| Mortgage Loan | $38,300,000 | 63.8% | Purchase Price | $58,000,000 | 96.7% | |
| Borrower Sponsor Equity | $21,706,085 | 36.2% | Upfront Reserves | $2,092,338 | 3.5% | |
| Seller Credits | ($1,864,428) | (3.1%) | ||||
| Closing Costs | $1,778,175 | 3.0% | ||||
| Total Sources | $60,006,085 | 100.0% | Total Uses | $60,006,085 | 100.0% | |
The Borrower / Borrower Sponsor. The borrower, Thor 130-150 Shoreline LLC, is a single purpose Delaware limited liability company structured to be bankruptcy-remote with two independent directors in its organizational structure. The sponsor of the borrower and the non-recourse carveout guarantor is Joseph J. Sitt.
Joseph J. Sitt is President and CEO of Thor Equities, a firm specializing in urban real estate development, leasing and management of commercial, residential, retail, hotel and mixed-use assets. Founded in 1986 by Mr. Sitt, the company owns property in the United States, Europe and Latin America, with portfolio transactions and a development pipeline in excess of $10.0 billion and totaling more than 20.0 million sq. ft. Mr. Sitt is also the CEO of Thor Retail Advisors, a leasing agent and exclusive representative of global retailers in their
THE INFORMATION IN THIS STRUCTURAL AND COLLATERAL TERM SHEET IS NOT COMPLETE AND MAY BE AMENDED PRIOR TO THE TIME OF SALE. THIS TERM SHEET IS NOT AN OFFER TO SELL THESE SECURITIES AND IT IS NOT A SOLICITATION OF AN OFFER TO BUY THESE SECURITIES IN ANY JURISDICTION WHERE THE OFFER OR SALE IS NOT PERMITTED.
93
130-150 Shoreline Drive Redwood City, CA 94065 |
Collateral Asset Summary – Loan No. 10 Shoreline Center |
Cut-off Date Balance: Cut-off Date LTV: U/W NCF DSCR: U/W NOI Debt Yield: |
$38,300,000 63.8% 2.32x 10.6% |
search for prime locations; Chairman of Thor Urbana, which develops and acquires retail, office and mixed-use properties in Mexico City, Guadalajara, Mérida and other Mexican cities; and Chairman and Managing Principal of Thor Urban Property Funds, an investment vehicle serving pension funds, investment banks, college endowments and foundations.
The Property. The Shoreline Center Property consists of two connected, two-story, newly renovated office/R&D buildings totaling 81,569 sq. ft. situated on 4.97 acres in the Redwood Shores neighborhood of Redwood City, California. Constructed in 1985, the Shoreline Center Property recently underwent an approximately $13.0 million ($159 PSF) renovation in 2017, of which approximately $2.5 million was invested directly by the sole tenant, Auris Surgical Robotics, Inc. (“Auris”). In addition to tenant improvements, the renovations modernized both the interiors and exteriors of the buildings, updated the HVAC systems and reconfigured a portion of the interior space for R&D/lab use. A summary and breakdown of the renovation costs at the Shoreline Center Property are provided in the chart below.
| Renovation Costs(1) | ||||
| Item | Completed | Remaining | Total | PSF |
| Tenant Improvements | $6,156,529 | $1,376,021 | $7,532,550 | $92.35 |
| Auris Investment | $2,500,000 | $0 | $2,500,000 | $30.65 |
| Exterior Renovation | $1,782,858 | $0 | $1,782,858 | $21.86 |
| Interior Renovation | $669,166 | $0 | $669,166 | $8.20 |
| HVAC | $191,470 | $0 | $191,470 | $2.35 |
| Landscaping | $184,129 | $0 | $184,129 | $2.26 |
| Soft Costs | $127,480 | $0 | $127,480 | $1.56 |
| Total | $11,611,632 | $1,376,021 | $12,987,653 | $159.22 |
| (1) | Source: Borrower. |
The Shoreline Center Property’s interior spaces were renovated for specific tenant requirements, which include office, R&D, packaging, assembly, demonstration facilities and two surgical suites (for approved product development / technical studies). Ceiling heights vary from 10 feet in the open office areas, to 18 feet in the lab space, to 24 feet in the warehouse area. The Shoreline Center Property includes 252 surface parking spaces providing a parking ratio of 3.08 per 1,000 sq. ft. of rentable area. According to the appraisal, the Shoreline Center Property’s land value is equal to $31.4 million or approximately 82.0% of the Shoreline Center Loan balance.
As of May 6, 2018, the Shoreline Center Property was 100.0% leased to Auris.
Environmental Matters. The Phase I environmental report, dated December 22, 2017, recommended no further action.
Major Tenant.
Auris Surgical Robotics, Inc. (81,569 sq. ft.; 100.0% of NRA; 100.0% of U/W Base Rent) Founded in 2007, Auris is a health care device company that engages in the development of robotics technology for medical applications. Based on a recent Series D round of financing which closed in August 2017, the company was valued at approximately $1.0 billion and has raised more than $500 million in equity capital from technology investors. Auris is currently focused on the advancement of microsurgical, minimally-invasive systems that could potentially result in earlier diagnosis and better surgical outcomes, including faster recovery and fewer complications for the patient. In May 2016, FDA approval was granted to begin marketing the Auris Robotic Endoscopy System (“ARES”), a device inserted through the nose or mouth, which allows for the examination of the lungs without an incision. Auris was founded by Dr. Frederic Moll who serves on the boards of several health care companies. In 1995, he co-founded and was the first CEO of Intuitive Surgical (NASDAQ: ISRG, Market Cap: $45.0 billion as of April 6, 2018), a surgical robotics firm that was a pioneer in minimally invasive surgical technology. Dr. Moll and Intuitive Surgical developed and manufactured the da Vinci Surgical System, a surgeon-controlled machine that aides in the performance of minimally-invasive procedures. As of September 2017, there are more than 2,700 da Vinci systems used in hospitals across the U.S. Similar to the da Vinci System, robotic technologies being developed by Auris are expected to be operated by a surgeon using 3-D mapping of the body.
Auris leases 100.0% of the Shoreline Center Property on a triple net basis which serves as its corporate headquarters. The lease has no termination options and contains one, five-year extension option.
The Market. The Shoreline Center Property is located in the greater South Peninsula office/R&D market. As of Q3 2017, the South Peninsula office/R&D market contained approximately 30.4 million sq. ft. with an overall vacancy rate of 5.1%. Within the South Peninsula office/R&D market, the Shoreline Center Property is located within the Redwood City/Redwood Shores office/R&D submarket. As of Q3 2017, the Redwood City/Redwood Shores office/R&D submarket contained approximately 3.7 million sq. ft. with an overall vacancy rate of 8.5%.
THE INFORMATION IN THIS STRUCTURAL AND COLLATERAL TERM SHEET IS NOT COMPLETE AND MAY BE AMENDED PRIOR TO THE TIME OF SALE. THIS TERM SHEET IS NOT AN OFFER TO SELL THESE SECURITIES AND IT IS NOT A SOLICITATION OF AN OFFER TO BUY THESE SECURITIES IN ANY JURISDICTION WHERE THE OFFER OR SALE IS NOT PERMITTED.
94
130-150 Shoreline Drive Redwood City, CA 94065 |
Collateral Asset Summary – Loan No. 10 Shoreline Center |
Cut-off Date Balance: Cut-off Date LTV: U/W NCF DSCR: U/W NOI Debt Yield: |
$38,300,000 63.8% 2.32x 10.6% |
The table below summarizes the comparable leases as determined by the appraisal.
| Rent Comparables(1) | |||||||||
| Address | City, State | Total
Building Size (NRA) |
Tenant Name | Year Built |
Lease Date | Size (NRA) |
Term (Years) |
Initial Rent PSF |
Lease Type |
| 130-150 Shoreline Drive | Redwood City, CA | 81,569 | Auris Surgical Robotics, Inc. | 1985 | 2017/2018 | 81,569 | 8.0 | $56.87(2) | NNN |
| 805 Veterans Boulevard | Redwood City, CA | 86,000 | Ivalua | 1985 | Jan-17 | 7,108 | 3.0 | $51.00 | NNN |
| 200 Chesapeake Drive | Redwood City, CA | 25,254 | Medtronic | 1988 | May-17 | 17,153 | 3.0 | $46.80 | NNN |
| 301 Galveston Drive | Redwood City, CA | 25,893 | AcelRx Pharmaceuticals, Inc. | 1986 | Jun-17 | 25,893 | 6.0 | $46.32 | NNN |
| 640 Galveston Drive | Redwood City, CA | 50,976 | Bolt Bio Therapeutics | 1993 | Aug-17 | 9,400 | 5.2 | $50.40 | NNN |
| 505 Penobscot Drive | Redwood City, CA | 82,320 | Guardant Health, Inc. | 1986 | Oct-17 | 48,787 | 3.1 | $51.48 | NNN |
| 1400 Bridge Parkway | Redwood City, CA | 46,761 | Xtime, Inc. | 1998 | Nov-17 | 38,751 | 3.1 | $48.60 | NNN |
| (1) | Source: Appraisal. |
| (2) | Initial Rent PSF is inclusive of $240,314 in base rent steps taken through November 1, 2018. |
Cash Flow Analysis.
| Cash Flow Analysis(1) | ||||
| Appraisal | In-Place (5/6/2018)(2) | U/W | U/W PSF | |
| Base Rent | $4,538,451 | $4,398,509 | $4,398,509 | $53.92 |
| Base Rent Steps(3) | 0 | 0 | 240,314 | 2.95 |
| Gross Potential Rent | $4,538,451 | $4,398,509 | $4,638,823 | $56.87 |
| Total Recoveries | 1,207,918 | 1,212,891 | 1,202,258 | 14.74 |
| Less: Vacancy(4) | (287,318) | 0 | (584,108) | (7.16) |
| Effective Gross Income | $5,459,051 | $5,611,400 | $5,256,973 | $64.45 |
| Total Operating Expenses | 1,223,784 | 1,212,891 | 1,202,258 | 14.74 |
| Net Operating Income | $4,235,267 | $4,398,509 | $4,054,715 | $49.71 |
| TI/LC | 0 | 171,295 | 171,295 | 2.10 |
| Capital Expenditures | 0 | 17,129 | 17,129 | 0.21 |
| Net Cash Flow | $4,235,267 | $4,210,084 | $3,866,290 | $47.40 |
| (1) | The Shoreline Center Property was recently purchased after a full renovation. As such, historical occupancy and financials are not available. |
| (2) | In-Place represents annualized rents per the underwritten rent roll dated May 6, 2018 and is based on leases in place with no vacancy adjustment, contractual tenant reimbursements per the leases and all other U/W expenses and capital items. |
| (3) | UW Base Rent Steps are based on the contractual rent steps for Auris Surgical Robotics, Inc. ($240,314) as of November 1, 2018. |
| (4) | U/W Vacancy is based on 10.0% of the combined Gross Potential Rent and Total Recoveries. |
Property Management. The Shoreline Center Property is managed by G&E Real Estate Management Services, Inc.
Lockbox / Cash Management. The Shoreline Center Loan is structured with a hard lockbox and in place cash management. All rents are required to be deposited directly by the tenants of the Shoreline Center Property into a lockbox account controlled by the lender. All amounts in the lockbox account are required to be swept to a lender-controlled cash management account every business day and applied on each payment date to the payment of debt service and the funding of required reserves. Provided no Cash Trap Period (as defined below) is continuing, all funds remaining in the cash management account after payment of the aforementioned items will be transferred on a monthly basis into the borrowers’ operating account. During a Cash Trap Period, all excess cash in the cash management account will be retained by the lender as additional collateral for the Shoreline Center Loan.
A “Cash Trap Period” will commence upon (i) an event of default or (ii) the commencement of a Lease Sweep Period (as defined below).
A “Lease Sweep Period” will commence (i) on the date that is 18 months prior to the end of the term (including any renewal terms) of any Lease Sweep Lease (as defined below), (ii) if any Lease Sweep Lease is surrendered, cancelled or terminated prior to its then-current expiration date, (iii) if any Lease Sweep Tenant (as defined below) (a) any time prior to February 6, 2019, goes dark or gives notice that it intends to discontinue its business at substantially all of its premises that it previously occupied or (b) any time after February 6, 2019, goes dark or gives notice that it intends to discontinue its business in less than 60.0% of the rentable area it occupies; provided, however, any applicable qualified subleases may count for up to 10.0% towards the 60.0% threshold, (iv) upon the occurrence of a material default under any Lease Sweep Lease or (v) upon the occurrence of a Lease Sweep Tenant insolvency proceeding. During a Lease Sweep Period, all excess cash flow will be deposited into a special rollover reserve account.
THE INFORMATION IN THIS STRUCTURAL AND COLLATERAL TERM SHEET IS NOT COMPLETE AND MAY BE AMENDED PRIOR TO THE TIME OF SALE. THIS TERM SHEET IS NOT AN OFFER TO SELL THESE SECURITIES AND IT IS NOT A SOLICITATION OF AN OFFER TO BUY THESE SECURITIES IN ANY JURISDICTION WHERE THE OFFER OR SALE IS NOT PERMITTED.
95
130-150 Shoreline Drive Redwood City, CA 94065 |
Collateral Asset Summary – Loan No. 10 Shoreline Center |
Cut-off Date Balance: Cut-off Date LTV: U/W NCF DSCR: U/W NOI Debt Yield: |
$38,300,000 63.8% 2.32x 10.6% |
A “Lease Sweep Lease” means the Auris Surgical Robotics, Inc. lease and any lease which covers 14,404 or more sq. ft.
A “Lease Sweep Tenant” means any tenant under a Major Lease, or under one or more leases which when taken together would constitute a Major Lease.
Initial Reserves. At origination, the borrower deposited (i) $87,000 into a tax reserve account, (ii) $89,317 into a free rent reserve account which amount was equal to the remaining unexpired free rent under the Auris lease as of origination, (iii) $1,376,021 into an outstanding TI/LC reserve account which amount is equal to the outstanding TI/LC allowance due to Auris under the Auris lease and (iv) $540,000 into a roof reserve account which amount is equal to 125.0% of the estimated cost to repair and replace the roof at the Shoreline Center Property.
Ongoing Reserves. On a monthly basis, the borrower is required to deposit reserves of (i) 1/12 of the estimated annual real estate taxes, which currently equates to $57,000, into a tax reserve account and (ii) unless an acceptable blanket insurance policy is in place, 1/12 of the estimated annual insurance premiums into an insurance reserve account.
Current Mezzanine or Subordinate Indebtedness. None.
Future Mezzanine or Subordinate Indebtedness Permitted. None.
THE INFORMATION IN THIS STRUCTURAL AND COLLATERAL TERM SHEET IS NOT COMPLETE AND MAY BE AMENDED PRIOR TO THE TIME OF SALE. THIS TERM SHEET IS NOT AN OFFER TO SELL THESE SECURITIES AND IT IS NOT A SOLICITATION OF AN OFFER TO BUY THESE SECURITIES IN ANY JURISDICTION WHERE THE OFFER OR SALE IS NOT PERMITTED.
96
(THIS PAGE INTENTIONALLY LEFT BLANK)
97
1006-1046 Central Parkway South & 121 Interpark Boulevard San Antonio, TX 78232 |
Collateral Asset Summary – Loan No. 11 San Antonio Business Park |
Cut-off Date Balance: Cut-off Date LTV: U/W NCF DSCR: U/W NOI Debt Yield: |
$34,000,000 74.6% 1.44x 9.9% |
| Mortgage Loan Information | |
| Loan Seller: | LCM |
| Loan Purpose: | Acquisition |
| Borrower Sponsor: | John R. Saunders |
| Borrower: | Airport Alamo, LLC |
| Original Balance: | $34,000,000 |
| Cut-off Date Balance: | $34,000,000 |
| % by Initial UPB: | 3.4% |
| Interest Rate: | 4.7300% |
| Payment Date: | 6th of each month |
| First Payment Date: | December 6, 2017 |
| Maturity Date: | November 6, 2027 |
| Amortization: | Interest only for first 24 months; 360 months thereafter |
| Additional Debt: | None |
| Call Protection: | L(30), D(87), O(3) |
| Lockbox / Cash Management(1): | Soft Springing Hard / Springing |
| Reserves | ||
| Initial | Monthly | |
| Taxes: | $0 | $69,027 |
| Insurance: | $25,443 | $8,481 |
| TI/LC(2): | $500,000 | $17,034 |
| Replacement: | $0 | $10,561 |
| Required Repairs: | $500,000 | NAP |
| Earnout(3): | $2,000,000 | NAP |
| Special Rollover(4): | $0 | Springing |
| Financial Information | |
| Cut-off Date Balance / Sq. Ft.: | $83 |
| Balloon Balance / Sq. Ft.: | $71 |
| Cut-off Date LTV: | 74.6% |
| Balloon LTV: | 64.1% |
| Underwritten NOI DSCR(5): | 1.59x |
| Underwritten NCF DSCR(5): | 1.44x |
| Underwritten NOI Debt Yield: | 9.9% |
| Underwritten NCF Debt Yield: | 9.0% |
| Property Information | |
| Single Asset / Portfolio: | Single Asset |
| Property Type: | Flex Industrial |
| Collateral: | Fee Simple |
| Location: | San Antonio, TX |
| Year Built / Renovated: | 1982, 1983, 1984, 1996 / NAP |
| Total Sq. Ft.: | 411,631 |
| Property Management: | CORE Realty Holdings Management, Inc. |
| Underwritten NOI: | $3,375,401 |
| Underwritten NCF: | $3,066,678 |
| Appraised Value: | $45,600,000 |
| Appraisal Date: | September 14, 2017 |
| Historical NOI | |
| Most Recent NOI: | $3,522,668 (T-12 August 31, 2017) |
| 2016 NOI: | $3,238,155 (December 31, 2016) |
| 2015 NOI: | $3,284,431 (December 31, 2015) |
| 2014 NOI: | $3,004,611 (December 31, 2014) |
| Historical Occupancy | |
| Most Recent Occupancy: | 91.5% (February 1, 2018) |
| 2016 Occupancy: | 95.0% (December 31, 2016) |
| 2015 Occupancy: | 92.7% (December 31, 2015) |
| 2014 Occupancy: | 92.7% (December 31, 2014) |
| (1) | The lockbox will spring hard and a cash management period will be triggered (i) upon an event of default, (ii) if the DSCR falls below 1.10x until such time that the DSCR is at least 1.10x for two consecutive quarters or (iii) upon the commencement of a Lease Sweep Period. A “Lease Sweep Period” will commence on the date that (i) is 12 months prior to the end of the term of any Major Lease (as defined herein), (ii) the applicable Major Tenant (as defined herein) under a Major Lease is required to give notice of its exercise of a renewal option (and such renewal has not been so exercised), (iii) any Major Lease is surrendered, cancelled or terminated prior to its then current expiration date, (iv) any Major Tenant goes dark or gives notice that it intends to discontinue its business, (v) a default under any Major Lease is continuing or (vi) a Major Tenant is involved in insolvency proceedings. A “Major Lease” means the Clear Visions, Inc. lease and any other lease or leases with a tenant that covers 30,000 or more sq. ft. A “Major Tenant” means any tenant under a Major Lease. |
| (2) | TI/LC reserves are subject to a cap of $500,000. |
| (3) | Provided no cash management period has occurred or is continuing, the borrower may request disbursement of the earnout reserve, provided, among other things, the property is generating a minimum NCF debt yield of 8.5% on the then outstanding principle balance. |
| (4) | On each monthly payment date during a Lease Sweep Period, any excess cash in the lender controlled cash management account will be transferred to a lender controlled special rollover reserve account. |
| (5) | Based on the amortizing debt service payments. Based on the current interest only payments, the Underwritten NOI DSCR and Underwritten NCF DSCR are 2.07x and 1.88x, respectively. |
|
TRANSACTION HIGHLIGHTS |
| ■ | Property. San Antonio Business Park is a 411,631 sq. ft. flex industrial facility consisting of 17 buildings in two separate business parks. The Property is located to the east and west of US 281, the main thoroughfare for the local area, on a total site area of 29.7 acres in north central San Antonio. |
| ■ | Granular Tenancy. The Property is currently 91.5% occupied by a roster of 53 tenants spanning a number of industries including law, construction, media, tech, logistics and financial services. No single tenant individually accounts for more than 11.8% of the total net rentable area. |
| ■ | Location and Submarket. The Property benefits from access to US 281 with high barriers to entry due to the limited land available in the immediate vicinity for development. The San Antonio International Airport is located approximately two miles south of the Property. According to market reports, the Property’s submarket, North Central, has reported an average occupancy of 94.7% dating back to 2007 and has never dipped below 91.9% over this same time period. |
| ■ | Stable Historical Performance. The Property has a stable operating history with an average NOI of approximately $3.3 million since 2014 and an average historical occupancy of 94.0% over this same time period. |
| ■ | Cash Equity. At loan closing, the borrower sponsor contributed approximately $14.9 million of new cash equity to acquire the Property. |
THE INFORMATION IN THIS STRUCTURAL AND COLLATERAL TERM SHEET IS NOT COMPLETE AND MAY BE AMENDED PRIOR TO THE TIME OF SALE. THIS TERM SHEET IS NOT AN OFFER TO SELL THESE SECURITIES AND IT IS NOT A SOLICITATION OF AN OFFER TO BUY THESE SECURITIES IN ANY JURISDICTION WHERE THE OFFER OR SALE IS NOT PERMITTED.
98
4041 Harney Street San Diego, CA 92110 |
Collateral Asset Summary – Loan No. 12 Best Western Plus Hacienda Hotel Old Town |
Cut-off Date Balance: Cut-off Date LTV: U/W NCF DSCR: U/W NOI Debt Yield: |
$31,500,000 54.2% 1.92x 11.1% |
| Mortgage Loan Information | |
| Loan Seller: | LCM |
| Loan Purpose: | Refinance |
| Borrower Sponsor: | William H. McWethy, Jr. |
| Borrower: | Harney Hospitality, L.P. |
| Original Balance: | $31,500,000 |
| Cut-off Date Balance: | $31,500,000 |
| % by Initial UPB: | 3.1% |
| Interest Rate: | 5.1000% |
| Payment Date: | 6th of each month |
| First Payment Date: | May 6, 2018 |
| Maturity Date: | April 6, 2028 |
| Amortization: | Interest Only |
| Additional Debt: | None |
| Call Protection: | L(25), D(91), O(4) |
| Lockbox / Cash Management(1): | Hard / Springing |
| Reserves | ||
| Initial | Monthly | |
| Taxes: | $0 | $16,500 |
| Insurance: | $78,000 | $6,500 |
| Ground Rent(2): | $3,174 | $3,174 |
| FF&E: | $0 | 1/12th of 4% of gross annual operating income |
| Financial Information | |
| Cut-off Date Balance / Room: | $157,500 |
| Balloon Balance / Room: | $157,500 |
| Cut-off Date LTV: | 54.2% |
| Balloon LTV: | 54.2% |
| Underwritten NOI DSCR: | 2.15x |
| Underwritten NCF DSCR: | 1.92x |
| Underwritten NOI Debt Yield: | 11.1% |
| Underwritten NCF Debt Yield: | 9.9% |
| Property Information | |
| Single Asset / Portfolio: | Single Asset |
| Property Type: | Full Service Hospitality |
| Collateral(2): | Fee Simple/Leasehold |
| Location: | San Diego, CA |
| Year Built / Renovated: | 1988 / 1997 |
| Total Rooms: | 200 |
| Property Management: | Pacific Hospitality Group, Inc. |
| Underwritten NOI: | $3,499,120 |
| Underwritten NCF: | $3,132,077 |
| Appraised Value: | $58,100,000 |
| Appraisal Date: | September 13, 2017 |
| Historical NOI | |
| Most Recent NOI: | $3,744,300 (December 31, 2017) |
| 2016 NOI: | $4,089,985 (December 31, 2016) |
| 2015 NOI: | $4,164,670 (December 31, 2015) |
| 2014 NOI: | $3,387,292 (December 31, 2014) |
| Historical Occupancy / ADR / RevPAR | |
| Most Recent Occupancy: | 83.7% / $134.98 / $113.02 (December 31, 2017) |
| 2016 Occupancy: | 82.3% / $139.92 / $115.11 (December 31, 2016) |
| 2015 Occupancy: | 82.3% / $135.60 / $111.57 (December 31, 2015) |
| 2014 Occupancy: | 81.6% / $128.00 / $104.47 (December 31, 2014) |
| (1) | A cash management period will be triggered (i) upon an event of default, (ii) if the debt yield falls below 8.0% until such time that the debt yield is at least 8.0% for two consecutive quarters, (iii) upon the death or incapacity of the borrower sponsor, (iv) upon a monetary or material non-monetary default under the franchise agreement, (v) upon the expiration or early termination of the franchise agreement or (vi) upon a monetary or material non-monetary default under the ground lease. |
| (2) | A portion of the Property (25,500 sq. ft. or approximately 17%) located at the northwestern-most parcel is subject to a long term ground lease with the County of San Diego. The remaining portion of the Property is owned in fee. The ground lease commenced on February 21, 2002 with a base term of 59 years and contains two, 20-year extension options. Ground rent is currently $38,089 per annum and is subject to annual adjustments based on changes to the cost of living adjustments (which is similar to the consumer price index) with a capped increase of 5.0% annually. Every 10 years ground rent is reset (next reset is January 2022) to the prevailing fair market rent; provided that such reset cannot exceed 150.0% of the previous ground rent set as of the prior 10 year reset currently equal to $35,231. Ground rent was underwritten based on the maximum possible ground rent payment reset in January 2022 equal to 150.0% of the prior rent or $52,847. |
|
TRANSACTION HIGHLIGHTS |
| ■ | Property. Best Western Plus Hacienda Old Town is a 200-room full service hotel with one restaurant and bar, approximately 4,500 sq. ft. of meeting space, an outdoor pool and garage parking structure located in the Old Town area of San Diego, California. |
| ■ | Historical Performance. The Property has achieved an average of 82.5% occupancy since 2014 and reported 83.7% occupancy as of December 31, 2017. RevPAR has remained stable and has averaged $111.04 for the same time period. |
| ■ | Location. The Property is located on a 3.51-acre site adjacent to a public park with good frontage and visibility along Harney Street. The Property benefits from excellent access to downtown San Diego and the San Diego International Airport, which is located 3.8 miles southeast of the Property. Several of San Diego’s most prominent tourist attractions including Sea World, San Diego Zoo, the Gaslamp Quarter and Balboa Park are all located within a 5-mile radius of the Property. |
| ■ | Borrower Sponsor. The borrower sponsor, William H. McWelthy, Jr, has owned and operated the Property since developing the first 152 rooms in 1988. Having completed two subsequent expansions, in 1997 and 2003, and having been the only owner and manager of the asset, the borrower sponsor offers in-depth knowledge of the asset and how it competes within its submarket and competitive set. |
THE INFORMATION IN THIS STRUCTURAL AND COLLATERAL TERM SHEET IS NOT COMPLETE AND MAY BE AMENDED PRIOR TO THE TIME OF SALE. THIS TERM SHEET IS NOT AN OFFER TO SELL THESE SECURITIES AND IT IS NOT A SOLICITATION OF AN OFFER TO BUY THESE SECURITIES IN ANY JURISDICTION WHERE THE OFFER OR SALE IS NOT PERMITTED.
99
250 Lehigh Valley Mall Whitehall, PA 18052 |
Collateral Asset Summary – Loan No. 13 Lehigh Valley Mall |
Cut-off Date Balance: Cut-off Date LTV: U/W NCF DSCR: U/W NOI Debt Yield: |
$29,744,472 44.6% 2.07x 12.6% |
| Mortgage Loan Information | |
| Loan Seller(1): | GACC |
| Loan Purpose: | Refinance |
| Borrower Sponsors(2): | Simon Property Group, L.P.;Pennsylvania Real Estate Investment Trust |
| Borrower: | Lehigh Valley Mall, LLC |
| Original Balance(3): | $30,000,000 |
| Cut-off Date Balance(3): | $29,744,472 |
| % by Initial UPB: | 3.0% |
| Interest Rate: | 4.0560% |
| Payment Date: | 1st of each month |
| First Payment Date: | December 1, 2017 |
| Maturity Date: | November 1, 2027 |
| Amortization: | 360 months |
| Additional Debt(3): | $168,552,005 Pari Passu Debt |
| Call Protection(4)(5): | L(30), D(83), O(7) |
| Lockbox / Cash Management(6): | Hard / Springing |
| Reserves(7) | ||
| Initial | Monthly | |
| Taxes: | $0 | Springing |
| Insurance: | $0 | Springing |
| Replacement: | $0 | Springing |
| TI/LC: | $0 | $81,785 |
| Outstanding TI/LC: | $443,000 | $0 |
| Tenant Rent Holdback: | $208,533 | $0 |
| Release Parcel: | $0 | Springing |
| Financial Information(8) | |
| Cut-off Date Balance / Sq. Ft.: | $364 |
| Balloon Balance / Sq. Ft.: | $292 |
| Cut-off Date LTV: | 44.6% |
| Balloon LTV: | 35.8% |
| Underwritten NOI DSCR: | 2.16x |
| Underwritten NCF DSCR: | 2.07x |
| Underwritten NOI Debt Yield: | 12.6% |
| Underwritten NCF Debt Yield: | 12.1% |
| (1) | The Lehigh Valley Mall Whole Loan was co-originated by JP Morgan Chase Bank, National Association, Column Financial, Inc. (“Column”) and Cantor Commercial Real Estate Lending, L.P. (“CCRE”). Deutsche Bank AG, acting through its New York Branch (an affiliate of GACC) acquired two pari passu notes, with an aggregate original principal balance of $45.0 million from CCRE and has re-underwritten such mortgage loan in accordance with the procedures described under “Transaction Parties – The Sponsors and Mortgage Loan Sellers– German American Capital Corporation” in the Preliminary Prospectus. |
| (2) | Simon Property Group, L.P. is the non-recourse carveout guarantor. The aggregate liability of the nonrecourse carveout guarantor under the guaranty is limited to an aggregate amount of $40,000,000 plus all reasonable out-of-pocket costs and expenses incurred by the lender in the enforcement or preservation of its rights under the guaranty. There is no separate environmental indemnity for the Mortgage Loan, and accordingly such cap includes liabilities for violation of environmental covenants under such guaranty. |
| (3) | The Lehigh Valley Mall whole loan is evidenced by seven pari passu notes with an aggregate original principal balance of $200.0 million (the “Lehigh Valley Mall Whole Loan”). The Original Balance of $30.0 million and Cut-off Date Balance of $29.7 million represents the non-controlling Note A-1-C and Note A-2-C-2, which will be contributed to the COMM 2018-COR3 mortgage trust. The controlling Note A-1-A, with an original principal balance of $42.0 million, was contributed to the Benchmark 2018-B1 mortgage trust. The non-controlling note A-1-B, with an original principal balance of $50.0 million was contributed to CSAIL 2017-CX10. The non-controlling Note A-2-A, with an original principal balance of $35.5 million, was contributed to Benchmark 2018-B2. The non-controlling note A-2-B, with an original principal balance of $27.5 million was contributed to CSAIL 2018-CX11. The remaining Note A-2-C-1, with an original principal balance of $15.0 million, is held by DBNY and is expected to be contributed to one or more future securitization trusts. For additional information on the pari passu companion loans, see “Description of the Mortgage Pool – The Whole Loans” in the Preliminary Prospectus. |
| Property Information | |
| Single Asset / Portfolio: | Single Asset |
| Property Type: | Super Regional Mall |
| Collateral(9): | Fee Simple |
| Location: | Whitehall, PA |
| Year Built / Renovated: | 1976 / 2006 |
| Total Sq. Ft.: | 545,233 |
| Property Management: | Simon Management Associates, LLC |
| Underwritten NOI(10)(11): | $24,932,185 |
| Underwritten NCF: | $23,926,829 |
| Appraised Value: | $445,000,000 |
| Appraisal Date: | September 4, 2017 |
| Historical NOI | |
| Most Recent NOI(10): | $26,376,248 (T-12 August 31, 2017) |
| 2016 NOI: | $27,494,559 (December 31, 2016) |
| 2015 NOI: | $26,642,237 (December 31, 2015) |
| 2014 NOI: | $26,485,779 (December 31, 2014) |
| Historical Occupancy | |
| Most Recent Occupancy(11): | 83.9% (October 12, 2017) |
| 2016 Occupancy: | 96.1% (December 31, 2016) |
| 2015 Occupancy: | 95.3% (December 31, 2015) |
| 2014 Occupancy: | 97.4% (December 31, 2014) |
| (4) | The lockout period will be at least 30 payment dates beginning with, and including, the first payment date of December 1, 2017. The actual lockout period may be longer. Defeasance of the full $200.0 million Lehigh Valley Mall Whole Loan is permitted after the date that is the earlier to occur of (i) two years after the closing date of the securitization that includes the last note to be securitized (the “REMIC Prohibition Period”) and (ii) December 1, 2020 (such earlier date, the “Permitted Release Date”). The borrower is also permitted to prepay the Lehigh Valley Mall Whole Loan with the payment of a yield maintenance premium after the occurrence of the Permitted Release Date if the REMIC Prohibition Period has not occurred prior to December 1, 2020. |
| (5) | The borrower may obtain the release of the Macy’s release parcel from the lien of the Lehigh Valley Mall Whole Loan and concurrently transfer the Macy’s release parcel in connection with the exercise by Macy’s of a purchase option in its lease, subject to satisfaction of certain conditions set forth in the loan documents including the partial prepayment, with yield maintenance, or (after the Permitted Release Date) defeasance of the Lehigh Valley Mall Whole Loan in an amount equal to 100% of the gross cash proceeds (net of any reasonable and customary closing costs actually incurred by the borrower in connection with such sale to Macy’s) of the sale (the “Release Parcel Amount”). Please see “Description of the Mortgage Pool— Certain Terms of the Mortgage Loans—Partial Releases” in the Preliminary Prospectus for additional information. |
| (6) | In place cash management will be triggered upon the occurrence and during the continuance of a Lockbox Event (as defined below). A “Lockbox Event” means the occurrence of (i) an event of default, (ii) the bankruptcy or insolvency of the borrower, (iii) the bankruptcy or insolvency of the property manager (if the manager is an affiliate and is not replaced within 60 days in accordance with the loan documents), (iv) the debt service coverage ratio (as calculated in the loan documents) based on the trailing four quarter period falling below 1.50x for two consecutive quarters, (v) two or more anchor tenants (Boscov’s, JCPenney and Macy’s) closing, ceasing operation, going dark, vacating or abandoning the space operated under their respective leases or reciprocal easement agreement, as applicable or (vi) less than 70% of the gross leasable square footage of in-line space at the Lehigh Valley Mall property being leased (an “Occupancy Trigger Event”). |
| (7) | The borrower is required to deposit 1/12 of annual estimated real estate taxes (i) during the continuance of an event of default, (ii) during the continuance of a DSCR Reserve Trigger Event (as defined below), (iii) during the continuance of an Occupancy Trigger Event or (iv) if the borrower fails to pay taxes prior to the assessment of any penalty or provide evidence of satisfactory payment of all taxes due. The borrower is required to deposit 1/12 of the annual insurance premiums (i) during the continuance of an event of default or (ii) if a reasonably acceptable blanket insurance policy is no longer in place. The borrower is required to deposit $9,087 into a replacement reserve account during the continuance of (i) an event of default, (ii) a DSCR Reserve Trigger Event or (iii) an Occupancy Trigger Event, subject to a cap of $327,140. The TI/LC reserve account is subject to a cap of $2,994,258. In the event that Macy’s elects to exercise its purchase option and the Macy’s parcel is released in accordance with the loan documents, in lieu of prepaying or partially defeasing the Lehigh Valley Mall Whole Loan, the borrower may deposit the Release Parcel Amount with respect to the Macy’s purchase to be held as additional collateral for the Lehigh Valley Mall Whole Loan. A “DSCR Reserve Trigger Event” means the debt service coverage ratio based on the trailing four calendar quarter period immediately preceding the date of such determination is less than 1.65x for two consecutive calendar quarters. |
| (8) | The Lehigh Valley Mall Whole Loan is secured by the ground leasehold interest of the borrower and the fee simple interest of an affiliate of the borrower. For purposes of the Preliminary Prospectus, the Lehigh Valley Mall property is generally treated as a fee simple interest. |
| (9) | Balance / Sq. Ft., LTV, DSCR and Debt Yield calculations are based on the aggregate Lehigh Valley Mall Whole Loan. |
| (10) | The decrease in Underwritten NOI from Most Recent NOI is driven by the closure of Babies R Us, Teavana and Freeman Jewelers. Babies R Us’ parent company, Toys R Us, filed for Chapter 11 bankruptcy in September 2017 and the related space has been underwritten as vacant. Babies R Us is conducting a liquidation sale and is expected to vacate its space and reject its lease. Teavana’s parent company, Starbucks, announced the closure of all Teavana stores nationwide and the related space has been underwritten as vacant. Additionally, Freeman Jewelers is vacating the Lehigh Valley Mall property and has been underwritten as vacant. |
| (11) | As of October 12, 2017, the Lehigh Valley Mall property was 92.1% physically occupied. Most Recent Occupancy of 83.9% reflects the underwritten occupancy, which excludes Babies R Us, Teavana, Bath & Body Works, Payless ShoeSource, Freeman Jewelers and Gymboree, each of which has been underwritten as vacant as each tenant has either vacated its space, is expected to vacate its space or has a parent company that has filed for Chapter 11 bankruptcy protection. As of February 22, 2018, the property was 92.5% physically occupied. |
TRANSACTION HIGHLIGHTS |
| ■ | Property. The Lehigh Valley Mall property is a super regional mall located in Whitehall, Pennsylvania consisting of a traditional two-story enclosed mall and outparcel strip center as well as a more recently constructed, one-story lifestyle center component. The original improvements were constructed in 1976, while the lifestyle center addition was developed in 2006 by the borrower sponsors at a cost of approximately $41.0 million. Lehigh Valley Mall totals approximately 1.2 million sq. ft., of which 545,233 serves as collateral for the Lehigh Valley Mall Whole Loan, and is situated on an approximately 123.8 acre site. As of October 12, 2017, the Lehigh Valley Mall property was 92.1% physically occupied (with 83.9% underwritten occupancy) by a broad mix of 127 national and international brand-name retailers, anchored by Macy’s (ground lease), JCPenney (non-collateral) and Bob’s Discount Furniture. As of February 22, 2018, the property was 92.5% physically occupied. Lehigh Valley Mall had August 2017 TTM in-line sales of approximately $564 per sq. ft. and corresponding occupancy cost of 13.0%. |
| ■ | Market. The Lehigh Valley Mall property is located in Whitehall, Lehigh County, Pennsylvania, located approximately one hour north of Philadelphia and an hour and a half from New York City. The Lehigh Valley Mall property is also located approximately two miles north of Allentown, the fourth largest city in Pennsylvania and the third largest urbanized area in the state, after Philadelphia and Pittsburgh. Additionally, the Allentown central business district is located approximately two miles south of the Lehigh Valley Mall property. Whitehall is home to approximately 27,500 residents and the largest employers in the area include Walmart, Amazon.com, St. Luke’s Hospital and Lehigh Valley Physician Group. Additionally, the Allentown area is expected to benefit from a $335 million warehouse and logistics hub that FedEx Ground is constructing. The facility is expected to open in 2018 and to employ approximately 700 people. |
| ■ | Borrower Sponsors. Simon Property Group, L.P. is an affiliate of Simon Property Group Inc. (“SPG”). SPG was founded in 1960 and is headquartered in Indianapolis, Indiana. SPG (NYSE: SPG, rated A3/A by Moody’s and S&P) is an S&P 100 company which currently owns or has an interest in 227 retail properties in North America, Europe and Asia comprising approximately 189.7 million sq. ft. Pennsylvania Real Estate Investment Trust (“PREIT”) is a publicly traded REIT (NYSE: PEI) that is focused on the ownership and management of shopping malls. PREIT is currently headquartered in Philadelphia, Pennsylvania and owns and operates over 22.5 million sq. ft. of retail space in the United States, with a concentration in the Mid-Atlantic region. |
THE INFORMATION IN THIS STRUCTURAL AND COLLATERAL TERM SHEET IS NOT COMPLETE AND MAY BE AMENDED PRIOR TO THE TIME OF SALE. THIS TERM SHEET IS NOT AN OFFER TO SELL THESE SECURITIES AND IT IS NOT A SOLICITATION OF AN OFFER TO BUY THESE SECURITIES IN ANY JURISDICTION WHERE THE OFFER OR SALE IS NOT PERMITTED.
100
4550-4578 Van Nuys Boulevard Sherman Oaks, CA 91403 |
Collateral Asset Summary – Loan No. 14 Sherman Oaks Collection |
Cut-off Date Balance: Cut-off Date LTV: U/W NCF DSCR: U/W NOI Debt Yield: |
$22,400,000 63.6% 1.53x 7.5% |
| Mortgage Loan Information | |
| Loan Seller: | LCM |
| Loan Purpose: | Refinance |
| Borrower Sponsor: | Mark A. Schurgin |
| Borrower: | MilSam, LLC |
| Original Balance: | $22,400,000 |
| Cut-off Date Balance: | $22,400,000 |
| % by Initial UPB: | 2.2% |
| Interest Rate: | 4.6390% |
| Payment Date: | 6th of each month |
| First Payment Date: | February 6, 2018 |
| Maturity Date: | January 6, 2028 |
| Amortization: | Interest Only |
| Additional Debt: | None |
| Call Protection: | L(28), D(88), O(4) |
| Lockbox / Cash Management(1): | Hard / Springing |
| Reserves | ||
| Initial | Monthly | |
| Taxes: | $170,000 | $27,620 |
| Insurance(2): | $0 | Springing |
| TI/LC(3): | $740,601 | $4,167 |
| Replacement: | $0 | $521 |
| Earnout(4): | $400,000 | NAP |
| Special Rollover(5): | $0 | Springing |
| Financial Information | ||
| Cut-off Date Balance / Sq. Ft.: | $716 | |
| Balloon Balance / Sq. Ft.: | $716 | |
| Cut-off Date LTV: | 63.6% | |
| Balloon LTV: | 63.6% | |
| Underwritten NOI DSCR: | 1.59x | |
| Underwritten NCF DSCR: | 1.53x | |
| Underwritten NOI Debt Yield: | 7.5% | |
| Underwritten NCF Debt Yield: | 7.2% | |
| Property Information | |
| Single Asset / Portfolio: | Single Asset |
| Property Type: | Shadow Anchored Retail |
| Collateral: | Fee Simple |
| Location: | Sherman Oaks, CA |
| Year Built / Renovated: | 1960 / 2017 |
| Total Sq. Ft.: | 31,285 |
| Property Management: | Festival Management Corporation |
| Underwritten NOI: | $1,670,317 |
| Underwritten NCF: | $1,615,881 |
| Appraised Value: | $35,200,000 |
| Appraisal Date: | November 20, 2017 |
| Historical NOI | |
| Most Recent NOI: | NAP |
| 2017 NOI: | NAP |
| 2016 NOI: | NAP |
| 2015 NOI: | NAP |
| Historical Occupancy | |
| Most Recent Occupancy: | 91.9% (April 1, 2018) |
| 2017 Occupancy: | NAP |
| 2016 Occupancy: | NAP |
| 2015 Occupancy: | NAP |
| (1) | A cash management period will be triggered (i) upon an event of default, (ii) if the DSCR falls below 1.15x after the 12th monthly payment date until such time that the DSCR is at least 1.15x for two consecutive quarters or (iii) upon the commencement of a Lease Sweep Period. A “Lease Sweep Period” will commence upon (i) 12 months prior to the end of the term of any Major Lease (as defined herein), (ii) the date required under a Major Lease by which the applicable Major Tenant (as defined herein) is required to give notice of its exercise of a renewal option under the Major Lease (and such renewal has not been so exercised), (iii) any Major Lease is surrendered, cancelled or terminated prior to its then current expiration date, (iv) any Major Tenant goes dark or gives notice that it intends to discontinue its business, (v) the occurrence and continuance of a default under any Major Lease or (vi) the occurrence of a Major Tenant insolvency proceedings. A “Major Lease” means the Ulta lease and any other lease or leases that cover 10,000 or more sq. ft. A “Major Tenant” means any tenant under a Major Lease. |
| (2) | Provided no event of default has occurred and is continuing, the borrower may provide insurance under an acceptable blanket policy. At origination, an acceptable blanket policy is in effect. The borrower sponsor is financing the blanket policy premiums with First Insurance Funding Corp. under a premium finance agreement, pursuant to which the borrower sponsor is required to pay monthly payments of $22,647.78. |
| (3) | TI/LC reserves are subject to a cap of $200,000. |
| (4) | The upfront $400,000 earnout reserve will be released to the borrower upon tenant, Maestro’s, taking possession of its space (3.4% of total net rentable area) and the Property achieving an NCF Debt Yield of 7.0%. |
| (5) | On each monthly payment date during a Lease Sweep Period, the borrower is required to deposit all excess cash into a special rollover reserve account. |
|
TRANSACTION HIGHLIGHTS |
| ■ | Property. Sherman Oaks Collection is a remodeled 31,285 sq. ft. shadow anchored retail property located between Moorpark Street and the Ventura 101 Freeway in the Sherman Oaks area of the San Fernando Valley region of the city of Los Angeles. The Property was originally built in 1960, most recently renovated in 2017 and is located on a 1.53-acre site. The Property is part of a larger shopping center that is anchored by Gelson’s Supermarket and Best Buy. |
| ■ | Tenancy. The Property is currently 91.9% leased to both national and regional tenants including Starbucks, FedEx, Sprint and Ulta. As a result of the recent $6.3 million renovation, all of the leases at the Property were signed in 2017 and 2018 resulting in low exposure to near term rollover. Only 15.3% of the total NRA is due to expire in 2022 and 2023. |
| ■ | Location. The Property is located along a well traveled arterial (estimated daily traffic count of 42,000 vehicles) between the 101 Freeway and Ventura Boulevard. The 2016 total population and average household income within a 3-mile radius of the Property were 192,376 and $106,666, respectively. As of 1Q18, the retail vacancy in Sherman Oaks was equal to 2.1% with average rent approximately 27.5% higher than the overall Los Angeles average. |
THE INFORMATION IN THIS STRUCTURAL AND COLLATERAL TERM SHEET IS NOT COMPLETE AND MAY BE AMENDED PRIOR TO THE TIME OF SALE. THIS TERM SHEET IS NOT AN OFFER TO SELL THESE SECURITIES AND IT IS NOT A SOLICITATION OF AN OFFER TO BUY THESE SECURITIES IN ANY JURISDICTION WHERE THE OFFER OR SALE IS NOT PERMITTED.
101
Various New York, NY Various |
Collateral Asset Summary – Loan No. 15 NYC Parking Portfolio |
Cut-off Date Balance: Cut-off Date LTV: U/W NCF DSCR: U/W NOI Debt Yield: |
$21,675,000 63.6% 1.65x 7.5% |
| Mortgage Loan Information | |
| Loan Seller: | LCM |
| Loan Purpose(1): | Recapitalization |
| Borrowers Sponsor: | Aaron Katz |
| Borrowers: | Rector Albany LLC; 94TH & Riverside LLC; Emerald Park LLC |
| Original Balance: | $21,675,000 |
| Cut-off Date Balance: | $21,675,000 |
| % by Initial UPB: | 2.2% |
| Interest Rate: | 4.4382% |
| Payment Date: | 6th of each month |
| First Payment Date: | November 6, 2017 |
| Maturity Date: | October 6, 2027 |
| Amortization: | Interest Only |
| Additional Debt(2): | $1,825,000 Mezzanine Debt |
| Call Protection: | L(31), D(86), O(3) |
| Lockbox / Cash Management(3): | Hard / Springing |
| Reserves | ||
| Initial | Monthly | |
| Taxes: | $110,149 | $27,232 |
| Replacement(4): | $0 | $1,117 |
| Common Charges: | $18,974 | NAP |
| Required Repairs: | $20,875 | NAP |
| Financial Information | ||
| Mortgage Loan | Total Debt | |
| Cut-off Date Balance / Space: | $80,877 | $87,687 |
| Balloon Balance / Space: | $80,877 | $87,687 |
| Cut-off Date LTV: | 63.6% | 68.9% |
| Balloon LTV: | 63.6% | 68.9% |
| Underwritten NOI DSCR: | 1.66x | 1.46x |
| Underwritten NCF DSCR: | 1.65x | 1.44x |
| Underwritten NOI Debt Yield: | 7.5% | 6.9% |
| Underwritten NCF Debt Yield: | 7.4% | 6.8% |
| (1) | Proceeds from the NYC Parking Portfolio loan were used to acquire the Corinthian Parking Garage and retire existing debt on the Rector Place Parking Garage and the Riverside Drive Parking Garage. |
| (2) | The mezzanine loan, funded concurrently with the funding of the NYC Parking Portfolio loan, is coterminous with the NYC Parking Portfolio mortgage loan, accrues interest at a rate equal to 7.5000% and is interest only for the entire term. The mezzanine loan is currently held by LCM or an affiliate. |
| (3) | A
cash management period will be triggered (i) upon an event of default, (ii) if the DSCR
falls below 1.25x until such time that the DSCR is at least 1.25x for two consecutive
quarters or (iii) upon a monetary or material non-monetary default by the borrower under
the related parking lease agreement in effect at each of the mortgaged properties. |
| Property Information | |
| Single Asset / Portfolio(5): | Portfolio of three properties |
| Property Type: | Parking Garages |
| Collateral(5)(6): | Fee Simple/Leasehold |
| Location: | New York, NY |
| Year Built / Renovated: | Various / NAP |
| Total Spaces: | 268 |
| Property Management: | Park-It Management Corp. |
| Underwritten NOI: | $1,622,843 |
| Underwritten NCF: | $1,609,443 |
| Appraised Value: | $34,100,000 |
| Appraisal Date: | Various |
| Historical NOI(7) | |
| Most Recent NOI: | $2,018,562 (T-12 July 31, 2017) |
| 2016 NOI: | $1,776,441 (December 31, 2016) |
| 2015 NOI: | NAP |
| 2014 NOI: | NAP |
| Historical Occupancy(7) | |
| Most Recent Occupancy: | 100.0% (October 1, 2017) |
| 2016 Occupancy: | NAP |
| 2015 Occupancy: | NAP |
| 2014 Occupancy: | NAP |
| (4) | Replacement reserves are subject to a cap of $60,000. |
| (5) | The three properties consist of the related parking garage condominium unit at each of the Corinthian, Riverside and Rector Place residential towers. The borrower owns the fee interest in each property, except the Rector Place Parking Garage property which is a sub-ground leasehold interest. |
| (6) | The Rector Place Parking Garage is on land which is subject to a ground lease between the Battery Park City Authority (“BPCA”), as ground lessor and BPCA, as ground lessee. The ground lessee entered into a sublease with the board of managers of the 1 Rector Park Condominium as attorney-in-fact for all unit owners, as tenant. The borrower is a unit owner. |
| (7) | The borrower sponsor acquired the properties in 2016 and 2017. Prior to origination of the NYC Parking Portfolio loan, all three garages were operated by the borrower sponsor. Historical NOI is based on the borrowers sponsor’s operation of the NYC Parking Portfolio properties. At origination, the borrower acquired the properties and leased the properties to an unaffiliated third party parking operator, Park-It Management Corp., pursuant to a triple net lease expiring on September 30, 2029. The parking operator is required to pay taxes due at each property in addition to rent. With respect to the Rector Place Parking Garage, the property is subject to a PILOT program as described in the Preliminary Prospectus. The Most Recent Occupancy, Underwritten NOI and Underwritten NCF are based on the in place lease with Park-It Management Corp. |
|
TRANSACTION HIGHLIGHTS |
| ■ | Property. The NYC Parking Portfolio consists of three underground parking garages totaling 268 spaces and 60,228 sq. ft. The properties were built in 1985 and 1989 and are all located beneath residential towers that include ground floor office and/or retail space. |
| ■ | Tenancy. Park-It Management Corporation, the operator of each of the garage properties (leasing 100% of the NRA at each property pursuant to 12-year leases with an initial expiration date of September 30, 2029), is a locally-owned and operated business that has been operating in the metro New York area for more than forty years. Park-It currently operates at 31 locations throughout Manhattan. |
| ■ | Location. The properties are located in Manhattan in three distinct, high-density residential neighborhoods (Murray Hill, Battery Park and the Upper West Side). The properties benefit from built in demand drivers due to the residential units situated directly above each property. |
| ■ | Borrower Sponsor. The borrower sponsor, Aaron Katz, has been an operator of parking garages in Seattle since 1994 and in New York City since 2010. |
THE INFORMATION IN THIS STRUCTURAL AND COLLATERAL TERM SHEET IS NOT COMPLETE AND MAY BE AMENDED PRIOR TO THE TIME OF SALE. THIS TERM SHEET IS NOT AN OFFER TO SELL THESE SECURITIES AND IT IS NOT A SOLICITATION OF AN OFFER TO BUY THESE SECURITIES IN ANY JURISDICTION WHERE THE OFFER OR SALE IS NOT PERMITTED.
102
STATEMENT REGARDING ASSUMPTIONS AS TO SECURITIES, PRICING ESTIMATES AND OTHER INFORMATION
This material is for your information, and none of Deutsche Bank Securities Inc., Jefferies LLC, Citigroup Global Markets Inc., J.P. Morgan Securities LLC, Academy Securities, Inc. or any other underwriter, (the “Underwriters”) are soliciting any action based upon it. This material is not to be construed as an offer to sell or the solicitation of any offer to buy any security in any jurisdiction where such an offer or solicitation would be illegal.
Neither this document nor anything contained herein shall form the basis for any contract or commitment whatsoever. The information contained herein is preliminary as of the date hereof. These materials are subject to change, completion or amendment from time to time. The information contained herein will be superseded by similar information delivered to you as part of the preliminary prospectus relating to the COMM 2018-COR3 Mortgage Trust, Commercial Mortgage Pass-Through Certificates, Series 2018-COR3 (the “Offering Document”). The information contained herein supersedes any such information previously delivered and should be reviewed only in conjunction with the entire Offering Document. All of the information contained herein is subject to the same limitations and qualifications contained in the Offering Document. The information contained herein does not contain all relevant information relating to the underlying mortgage loans or mortgaged properties. Such information is described elsewhere in the Offering Document. The information contained herein will be more fully described elsewhere in the Offering Document. The information contained herein should not be viewed as projections, forecasts, predictions or opinions with respect to value. Prior to making any investment decision, prospective investors are strongly urged to read the Offering Document its entirety. Neither the Securities and Exchange Commission nor any state securities commission has approved or disapproved of these securities or determined if this free writing prospectus is truthful or complete. Any representation to the contrary is a criminal offense.
The attached information contains certain tables and other statistical analyses (the “Computational Materials”) which have been prepared in reliance upon information furnished by the Mortgage Loan Sellers. Numerous assumptions were used in preparing the Computational Materials, which may or may not be reflected herein. As such, no assurance can be given as to the Computational Materials’ accuracy, appropriateness or completeness in any particular context; or as to whether the Computational Materials and/or the assumptions upon which they are based reflect present market conditions or future market performance. The Computational Materials should not be construed as either projections or predictions or as legal, tax, financial or accounting advice. You should consult your own counsel, accountant and other advisors as to the legal, tax, business, financial and related aspects of a purchase of these securities. Any weighted average lives, yields and principal payment periods shown in the Computational Materials are based on prepayment and/or loss assumptions, and changes in such prepayment and/or loss assumptions may dramatically affect such weighted average lives, yields and principal payment periods. In addition, it is possible that prepayments or losses on the underlying assets will occur at rates higher or lower than the rates shown in the attached Computational Materials. The specific characteristics of the securities may differ from those shown in the Computational Materials due to differences between the final underlying assets and the preliminary underlying assets used in preparing the Computational Materials. The principal amount and designation of any security described in the Computational Materials are subject to change prior to issuance. None of Underwriters or any of their respective affiliates makes any representation or warranty as to the actual rate or timing of payments or losses on any of the underlying assets or the payments or yield on the securities.
This document contains forward-looking statements. Those statements are subject to certain risks and uncertainties that could cause the success of collections and the actual cash flow generated to differ materially from the information set forth herein. While such information reflects projections prepared in good faith based upon methods and data that are believed to be reasonable and accurate as of the dates thereof, the depositor undertakes no obligation to revise these forward-looking statements to reflect subsequent events or circumstances. Individuals should not place undue reliance on forward-looking statements and are advised to make their own independent analysis and determination with respect to the forecasted periods, which reflect the issuer’s view only as of the date hereof.
| IMPORTANT NOTICE RELATING TO AUTOMATICALLY GENERATED EMAIL DISCLAIMERS |
Any legends, disclaimers or other notices that may appear at the bottom of the email communication to which this free writing prospectus is attached relating to (1) these materials not constituting an offer (or a solicitation of an offer), (2) no representation being made that these materials are accurate or complete and may not be updated or (3) these materials possibly being confidential, are not applicable to these materials and should be disregarded. Such legends, disclaimers or other notices have been automatically generated as a result of these materials having been sent via Bloomberg or another system.