|
FREE WRITING PROSPECTUS
|
||
|
FILED PURSUANT TO RULE 433
|
||
|
REGISTRATION FILE NO.: 333-193376-02
|
||
|
February 26, 2014
|
||||
|
FREE WRITING PROSPECTUS
|
||||
|
STRUCTURAL AND COLLATERAL TERM SHEET
|
||||
|
$1,235,745,402
|
||||
|
(Approximate Total Mortgage Pool Balance)
|
||||
|
$1,073,553,000
|
||||
|
(Approximate Offered Certificates)
|
||||
|
COMM 2014-UBS2
|
||||
|
Deutsche Mortgage & Asset Receiving Corporation
Depositor
|
||||
|
German American Capital Corporation
UBS Real Estate Securities Inc.
KeyBank National Association
Cantor Commercial Real Estate Lending, L.P.
Sponsors and Mortgage Loan Sellers
|
||||
|
|
||||
|
Deutsche Bank Securities
|
UBS Securities LLC
|
|||
|
Joint Bookrunning Managers and Co-Lead Managers
|
||||
|
Cantor Fitzgerald & Co.
|
Drexel Hamilton
|
KeyBanc Capital Markets
|
||
|
Co-Managers
|
||||
| The depositor has filed a registration statement (including the prospectus) with the SEC (SEC File No. 333-193376) for the offering to which this communication relates. Before you invest, you should read the prospectus in the registration statement and other documents the depositor has filed with the SEC for more complete information about the depositor, the issuing trust and this offering. You may get these documents for free by visiting EDGAR on the SEC website at www.sec.gov. Alternatively, the depositor or Deutsche Bank Securities Inc., any other underwriter, or any dealer participating in this offering will arrange to send you the prospectus if you request it by calling toll-free 1-800-503-4611 or by email to the following address: prospectus.cpdg@db.com. The offered certificates referred to in these materials, and the asset pool backing them, are subject to modification or revision (including the possibility that one or more classes of certificates may be split, combined or eliminated at any time prior to issuance or availability of a final prospectus) and are offered on a “when, as and if issued” basis. You understand that, when you are considering the purchase of these certificates, a contract of sale will come into being no sooner than the date on which the relevant class has been priced and we have verified the allocation of certificates to be made to you; any “indications of interest” expressed by you, and any “soft circles” generated by us, will not create binding contractual obligations for you or us. | ||||
COMM 2014-UBS2 Mortgage Trust
Capitalized terms used but not defined herein have the meanings assigned to them in the other Free Writing Prospectus expected to be dated February 26, 2014, relating to the offered certificates (hereinafter referred to as the “Free Writing Prospectus”).
| KEY FEATURES OF SECURITIZATION |
|
Key Features:
|
Pooled Collateral Facts(1):
|
|||||
|
Joint Bookrunners & Co-Lead
|
Deutsche Bank Securities Inc.
|
Initial Outstanding Pool Balance:
|
$1,235,745,402
|
|||
|
Managers:
|
UBS Securities LLC
|
Number of Mortgage Loans:
|
59
|
|||
|
Co-Managers:
|
Cantor Fitzgerald & Co.
|
Number of Mortgaged Properties:
|
95
|
|||
|
KeyBanc Capital Markets Inc.
|
Average Mortgage Loan Cut-off Date Balance:
|
$20,944,837
|
||||
|
Drexel Hamilton, LLC
|
Average Mortgaged Property Cut-off Date Balance:
|
$13,007,846
|
||||
|
Mortgage Loan Sellers:
|
German American Capital Corporation* (“GACC”)
|
Weighted Avg Mortgage Loan U/W NCF DSCR:
|
1.48x
|
|||
|
(54.5%), UBS Real Estate Securities Inc.
|
Range of Mortgage Loan U/W NCF DSCR:
|
1.21x – 2.33x
|
||||
|
(“UBSRES”) (30.6%), KeyBank National Association
|
Weighted Avg Mortgage Loan Cut-off Date LTV(2):
|
66.5%
|
||||
|
(“KeyBank”) (8.0%), Cantor Commercial Real Estate
|
Range of Mortgage Loan Cut-off Date LTV(2):
|
43.1% – 75.0%
|
||||
|
Lending, L.P. (“CCRE”) (6.9%)
|
Weighted Avg Mortgage Loan Maturity Date or ARD LTV(2):
|
58.5%
|
||||
|
*An indirect wholly owned subsidiary of Deutsche Bank AG.
|
Range of Mortgage Loan Maturity Date or ARD LTV(2):
|
38.4% – 68.3%
|
||||
|
Master Servicer:
|
KeyBank National Association
|
Weighted Avg U/W NOI Debt Yield:
|
10.1%
|
|||
|
Operating Advisor:
|
Park Bridge Lender Services LLC
|
Range of U/W NOI Debt Yield:
|
7.8% – 18.0%
|
|||
|
Special Servicer:
|
LNR Partners, LLC
|
Weighted Avg Mortgage Loan
|
||||
|
Certificate Administrator:
|
Deutsche Bank Trust Company Americas
|
Original Term to Maturity (months)(3):
|
114
|
|||
|
Trustee:
|
U.S. Bank National Association
|
Weighted Avg Mortgage Loan
|
||||
|
Rating Agencies:
|
Moody’s Investors Service, Inc., DBRS, Inc. and Kroll Bond Rating Agency, Inc.
|
Remaining Term to Maturity (months)(3):
Weighted Avg Mortgage Loan Seasoning (months):
|
112
1
|
|||
|
Determination Date:
|
The 6th day of each month, or if such 6th day is not a business day, the following business day, commencing in April 2014.
|
% Mortgage Loans with Amortization for Full Term:
% Mortgage Loans with Partial Interest Only:
|
36.4%
56.0%
|
|||
|
Distribution Date:
|
4th business day following the Determination Date in each month, commencing in April 2014.
|
% of Mortgage Loans with Full Interest Only(4):
% Mortgage Loans with Upfront or Ongoing Tax Reserves:
|
7.6%
83.3%
|
|||
|
Cut-off Date:
|
Payment Date in March 2014 (or related origination date, if later). Unless otherwise noted, all Mortgage Loan statistics are based on balances as of the Cut-off Date.
|
% Mortgage Loans with Upfront or
Ongoing Replacement Reserves(5): % Mortgage Loans with Upfront or Ongoing Insurance Reserves:
|
91.4%
38.7%
|
|||
|
Settlement Date:
|
On or about March 18, 2014
|
% Mortgage Loans with Upfront or Ongoing TI/LC Reserves(6):
|
80.6%
|
|||
|
Settlement Terms:
|
DTC, Euroclear and Clearstream, same day funds, with accrued interest.
|
% Mortgage Loans with Upfront Engineering Reserves:
% Mortgage Loans with Upfront or Ongoing Other Reserves:
|
38.7%
44.8%
|
|||
|
ERISA Eligible:
|
All of the Offered Certificates are expected to be ERISA eligible.
|
(1) | With respect to the Google and Amazon Office Portfolio Loan and the One Kendall Square Loan, LTV, DSCR and Debt Yield calculations include the related pari passu companion loans. | |||
|
SMMEA Eligible:
|
None of the Offered Certificates will be SMMEA eligible.
|
|||||
|
Day Count:
|
30/360
|
|||||
|
Tax Treatment:
|
REMIC
|
(2) | With respect to the Creekside Mixed Use Development loan and the Hampton Inn Rehoboth Beach loan, the Cut-off Date LTV and Maturity Date or ARD LTV have been calculated based on “As Stabilized” appraised values of $33.8 million and $14.6 million, respectively. The “As-is” Cut-off Date LTV and “As-is” Maturity Date or ARD LTV are 75.9% and 63.5%, respectively, for the Creekside Mixed Use Development loan and 77.5% and 58.6%, respectively, for the Hampton Inn Rehoboth Beach loan. With respect to the Arlington Farms Apartments loan, the Cut-off Date LTV and Maturity Date or ARD LTV have been calculated based on an “As Complete” appraised value of $6.76 million. The “As-is” Cut-off Date LTV and “As-is” Maturity Date or ARD LTV are 77.9% and 64.9%, respectively. | |||
|
Rated Final Distribution Date:
|
March 2047
|
|||||
|
Minimum Denominations:
|
$10,000 (or $100,000 with respect to Class X-A) and in each case in multiples of $1 thereafter.
|
|||||
|
Clean-up Call:
|
1%
|
|||||
| (3) | For the ARD loan, the original term to maturity and remaining term to maturity are through the anticipated repayment date. | |||||
| (4) | Interest only through the maturity or anticipated repayment date. | |||||
| (5) | Includes FF&E Reserves. | |||||
| (6) | Represents the percent of the allocated Initial Outstanding Pool Balance of retail, office, industrial and mixed use properties only. | |||||
| Distribution of Collateral by Property Type |
The depositor has filed a registration statement (including the prospectus) with the SEC (SEC File No. 333-193376) for the offering to which this communication relates. Before you invest, you should read the prospectus in the registration statement and other documents the depositor has filed with the SEC for more complete information about the depositor, the issuing trust and this offering. You may get these documents for free by visiting EDGAR on the SEC website at www.sec.gov. Alternatively, the depositor or Deutsche Bank Securities Inc., any other underwriter, or any dealer participating in this offering will arrange to send you the prospectus if you request it by calling toll-free 1-800-503-4611 or by email to the following address: prospectus.cpdg@db.com. The offered certificates referred to in these materials, and the asset pool backing them, are subject to modification or revision (including the possibility that one or more classes of certificates may be split, combined or eliminated at any time prior to issuance or availability of a final prospectus) and are offered on a “when, as and if issued” basis. You understand that, when you are considering the purchase of these certificates, a contract of sale will come into being no sooner than the date on which the relevant class has been priced and we have verified the allocation of certificates to be made to you; any “indications of interest” expressed by you, and any “soft circles” generated by us, will not create binding contractual obligations for you or us.
3
COMM 2014-UBS2 Mortgage Trust
|
SUMMARY OF THE CERTIFICATES
|
OFFERED CERTIFICATES
|
Class(1)
|
Ratings
(Moody’s/DBRS/KBRA)
|
Initial Certificate
Balance or Notional Amount(2) |
Initial
Subordination
Levels
|
Weighted
Average Life
(years)(3) |
Principal
Window (months)(3) |
Certificate
Principal to Value Ratio(4) |
Underwritten
NOI Debt Yield(5)
|
|
Class A-1
|
Aaa(sf) / AAA(sf) / AAA(sf)
|
$50,034,000
|
30.000%(6)
|
2.86
|
1 - 57
|
46.5%
|
14.4%
|
|
Class A-2
|
Aaa(sf) / AAA(sf) / AAA(sf)
|
$110,593,000
|
30.000%(6)
|
4.87
|
57 - 59
|
46.5%
|
14.4%
|
|
Class A-3
|
Aaa(sf) / AAA(sf) / AAA(sf)
|
$18,667,000
|
30.000%(6)
|
6.93
|
82 - 84
|
46.5%
|
14.4%
|
|
Class A-SB
|
Aaa(sf) / AAA(sf) / AAA(sf)
|
$93,739,000
|
30.000%(6)
|
7.43
|
59 - 117
|
46.5%
|
14.4%
|
|
Class A-4
|
Aaa(sf) / AAA(sf) / AAA(sf)
|
$237,000,000
|
30.000%(6)
|
9.78
|
117 - 118
|
46.5%
|
14.4%
|
|
Class A-5
|
Aaa(sf) / AAA(sf) / AAA(sf)
|
$354,988,000
|
30.000%(6)
|
9.84
|
118 - 119
|
46.5%
|
14.4%
|
|
Class X-A(7)
|
Aaa(sf) / AAA(sf) / AAA(sf)
|
$934,532,000(8)
|
N/A
|
N/A
|
N/A
|
N/A
|
N/A
|
|
Class A-M(9)(10)
|
Aaa(sf) / AAA(sf) / AAA(sf)
|
$69,511,000
|
24.375%
|
9.89
|
119 - 119
|
50.3%
|
13.4%
|
|
Class B(9)(10)
|
Aa3(sf) / AA(sf) / AA-(sf)
|
$89,592,000
|
17.125%
|
9.89
|
119 - 119
|
55.1%
|
12.2%
|
|
Class PEZ(9)(10)
|
A1(sf) / A(low)(sf) / A-(sf)
|
$208,532,000
|
13.125%(6)
|
9.89
|
119 - 119
|
57.8%
|
11.6%
|
|
Class C(9)(10)
|
A3(sf) / A(low)(sf) / A-(sf)
|
$49,429,000
|
13.125%(6)
|
9.89
|
119 - 119
|
57.8%
|
11.6%
|
NON-OFFERED CERTIFICATES
|
Class(1)
|
Ratings
(Moody’s/DBRS/KBRA)
|
Initial Certificate
Balance or Notional Amount(2)
|
Initial
Subordination
Levels
|
Weighted
Average
Life (years)(3) |
Principal
Window
(months)(3)
|
Certificate
Principal to Value Ratio(4) |
Underwritten
NOI Debt Yield(5)
|
|
Class X-B(7)
|
NR / AAA(sf) / AAA(sf)
|
$214,711,000(8)
|
N/A
|
N/A
|
N/A
|
N/A
|
N/A
|
|
Class D
|
NR / BBB(low)(sf) / BBB-(sf)
|
$75,690,000
|
7.000%
|
9.89
|
119 - 119
|
61.8%
|
10.9%
|
|
Class E
|
NR / BB(low)(sf) / BB-(sf)
|
$27,804,000
|
4.750%
|
9.95
|
119 - 120
|
63.3%
|
10.6%
|
|
Class F
|
NR / B(low)(sf) / B(sf)
|
$20,081,000
|
3.125%
|
9.98
|
120 - 120
|
64.4%
|
10.4%
|
|
Class G
|
NR / NR / NR
|
$38,617,401
|
0.000%
|
9.98
|
120 - 120
|
66.5%
|
10.1%
|
|
(1)
|
The pass–through rates applicable to the Class A–1, Class A–2, Class A–3, Class A–SB, Class A–4, Class A–5, Class A–M, Class B, Class C, Class D, Class E, Class F and Class G Certificates will equal one of: (i) a fixed per annum rate, (ii) the weighted average of the net mortgage rates on the mortgage loans (in each case, adjusted, if necessary, to accrue on the basis of a 360–day year consisting of twelve 30–day months) as of their respective due dates in the month preceding the month in which such distribution date occurs, (iii) a rate equal to the lesser of a specified pass–through rate and the weighted average of the net mortgage rates on the mortgage loans (in each case, adjusted, if necessary, to accrue on the basis of a 360–day year consisting of twelve 30–day months) as of their respective due dates in the month preceding the month in which such distribution date occurs, or (iv) the weighted average of the net mortgage rates on the mortgage loans (in each case, adjusted, if necessary, to accrue on the basis of a 360–day year consisting of twelve 30–day months) as of their respective due dates in the month preceding the month in which such distribution date occurs, less a specified rate. The Class PEZ Certificates will not have a pass-through rate, but will be entitled to receive the sum of the interest distributable on the percentage interest of the Class A–M, Class B and Class C trust components represented by the Class PEZ Certificates. The pass-through rate on the Class A–M, Class B and Class C trust components will at all times be the same as the pass-through rate of the Class A–M, Class B and Class C Certificates.
|
|
(2)
|
Approximate; subject to a permitted variance of plus or minus 5%.
|
|
(3)
|
The weighted average life and principal window during which distributions of principal would be received as set forth in the table with respect to each class of certificates with a certificate balance is based on (i) modeling assumptions and prepayment assumptions described in the Free Writing Prospectus, (ii) assumptions that there are no prepayments or losses on the mortgage loans and (iii) assumptions that there are no extensions of maturity dates and that mortgage loans with anticipated repayment dates are repaid on their respective anticipated repayment dates.
|
|
(4)
|
“Certificate Principal to Value Ratio” for any class with a Certificate Balance is calculated as the product of (a) the weighted average mortgage loan Cut–off Date LTV of the mortgage pool, multiplied by (b) a fraction, the numerator of which is the total initial Certificate Balance of the related class of Certificates and all other classes, if any, that are senior to such class, and the denominator of which is the total initial Certificate Balance of all Certificates. The Certificate Principal to Value Ratios of the Class A–1, Class A–2, Class A–3, Class A–SB, Class A–4 and Class A–5 Certificates are calculated in the aggregate for those classes as if they were a single class.
|
|
(5)
|
“Underwritten NOI Debt Yield” for any class with a Certificate Balance is calculated as the product of (a) the weighted average U/W NOI Debt Yield for the mortgage pool, multiplied by (b) a fraction, the numerator of which is the total initial Certificate Balance and the denominator of which is the total initial Certificate Balance of the related class of Certificates and all other classes, if any, that are senior to such class. The Underwritten NOI Debt Yields of the Class A–1, Class A–2, Class A–3, Class A–SB, Class A–4 and Class A–5 Certificates are calculated in the aggregate for those classes as if they were a single class.
|
|
(6)
|
The initial subordination levels for the Class A–1, Class A–2, Class A–3, Class A–SB, Class A–4 and Class A–5 are represented in the aggregate. The initial subordination levels for the Class PEZ and Class C Certificates are equal to the initial subordination level of the underlying Class C trust component which will have an initial outstanding balance on the closing date of $49,429,000.
|
|
(7)
|
The pass–through rate applicable to the Class X–A and Class X–B Certificates for each Distribution Date will generally be equal to the excess of (i) the weighted average of the net mortgage rates on the mortgage loans (in each case, adjusted, if necessary to accrue on the basis of a 360 day year consisting of twelve 30–day months), over (ii)(A) with respect to the Class X–A Certificates, the weighted average of the pass–through rates of the Class A–1, Class A–2, Class A–3, Class A–SB, Class A–4, Class A–5 and Class A–M Certificates (based on their Certificate Balances and without regard to any exchange of Class A–M, Class B and Class C Certificates for Class PEZ Certificates), as further described in the Free Writing Prospectus and (B) with respect to the Class X–B Certificates, the weighted average of the pass–through rates of the Class B, Class C and Class D Certificates (based on their Certificate Balances and without regard to any exchange of Class A–M, Class B and Class C Certificates for Class PEZ Certificates), as further described in the Free Writing Prospectus.
|
|
(8)
|
The Class X–A and Class X–B Certificates (the “Class X Certificates”) will not have Certificate Balances. None of the Class X–A and Class X–B Certificates are entitled to distributions of principal. The interest accrual amounts on the Class X–A Certificates will be calculated by reference to a notional amount equal to the sum of the total Certificate Balances of each of the Class A–1, Class A–2, Class A–3, Class A–SB, Class A–4, Class A–5 and Class A–M Certificates (without regard to any exchange of Class A–M, Class B, and Class C Certificates for Class PEZ Certificates). The interest accrual amounts on the Class X–B Certificates will be calculated by reference to a notional amount equal to the Certificate Balances of each the Class B, Class C and Class D Certificates (without regard to any exchange of Class A–M, Class B, and Class C Certificates for Class PEZ Certificates).
|
|
(9)
|
Up to the full Certificate Balance of the Class A–M, Class B and Class C Certificates may be exchanged for Class PEZ Certificates, and Class PEZ Certificates may be exchanged for up to the full Certificate Balance of the Class A–M, Class B and Class C Certificates.
|
The depositor has filed a registration statement (including the prospectus) with the SEC (SEC File No. 333-193376) for the offering to which this communication relates. Before you invest, you should read the prospectus in the registration statement and other documents the depositor has filed with the SEC for more complete information about the depositor, the issuing trust and this offering. You may get these documents for free by visiting EDGAR on the SEC website at www.sec.gov. Alternatively, the depositor or Deutsche Bank Securities Inc., any other underwriter, or any dealer participating in this offering will arrange to send you the prospectus if you request it by calling toll-free 1-800-503-4611 or by email to the following address: prospectus.cpdg@db.com. The offered certificates referred to in these materials, and the asset pool backing them, are subject to modification or revision (including the possibility that one or more classes of certificates may be split, combined or eliminated at any time prior to issuance or availability of a final prospectus) and are offered on a “when, as and if issued” basis. You understand that, when you are considering the purchase of these certificates, a contract of sale will come into being no sooner than the date on which the relevant class has been priced and we have verified the allocation of certificates to be made to you; any “indications of interest” expressed by you, and any “soft circles” generated by us, will not create binding contractual obligations for you or us.
4
COMM 2014-UBS2 Mortgage Trust
|
SUMMARY OF THE CERTIFICATES
|
|
(10)
|
On the closing date, the issuing entity will issue the Class A–M, Class B and Class C trust components, which will have outstanding principal balances on the closing date of $69,511,000, $89,592,000 and $49,429,000, respectively. The Class A–M, Class B, Class PEZ and Class C Certificates will, at all times, represent undivided beneficial ownership interests in a grantor trust that will hold such trust components. Each class of the Class A–M, Class B and Class C Certificates will, at all times, represent a beneficial interest in a percentage of the outstanding principal balance of the Class A–M, Class B and Class C trust components, respectively. The Class PEZ Certificates will, at all times, represent a beneficial interest in the remaining percentages of the outstanding principal balances of the Class A–M, Class B and Class C trust components. Following any exchange of Class A–M, Class B and Class C Certificates for Class PEZ Certificates or any exchange of Class PEZ Certificates for Class A–M, Class B and Class C Certificates as described in the Free Writing Prospectus, the percentage interest of the outstanding principal balances of the Class A–M, Class B and Class C trust component that is represented by the Class A–M, Class B, Class PEZ and Class C Certificates will be increased or decreased accordingly. The initial Certificate Balance of each of the Class A–M, Class B and Class C Certificates represents the Certificate Balance of such class without giving effect to any exchange. The initial Certificate Balance of the Class PEZ Certificates is equal to the aggregate of the initial Certificate Balance of the Class A–M, Class B and Class C Certificates and represents the maximum Certificate Balance of the Class PEZ Certificates that could be issued in an exchange. The Certificate Balances of the Class A–M, Class B and Class C Certificates to be issued on the closing date will be reduced, in required proportions, by an amount equal to the Certificate Balance of the Class PEZ Certificates issued on the closing date.
|
|
Short–Term Certificate Principal Paydown Summary(1)
|
|
Class
|
Mortgage Loan
Seller
|
Mortgage Loan
|
Property Type
|
Cut–off Date
Balance
|
Remaining Term to Maturity (Mos.)
|
Cut-off Date LTV Ratio
|
U/W
NCF DSCR
|
U/W NOI
Debt Yield
|
|
|
A-1/A-2
|
UBSRES
|
Hood Commons
|
Retail
|
$11,203,565
|
57
|
67.9%
|
1.93x
|
13.6%
|
|
|
A-2
|
UBSRES
|
Summer Lake Estates
|
Multifamily
|
$6,283,440
|
58
|
64.1%
|
1.34x
|
8.8%
|
|
|
A-2/A-SB
|
UBSRES
|
Embassy Suites - Anaheim
|
Hospitality
|
$50,000,000
|
59
|
66.1%
|
1.85x
|
12.0%
|
|
|
A-2/A-SB
|
GACC
|
Tops Markets Grocery Anchored Portfolio
|
Retail
|
$34,948,224
|
59
|
63.4%
|
1.72x
|
12.1%
|
|
|
A-2/A-SB
|
GACC
|
GRM Arlington
|
Industrial
|
$6,288,420
|
59
|
71.5%
|
1.73x
|
13.9%
|
|
|
A-2/A-SB
|
KeyBank
|
MVP Parking Portfolio
|
Other
|
$4,291,534
|
59
|
43.1%
|
2.03x
|
15.1%
|
|
|
A-3/A-SB
|
KeyBank
|
Forest Hills Apartments
|
Multifamily
|
$5,800,000
|
82
|
67.1%
|
1.33x
|
9.5%
|
|
|
A-3/A-SB
|
KeyBank
|
LA Fitness Portfolio
|
Retail
|
$16,100,000
|
84
|
60.2%
|
1.59x
|
12.3%
|
|
|
(1)
|
This table identifies loans with balloon payments due during the principal paydown window assuming 0% CPR and no losses for the indicated Certificates. See “Yield and Maturity Considerations – Yield Considerations” in the Free Writing Prospectus.
|
The depositor has filed a registration statement (including the prospectus) with the SEC (SEC File No. 333-193376) for the offering to which this communication relates. Before you invest, you should read the prospectus in the registration statement and other documents the depositor has filed with the SEC for more complete information about the depositor, the issuing trust and this offering. You may get these documents for free by visiting EDGAR on the SEC website at www.sec.gov. Alternatively, the depositor or Deutsche Bank Securities Inc., any other underwriter, or any dealer participating in this offering will arrange to send you the prospectus if you request it by calling toll-free 1-800-503-4611 or by email to the following address: prospectus.cpdg@db.com. The offered certificates referred to in these materials, and the asset pool backing them, are subject to modification or revision (including the possibility that one or more classes of certificates may be split, combined or eliminated at any time prior to issuance or availability of a final prospectus) and are offered on a “when, as and if issued” basis. You understand that, when you are considering the purchase of these certificates, a contract of sale will come into being no sooner than the date on which the relevant class has been priced and we have verified the allocation of certificates to be made to you; any “indications of interest” expressed by you, and any “soft circles” generated by us, will not create binding contractual obligations for you or us.
5
COMM 2014-UBS2 Mortgage Trust
|
TRANSACTION HIGHLIGHTS
|
|
■
|
$1,235,745,402 (Approximate) New–Issue Multi–Borrower CMBS:
|
|
|
–
|
Overview: The mortgage pool consists of 59 fixed–rate commercial, multifamily and manufactured housing community loans that have an aggregate Cut–off Date Balance of $1,235,745,402 (the “Initial Outstanding Pool Balance”), have an average Cut–off Date Balance of $20,944,837 per Mortgage Loan and are secured by 95 Mortgaged Properties located throughout 24 states.
|
|
|
–
|
LTV: 66.5% weighted average Cut–off Date LTV and 58.5% weighted average Maturity Date or ARD LTV.
|
|
|
–
|
DSCR: 1.58x weighted average Debt Service Coverage Ratio, based on Underwritten NOI. 1.48x weighted average Debt Service Coverage Ratio, based on Underwritten NCF.
|
|
|
–
|
Debt Yield: 10.1% weighted average debt yield, based on Underwritten NOI. 9.4% weighted average debt yield, based on Underwritten NCF.
|
|
|
–
|
Credit Support: 30.000% credit support for the Class A–1, Class A–2, Class A–3, Class A–SB, Class A–4 and Class A–5 Certificates in the aggregate, which are each rated Aaa(sf) / AAA(sf) / AAA(sf) by Moody’s/DBRS/KBRA.
|
|
■
|
Loan Structural Features:
|
|
|
–
|
Amortization: 92.4% of the Mortgage Loans by Cut–off Date Balance have scheduled amortization:
|
|
|
■
|
36.4% of the Mortgage Loans by Cut–off Date Balance have amortization for the entire term with a balloon payment due at Maturity or ARD.
|
|
|
■
|
56.0% of the Mortgage Loans by Cut–off Date Balance have scheduled amortization following a partial interest–only period with a balloon payment due at Maturity or ARD.
|
|
|
■
|
7.6% of the Mortgage Loans by Cut-off Date Balance are interest-only for the entire term or through the ARD.
|
|
|
–
|
Hard Lockboxes: 65.8% of the Mortgage Loans by Cut–off Date Balance have Hard Lockboxes in place.
|
|
|
■
|
Cash Traps: 91.9% of the Mortgage Loans by Cut–off Date Balance have cash traps triggered by certain declines in net cash flow, all at levels greater than or equal to 1.05x, that fund an excess cash flow reserve.
|
|
|
–
|
Reserves: The Mortgage Loans require amounts to be escrowed for reserves upfront or on an ongoing basis as follows:
|
|
|
■
|
Real Estate Taxes: 51 Mortgage Loans representing 83.3% of the total Cut–off Date Balance.
|
|
|
■
|
Insurance Reserves: 35 Mortgage Loans representing 38.7% of the total Cut–off Date Balance.
|
|
|
■
|
Replacement Reserves (Including FF&E Reserves): 53 Mortgage Loans representing 91.4% of the total Cut–off Date Balance.
|
|
|
■
|
Tenant Improvement / Leasing Commissions: 25 Mortgage Loans representing 80.6% of the total allocated Cut–off Date Balance of office, retail, industrial and mixed use properties only.
|
|
|
–
|
Defeasance: 66.4% of the Mortgage Loans by Cut–off Date Balance permit defeasance only after a lockout period and prior to an open period.
|
|
|
–
|
Yield Maintenance: 24.5% of the Mortgage Loans by Cut–off Date Balance permit prepayment only after a lockout period and prior to an open period with a Yield Maintenance Charge.
|
|
|
–
|
Defeasance or Yield Maintenance: 9.2% of the Mortgage Loans by Cut–off Date Balance permit yield maintenance, then either defeasance or prepayment with a Yield Maintenance Charge, in either case only after a lockout period and prior to an open period.
|
|
■
|
Multiple–Asset Types > 5.0% of the Total Pool:
|
|
|
–
|
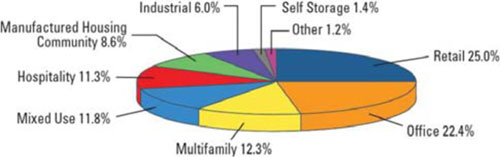
Retail: 25.0% of the Mortgaged Properties by allocated Cut–off Date Balance are retail properties.
|
|
|
–
|
Office: 22.4% of the Mortgaged Properties by allocated Cut–off Date Balance are office properties.
|
|
|
–
|
Multifamily: 12.3% of the Mortgaged Properties by allocated Cut–off Date Balance are multifamily properties.
|
|
|
–
|
Mixed Use: 11.8% of the Mortgaged Properties by allocated Cut–off Date Balance are mixed use properties.
|
|
|
–
|
Hospitality: 11.3% of the Mortgaged Properties by allocated Cut–off Date Balance are hospitality properties.
|
|
|
–
|
Manufactured Housing Community: 8.6% of the Mortgaged Properties by allocated Cut–off Date Balance are manufactured housing community properties.
|
|
|
–
|
Industrial: 6.0% of the Mortgaged Properties by allocated Cut–off Date Balance are industrial properties.
|
|
■
|
Geographic Diversity: The 95 Mortgaged Properties are located throughout 24 states with only two states having at least 10.0% by allocated Cut–off Date Balance: California (18.9%) and Massachusetts (12.3%).
|
The depositor has filed a registration statement (including the prospectus) with the SEC (SEC File No. 333-193376) for the offering to which this communication relates. Before you invest, you should read the prospectus in the registration statement and other documents the depositor has filed with the SEC for more complete information about the depositor, the issuing trust and this offering. You may get these documents for free by visiting EDGAR on the SEC website at www.sec.gov. Alternatively, the depositor or Deutsche Bank Securities Inc., any other underwriter, or any dealer participating in this offering will arrange to send you the prospectus if you request it by calling toll-free 1-800-503-4611 or by email to the following address: prospectus.cpdg@db.com. The offered certificates referred to in these materials, and the asset pool backing them, are subject to modification or revision (including the possibility that one or more classes of certificates may be split, combined or eliminated at any time prior to issuance or availability of a final prospectus) and are offered on a “when, as and if issued” basis. You understand that, when you are considering the purchase of these certificates, a contract of sale will come into being no sooner than the date on which the relevant class has been priced and we have verified the allocation of certificates to be made to you; any “indications of interest” expressed by you, and any “soft circles” generated by us, will not create binding contractual obligations for you or us.
6
| COMM 2014-UBS2 Mortgage Trust | |||||
| STRUCTURE OVERVIEW | |||||
|
Principal Payments:
|
Payments in respect of principal of the Certificates will be distributed, first, to the Class A–SB Certificates, until the Certificate Balance of such Class is reduced to the planned principal balance for the related Distribution Date set forth on Annex A–3 to the Free Writing Prospectus, then, to the Class A–1, Class A–2, Class A–3, Class A–4, Class A–5 and Class A–SB Certificates, in that order, until the Certificate Balance of each such Class is reduced to zero, then, to the Class A–M trust component (and correspondingly to the Class A–M Certificates and the Class PEZ Certificates, pro rata, based on their respective percentage interests in the Class A–M trust component) until the principal balance of the Class A–M trust component has been reduced to zero, then, to the Class B trust component (and correspondingly to the Class B Certificates and the Class PEZ Certificates, pro rata, based on their respective percentage interests in the Class B trust component) until the principal balance of the Class B trust component has been reduced to zero, then, to the Class C trust component (and correspondingly to the Class C Certificates and the Class PEZ Certificates, pro rata, based on their respective percentage interests in the Class C trust component), until the principal balance of the Class C trust component has been reduced to zero, and then, to the Class D, Class E, Class F and Class G Certificates, in that order, until the Certificate Balance of each such Class is reduced to zero. Notwithstanding the foregoing, if the total principal balance of the Class A–M trust component, Class B trust component and Class C trust component and the Certificate Balances of the Class D through Class G Certificates have been reduced to zero as a result of loss allocation, payments in respect of principal of the Certificates will be distributed, first, to the Class A–1, Class A–2, Class A–3, Class A–SB, Class A–4 and Class A–5 Certificates, on a pro rata basis, based on the Certificate Balance of each such Class, then, to the extent of any recoveries on realized losses, to the Class A-M trust component (and correspondingly to the Class A–M Certificates and the Class PEZ Certificates, pro rata, based on their respective percentage interests in the Class A–M trust component), then, to the extent of any recoveries on realized losses, to the Class B trust component (and correspondingly to the Class B Certificates and the Class PEZ Certificates, pro rata, based on their respective percentage interests in the Class B trust component), then, to the extent of any recoveries on realized losses, to the Class C trust component (and correspondingly to the Class C Certificates and the Class PEZ Certificates, pro rata, based on their respective percentage interests in the Class C trust component), then, to the extent of any recoveries on realized losses, to the Class D, Class E, Class F and Class G Certificates, in that order, in each case until the Certificate Balance of each such Class or trust component is reduced to zero (or previously allocated realized losses have been fully reimbursed).
The Class X–A and Class X–B Certificates will not be entitled to receive distributions of principal; however, (i) the notional amount of the Class X–A Certificates will be reduced by the aggregate amount of principal distributions and realized losses allocated to the Class A–1, Class A–2, Class A–3, Class A–SB, Class A–4, Class A–5 and the Class A–M Certificates (without regard to any exchange of Class A-M, Class B and Class C Certificates for Class PEZ Certificates); and (ii) the notional amount of the Class X–B Certificates will be reduced by the principal distributions and realized losses allocated to the Class B, Class C and Class D Certificates (without regard to any exchange of Class A–M, Class B and Class C Certificates for Class PEZ Certificates.
|
||||
|
Interest Payments:
|
On each Distribution Date, interest accrued for each Class of the Certificates or trust component at the applicable pass–through rate will be distributed in the following order of priority, to the extent of available funds: first, to the Class A–1, Class A–2, Class A–3, Class A–SB, Class A–4, Class A–5, Class X–A and Class X–B Certificates, on a pro rata basis, based on the accrued and unpaid interest on each such Class, then, to the Class A–M trust component (and correspondingly to the Class A–M Certificates and the Class PEZ Certificates, pro rata, based on their respective percentage interests of the accrued and unpaid interest on the Class A–M trust component), then, to the Class B trust component (and correspondingly to the Class B Certificates and the Class PEZ Certificates, pro rata, based on their respective percentage interests of the accrued and
|
||||
The depositor has filed a registration statement (including the prospectus) with the SEC (SEC File No. 333-193376) for the offering to which this communication relates. Before you invest, you should read the prospectus in the registration statement and other documents the depositor has filed with the SEC for more complete information about the depositor, the issuing trust and this offering. You may get these documents for free by visiting EDGAR on the SEC website at www.sec.gov. Alternatively, the depositor or Deutsche Bank Securities Inc., any other underwriter, or any dealer participating in this offering will arrange to send you the prospectus if you request it by calling toll-free 1-800-503-4611 or by email to the following address: prospectus.cpdg@db.com. The offered certificates referred to in these materials, and the asset pool backing them, are subject to modification or revision (including the possibility that one or more classes of certificates may be split, combined or eliminated at any time prior to issuance or availability of a final prospectus) and are offered on a “when, as and if issued” basis. You understand that, when you are considering the purchase of these certificates, a contract of sale will come into being no sooner than the date on which the relevant class has been priced and we have verified the allocation of certificates to be made to you; any “indications of interest” expressed by you, and any “soft circles” generated by us, will not create binding contractual obligations for you or us.
7
| COMM 2014-UBS2 Mortgage Trust | ||
| STRUCTURE OVERVIEW | ||
|
|
unpaid interest on the Class B trust component), then, to the Class C trust component (and correspondingly to the Class C Certificates and the Class PEZ Certificates, pro rata, based on their respective percentage interests of the accrued and unpaid interest on the Class C trust component), and then, to the Class D, Class E, Class F and Class G Certificates, in that order, in each case until the interest payable to each such Class is paid in full.
The pass–through rates applicable to the Class A–1, Class A–2, Class A–3, Class A–SB, Class A–4, Class A–5, Class A–M, Class B, Class C, Class D, Class E, Class F and Class G Certificates for each Distribution Date will equal one of: (i) a fixed per annum rate, (ii) the weighted average of the net mortgage rates on the mortgage loans (in each case, adjusted, if necessary, to accrue on the basis of a 360–day year consisting of twelve 30–day months) as of their respective due dates in the month preceding the month in which such distribution date occurs, (iii) a rate equal to the lesser of a specified pass–through rate and the weighted average of the net mortgage rates on the mortgage loans (in each case, adjusted, if necessary, to accrue on the basis of a 360–day year consisting of twelve 30–day months) as of their respective due dates in the month preceding the month in which such distribution date occurs, or (iv) the weighted average of the net mortgage rates on the mortgage loans (in each case, adjusted, if necessary, to accrue on the basis of a 360–day year consisting of twelve 30–day months) as of their respective due dates in the month preceding the month in which such distribution date occurs, less a specified rate. The pass-through rate on the Class A–M, Class B and Class C trust components will at all times be the same as the pass-through rate of the Class A–M, Class B and Class C Certificates. The Class PEZ Certificates will not have a pass-through rate, but will be entitled to receive the sum of interest distributable on the percentage interest of the Class A–M, Class B and Class C trust components represented by the PEZ Certificates.
The pass–through rate applicable to the Class X–A and Class X–B Certificates for each Distribution Date will generally be equal to the excess of (i) the weighted average of the net mortgage rates on the mortgage loans (in each case, adjusted, if necessary, to accrue on the basis of a 360–day year consisting of twelve 30–day months), over (ii)(A) with respect to the Class X–A Certificates, the weighted average of the pass–through rates of the Class A–1, Class A–2, Class A–3, Class A–SB, Class A–4, Class A–5 and Class A–M Certificates (based on their Certificate Balances and without regard to any exchange of Class A–M, Class B and Class C Certificates for Class PEZ Certificates), as further described in the Free Writing Prospectus and (B) with respect to the Class X–B Certificates, the weighted average of the pass–through rates of the Class B, Class C and Class D Certificates (based on their Certificate Balances and without regard to any exchange of Class A–M, Class B and Class C Certificates for Class PEZ Certificates), as further described in the Free Writing Prospectus.
|
|
|
Prepayment Interest Shortfalls:
|
Net prepayment interest shortfalls will be allocated pro rata based on interest entitlements, in reduction of the interest otherwise payable with respect to each of the interest–bearing certificate classes.
|
|
|
Loss Allocation:
|
Losses will be allocated to each Class of Certificates in reverse alphabetical order starting with Class G through and including Class D, then, to the Class C trust component (and correspondingly to the Class C Certificates and the Class PEZ Certificates, pro rata, based on their respective percentage interests in the Class C trust component), then, to the Class B trust component (and correspondingly to the Class B Certificates and the Class PEZ Certificates, pro rata, based on their respective percentage interests in the Class B trust component), then, to the Class A–M trust component (and correspondingly to the Class A–M Certificates and the Class PEZ Certificates, pro rata, based on their respective percentage interests in the Class A–M trust component), and then to Class A–1, Class A–2, Class A–3, Class A–SB, Class A–4 and Class A–5 Certificates on a pro rata basis based on the Certificate Balance of each such class. The notional amount of
|
|
The depositor has filed a registration statement (including the prospectus) with the SEC (SEC File No. 333-193376) for the offering to which this communication relates. Before you invest, you should read the prospectus in the registration statement and other documents the depositor has filed with the SEC for more complete information about the depositor, the issuing trust and this offering. You may get these documents for free by visiting EDGAR on the SEC website at www.sec.gov. Alternatively, the depositor or Deutsche Bank Securities Inc., any other underwriter, or any dealer participating in this offering will arrange to send you the prospectus if you request it by calling toll-free 1-800-503-4611 or by email to the following address: prospectus.cpdg@db.com. The offered certificates referred to in these materials, and the asset pool backing them, are subject to modification or revision (including the possibility that one or more classes of certificates may be split, combined or eliminated at any time prior to issuance or availability of a final prospectus) and are offered on a “when, as and if issued” basis. You understand that, when you are considering the purchase of these certificates, a contract of sale will come into being no sooner than the date on which the relevant class has been priced and we have verified the allocation of certificates to be made to you; any “indications of interest” expressed by you, and any “soft circles” generated by us, will not create binding contractual obligations for you or us.
8
| COMM 2014-UBS2 Mortgage Trust | |||||
| STRUCTURE OVERVIEW | |||||
|
|
either Class of Class X Certificates will be reduced by the aggregate amount of realized losses allocated to Certificates and trust components that are components of the notional amount of such Class of Class X Certificates.
|
||||
|
Prepayment Premiums:
|
A percentage of all prepayment premiums (either fixed prepayment premiums or yield maintenance amounts) collected will be allocated to each of the Class A–1, Class A–2, Class A–3, Class A–SB, Class A–4, Class A–5 and Class D Certificates and the Class A–M, Class B and Class C trust components (the “YM P&I Certificates”) then entitled to principal distributions, which percentage will be equal to the product of (a) a fraction, not greater than one, the numerator of which is the amount of principal distributed to such Class or trust component on such Distribution Date and the denominator of which is the total amount of principal distributed to the holders of the Class A–1, Class A–2, Class A–3, Class A–SB, Class A–4, Class A–5 and Class D Certificates and the Class A–M, Class B and Class C trust components on such Distribution Date, and (b) a fraction (expressed as a percentage which can be no greater than 100% nor less than 0%), the numerator of which is the excess of the pass–through rate of each such Class of Certificates or trust component currently receiving principal over the relevant Discount Rate, and the denominator of which is the excess of the Mortgage Rate of the related Mortgage Loan over the relevant Discount Rate.
|
||||
| Prepayment Premium Allocation Percentage for all YM P&I Certificates = | |||||
| (Pass–Through Rate – Discount Rate) | The percentage of the principal distribution amount to such Class or trust component as described in (a) above | ||||
|
(Mortgage Rate – Discount Rate)
|
X
|
||||
|
The remaining percentage of the prepayment premiums will be allocated to the Class X Certificates in the manner described in the Free Writing Prospectus. In general, this formula provides for an increase in the percentage of prepayment premiums allocated to the YM P&I Certificates then entitled to principal distributions relative to the Class X Certificates as Discount Rates decrease and a decrease in the percentage allocated to such Classes as Discount Rates rise.
All prepayment premiums (either fixed prepayment premiums or yield maintenance amounts) allocated in respect of (i) the Class A–M trust component as described above will be allocated between the Class A–M Certificates and the Class PEZ Certificates, pro rata, based on their respective percentage interests in the Class A–M trust component, (ii) the Class B trust component as described above will be allocated between the Class B Certificates and the Class PEZ Certificates, pro rata, based on their respective percentage interests in the Class B trust component, and (iii) the Class C trust component as described above will be allocated between the Class C Certificates and the Class PEZ Certificates, pro rata, based on their respective percentage interests in the Class C trust component.
|
|||||
The depositor has filed a registration statement (including the prospectus) with the SEC (SEC File No. 333-193376) for the offering to which this communication relates. Before you invest, you should read the prospectus in the registration statement and other documents the depositor has filed with the SEC for more complete information about the depositor, the issuing trust and this offering. You may get these documents for free by visiting EDGAR on the SEC website at www.sec.gov. Alternatively, the depositor or Deutsche Bank Securities Inc., any other underwriter, or any dealer participating in this offering will arrange to send you the prospectus if you request it by calling toll-free 1-800-503-4611 or by email to the following address: prospectus.cpdg@db.com. The offered certificates referred to in these materials, and the asset pool backing them, are subject to modification or revision (including the possibility that one or more classes of certificates may be split, combined or eliminated at any time prior to issuance or availability of a final prospectus) and are offered on a “when, as and if issued” basis. You understand that, when you are considering the purchase of these certificates, a contract of sale will come into being no sooner than the date on which the relevant class has been priced and we have verified the allocation of certificates to be made to you; any “indications of interest” expressed by you, and any “soft circles” generated by us, will not create binding contractual obligations for you or us.
9
| COMM 2014-UBS2 Mortgage Trust | ||
| STRUCTURE OVERVIEW | ||
|
Loan Combinations:
|
The portfolio of Mortgaged Properties identified on Annex A–1 to the Free Writing Prospectus as Google and Amazon Office Portfolio secures a Mortgage Loan with an outstanding principal balance as of the Cut–off Date of $120,000,000, evidenced by Note A-3 (the “Google and Amazon Office Portfolio Loan”), representing approximately 9.7% of the Initial Outstanding Pool Balance, and also secures on a pari passu basis three companion loans that have an aggregate outstanding principal balance as of the Cut-off Date of $332,200,000, evidenced by Note A-1, Note A-2 and Note A-4. Note A-1 has a principal balance as of the Cut-off Date of $155,000,000 and is currently included in the COMM 2014-CCRE14 Mortgage Trust securitization. Note A-2 has a principal balance as of the Cut-off Date of $110,000,000 and is currently included in the COMM 2014-CCRE15 Mortgage Trust securitization. Note A-4, which has a principal balance as of the Cut-off Date of $67,200,000, is currently held by GACC and may be sold or further divided at any time (subject to compliance with the terms of the related intercreditor agreement). The Google and Amazon Office Portfolio Loan and related companion loans are pari passu in right of payment and are collectively referred to herein as the “Google and Amazon Office Portfolio Loan Combination.”
The Google and Amazon Office Portfolio Loan Combination will be serviced pursuant to the COMM 2014-CCRE14 pooling and servicing agreement and the related intercreditor agreement. For additional information regarding the Google and Amazon Office Portfolio Loan Combination, see “Description of the Mortgage Pool—Loan Combinations—The Google and Amazon Office Portfolio Loan Combination” in the Free Writing Prospectus.
The Mortgaged Property identified on Annex A–1 to the Free Writing Prospectus as One Kendall Square secures a Mortgage Loan with an outstanding principal balance as of the Cut–off Date of $120,000,000, evidenced by Note A-1 (the “One Kendall Square Loan”), representing approximately 9.7% of the Initial Outstanding Pool Balance, and also secures on a pari passu basis a companion loan that has an outstanding principal balance as of the Cut-off Date of $83,000,000, evidenced by Note A-2, which is currently held by GACC and may be sold or further divided at any time (subject to compliance with the terms of the related intercreditor agreement). The One Kendall Square Loan and related companion loan are pari passu in right of payment and are collectively referred to herein as the “One Kendall Square Loan Combination.”
The One Kendall Square Loan Combination will be serviced pursuant to the pooling and servicing agreement related to this transaction (the “Pooling and Servicing Agreement”) and the related intercreditor agreement. For additional information regarding the One Kendall Square Loan Combination, see “Description of the Mortgage Pool—Loan Combinations—The One Kendall Square Loan Combination” in the Free Writing Prospectus.
|
|
|
Control Rights:
|
Certain Classes of Certificates (the “Control Eligible Certificates”) will have certain control rights over servicing matters with respect to each Mortgage Loan (other than with respect to the Google and Amazon Office Portfolio Loan Combination) and the One Kendall Square Loan Combination. The majority owner or appointed representative of the Class of Control Eligible Certificates that is the Controlling Class (such owner or representative, the “Directing Holder”), will be entitled to direct the Special Servicer to take, or refrain from taking certain actions with respect to a Mortgage Loan. Furthermore, the Directing Holder will also have the right to receive notice and consent to certain material actions that the Master Servicer and the Special Servicer proposes to take with respect to such Mortgage Loan.
For a description of the directing holder for the Google and Amazon Office Portfolio Loan Combination, which are each referred to herein as a “Loan Combination Directing Holder”, see “Description of the Mortgage Pool—Loan Combinations” and “Description of the Pooling and Servicing Agreement—The Directing Holder” in the Free Writing Prospectus.
|
|
The depositor has filed a registration statement (including the prospectus) with the SEC (SEC File No. 333-193376) for the offering to which this communication relates. Before you invest, you should read the prospectus in the registration statement and other documents the depositor has filed with the SEC for more complete information about the depositor, the issuing trust and this offering. You may get these documents for free by visiting EDGAR on the SEC website at www.sec.gov. Alternatively, the depositor or Deutsche Bank Securities Inc., any other underwriter, or any dealer participating in this offering will arrange to send you the prospectus if you request it by calling toll-free 1-800-503-4611 or by email to the following address: prospectus.cpdg@db.com. The offered certificates referred to in these materials, and the asset pool backing them, are subject to modification or revision (including the possibility that one or more classes of certificates may be split, combined or eliminated at any time prior to issuance or availability of a final prospectus) and are offered on a “when, as and if issued” basis. You understand that, when you are considering the purchase of these certificates, a contract of sale will come into being no sooner than the date on which the relevant class has been priced and we have verified the allocation of certificates to be made to you; any “indications of interest” expressed by you, and any “soft circles” generated by us, will not create binding contractual obligations for you or us.
10
| COMM 2014-UBS2 Mortgage Trust | ||
| STRUCTURE OVERVIEW | ||
|
Control Eligible Certificates:
|
Class E, Class F and Class G Certificates.
|
|
|
Controlling Class:
|
The Controlling Class will be the most subordinate Class of Control Eligible Certificates then outstanding that has an aggregate Certificate Balance, as notionally reduced by any Appraisal Reduction Amounts allocable to such Class, equal to no less than 25% of the initial Certificate Balance of such Class.
The Controlling Class as of the Settlement Date will be the Class G Certificates.
The holder of the control rights with respect to the Google and Amazon Office Portfolio Loan Combination will be the related Loan Combination Directing Holder.
|
|
|
Appraised–Out Class:
|
Any Class of Control Eligible Certificates that has been determined, as a result of Appraisal Reductions Amounts allocable to such Class, to no longer be the Controlling Class.
|
|
|
Remedies Available to Holders
of an Appraised–Out Class: |
Holders of the majority of any Class of Control Eligible Certificates that is determined at any time of determination to no longer be the Controlling Class as a result of an allocation of an Appraisal Reduction Amounts in respect of such Class will have the right, at their sole expense, to require the Special Servicer to order a second appraisal for any Mortgage Loan for which an Appraisal Reduction Event has occurred. Upon receipt of the second appraisal, the Special Servicer will be required to determine, in accordance with the Servicing Standard, whether, based on its assessment of the second appraisal, a recalculation of the Appraisal Reduction Amount is warranted. If warranted, the Special Servicer will direct the Master Servicer to recalculate the Appraisal Reduction Amount based on the second appraisal, and if required by such recalculation, the Special Servicer will reinstate the Appraised–Out Class as the Controlling Class. The Holders of an Appraised–Out Class requesting a second appraisal will not be entitled to exercise any rights of the Controlling Class until such time, if any, as the Class is reinstated as the Controlling Class.
|
|
|
Directing Holder:
|
It is anticipated that (i) affiliates of AllianceBernstein L.P. will purchase no less than the majority of Class E, Class F, Class G and Class V certificates, (ii) affiliates of Raith Capital Management, LLC will purchase the minority of Class E, Class F, Class G and Class V certificates and (iii) an affiliate of Raith Capital Management, LLC will be the initial Directing Holder with respect to each Mortgage Loan (other than the Google and Amazon Office Portfolio Loan Combination) and the One Kendall Square Loan Combination.
See “Description of the Mortgage Pool—Loan Combinations” and “Description of the Pooling and Servicing Agreement—The Directing Holder” in the Free Writing Prospectus for a description of the Loan Combination Directing Holder for the Google and Amazon Office Portfolio Loan Combination.
|
|
|
Control Termination Event:
|
Will occur when no Class of Control Eligible Certificates has a Certificate Balance (as notionally or actually reduced by any Appraisal Reduction Amounts and Realized Losses) equal to or greater than 25% of the Certificate Balance as of the Settlement Date.
Upon the occurrence and the continuance of a Control Termination Event, the Controlling Class will no longer have any Control Rights. The Directing Holder will no longer have the right to direct certain actions of the Special Servicer and will no longer have consent rights with respect to certain material actions that the Master Servicer or Special Servicer proposes to take with respect to a Mortgage Loan.
|
|
The depositor has filed a registration statement (including the prospectus) with the SEC (SEC File No. 333-193376) for the offering to which this communication relates. Before you invest, you should read the prospectus in the registration statement and other documents the depositor has filed with the SEC for more complete information about the depositor, the issuing trust and this offering. You may get these documents for free by visiting EDGAR on the SEC website at www.sec.gov. Alternatively, the depositor or Deutsche Bank Securities Inc., any other underwriter, or any dealer participating in this offering will arrange to send you the prospectus if you request it by calling toll-free 1-800-503-4611 or by email to the following address: prospectus.cpdg@db.com. The offered certificates referred to in these materials, and the asset pool backing them, are subject to modification or revision (including the possibility that one or more classes of certificates may be split, combined or eliminated at any time prior to issuance or availability of a final prospectus) and are offered on a “when, as and if issued” basis. You understand that, when you are considering the purchase of these certificates, a contract of sale will come into being no sooner than the date on which the relevant class has been priced and we have verified the allocation of certificates to be made to you; any “indications of interest” expressed by you, and any “soft circles” generated by us, will not create binding contractual obligations for you or us.
11
| COMM 2014-UBS2 Mortgage Trust | ||
| STRUCTURE OVERVIEW | ||
|
|
Upon the occurrence and continuation of a Control Termination Event, the Directing Holder (i.e., the majority owner or representative of the senior most Class of Control Eligible Certificates) will retain non–binding consultation rights with respect to certain material actions that the Special Servicer proposes to take with respect to a Mortgage Loan. Such consultation rights will continue until the occurrence of a Consultation Termination Event.
|
|
|
Consultation Termination Event:
|
Will occur when, without giving regard to the application of any Appraisal Reduction Amounts (i.e., giving effect to principal reduction through Realized Losses only), there is no Class of Control Eligible Certificates that has an aggregate Certificate Balance equal to 25% or more of the initial Certificate Balance of such Class.
Upon the occurrence and continuance of a Consultation Termination Event, the Directing Holder will have no rights under the Pooling and Servicing Agreement other than those rights that all Certificateholders have.
|
|
|
Appointment and Replacement
of Special Servicer: |
The Directing Holder will appoint the initial Special Servicer as of the Settlement Date. Prior to the occurrence and continuance of a Control Termination Event, the Special Servicer (other than with respect to the Google and Amazon Office Portfolio Loan Combination) may generally be replaced at any time by the Directing Holder.
Upon the occurrence and during the continuance of a Control Termination Event, the Directing Holder will no longer have the right to replace the Special Servicer and such replacement (other than with respect to the Google and Amazon Office Portfolio Loan Combination) will occur based on a vote of holders of all voting eligible Classes of Certificates as described below. See “Description of the Mortgage Pool—Loan Combinations” and “Description of the Pooling and Servicing Agreement” in the Free Writing Prospectus for a description of the special servicer appointment and replacement rights with respect to the Google and Amazon Office Portfolio Loan Combination.
|
|
|
Replacement of Special Servicer
by Vote of Certificateholders: |
Other than with respect to the Google and Amazon Office Portfolio Loan Combination, if a Control Termination Event has occurred and is continuing, upon (i) the written direction of holders of Certificates evidencing not less than 25% of the voting rights of all Classes of Certificates entitled to principal (taking into account the application of Appraisal Reduction Amounts to notionally reduce the Certificate Balances of Classes to which such Appraisal Reduction Amounts are allocable) requesting a vote to replace the Special Servicer with a replacement Special Servicer, (ii) payment by such requesting holders to the Certificate Administrator of all reasonable fees and expenses to be incurred by the Certificate Administrator in connection with administering such vote and (iii) delivery by such holders to the Certificate Administrator of written confirmations from each Rating Agency that the appointment of the replacement Special Servicer will not result in a downgrade of the Certificates, the Certificate Administrator will be required to promptly provide written notice to all certificateholders of such request and conduct the solicitation of votes of all Certificates in such regard. Upon the written direction (within 180 days) of (i) Holders of at least 75% of a Certificateholder Quorom or (ii) the Holders of more than 50% of the voting rights of each Class of Non–Reduced Certificates, the Trustee will immediately replace the Special Servicer (other than with respect to the Google and Amazon Office Portfolio Loan Combination) with the replacement Special Servicer.
“Certificateholder Quorum” means, in connection with any solicitation of votes in connection with the replacement of the Special Servicer as described above, the holders of Certificates evidencing at least 75% of the aggregate voting rights (taking into account Realized Losses and the application of any Appraisal Reduction Amounts to notionally
|
|
The depositor has filed a registration statement (including the prospectus) with the SEC (SEC File No. 333-193376) for the offering to which this communication relates. Before you invest, you should read the prospectus in the registration statement and other documents the depositor has filed with the SEC for more complete information about the depositor, the issuing trust and this offering. You may get these documents for free by visiting EDGAR on the SEC website at www.sec.gov. Alternatively, the depositor or Deutsche Bank Securities Inc., any other underwriter, or any dealer participating in this offering will arrange to send you the prospectus if you request it by calling toll-free 1-800-503-4611 or by email to the following address: prospectus.cpdg@db.com. The offered certificates referred to in these materials, and the asset pool backing them, are subject to modification or revision (including the possibility that one or more classes of certificates may be split, combined or eliminated at any time prior to issuance or availability of a final prospectus) and are offered on a “when, as and if issued” basis. You understand that, when you are considering the purchase of these certificates, a contract of sale will come into being no sooner than the date on which the relevant class has been priced and we have verified the allocation of certificates to be made to you; any “indications of interest” expressed by you, and any “soft circles” generated by us, will not create binding contractual obligations for you or us.
12
| COMM 2014-UBS2 Mortgage Trust | ||
| STRUCTURE OVERVIEW | ||
|
|
reduce the Certificate Balance of the Certificates) of all classes of Certificates entitled to principal, on an aggregate basis.
In addition, after the occurrence of a Consultation Termination Event, if the Operating Advisor determines that the Special Servicer is not performing its duties in accordance with the Servicing Standard, the Operating Advisor will have the right to recommend the replacement of the Special Servicer (other than with respect to the Google and Amazon Office Portfolio Loan Combination). The Operating Advisor’s recommendation to replace the Special Servicer (other than with respect to the Google and Amazon Office Portfolio Loan Combination) must be confirmed by a majority of the voting rights of all Classes of Certificates entitled to principal (taking into account the application of Appraisal Reduction Amounts to notionally reduce the Certificate Balances of Classes to which such Appraisal Reduction Amounts are allocable) within 180 days from the time such recommendation is posted to the Certificate Administrator website and is subject to the receipt of written confirmations from each Rating Agency that the appointment of the replacement Special Servicer will not result in a downgrade of the Certificates. See “Description of the Mortgage Pool—Loan Combinations” and “Description of the Pooling and Servicing Agreement” in the Free Writing Prospectus for a description of the special servicer appointment and replacement rights with respect to the Google and Amazon Office Portfolio Loan Combination.
|
|
|
Cap on Workout and Liquidation
Fees: |
The workout fees and liquidation fees payable to a Special Servicer under the Pooling and Servicing Agreement will be an amount equal to the lesser of: (1) 1.0% of each collection of interest and principal following a workout or liquidation and (2) $1,000,000 per workout or liquidation. All Modification Fees actually paid to the Special Servicer in connection with a workout or liquidation or in connection with any prior workout or partial liquidation that occurred within the prior 18 months will be deducted from the total workout and/or liquidation fees payable (other than Modification Fees earned while the Mortgage Loan was not in special servicing). In addition, the total amount of workout and liquidation fees actually payable by the Trust under the Pooling and Servicing Agreement will be capped in the aggregate at $1,000,000 for each Mortgage Loan. If a new special servicer begins servicing the Mortgage Loan, all amounts paid to the prior special servicer will be disregarded for purposes of calculating the cap.
|
|
|
Special Servicer Compensation:
|
The special servicing fee will equal 0.25% per annum of the stated principal balance of the related specially serviced loan or REO property. The Special Servicer and its affiliates will be prohibited from receiving or retaining any compensation or any other remuneration under the Pooling and Servicing Agreement (including in the form of commissions, brokerage fees, rebates, or as a result of any other fee–sharing arrangement) from any person (including the issuing entity, any borrower, any manager, any guarantor or indemnitor in respect of a Mortgage Loan or Serviced Loan Combination, if any, and any purchaser of any Mortgage Loan, Serviced Companion Loan or REO Property) in connection with the disposition, workout or foreclosure of any Mortgage Loan or Serviced Loan Combination, the management or disposition of any REO Property, or the performance of any other special servicing duties under the Pooling and Servicing Agreement, other than as expressly permitted in the Pooling and Servicing Agreement and other than commercially reasonable treasury management fees, banking fees and insurance commissions or fees received or retained by the Special Servicer or any of its Affiliates in connection with any services performed by such party with respect to any mortgage loan. Subject to certain limited exceptions, the Special Servicer will also be required to report any compensation or other remuneration the Special Servicer or its affiliates have received from any person and such information will be disclosed in the Certificateholders’ monthly distribution date statement.
|
|
|
Operating Advisor:
|
With respect to the Mortgage Loans (other than with respect to the Google and Amazon Office Portfolio Loan Combination) and prior to the occurrence of a Control Termination
|
|
The depositor has filed a registration statement (including the prospectus) with the SEC (SEC File No. 333-193376) for the offering to which this communication relates. Before you invest, you should read the prospectus in the registration statement and other documents the depositor has filed with the SEC for more complete information about the depositor, the issuing trust and this offering. You may get these documents for free by visiting EDGAR on the SEC website at www.sec.gov. Alternatively, the depositor or Deutsche Bank Securities Inc., any other underwriter, or any dealer participating in this offering will arrange to send you the prospectus if you request it by calling toll-free 1-800-503-4611 or by email to the following address: prospectus.cpdg@db.com. The offered certificates referred to in these materials, and the asset pool backing them, are subject to modification or revision (including the possibility that one or more classes of certificates may be split, combined or eliminated at any time prior to issuance or availability of a final prospectus) and are offered on a “when, as and if issued” basis. You understand that, when you are considering the purchase of these certificates, a contract of sale will come into being no sooner than the date on which the relevant class has been priced and we have verified the allocation of certificates to be made to you; any “indications of interest” expressed by you, and any “soft circles” generated by us, will not create binding contractual obligations for you or us.
13
| COMM 2014-UBS2 Mortgage Trust | ||
| STRUCTURE OVERVIEW | ||
|
|
Event, the Operating Advisor will have access to any final asset status report and all information available with respect to the transaction on the Certificate Administrator’s website but will not have any approval or consultation rights. After the occurrence and during the continuance of a Control Termination Event, the Operating Advisor will have consultation rights with respect to certain major decisions and will have additional monitoring responsibilities on behalf of the entire trust.
The Operating Advisor will be subject to termination if holders of at least 15% of the aggregate voting rights of the Certificates (in connection with termination and replacement relating to the Mortgage Loans) vote to terminate and replace the Operating Advisor and such vote is approved by holders of more than 50% of the applicable voting rights that exercise their right to vote, provided that holders of at least 50% of the applicable voting rights have exercised their right to vote. The holders initiating such vote will be responsible for the fees and expenses in connection with the vote and replacement.
The Operating Advisor will not have consultation rights in respect of the Google and Amazon Office Portfolio Loan Combination.
|
|
|
Liquidated Loan Waterfall:
|
On liquidation of any Mortgage Loan, all net liquidation proceeds will be applied so that amounts allocated as a recovery of accrued and unpaid interest will not, in the first instance, include any amount by which the interest portion of P&I Advances previously made was reduced as a result of Appraisal Reduction Amounts. After the adjusted interest amount is so allocated, any remaining net liquidation proceeds will be allocated to pay principal on the Mortgage Loan until the unpaid principal amount of the Mortgage Loan has been reduced to zero. Any remaining liquidation proceeds would then be allocated as a recovery of accrued and unpaid interest corresponding to the amount by which the interest portion of P&I Advances previously made was reduced as a result of Appraisal Reduction Amounts.
|
|
The depositor has filed a registration statement (including the prospectus) with the SEC (SEC File No. 333-193376) for the offering to which this communication relates. Before you invest, you should read the prospectus in the registration statement and other documents the depositor has filed with the SEC for more complete information about the depositor, the issuing trust and this offering. You may get these documents for free by visiting EDGAR on the SEC website at www.sec.gov. Alternatively, the depositor or Deutsche Bank Securities Inc., any other underwriter, or any dealer participating in this offering will arrange to send you the prospectus if you request it by calling toll-free 1-800-503-4611 or by email to the following address: prospectus.cpdg@db.com. The offered certificates referred to in these materials, and the asset pool backing them, are subject to modification or revision (including the possibility that one or more classes of certificates may be split, combined or eliminated at any time prior to issuance or availability of a final prospectus) and are offered on a “when, as and if issued” basis. You understand that, when you are considering the purchase of these certificates, a contract of sale will come into being no sooner than the date on which the relevant class has been priced and we have verified the allocation of certificates to be made to you; any “indications of interest” expressed by you, and any “soft circles” generated by us, will not create binding contractual obligations for you or us.
14
COMM 2014-UBS2 Mortgage Trust
|
OVERVIEW OF MORTGAGE POOL CHARACTERISTICS
|
|
Distribution of Cut–off Date Balances(1)
|
| % of Initial Outstanding Pool Balance |
Weighted Averages
|
|||||||||||||||
|
Range of Cut–off Date Balances
|
Number of
Mortgage Loans |
Aggregate
Cut–off Date Balance |
Mortgage Rate
|
Stated
Remaining Term (Mos.)(2) |
U/W
NCF DSCR |
Cut–off Date
LTV Ratio(3) |
LTV Ratio
at Maturity or ARD(3) |
|||||||||
|
$2,850,000
|
-
|
$9,999,999
|
27
|
$149,411,622
|
12.1%
|
5.1722%
|
110
|
1.53x
|
67.1%
|
56.6%
|
||||||
|
$10,000,000
|
-
|
$24,999,999
|
17
|
$222,672,757
|
18.0%
|
5.0327%
|
113
|
1.52x
|
68.4%
|
58.5%
|
||||||
|
$25,000,000
|
-
|
$49,999,999
|
8
|
$273,039,006
|
22.1%
|
5.1011%
|
111
|
1.48x
|
68.6%
|
61.4%
|
||||||
|
$50,000,000
|
-
|
$59,999,999
|
2
|
$109,907,080
|
8.9%
|
4.9730%
|
92
|
1.57x
|
62.4%
|
56.3%
|
||||||
|
$60,000,000
|
-
|
$120,000,000
|
5
|
$480,714,937
|
38.9%
|
4.9648%
|
118
|
1.44x
|
65.2%
|
57.9%
|
||||||
|
Total/Weighted Average
|
59
|
$1,235,745,402
|
100.0%
|
5.0329%
|
112
|
1.48x
|
66.5%
|
58.5%
|
||||||||
|
Distribution of Mortgage Rates(1)
|
| % of Initial Outstanding Pool Balance |
Weighted Averages
|
|||||||||||||||
|
Range of Mortgage Rates
|
Number of
Mortgage Loans |
Aggregate
Cut–off Date Balance |
Mortgage Rate
|
Stated
Remaining Term (Mos.)(2) |
U/W NCF
DSCR |
Cut–off Date
LTV Ratio(3) |
LTV Ratio
at Maturity or ARD(3) |
|||||||||
|
4.2750%
|
-
|
4.7499%
|
2
|
$71,110,645
|
5.8%
|
4.5488%
|
109
|
1.42x
|
60.7%
|
50.4%
|
||||||
|
4.7500%
|
-
|
4.9999%
|
18
|
$546,630,407
|
44.2%
|
4.8752%
|
116
|
1.46x
|
66.6%
|
59.7%
|
||||||
|
5.0000%
|
-
|
5.2499%
|
21
|
$350,976,342
|
28.4%
|
5.0578%
|
113
|
1.45x
|
67.7%
|
59.6%
|
||||||
|
5.2500%
|
-
|
5.7990%
|
18
|
$267,028,008
|
21.6%
|
5.4521%
|
106
|
1.60x
|
66.2%
|
56.7%
|
||||||
|
Total/Weighted Average
|
59
|
$1,235,745,402
|
100.0%
|
5.0329%
|
112
|
1.48x
|
66.5%
|
58.5%
|
||||||||
|
Property Type Distribution(1)(4)
|
|
Weighted Averages
|
||||||||||||||||||||
|
Property Type
|
Number of
Mortgaged Properties |
Aggregate
Cut–off Date Balance |
% of Initial
Outstanding Pool Balance |
Number
of Units, Rooms, Beds, Pads or NRA |
Cut–off Date Balance per Unit/Room/Bed Pad/NRA
|
Mortgage Rate |
Stated Remaining Term (Mos.)(2) |
Occupancy | U/W NCF DSCR | Cut–off Date LTV Ratio(3) | LTV Ratio at Maturity or ARD(3) |
|||||||||
|
Retail
|
26
|
$308,965,807
|
25.0%
|
2,575,735
|
$221
|
4.8765%
|
108
|
94.8%
|
1.46x
|
67.0%
|
57.6%
|
|||||||||
|
Anchored(5)
|
24
|
$298,585,529
|
24.2%
|
2,422,574
|
$226
|
4.8641%
|
107
|
95.2%
|
1.45x
|
67.1%
|
57.8%
|
|||||||||
|
Unanchored
|
2
|
$10,380,278
|
0.8%
|
153,161
|
$73
|
5.2341%
|
119
|
82.5%
|
1.78x
|
63.5%
|
52.7%
|
|||||||||
|
Office
|
7
|
$277,200,000
|
22.4%
|
2,233,853
|
$269
|
4.9577%
|
118
|
99.5%
|
1.56x
|
65.7%
|
59.2%
|
|||||||||
|
Suburban
|
5
|
$238,100,000
|
19.3%
|
1,792,201
|
$297
|
4.9650%
|
118
|
100.0%
|
1.48x
|
65.2%
|
58.1%
|
|||||||||
|
CBD
|
1
|
$31,200,000
|
2.5%
|
390,479
|
$80
|
4.9020%
|
118
|
96.3%
|
2.28x
|
68.3%
|
68.3%
|
|||||||||
|
Medical
|
1
|
$7,900,000
|
0.6%
|
51,173
|
$154
|
4.9590%
|
119
|
96.2%
|
1.29x
|
69.2%
|
58.3%
|
|||||||||
|
Multifamily
|
33
|
$152,092,797
|
12.3%
|
3,125
|
$159,913
|
5.2532%
|
115
|
95.7%
|
1.38x
|
67.7%
|
59.6%
|
|||||||||
|
Garden
|
26
|
$61,449,321
|
5.0%
|
1,994
|
$38,633
|
5.1458%
|
109
|
93.7%
|
1.59x
|
67.0%
|
59.0%
|
|||||||||
|
Mid Rise
|
5
|
$57,218,309
|
4.6%
|
258
|
$360,783
|
5.0497%
|
119
|
98.2%
|
1.23x
|
66.7%
|
60.2%
|
|||||||||
|
Student Housing
|
2
|
$33,425,167
|
2.7%
|
873
|
$39,020
|
5.7990%
|
118
|
95.2%
|
1.27x
|
70.8%
|
59.8%
|
|||||||||
|
Mixed Use
|
2
|
$145,265,615
|
11.8%
|
801,696
|
$298
|
4.9291%
|
119
|
93.7%
|
1.35x
|
64.5%
|
57.3%
|
|||||||||
|
Office/Lab/Retail
|
1
|
$120,000,000
|
9.7%
|
610,110
|
$333
|
4.8200%
|
119
|
93.2%
|
1.34x
|
62.3%
|
56.2%
|
|||||||||
|
Office/Retail/Multifamily
|
1
|
$25,265,615
|
2.0%
|
191,586
|
$132
|
5.4475%
|
117
|
96.5%
|
1.42x
|
74.8%
|
62.5%
|
|||||||||
|
Hospitality
|
5
|
$139,414,675
|
11.3%
|
963
|
$153,971
|
5.3797%
|
97
|
77.5%
|
1.77x
|
62.8%
|
55.4%
|
|||||||||
|
Full Service
|
2
|
$114,907,463
|
9.3%
|
720
|
$164,291
|
5.3782%
|
93
|
78.6%
|
1.80x
|
62.1%
|
56.5%
|
|||||||||
|
Limited Service
|
3
|
$24,507,212
|
2.0%
|
243
|
$105,586
|
5.3867%
|
119
|
72.4%
|
1.61x
|
65.9%
|
50.1%
|
|||||||||
|
Manufactured Housing Community
|
8
|
$106,733,859
|
8.6%
|
2,412
|
$54,818
|
4.9358%
|
118
|
91.0%
|
1.30x
|
74.0%
|
66.3%
|
|||||||||
|
Industrial
|
5
|
$74,231,170
|
6.0%
|
1,233,369
|
$102
|
5.1258%
|
114
|
100.0%
|
1.44x
|
66.5%
|
57.2%
|
|||||||||
|
Self Storage
|
4
|
$17,418,965
|
1.4%
|
268,060
|
$79
|
5.1572%
|
118
|
86.3%
|
1.60x
|
65.0%
|
54.4%
|
|||||||||
|
Other
|
5
|
$14,422,513
|
1.2%
|
423,257
|
$36
|
5.2912%
|
101
|
100.0%
|
1.64x
|
61.9%
|
48.8%
|
|||||||||
|
Total/Weighted Average
|
95
|
$1,235,745,402
|
100.0%
|
5.0329%
|
112
|
93.8%
|
1.48x
|
66.5%
|
58.5%
|
|||||||||||
|
Geographic Distribution(1)(4)
|
|
State/Location
|
Number of
Mortgaged Properties |
Aggregate Cut–off
Date Balance
|
% of Initial
Outstanding
Pool
Balance
|
Weighted Averages
|
||||||||
|
Mortgage Rate
|
Stated
Remaining Term
(Mos.)(2)
|
U/W NCF
DSCR |
Cut–off Date
LTV Ratio(3)
|
LTV Ratio
at Maturity or ARD(3)
|
||||||||
|
California
|
8
|
$233,816,253
|
18.9%
|
5.1137%
|
105
|
1.51x
|
67.2%
|
62.0%
|
||||
|
Northern(6)
|
2
|
$120,000,000
|
9.7%
|
5.0350%
|
118
|
1.40x
|
66.6%
|
60.6%
|
||||
|
Southern(6)
|
6
|
$113,816,253
|
9.2%
|
5.1966%
|
92
|
1.63x
|
67.9%
|
63.4%
|
||||
|
Massachusetts
|
2
|
$151,500,000
|
12.3%
|
4.8699%
|
119
|
1.33x
|
63.3%
|
57.1%
|
||||
|
New York
|
10
|
$103,287,692
|
8.4%
|
5.0127%
|
99
|
1.43x
|
64.9%
|
57.7%
|
||||
|
Minnesota
|
1
|
$88,000,000
|
7.1%
|
4.8350%
|
118
|
1.58x
|
62.4%
|
53.8%
|
||||
|
Colorado
|
3
|
$87,807,474
|
7.1%
|
4.9150%
|
118
|
1.26x
|
74.8%
|
67.4%
|
||||
|
Illinois
|
5
|
$79,193,867
|
6.4%
|
4.7294%
|
119
|
1.32x
|
62.6%
|
52.0%
|
||||
|
Louisiana
|
2
|
$78,107,463
|
6.3%
|
5.3044%
|
119
|
1.70x
|
61.6%
|
51.1%
|
||||
|
Texas
|
6
|
$67,374,351
|
5.5%
|
5.0768%
|
110
|
1.89x
|
68.8%
|
64.1%
|
||||
|
Pennsylvania
|
3
|
$66,939,352
|
5.4%
|
4.8954%
|
119
|
1.40x
|
69.1%
|
57.6%
|
||||
|
Other
|
55
|
$279,718,948
|
22.6%
|
5.1931%
|
112
|
1.52x
|
68.2%
|
58.1%
|
||||
|
Total/Weighted Average
|
95
|
$1,235,745,402
|
100.0%
|
5.0329%
|
112
|
1.48x
|
66.5%
|
58.5%
|
||||
|
(1)
|
With respect to the Google and Amazon Office Portfolio Loan and the One Kendall Square Loan, LTV, DSCR and Cut–off Date Balance per Unit/Room/Bed/Pad/NRA calculations include the related pari passu companion loans.
|
|
(2)
|
In the case of one mortgage loan with an anticipated repayment date, Stated Remaining Term (Mos.) is through the related anticipated repayment date.
|
|
(3)
|
With respect to the Creekside Mixed Use Development loan and Hampton Inn Rehoboth Beach loan, the Cut-off Date LTV and Maturity Date or ARD LTV have been calculated based on “As Stabilized” appraised values of $33.8 million and $14.6 million, respectively. The “As-is” Cut-off Date LTV and “As-is” Maturity Date or ARD LTV are 75.9% and 63.5%, respectively, for the Creekside Mixed Use Development loan and 77.5% and 58.6%, respectively, for the Hampton Inn Rehoboth Beach loan. With respect to the Arlington Farms Apartments loan, the Cut-off Date LTV and Maturity Date or ARD LTV have been calculated based on “As Complete” appraised value of $6.76 million. The “As-is” Cut-off Date LTV and an “As-is” Maturity Date or ARD LTV are 77.9% and 64.9%, respectively.
|
|
(4)
|
Reflects allocated loan amount for properties securing multi–property mortgage loans (except with respect to the Garden Hill Apartments Portfolio loan).
|
|
(5)
|
Includes anchored, shadow anchored and single tenant properties.
|
|
(6)
|
Northern California properties have a zip code greater than 93600. Southern California properties have a zip code less than or equal to 93600.
|
The depositor has filed a registration statement (including the prospectus) with the SEC (SEC File No. 333-193376) for the offering to which this communication relates. Before you invest, you should read the prospectus in the registration statement and other documents the depositor has filed with the SEC for more complete information about the depositor, the issuing trust and this offering. You may get these documents for free by visiting EDGAR on the SEC website at www.sec.gov. Alternatively, the depositor or Deutsche Bank Securities Inc., any other underwriter, or any dealer participating in this offering will arrange to send you the prospectus if you request it by calling toll-free 1-800-503-4611 or by email to the following address: prospectus.cpdg@db.com. The offered certificates referred to in these materials, and the asset pool backing them, are subject to modification or revision (including the possibility that one or more classes of certificates may be split, combined or eliminated at any time prior to issuance or availability of a final prospectus) and are offered on a “when, as and if issued” basis. You understand that, when you are considering the purchase of these certificates, a contract of sale will come into being no sooner than the date on which the relevant class has been priced and we have verified the allocation of certificates to be made to you; any “indications of interest” expressed by you, and any “soft circles” generated by us, will not create binding contractual obligations for you or us.
15
COMM 2014-UBS2 Mortgage Trust
|
OVERVIEW OF MORTGAGE POOL CHARACTERISTICS
|
|
Distribution of Cut–off Date LTV Ratios(1)(3)
|
|
Range of Cut–off Date LTV
Ratios |
Number of
Mortgage Loans |
Aggregate Cut–off
Date Balance
|
% of Initial
Outstanding Pool Balance |
Weighted Averages
|
||||||||
|
Mortgage Rate
|
Stated
Remaining Term (Mos.)(2) |
U/W NCF
DSCR |
Cut–off Date
LTV Ratio |
LTV Ratio
at Maturity or ARD |
||||||||
|
43.1%
|
-
|
54.9%
|
2
|
$7,691,534
|
0.6%
|
4.9776%
|
86
|
2.00x
|
47.5%
|
42.2%
|
||
|
55.0%
|
-
|
59.9%
|
5
|
$138,320,737
|
11.2%
|
5.0102%
|
119
|
1.57x
|
59.0%
|
48.3%
|
||
|
60.0%
|
-
|
64.9%
|
10
|
$322,585,688
|
26.1%
|
4.8916%
|
109
|
1.47x
|
62.4%
|
55.5%
|
||
|
65.0%
|
-
|
69.9%
|
23
|
$421,920,170
|
34.1%
|
5.0978%
|
109
|
1.57x
|
67.1%
|
60.3%
|
||
|
70.0%
|
-
|
74.9%
|
18
|
$342,377,273
|
27.7%
|
5.0956%
|
117
|
1.35x
|
73.0%
|
63.6%
|
||
|
75.0%
|
-
|
75.0%
|
1
|
$2,850,000
|
0.2%
|
5.1500%
|
120
|
1.43x
|
75.0%
|
62.0%
|
||
|
Total/Weighted Average
|
59
|
$1,235,745,402
|
100.0%
|
5.0329%
|
112
|
1.48x
|
66.5%
|
58.5%
|
||||
|
Distribution of LTV Ratios at Maturity or ARD(1)(3)
|
|
Range of LTV Ratios
at Maturity or ARD |
Number of
Mortgage Loans
|
Aggregate Cut–off
Date Balance
|
% of Initial
Outstanding
Pool Balance
|
Weighted Averages
|
||||||||
|
Mortgage Rate
|
Stated
Remaining Term
(Mos.)(2)
|
U/W NCF
DSCR |
Cut–off Date
LTV Ratio
|
LTV Ratio
at Maturity or
ARD |
||||||||
|
38.4%
|
-
|
49.9%
|
7
|
$146,012,271
|
11.8%
|
5.0085%
|
117
|
1.60x
|
58.4%
|
48.0%
|
||
|
50.0%
|
-
|
54.9%
|
10
|
$179,238,560
|
14.5%
|
5.0104%
|
115
|
1.57x
|
63.6%
|
53.0%
|
||
|
55.0%
|
-
|
59.9%
|
16
|
$321,488,900
|
26.0%
|
5.0605%
|
111
|
1.38x
|
65.0%
|
57.3%
|
||
|
60.0%
|
-
|
68.3%
|
26
|
$589,005,670
|
47.7%
|
5.0308%
|
111
|
1.49x
|
70.2%
|
63.5%
|
||
|
Total/Weighted Average
|
59
|
$1,235,745,402
|
100.0%
|
5.0329%
|
112
|
1.48x
|
66.5%
|
58.5%
|
||||
|
Distribution of Underwritten NCF Debt Service Coverage Ratios(1)
|
|
Range of Underwritten NCF
Debt Service Coverage Ratios |
Number of
Mortgage Loans
|
Aggregate Cut–off
Date Balance
|
% of Initial
Outstanding
Pool Balance
|
Weighted Averages
|
|||||||||
|
Mortgage Rate
|
Stated
Remaining Term
(Mos.)(2)
|
U/W NCF
DSCR |
Cut–off Date
LTV Ratio(3)
|
LTV Ratio
at Maturity or
ARD(3) |
|||||||||
|
1.21x
|
-
|
1.24x
|
3
|
$61,125,265
|
4.9%
|
5.0203%
|
119
|
1.22x
|
66.4%
|
59.6%
|
|||
|
1.25x
|
-
|
1.29x
|
6
|
$161,757,641
|
13.1%
|
5.1637%
|
118
|
1.27x
|
72.7%
|
63.6%
|
|||
|
1.30x
|
-
|
1.39x
|
10
|
$319,741,639
|
25.9%
|
4.8448%
|
117
|
1.34x
|
64.9%
|
56.8%
|
|||
|
1.40x
|
-
|
1.49x
|
16
|
$257,053,416
|
20.8%
|
5.1204%
|
118
|
1.42x
|
68.9%
|
59.8%
|
|||
|
1.50x
|
-
|
1.59x
|
9
|
$185,827,882
|
15.0%
|
4.9480%
|
115
|
1.56x
|
64.7%
|
55.1%
|
|||
|
1.60x
|
-
|
1.69x
|
3
|
$16,439,887
|
1.3%
|
5.0118%
|
119
|
1.65x
|
64.2%
|
52.9%
|
|||
|
1.70x
|
-
|
1.99x
|
8
|
$181,715,129
|
14.7%
|
5.2382%
|
85
|
1.79x
|
62.9%
|
57.1%
|
|||
|
2.00x
|
-
|
2.33x
|
4
|
$52,084,543
|
4.2%
|
4.9589%
|
113
|
2.26x
|
65.0%
|
63.7%
|
|||
|
Total/Weighted Average
|
59
|
$1,235,745,402
|
100.0%
|
5.0329%
|
112
|
1.48x
|
66.5%
|
58.5%
|
|||||
|
Distribution of Original Terms to Maturity or ARD(1)(2)
|
|
Original Terms
to Maturity or ARD |
Number of
Mortgage Loans
|
Aggregate Cut–off
Date Balance
|
% of Initial
Outstanding
Pool Balance
|
Weighted Averages
|
||||||||
|
Mortgage Rate
|
Stated
Remaining Term
(Mos.)
|
U/W NCF
DSCR |
Cut–off Date
LTV Ratio(3)
|
LTV Ratio
at Maturity or
ARD(3) |
||||||||
|
60
|
6
|
$113,015,182
|
9.1%
|
5.1364%
|
59
|
1.79x
|
64.8%
|
61.9%
|
||||
|
84
|
2
|
$21,900,000
|
1.8%
|
4.8671%
|
83
|
1.52x
|
62.0%
|
53.0%
|
||||
|
120
|
51
|
$1,100,830,220
|
89.1%
|
5.0256%
|
119
|
1.45x
|
66.8%
|
58.3%
|
||||
|
Total/Weighted Average
|
59
|
$1,235,745,402
|
100.0%
|
5.0329%
|
112
|
1.48x
|
66.5%
|
58.5%
|
||||
|
Distribution of Remaining Terms to Maturity or ARD(1)(2)
|
|
Range of Remaining Terms
to Maturity or ARD
|
Number of
Mortgage Loans
|
Aggregate Cut–off
Date Balance
|
% of Initial
Outstanding
Pool Balance
|
Weighted Averages
|
||||||||
|
Mortgage Rate
|
Stated
Remaining Term
(Mos.)
|
U/W NCF
DSCR |
Cut–off Date
LTV Ratio(3)
|
LTV Ratio
at Maturity or
ARD(3) |
||||||||
|
57
|
-
|
60
|
6
|
$113,015,182
|
9.1%
|
5.1364%
|
59
|
1.79x
|
64.8%
|
61.9%
|
||
|
82
|
-
|
84
|
2
|
$21,900,000
|
1.8%
|
4.8671%
|
83
|
1.52x
|
62.0%
|
53.0%
|
||
|
114
|
-
|
120
|
51
|
$1,100,830,220
|
89.1%
|
5.0256%
|
119
|
1.45x
|
66.8%
|
58.3%
|
||
|
Total/Weighted Average
|
59
|
$1,235,745,402
|
100.0%
|
5.0329%
|
112
|
1.48x
|
66.5%
|
58.5%
|
||||
|
(1)
|
With respect to the Google and Amazon Office Portfolio Loan and the One Kendall Square Loan, LTV and DSCR calculations include the related pari passu companion loans.
|
|
(2)
|
In the case of one mortgage loan with an anticipated repayment date, Original Terms to Maturity or ARD and Stated Remaining Term (Mos.) are through the related anticipated repayment date.
|
|
(3)
|
With respect to the Creekside Mixed Use Development loan and the Hampton Inn Rehoboth Beach loan, the Cut-off Date LTV and Maturity Date or ARD LTV have been calculated based on “As Stabilized” appraised values of $33.8 million and $14.6 million, respectively. The “As-is” Cut-off Date LTV and “As-is” Maturity Date or ARD LTV are 75.9% and 63.5%, respectively, for the Creekside Mixed Use Development loan and 77.5% and 58.6%, respectively, for the Hampton Inn Rehoboth Beach loan. With respect to the Arlington Farms Apartments loan, the Cut-off Date LTV and Maturity Date or ARD LTV have been calculated based on an “As Complete” appraised value of $6.76 million. The “As-is” Cut-off Date LTV and “As-is” Maturity Date or ARD LTV are 77.9% and 64.9%, respectively.
|
The depositor has filed a registration statement (including the prospectus) with the SEC (SEC File No. 333-193376) for the offering to which this communication relates. Before you invest, you should read the prospectus in the registration statement and other documents the depositor has filed with the SEC for more complete information about the depositor, the issuing trust and this offering. You may get these documents for free by visiting EDGAR on the SEC website at www.sec.gov. Alternatively, the depositor or Deutsche Bank Securities Inc., any other underwriter, or any dealer participating in this offering will arrange to send you the prospectus if you request it by calling toll-free 1-800-503-4611 or by email to the following address: prospectus.cpdg@db.com. The offered certificates referred to in these materials, and the asset pool backing them, are subject to modification or revision (including the possibility that one or more classes of certificates may be split, combined or eliminated at any time prior to issuance or availability of a final prospectus) and are offered on a “when, as and if issued” basis. You understand that, when you are considering the purchase of these certificates, a contract of sale will come into being no sooner than the date on which the relevant class has been priced and we have verified the allocation of certificates to be made to you; any “indications of interest” expressed by you, and any “soft circles” generated by us, will not create binding contractual obligations for you or us.
16
|
COMM 2014-UBS2 Mortgage Trust
|
|
OVERVIEW OF MORTGAGE POOL CHARACTERISTICS
|
|
Distribution of Underwritten NOI Debt Yields(1)
|
|
Range of Underwritten NOI
Debt Yields
|
Number of
Mortgage Loans
|
Aggregate Cut–off
Date Balance
|
% of Initial
Outstanding
Pool Balance
|
Weighted Averages
|
||||||||||||||||
|
Mortgage Rate
|
Stated
Remaining Term
(Mos.)(2)
|
U/W NCF
DSCR
|
Cut–off Date
LTV Ratio(3)
|
LTV Ratio
at Maturity
or ARD(3)
|
||||||||||||||||
|
7.8%
|
-
|
7.9%
|
2
|
$45,625,265
|
3.7%
|
4.9895%
|
119
|
1.22x
|
63.7%
|
57.4%
|
||||||||||
|
8.0%
|
-
|
9.9%
|
20
|
$633,624,280
|
51.3%
|
4.9536%
|
118
|
1.34x
|
67.6%
|
59.8%
|
||||||||||
|
10.0%
|
-
|
12.4%
|
28
|
$446,296,449
|
36.1%
|
5.1050%
|
106
|
1.64x
|
66.8%
|
58.6%
|
||||||||||
|
12.5%
|
-
|
14.9%
|
7
|
$102,114,865
|
8.3%
|
5.2114%
|
108
|
1.79x
|
60.8%
|
51.6%
|
||||||||||
|
15.0%
|
-
|
18.0%
|
2
|
$8,084,543
|
0.7%
|
5.2637%
|
87
|
2.09x
|
49.9%
|
41.0%
|
||||||||||
|
Total/Weighted Average
|
59 |
$1,235,745,402
|
100.0%
|
5.0329%
|
112
|
1.48x
|
66.5%
|
58.5%
|
||||||||||||
|
Distribution of Amortization Types(1)
|
| Weighted Averages | ||||||||||||||||||
|
Amortization Type
|
Number of
Mortgage Loans |
Aggregate Cut–off
Date Balance |
% of Initial
Outstanding Pool Balance |
Mortgage Rate
|
Stated
Remaining Term (Mos.)(2) |
U/W NCF
DSCR |
Cut–off Date
LTV Ratio(3) |
LTV Ratio
at Maturity
or ARD(3) |
||||||||||
|
Interest Only, then Amortizing
|
21
|
$692,432,474
|
56.0%
|
4.9366%
|
118
|
1.38x
|
67.3%
|
60.0%
|
||||||||||
|
Amortizing Balloon
|
35
|
$449,312,928
|
36.4%
|
5.1511%
|
109
|
1.53x
|
65.2%
|
54.4%
|
||||||||||
|
Interest Only
|
2
|
$62,800,000
|
5.1%
|
5.3150%
|
71
|
1.95x
|
66.2%
|
66.2%
|
||||||||||
|
Interest Only, ARD
|
1
|
$31,200,000
|
2.5%
|
4.9020%
|
118
|
2.28x
|
68.3%
|
68.3%
|
||||||||||
|
Total/Weighted Average
|
59
|
$1,235,745,402
|
100.0%
|
5.0329%
|
112
|
1.48x
|
66.5%
|
58.5%
|
||||||||||
|
(1)
|
With respect to the Google and Amazon Office Portfolio Loan and the One Kendall Square Loan, LTV, debt yield and DSCR calculations include the related pari passu companion loans.
|
|
(2)
|
In the case of one mortgage loan with an anticipated repayment date, Stated Remaining Term (Mos.) is through the related anticipated repayment date.
|
|
(3)
|
With respect to the Creekside Mixed Use Development loan and the Hampton Inn Rehoboth Beach loan, the Cut-off Date LTV and Maturity Date or ARD LTV have been calculated based on “As Stabilized” appraised values of $33.8 million and $14.6 million, respectively. The “As-is” Cut-off Date LTV and “As-is” Maturity Date or ARD LTV are 75.9% and 63.5%, respectively, for the Creekside Mixed Use Development loan and 77.5% and 58.6%, respectively, for the Hampton Inn Rehoboth Beach loan. With respect to the Arlington Farms Apartments loan, the Cut-off Date LTV and Maturity Date or ARD LTV have been calculated based on an “As Complete” appraised value of $6.76 million. The “As-is” Cut-off Date LTV and “As-is” Maturity Date or ARD LTV are 77.9% and 64.9%, respectively.
|
|
Ten Largest Mortgage Loans(1)
|
|
Mortgage Loans
|
Mortgage
Loan
Seller
|
City, State
|
Property Type
|
Cut–off Date
Balance
|
% of Initial
Outstanding
Pool Balance
|
Cut–off Date
Balance per
NRA/Unit/Pad/
Room
|
Cut–off
Date LTV
Ratio
|
U/W
NCF
DSCR
|
U/W NOI
Debt
Yield
|
||||||||
|
Google and Amazon Office Portfolio
|
GACC
|
Sunnyvale, CA
|
Office
|
$120,000,000
|
9.7%
|
$427
|
66.6%
|
1.40x
|
9.0%
|
||||||||
|
One Kendall Square
|
GACC
|
Cambridge, MA
|
Mixed Use
|
$120,000,000
|
9.7%
|
$333
|
62.3%
|
1.34x
|
9.2%
|
||||||||
|
Excelsior Crossings
|
GACC
|
Hopkins, MN
|
Office
|
$88,000,000
|
7.1%
|
$175
|
62.4%
|
1.58x
|
10.3%
|
||||||||
|
AMC Portfolio Pool II
|
GACC
|
Various, CO
|
Manufactured Housing Community
|
$87,807,474
|
7.1%
|
$61,967
|
74.8%
|
1.26x
|
8.1%
|
||||||||
|
Omni Royal Orleans
|
UBSRES
|
New Orleans, LA
|
Hospitality
|
$64,907,463
|
5.3%
|
$188,138
|
59.0%
|
1.76x
|
13.6%
|
||||||||
|
One North State Street
|
GACC
|
Chicago, IL
|
Retail
|
$59,907,080
|
4.8%
|
$351
|
59.3%
|
1.33x
|
8.5%
|
||||||||
|
Embassy Suites - Anaheim
|
UBSRES
|
Garden Grove, CA
|
Hospitality
|
$50,000,000
|
4.0%
|
$133,333
|
66.1%
|
1.85x
|
12.0%
|
||||||||
|
Canyon Crossing
|
UBSRES
|
Riverside, CA
|
Retail
|
$44,700,000
|
3.6%
|
$151
|
71.0%
|
1.36x
|
9.3%
|
||||||||
|
53 Broadway
|
GACC
|
Brooklyn, NY
|
Multifamily
|
$37,000,000
|
3.0%
|
$493,333
|
62.4%
|
1.22x
|
7.9%
|
||||||||
|
Valley Forge Shopping Center
|
GACC
|
King of Prussia, PA
|
Retail
|
$35,000,000
|
2.8%
|
$103
|
71.9%
|
1.33x
|
8.6%
|
||||||||
|
Total/Weighted Average
|
|
|
|
$707,322,017
|
57.2%
|
65.3%
|
1.44x
|
9.6%
|
|
(1)
|
With respect to the Google and Amazon Office Portfolio Loan and the One Kendall Square Loan, LTV, DSCR, debt yield and Cut–off Date Balance per NRA/Unit/Pad/ Room calculations include the related pari passu companion loans.
|
|
Pari Passu Companion Loan Summary
|
|
Mortgage Loans
|
Mortgage Loan
Cut–off Date
Balance
|
Companion
Loans
Cut–off Date
Balance
|
Loan Combination
Cut–off
Date Balance
|
Pooling & Servicing
Agreement
|
Master Servicer
|
Special Servicer
|
Voting Rights
|
|||||||
|
Google and Amazon Office Portfolio
|
$120,000,000
|
$332,200,000
|
$452,200,000
|
COMM 2014-CCRE14
|
Wells Fargo Bank, NA
|
Rialto Capital Advisors, LLC
|
COMM 2014-CCRE14
|
|||||||
|
One Kendall Square
|
$120,000,000
|
$83,000,000
|
$203,000,000
|
COMM 2014-UBS2
|
KeyBank National Association
|
LNR Partners LLC
|
COMM 2014-UBS2
|
The depositor has filed a registration statement (including the prospectus) with the SEC (SEC File No. 333-193376) for the offering to which this communication relates. Before you invest, you should read the prospectus in the registration statement and other documents the depositor has filed with the SEC for more complete information about the depositor, the issuing trust and this offering. You may get these documents for free by visiting EDGAR on the SEC website at www.sec.gov. Alternatively, the depositor or Deutsche Bank Securities Inc., any other underwriter, or any dealer participating in this offering will arrange to send you the prospectus if you request it by calling toll-free 1-800-503-4611 or by email to the following address: prospectus.cpdg@db.com. The offered certificates referred to in these materials, and the asset pool backing them, are subject to modification or revision (including the possibility that one or more classes of certificates may be split, combined or eliminated at any time prior to issuance or availability of a final prospectus) and are offered on a “when, as and if issued” basis. You understand that, when you are considering the purchase of these certificates, a contract of sale will come into being no sooner than the date on which the relevant class has been priced and we have verified the allocation of certificates to be made to you; any “indications of interest” expressed by you, and any “soft circles” generated by us, will not create binding contractual obligations for you or us.
17
|
COMM 2014-UBS2 Mortgage Trust
|
|
OVERVIEW OF MORTGAGE POOL CHARACTERISTICS
|
|
Existing Mezzanine Debt Summary
|
|
Mortgage Loans
|
Mortgage Loan
Cut–off Date
Balance |
Mezzanine Debt
Cut–off Date
Balance
|
Trust
U/W NCF
DSCR |
Total Debt
U/W NCF
DSCR |
Trust
Cut–off Date
LTV Ratio
|
Total Debt
Cut–off Date
LTV Ratio
|
Trust
U/W NOI
Debt Yield |
Total Debt
U/W NOI
Debt Yield |
||||||||
|
Google and Amazon Office Portfolio
|
$120,000,000
|
$67,800,000
|
1.40x
|
1.15x
|
66.6%
|
76.6%
|
9.0%
|
7.8%
|
||||||||
|
Embassy Suites – Anaheim
|
$50,000,000
|
$10,000,000
|
1.85x
|
1.34x
|
66.1%
|
79.4%
|
12.0%
|
10.0%
|
||||||||
|
Canyon Crossing
|
$44,700,000
|
$5,960,000
|
1.36x
|
1.13x
|
71.0%
|
80.5%
|
9.3%
|
8.2%
|
||||||||
|
Clemson Student Housing
|
$33,425,167
|
$3,000,000
|
1.27x
|
1.09x
|
70.8%
|
77.2%
|
9.2%
|
8.4%
|
||||||||
|
FedEx Distribution – Natick
|
$31,500,000
|
$3,500,000
|
1.31x
|
1.07x
|
67.2%
|
74.6%
|
8.4%
|
7.6%
|
|
Previous Securitization History(1)
|
|
Mortgage Loans
|
Mortgage Loan Seller
|
City, State
|
Property Type
|
Cut–off Date
Balance
|
% of Initial
Outstanding
Pool Balance
|
Previous Securitization
|
||||||
|
Google and Amazon Office Portfolio
|
GACC
|
Sunnyvale, CA
|
Office
|
$120,000,000
|
9.7%
|
Various(2)
|
||||||
|
One Kendall Square
|
GACC
|
Cambridge, MA
|
Mixed Use
|
$120,000,000
|
9.7%
|
COMM 2011-FL1
|
||||||
|
AMC Portfolio Pool II
|
GACC
|
Various, CO
|
Manufactured Housing Community
|
$87,807,474
|
7.1%
|
Various(3)
|
||||||
|
One North State Street
|
GACC
|
Chicago, IL
|
Retail
|
$59,907,080
|
4.8%
|
BSCMS 2004-PWR4
|
||||||
|
Embassy Suites – Anaheim
|
UBSRES
|
Garden Grove, CA
|
Hospitality
|
$50,000,000
|
4.0%
|
GKKRE 2007-1A
|
||||||
|
Beltway 8 Corporate Centre I
|
GACC
|
Houston, TX
|
Office
|
$15,300,000
|
1.2%
|
MLMT 2004-BPC1
|
||||||
|
Grand Lifestyle MHC Portfolio
|
UBSRES
|
Various, FL
|
Manufactured Housing Community
|
$12,100,000
|
1.0%
|
Various(4)
|
||||||
|
Turnpike Square
|
GACC
|
Milford, CT
|
Retail
|
$10,484,657
|
0.8%
|
LBUBS 2004-C4
|
||||||
|
Valley Park Commons
|
GACC
|
Hagerstown, MD
|
Retail
|
$9,850,000
|
0.8%
|
BSCMS 2005-PWR8
|
||||||
|
Willow Creek Shopping Center
|
UBSRES
|
Prescott, AZ
|
Retail
|
$8,487,632
|
0.7%
|
MLMT 2005-MKB2
|
||||||
|
950 Haverford
|
CCRE
|
Bryn Mawr, PA
|
Office
|
$7,900,000
|
0.6%
|
JPMCC 2003-CIBC6
|
||||||
|
Santan Gateway
|
UBSRES
|
Chandler, AZ
|
Retail
|
$6,079,107
|
0.5%
|
GCCFC 2006-GG7
|
||||||
|
Apache Trace Apartments
|
KeyBank
|
Guymon, OK
|
Multifamily
|
$5,600,000
|
0.5%
|
JPMCC 2005-LDP3
|
||||||
|
Arlington Farms Apartments
|
CCRE
|
Waco, TX
|
Multifamily
|
$4,992,923
|
0.4%
|
CSFB 2004-C1
|
||||||
|
StorQuest Long Beach
|
UBSRES
|
Long Beach, CA
|
Self Storage
|
$3,400,000
|
0.3%
|
CSFB 2004-C2
|
||||||
|
StorQuest Rancho Cucamonga
|
UBSRES
|
Rancho Cucamonga, CA
|
Self Storage
|
$3,291,734
|
0.3%
|
MSC 2004-T15
|
||||||
|
Eaton Pines MHC
|
UBSRES
|
Eaton Rapids, MI
|
Manufactured Housing Community
|
$3,039,597
|
0.2%
|
WBCMT 2003-C9
|
||||||
|
Total
|
$528,240,204
|
42.7%
|
|
(1)
|
Includes mortgaged properties securing mortgage loans for which the most recent prior financing of all or a significant portion of such property was included in a securitization. The table above is based on information provided by the related borrower or obtained through searches of a third-party database. The information has not otherwise been confirmed by the mortgage loan sellers.
|
|
(2)
|
The most recent financing of the Technology Corners property was previously securitized in the BACM 2006-4 transaction. The most recent financing of the Moffett Towers Building D property was not included in a securitization.
|
|
(3)
|
The most recent financing of the Pine Lakes Ranch property was previously securitized in the JPMCC 2003-CIBC7 transaction. The most recent financing of the Countryside Village of Denver property was previously securitized in the JPMCC 2004-C1 transaction. The most recent financing of the Countryside Village of Longmont property was previously securitized in the JPMCC 2004-CIBC8 transaction.
|
|
(4)
|
The most recent financing of the Ridgecrest Resort Community property was included in the CSMC 2006-C4 transaction. The most recent financings of the Lakeside Village and Maple Corner properties were not included in securitizations.
|
The depositor has filed a registration statement (including the prospectus) with the SEC (SEC File No. 333-193376) for the offering to which this communication relates. Before you invest, you should read the prospectus in the registration statement and other documents the depositor has filed with the SEC for more complete information about the depositor, the issuing trust and this offering. You may get these documents for free by visiting EDGAR on the SEC website at www.sec.gov. Alternatively, the depositor or Deutsche Bank Securities Inc., any other underwriter, or any dealer participating in this offering will arrange to send you the prospectus if you request it by calling toll-free 1-800-503-4611 or by email to the following address: prospectus.cpdg@db.com. The offered certificates referred to in these materials, and the asset pool backing them, are subject to modification or revision (including the possibility that one or more classes of certificates may be split, combined or eliminated at any time prior to issuance or availability of a final prospectus) and are offered on a “when, as and if issued” basis. You understand that, when you are considering the purchase of these certificates, a contract of sale will come into being no sooner than the date on which the relevant class has been priced and we have verified the allocation of certificates to be made to you; any “indications of interest” expressed by you, and any “soft circles” generated by us, will not create binding contractual obligations for you or us.
18
(THIS PAGE INTENTIONALLY LEFT BLANK)
19
|
Sunnyvale, CA 94089
|
Collateral Asset Summary – Loan No. 1
Google and Amazon Office Portfolio
|
Cut-off Date Balance:
Cut-off Date LTV:
U/W NCF DSCR:
U/W NOI Debt Yield:
|
$120,000,000
66.6%
1.40x
9.0%
|

The depositor has filed a registration statement (including the prospectus) with the SEC (SEC File No. 333-193376) for the offering to which this communication relates. Before you invest, you should read the prospectus in the registration statement and other documents the depositor has filed with the SEC for more complete information about the depositor, the issuing trust and this offering. You may get these documents for free by visiting EDGAR on the SEC website at www.sec.gov. Alternatively, the depositor or Deutsche Bank Securities Inc., any other underwriter, or any dealer participating in this offering will arrange to send you the prospectus if you request it by calling toll-free 1-800-503-4611 or by email to the following address: prospectus.cpdg@db.com. The offered certificates referred to in these materials, and the asset pool backing them, are subject to modification or revision (including the possibility that one or more classes of certificates may be split, combined or eliminated at any time prior to issuance or availability of a final prospectus) and are offered on a “when, as and if issued” basis. You understand that, when you are considering the purchase of these certificates, a contract of sale will come into being no sooner than the date on which the relevant class has been priced and we have verified the allocation of certificates to be made to you; any “indications of interest” expressed by you, and any “soft circles” generated by us, will not create binding contractual obligations for you or us.
20
|
Sunnyvale, CA 94089
|
Collateral Asset Summary – Loan No. 1
Google and Amazon Office Portfolio
|
Cut-off Date Balance:
Cut-off Date LTV:
U/W NCF DSCR:
U/W NOI Debt Yield:
|
$120,000,000
66.6%
1.40x
9.0%
|
|
Mortgage Loan Information
|
Property Information
|
||||||
|
Loan Seller:
|
GACC
|
Single Asset / Portfolio:
|
Portfolio of two properties
|
||||
|
Loan Purpose:
|
Refinance
|
Property Type:
|
Suburban Office
|
||||
|
Sponsor:
|
Joseph K. Paul; Jay Paul Revocable
|
Collateral:
|
Fee Simple
|
||||
|
Living Trust
|
Location:
|
Sunnyvale, CA
|
|||||
|
Borrower:
|
MPDB1-4 LLC; MT3D LLC
|
Year Built / Renovated:
|
Various
|
||||
|
Original Balance(1):
|
$120,000,000
|
Total Sq. Ft.:
|
1,057,809
|
||||
|
Cut-off Date Balance(1):
|
$120,000,000
|
Property Management:
|
Paul Holdings, Inc.
|
||||
|
% by Initial UPB:
|
9.7%
|
Underwritten NOI:
|
$40,671,127
|
||||
|
Interest Rate:
|
5.03496%
|
Underwritten NCF:
|
$40,459,565
|
||||
|
Payment Date:
|
6th of each month
|
Appraised Value:
|
$679,000,000
|
||||
|
First Payment Date:
|
February 6, 2014
|
Appraisal Date:
|
December 2, 2013
|
||||
|
Maturity Date:
|
January 6, 2024
|
||||||
|
Amortization(2):
|
Interest only for first 48 months; 360
|
Historical NOI(7)
|
|||||
|
months thereafter
|
Most Recent NOI:
|
NAV
|
|||||
|
Additional Debt(1):
|
$332,200,000 Pari Passu Debt;
|
2012 NOI:
|
NAV
|
||||
|
$67,800,000 Mezzanine Loan
|
2011 NOI:
|
NAV
|
|||||
|
Call Protection(3):
|
L(26), YM1(90), O(4)
|
2010 NOI:
|
NAV
|
||||
|
Lockbox / Cash Management:
|
Hard / In Place
|
2009 NOI:
|
NAV
|
||||
|
2008 NOI:
|
NAV
|
||||||
|
Reserves(4)
|
|||||||
|
Initial
|
Monthly
|
Historical Occupancy(7)
|
|||||
|
Taxes:
|
$0
|
$172,473
|
Current Occupancy:
|
100.0% (March 6, 2014)
|
|||
|
Insurance:
|
$0
|
Springing
|
2012 Occupancy:
|
NAV
|
|||
|
Replacement:
|
$0
|
$17,630
|
2011 Occupancy:
|
NAV
|
|||
|
TI/LC:
|
$31,289,848
|
$0
|
2010 Occupancy:
|
NAV
|
|||
|
Lease Sweep:
|
$0
|
Springing
|
2009 Occupancy:
|
NAV
|
|||
|
2008 Occupancy:
|
NAV
|
||||||
|
Financial Information
|
(1) The Original Balance and Cut-off Date Balance of $120.0 million represent the non-controlling Note A-3 of the $452.2 million Google and Amazon Office Portfolio Loan Combination evidenced by four pari passu notes. The pari passu companion loans are comprised of the controlling Note A-1, with an original principal balance of $155.0 million, which was included in the COMM 2014-CCRE14 transaction, the non-controlling Note A-2, with original principal balance of $110.0 million, which was included in the COMM 2014-CCRE15 transaction and the non-controlling Note A-4, with original principal balance of $67.2 million. For additional information on the pari passu companion loans, see “The Loan” herein. For additional information on the mezzanine loan, see “Current Mezzanine or Subordinate Indebtedness” herein.
(2) Following an initial 48-month interest only period from the first payment date, the Google and Amazon Office Portfolio Loan Combination is structured with a fixed amortization schedule based on a 360-month amortization period for the mortgage loan, together with the related mezzanine loan. See Annex H-1 of the Free Writing Prospectus.
(3) The lockout period will be at least 26 payments beginning with and including the first payment date of February 6, 2014. Prepayment of the full $452.2 million Google and Amazon Office Portfolio Loan Combination is permitted after the date that is the earlier to occur of (i) two years after the closing date of the securitization that includes the last pari passu companion loan and (ii) February 6, 2017. Partial release is permitted. See “Partial Release” herein.
(4) See “Lockbox / Cash Management”, “Initial Reserves” and “Ongoing Reserves” herein.
(5) DSCR, LTV, Debt Yield and Balance / Sq. Ft. calculations are based on the aggregate Google and Amazon Office Portfolio Loan Combination.
(6) Based on amortizing debt service payments. Based on the current interest only payments, the Underwritten NOI DSCR and Underwritten NCF DSCR are 1.76x and 1.75x, respectively for the mortgage loan and 1.43x and 1.42x, respectively, for the total debt.
(7) The Technology Corners Property was previously 100.0% leased by Ariba, which vacated in 2013. The Technology Corners Property was subsequently leased by Google and has been undergoing substantial renovations prior to Google taking occupancy of the Technology Corners Property. The Moffett Towers Building D Property was constructed in 2013 and pre-leased by Amazon during construction.
|
||||||
|
Mortgage
|
Total
|
||||||
|
Loan(5)
|
Debt
|
||||||
|
Cut-off Date Balance / Sq. Ft.:
|
$427
|
$492
|
|||||
|
Balloon Balance / Sq. Ft.:
|
$389
|
$448
|
|||||
|
Cut-off Date LTV:
|
66.6%
|
76.6%
|
|||||
|
Balloon LTV:
|
60.6%
|
69.7%
|
|||||
|
Underwritten NOI DSCR(6):
|
1.41x
|
1.16x
|
|||||
|
Underwritten NCF DSCR(6):
|
1.40x
|
1.15x
|
|||||
|
Underwritten NOI Debt Yield:
|
9.0%
|
7.8%
|
|||||
|
Underwritten NCF Debt Yield:
|
8.9%
|
7.8%
|
|||||
|
Underwritten NOI Debt Yield at Balloon:
|
9.9%
|
8.6%
|
|||||
|
Underwritten NCF Debt Yield at Balloon:
|
9.8%
|
8.5%
|
|||||
The depositor has filed a registration statement (including the prospectus) with the SEC (SEC File No. 333-193376) for the offering to which this communication relates. Before you invest, you should read the prospectus in the registration statement and other documents the depositor has filed with the SEC for more complete information about the depositor, the issuing trust and this offering. You may get these documents for free by visiting EDGAR on the SEC website at www.sec.gov. Alternatively, the depositor or Deutsche Bank Securities Inc., any other underwriter, or any dealer participating in this offering will arrange to send you the prospectus if you request it by calling toll-free 1-800-503-4611 or by email to the following address: prospectus.cpdg@db.com. The offered certificates referred to in these materials, and the asset pool backing them, are subject to modification or revision (including the possibility that one or more classes of certificates may be split, combined or eliminated at any time prior to issuance or availability of a final prospectus) and are offered on a “when, as and if issued” basis. You understand that, when you are considering the purchase of these certificates, a contract of sale will come into being no sooner than the date on which the relevant class has been priced and we have verified the allocation of certificates to be made to you; any “indications of interest” expressed by you, and any “soft circles” generated by us, will not create binding contractual obligations for you or us.
21
|
Sunnyvale, CA 94089
|
Collateral Asset Summary – Loan No. 1
Google and Amazon Office Portfolio
|
Cut-off Date Balance:
Cut-off Date LTV:
U/W NCF DSCR:
U/W NOI Debt Yield:
|
$120,000,000
66.6%
1.40x
9.0%
|
|
Property Summary
|
|||||||
|
Property Name
|
Location
|
Tenant
|
Sq. Ft.
|
Year Built / Renovated
|
Allocated Loan Amount
|
Appraised Value
|
Occupancy(1)
|
|
Technology Corners Property
|
Sunnyvale, CA
|
Google
|
700,328(2)
|
2001 / 2013
|
$77,307,692
|
$438,000,000
|
100.0%
|
|
Moffett Towers Building D Property
|
Sunnyvale, CA
|
Amazon
|
357,481
|
2013 / NAP
|
$42,692,308
|
$241,000,000
|
100.0%
|
|
Total / Wtd. Avg.
|
1,057,809
|
$120,000,000
|
$679,000,000
|
100.0%
|
|||
|
(1)
|
Based on a rent roll dated March 6, 2014.
|
|
(2)
|
Google leases 175,082 sq. ft. at 803 11th Avenue, 175,082 sq. ft. at 805 11th Avenue, 175,082 sq. ft. at 807 11th Avenue, and 175,082 sq. ft. at 809 11th Avenue under four separate coterminous leases.
|
|
Tenant Summary
|
||||||||
|
Tenant
|
Ratings
(Fitch/Moody’s/S&P)(1)
|
Net Rentable
Area (Sq. Ft.)
|
% of Net
Rentable Area
|
U/W Base
Rent PSF
|
% of Total
U/W Base Rent
|
Lease
Expiration
|
||
|
Google
|
NR/Aa2/AA
|
700,328
|
66.2%
|
$32.40
|
63.1%
|
9/30/2024(2)
|
||
|
Amazon(3)(4)
|
NR/Baa1/AA-
|
357,481
|
33.8%
|
$37.08
|
36.9%
|
2/29/2024(5)
|
||
|
Total Occupied Collateral
|
1,057,809
|
100.0%
|
$33.98
|
100.0%
|
||||
|
Vacant
|
0
|
0.0%
|
||||||
|
Total Collateral
|
1,057,809
|
100.0%
|
||||||
|
(1)
|
Certain ratings are those of the parent company whether or not the parent company guarantees the lease.
|
|
(2)
|
Google has no early termination options and has one seven-year renewal option with nine months prior notice at 95% of fair market rent.
|
|
(3)
|
Amazon’s base rent commenced March 1, 2014. At closing, $2,209,233 was reserved for the two remaining months of abated rent due to Amazon under its lease.
|
|
(4)
|
This space is leased by A2Z Development Center, Inc., a subsidiary of Amazon. Amazon provided a parent guaranty of this lease.
|
|
(5)
|
Amazon has no early termination options and has two seven-year renewal options with nine months prior notice at 100% of fair market rent.
|
|
Lease Rollover Schedule
|
||||||||
|
Year
|
# of
Leases
Expiring
|
Total
Expiring
Sq. Ft.
|
% of Total Sq.
Ft. Expiring
|
Cumulative
Sq. Ft.
Expiring
|
Cumulative % of
Sq. Ft. Expiring
|
Annual U/W Base Rent
Per Sq. Ft.
|
% U/W Base Rent
Rolling
|
Cumulative %
of U/W
Base Rent
|
|
MTM
|
0
|
0
|
0.0%
|
0
|
0.0%
|
$0.00
|
0.0%
|
0.0%
|
|
2014
|
0
|
0
|
0.0%
|
0
|
0.0%
|
$0.00
|
0.0%
|
0.0%
|
|
2015
|
0
|
0
|
0.0%
|
0
|
0.0%
|
$0.00
|
0.0%
|
0.0%
|
|
2016
|
0
|
0
|
0.0%
|
0
|
0.0%
|
$0.00
|
0.0%
|
0.0%
|
|
2017
|
0
|
0
|
0.0%
|
0
|
0.0%
|
$0.00
|
0.0%
|
0.0%
|
|
2018
|
0
|
0
|
0.0%
|
0
|
0.0%
|
$0.00
|
0.0%
|
0.0%
|
|
2019
|
0
|
0
|
0.0%
|
0
|
0.0%
|
$0.00
|
0.0%
|
0.0%
|
|
2020
|
0
|
0
|
0.0%
|
0
|
0.0%
|
$0.00
|
0.0%
|
0.0%
|
|
2021
|
0
|
0
|
0.0%
|
0
|
0.0%
|
$0.00
|
0.0%
|
0.0%
|
|
2022
|
0
|
0
|
0.0%
|
0
|
0.0%
|
$0.00
|
0.0%
|
0.0%
|
|
2023
|
0
|
0
|
0.0%
|
0
|
0.0%
|
$0.00
|
0.0%
|
0.0%
|
|
2024
|
5
|
1,057,809
|
100.0%
|
1,057,809
|
100.0%
|
$33.98
|
100.0%
|
100.0%
|
|
Thereafter
|
0
|
0
|
0.0%
|
1,057,809
|
100.0%
|
$0.00
|
0.0%
|
100.0%
|
|
Vacant
|
NAP
|
0
|
0.0%
|
1,057,809
|
100.0%
|
NAP
|
NAP
|
|
|
Total / Wtd. Avg.
|
5
|
1,057,809
|
100.0%
|
$33.98
|
100.0%
|
|||
The depositor has filed a registration statement (including the prospectus) with the SEC (SEC File No. 333-193376) for the offering to which this communication relates. Before you invest, you should read the prospectus in the registration statement and other documents the depositor has filed with the SEC for more complete information about the depositor, the issuing trust and this offering. You may get these documents for free by visiting EDGAR on the SEC website at www.sec.gov. Alternatively, the depositor or Deutsche Bank Securities Inc., any other underwriter, or any dealer participating in this offering will arrange to send you the prospectus if you request it by calling toll-free 1-800-503-4611 or by email to the following address: prospectus.cpdg@db.com. The offered certificates referred to in these materials, and the asset pool backing them, are subject to modification or revision (including the possibility that one or more classes of certificates may be split, combined or eliminated at any time prior to issuance or availability of a final prospectus) and are offered on a “when, as and if issued” basis. You understand that, when you are considering the purchase of these certificates, a contract of sale will come into being no sooner than the date on which the relevant class has been priced and we have verified the allocation of certificates to be made to you; any “indications of interest” expressed by you, and any “soft circles” generated by us, will not create binding contractual obligations for you or us.
22
|
Sunnyvale, CA 94089
|
Collateral Asset Summary – Loan No. 1
Google and Amazon Office Portfolio
|
Cut-off Date Balance:
Cut-off Date LTV:
U/W NCF DSCR:
U/W NOI Debt Yield:
|
$120,000,000
66.6%
1.40x
9.0%
|
The Loan. The Google and Amazon Office Portfolio loan (the “Google and Amazon Office Portfolio Loan”) consists of the non-controlling Note A-3 in the original principal amount of $120.0 million of a fixed rate loan in the aggregate principal amount of $452.2 million (the “Google and Amazon Office Portfolio Loan Combination”). The Google and Amazon Office Portfolio Loan Combination is secured by the borrowers’ fee simple interest in a four building, Class A suburban office park containing 700,328 sq. ft. in the aggregate located at 803, 805, 807 and 809 11th Avenue in Sunnyvale, California (the “Technology Corners Property”) and the borrowers’ fee simple interest in a 357,481 sq. ft. Class A suburban office building located at 1100 Enterprise Way in the Moffett Towers Office Park (the “Moffett Towers Building D Property”, together with the Technology Corners Property, the “Google and Amazon Office Portfolio Properties”). The $452.2 million Google and Amazon Office Portfolio Loan Combination is evidenced by four pari passu notes. Only the non-controlling Note A-3, with an original principal balance of $120.0 million, will be included in the COMM 2014-UBS2 mortgage trust. The controlling Note A-1, with an original principal balance of $155.0 million, was included in the COMM 2014-CCRE14 transaction and the non-controlling Note A-2, with an original principal balance of $110.0 million, was included in the COMM 2014-CCRE15 transaction. The non-controlling Note A-4, with an original principal balance of $67.2 million is expected to be contributed to a future securitization. GACC has reserved the right to further split Note A-4 into multiple notes. The Google and Amazon Office Portfolio Loan Combination has a 10-year term and amortizes on a fixed schedule, after an initial four-year interest only period. The fixed schedule results in a 360-month effective amortization period.
The Google and Amazon Office Portfolio Loan accrues interest at a fixed rate equal to 5.03496% and has a cut-off date balance of $120.0 million. The proceeds of the Google and Amazon Office Portfolio Loan Combination, along with a $67.8 million mezzanine loan funded concurrently, were used to retire existing debt of approximately $338.3 million, fund upfront reserves of approximately $33.5 million, pay closing costs of approximately $2.8 million and return approximately $145.4 million of equity to the sponsors. Based on the appraised value of $679.0 million as of December 2, 2013, the cut-off date LTV ratio of the Google and Amazon Office Portfolio Loan Combination is 66.6%. Including the $67.8 million of mezzanine debt, the remaining implied equity is $159.0 million. The most recent prior financing of the Technology Corners Property was included in the BACM 2006-4 mortgage trust. The most recent prior financing of the Moffett Towers Building D Property was not included in a securitization.
The relationship between the holders of Note A-1, Note A-2, Note A-3 and Note A-4 is governed by an intercreditor agreement which is described under “Description of the Mortgage Pool―Loan Combinations―The Google and Amazon Office Portfolio Loan Combination” in the Free Writing Prospectus.
|
Pari Passu Note Summary
|
||||
|
|
Original Balance
|
Cut-off Date Balance
|
Note Holder
|
Controlling Piece
|
|
Note A-1
|
$155,000,000
|
$155,000,000
|
COMM 2014-CCRE14
|
Yes
|
|
Note A-2
|
$110,000,000
|
$110,000,000
|
COMM 2014-CCRE15
|
No
|
|
Note A-3
|
$120,000,000
|
$120,000,000
|
COMM 2014-UBS2
|
No
|
|
Note A-4
|
$67,200,000
|
$67,200,000
|
GACC
|
No
|
|
Total
|
$452,200,000
|
$452,200,000
|
||
|
Sources and Uses
|
|||||||
|
Sources
|
Proceeds
|
% of Total
|
Uses
|
Proceeds
|
% of Total
|
||
|
Loan Amount
|
$452,200,000
|
87.0%
|
Loan Payoff
|
$338,309,831
|
65.1%
|
||
|
Mezzanine Loan
|
$67,800,000
|
13.0%
|
Reserves
|
$33,499,080
|
6.4%
|
||
|
Closing Costs
|
$2,757,087
|
0.5%
|
|||||
|
Return of Equity
|
$145,434,002
|
28.0%
|
|||||
|
Total Sources
|
$520,000,000
|
100.0%
|
Total Uses
|
$520,000,000
|
100.0%
|
||
The Borrower / Sponsor. The borrowers, MPDB1-4 LLC (the “Technology Corners Borrower”) and MT3D LLC (the “Moffett Towers Building D Borrower”), are each single purpose Delaware limited liability companies structured to be bankruptcy-remote, with two independent directors in their organizational structures. MPDB1-4 LLC is the borrowing entity for the Technology Corners Property and MT3D LLC is the borrowing entity for the Moffett Towers Building D Property. The sponsors of the borrowers and the nonrecourse carve-out guarantors are Joseph K. Paul (“Jay Paul”) and the Jay Paul Revocable Living Trust, on a joint and several basis.
Founded by Jay Paul in 1975, the Jay Paul Company is headquartered in San Francisco, California and focuses on the development, acquisition and management of commercial properties in California. Jay Paul Company has developed and acquired in excess of eight million sq. ft. of real estate, with an additional six million sq. ft. of space in its development pipeline, and has closed in excess of $2.5 billion worth of equity and debt financing since 2000. In addition, the Jay Paul Company has over five million sq. ft. of LEED Certified Gold office space throughout its portfolio.
The depositor has filed a registration statement (including the prospectus) with the SEC (SEC File No. 333-193376) for the offering to which this communication relates. Before you invest, you should read the prospectus in the registration statement and other documents the depositor has filed with the SEC for more complete information about the depositor, the issuing trust and this offering. You may get these documents for free by visiting EDGAR on the SEC website at www.sec.gov. Alternatively, the depositor or Deutsche Bank Securities Inc., any other underwriter, or any dealer participating in this offering will arrange to send you the prospectus if you request it by calling toll-free 1-800-503-4611 or by email to the following address: prospectus.cpdg@db.com. The offered certificates referred to in these materials, and the asset pool backing them, are subject to modification or revision (including the possibility that one or more classes of certificates may be split, combined or eliminated at any time prior to issuance or availability of a final prospectus) and are offered on a “when, as and if issued” basis. You understand that, when you are considering the purchase of these certificates, a contract of sale will come into being no sooner than the date on which the relevant class has been priced and we have verified the allocation of certificates to be made to you; any “indications of interest” expressed by you, and any “soft circles” generated by us, will not create binding contractual obligations for you or us.
23
|
Sunnyvale, CA 94089
|
Collateral Asset Summary – Loan No. 1
Google and Amazon Office Portfolio
|
Cut-off Date Balance:
Cut-off Date LTV:
U/W NCF DSCR:
U/W NOI Debt Yield:
|
$120,000,000
66.6%
1.40x
9.0%
|
The Properties. The Google and Amazon Office Portfolio Properties consist of five Class A suburban office buildings totaling 1,057,809 sq. ft., located in Sunnyvale, California. The Google and Amazon Office Portfolio Properties are located in the Moffett Park area of Sunnyvale, immediately north of the intersection of US Highway 101 and State Highway 237, and benefit from access to several bus stops in the immediate area and the Santa Clara Light Rail station located along Moffett Park Drive. As of March 6, 2014, the Google and Amazon Office Portfolio Properties are 100.0% occupied by two credit rated tenants.
The Technology Corners Property consists of four, four-story Class A suburban office buildings totaling 700,328 sq. ft., which are part of a larger approximately 949,000 sq. ft., six-building office campus (known generally as “Technology Corners”). The campus includes a two-story, 15,660 sq. ft. amenities building, which was originally built-out as a fitness center for the previous tenant, as well as a fifth office building under construction which will contain 232,248 sq. ft. of rentable space, which is expected to be completed in March 2014. There are currently 2,360 garage and surface parking spaces for a ratio of 3.37 per 1,000 sq. ft. based on the existing 700,328 sq. ft. A second parking garage is under construction concurrently with the fifth office building, which will increase the number of parking spaces to 2,767, for a ratio of 2.97 per 1,000 sq. ft. for the entire office campus. Google leases all five of the office buildings at Technology Corners under five separate leases. The amenities building, parking garages and fifth office building under construction do not serve as collateral for the Google and Amazon Office Portfolio Loan Combination. The Technology Corners Borrower has the right to use the common areas, including the separate parking structures, pursuant to recorded REAs that run with the land.
The Moffett Towers Building D Property is an eight-story Class A LEED Certified Gold suburban office building totaling 357,481 sq. ft., which is part of a larger 1.99 million sq. ft. campus which spans 52 acres and seven office buildings (known generally as “Moffett Towers”) and includes an amenities building which is occupied by the Moffett Towers Club. The Moffett Towers Club is a full-service, 48,000 sq. ft. health and wellness club which is open exclusively to the tenants of Moffett Towers and includes a fitness center, pool, basketball court, spa and café and is not collateral for the Google and Amazon Office Portfolio Loan Combination. There are two separate parking garages and surface parking for a total of 1,180 parking spaces allocated to the Moffett Towers Building D Property for a ratio of 3.30 spaces per 1,000 sq. ft. The amenities building and parking garages do not serve as collateral for the Google and Amazon Office Portfolio Loan Combination. The Moffett Towers Building D Borrower has the right to use the common areas, including the separate parking structures, pursuant to recorded REAs that run with the land.
Environmental Matters. The Phase I environmental reports dated November 17, 2013 and November 19, 2013 recommended no further action at the Technology Corners Property or the Moffett Towers Building D Property.
Tenants.
Google (700,328 sq. ft., 66.2% of NRA, 63.1% of U/W Base Rent). Google (NASDAQ: GOOG), rated NR/Aa2/AA by Fitch/Moody’s/S&P, is a global technology company specializing in internet-related services and products, including search, cloud computing, software and online advertising technologies. The California-based company provides its products and services in more than 100 languages and in more than 50 countries, regions, and territories. Google was founded by Sergey Brin and Lawrence E. Page on September 4, 1998 and is headquartered in Mountain View, California, less than five miles from the Technology Corners Property. Since first going public in August 2004, Google has grown to a market capitalization of approximately $370.6 billion as of December 2013.
Google’s lease commenced in April 2013 at the Technology Corners Property and expires September 2024. Rent commenced in November 1, 2013. Although all 700,328 sq. ft. at the Technology Corners Property is leased to Google, the company is still completing tenant improvements and is expected to take occupancy by July 2014. Currently, Google is subleasing the third floor of 807 11th Avenue to Motorola Mobility, Inc., an affiliate of Google. Google has one seven-year option to renew at 95% of fair market value with a minimum of nine months prior notice and has no termination options. At closing, the borrowers reserved approximately $7.2 million ($10.22 PSF) for tenant improvements related to Google’s space and Google is investing a reported additional $150 million to complete a gut renovation of the interior and major enhancement of the common area space, including the amenities building. Google is awaiting delivery of Technology Corners Building 6 (“Building 6”), a five-story building that will contain an additional 232,248 sq. ft. that is set for completion in 2014 and is not included in the Google and Amazon Office Portfolio Loan Combination collateral. The addition of this space will increase Google’s total presence at Technology Corners to 932,576 sq. ft.
Amazon (357,481 sq. ft., 33.8% of NRA, 36.9% of U/W Base Rent). Amazon.com, Inc. (“Amazon”) (NASDAQ: AMZN), rated NR/Baa1/AA- by Fitch/Moody’s/S&P, began as an online bookstore in 1995. Today, the website has expanded to offer not only books but also movies, games, music, electronics and other general merchandise categories such as apparel and accessories, auto parts, home furnishings, health and beauty aids, toys and groceries. Amazon was founded by Jeff Bezos, who still serves as the company’s chairman and CEO and owns nearly 20% of the company. Net sales increased 27.1% year over year from approximately $48.1 billion in 2011 to $61.1 billion in 2012.
The depositor has filed a registration statement (including the prospectus) with the SEC (SEC File No. 333-193376) for the offering to which this communication relates. Before you invest, you should read the prospectus in the registration statement and other documents the depositor has filed with the SEC for more complete information about the depositor, the issuing trust and this offering. You may get these documents for free by visiting EDGAR on the SEC website at www.sec.gov. Alternatively, the depositor or Deutsche Bank Securities Inc., any other underwriter, or any dealer participating in this offering will arrange to send you the prospectus if you request it by calling toll-free 1-800-503-4611 or by email to the following address: prospectus.cpdg@db.com. The offered certificates referred to in these materials, and the asset pool backing them, are subject to modification or revision (including the possibility that one or more classes of certificates may be split, combined or eliminated at any time prior to issuance or availability of a final prospectus) and are offered on a “when, as and if issued” basis. You understand that, when you are considering the purchase of these certificates, a contract of sale will come into being no sooner than the date on which the relevant class has been priced and we have verified the allocation of certificates to be made to you; any “indications of interest” expressed by you, and any “soft circles” generated by us, will not create binding contractual obligations for you or us.
24
|
Sunnyvale, CA 94089
|
Collateral Asset Summary – Loan No. 1
Google and Amazon Office Portfolio
|
Cut-off Date Balance:
Cut-off Date LTV:
U/W NCF DSCR:
U/W NOI Debt Yield:
|
$120,000,000
66.6%
1.40x
9.0%
|
A2Z Development Center, Inc. (“A2Z”) is a wholly owned subsidiary of Amazon and leases all 357,481 sq. ft. of office space of the Moffett Towers Building D Property as well as 224,492 sq. ft. at the adjacent 1120 Enterprise Way property (not part of the collateral). Amazon.com, Inc. provided a parent guaranty for this lease. The company is responsible for a number of Amazon’s products and services and uses its space at the Moffett Towers Building D Property for design and product development for the Kindle e-reader. A2Z’s lease commenced in October 2013 and expires in February 2024. Base rent was abated for the first five months of the initial lease term, which remaining amount was fully reserved for at the closing of the Google and Amazon Office Portfolio Loan Combination. Payment of base rent commences on March 1, 2014. A2Z has two seven-year options to renew at 100% of the fair market rent with a minimum of nine months prior notice and has no early termination options. At closing, the borrowers reserved approximately $24.1 million ($67.50 PSF) for tenant improvements related to Amazon’s space and Amazon is investing a reported additional $21.5 million ($60.14 PSF). Amazon is expected to complete its tenant improvements and build-out of floors three through eight in March 2014, followed by the lab space on floors one and two and cafeteria in June 2014. Amazon is expected to take full occupancy in June 2014.
The Market. The Google and Amazon Office Portfolio Properties are located in the Silicon Valley office market, which has experienced significant growth in recent years led by the expansion of social media, gaming and software industries and the presence of large high-tech companies such as Apple and Google. Leasing activity increased in the third quarter of 2013, exceeding the square footage leased in both the first and second quarters combined, on par with elevated levels during the third and fourth quarters of 2012, with approximately 2.3 million sq. ft. leased in the third quarter of 2013. Among these transactions were the new leases by Google totaling 932,576 sq. ft. at Technology Corners, which has also recently continued its expansion into neighboring Palo Alto and Sunnyvale.
The Silicon Valley office market totals over 48.0 million sq. ft. of office space and is comprised of 13 submarkets, located predominantly in Santa Clara County, including the Newark and Fremont submarkets in southern Alameda County. The Silicon Valley average household income is $122,434, which is 76.0% above the US average, with a percentage of households in the $100,000 and above range of 43.5% versus the national average of 19.5%. Additionally, approximately 45.0% of the Silicon Valley’s population has a bachelor’s or advanced degree, compared to just 28.0% nationwide. The Technology Corners Property and Moffett Towers Building D Property are located in the Sunnyvale submarket close to Mountain View. The Sunnyvale submarket has over 7.0 million sq. ft. of office inventory as of Q3 2013.
Across the entire Silicon Valley office market, there were occupancy gains during the third quarter of 2013, bringing year-to-date overall net absorption to approximately 956,000 sq. ft. For the Silicon Valley office market, direct vacancy rates continued to decline to 11.8%, 0.2% less than a year ago. In the Sunnyvale submarket, the overall vacancy rate dropped to 5.6% in Q3 2013 from 6.3% in the prior quarter. In the Silicon Valley office market, new construction of approximately 1.1 million sq. ft. has been completed through Q3 2013, with an additional 3.2 million sq. ft. underway. Three new projects broke ground during Q3 2013 and another 10 projects are expected to begin construction in the next two quarters. The Sunnyvale submarket has had 100,000 sq. ft. of new construction delivered through Q3 2013, with over 1.4 million sq. ft. under construction as of Q3 2013.
In the Silicon Valley office market, overall average annual asking rents increased 5.2% during the past quarter to $36.72 PSF, and 8.5% over the past year. Class A average asking rental rates increased 4.1% during the quarter to $36.36 PSF, the highest rate recorded since 2001. The average annual asking rents in the Sunnyvale submarket rose for the third consecutive quarter to $45.36 PSF, up from $45.00 PSF in Q2 2013. The appraiser concluded that the appropriate current market rent for the Technology Corners Property is $3.35 PSF NNN per month ($40.20 PSF NNN per year) and $3.50 PSF NNN per month ($42.00 PSF NNN per year) for the Moffett Towers Building D Property.
The depositor has filed a registration statement (including the prospectus) with the SEC (SEC File No. 333-193376) for the offering to which this communication relates. Before you invest, you should read the prospectus in the registration statement and other documents the depositor has filed with the SEC for more complete information about the depositor, the issuing trust and this offering. You may get these documents for free by visiting EDGAR on the SEC website at www.sec.gov. Alternatively, the depositor or Deutsche Bank Securities Inc., any other underwriter, or any dealer participating in this offering will arrange to send you the prospectus if you request it by calling toll-free 1-800-503-4611 or by email to the following address: prospectus.cpdg@db.com. The offered certificates referred to in these materials, and the asset pool backing them, are subject to modification or revision (including the possibility that one or more classes of certificates may be split, combined or eliminated at any time prior to issuance or availability of a final prospectus) and are offered on a “when, as and if issued” basis. You understand that, when you are considering the purchase of these certificates, a contract of sale will come into being no sooner than the date on which the relevant class has been priced and we have verified the allocation of certificates to be made to you; any “indications of interest” expressed by you, and any “soft circles” generated by us, will not create binding contractual obligations for you or us.
25
|
Sunnyvale, CA 94089
|
Collateral Asset Summary – Loan No. 1
Google and Amazon Office Portfolio
|
Cut-off Date Balance:
Cut-off Date LTV:
U/W NCF DSCR:
U/W NOI Debt Yield:
|
$120,000,000
66.6%
1.40x
9.0%
|
The appraiser identified eight lease comparables, which are presented in the subsequent chart:
|
Lease Comparables(1)
|
|||||||||
|
Property
|
Tenant
|
Location (CA)
|
Year Built
|
Lease Area
(Sq. Ft.)
|
Base Rent PSF (NNN)
|
Lease Term
(yrs)
|
|||
|
Technology Corners Property
|
Google
|
Sunnyvale
|
2001
|
700,328
|
$32.40
|
11.5
|
|||
|
Moffett Towers Building D Property
|
Amazon
|
Sunnyvale
|
2013
|
357,481
|
$37.08
|
10.0
|
|||
|
Santa Clara Gateway
|
Global Foundaries
|
Santa Clara
|
2013
|
136,630
|
$39.00
|
7.0
|
|||
|
Moffett Towers I
|
Plaxo
|
Sunnyvale
|
2008
|
30,963
|
$39.00
|
6.5
|
|||
|
Moffett Towers I
|
GoDaddy.com
|
Sunnyvale
|
2008
|
40,521
|
$39.00
|
6.4
|
|||
|
Santa Clara Towers II
|
CA Technologies
|
Santa Clara
|
1998
|
74,471
|
$30.60
|
10.6
|
|||
|
1045-1085 La Avenida Avenue
|
Microsoft Corporation
|
Mountain View
|
2001
|
515,700
|
$40.80
|
12.0
|
|||
|
Technology Corners Building 6
|
Google, Inc.
|
Sunnyvale
|
2014(2)
|
232,248
|
$42.00
|
10.3
|
|||
|
Sunnyvale City Center
|
IMPAC Medical Systems
|
Sunnyvale
|
2002
|
76,015
|
$49.80
|
10.0
|
|||
|
3333 Scott Boulevard
|
Akamai Technologies, Inc.
|
Santa Clara
|
2013
|
80,000
|
$34.20
|
10.0
|
|||
|
(1)
|
Source: Appraisal.
|
|
(2)
|
Property is still under construction but has been pre-leased.
|
Cash Flow Analysis.
|
Cash Flow Analysis
|
|||||
|
U/W
|
U/W PSF
|
||||
|
Base Rent(1)
|
$41,853,110
|
$39.57
|
|||
|
Value of Vacant Space
|
0
|
0.00
|
|||
|
Gross Potential Rent
|
$41,853,110
|
$39.57
|
|||
|
Total Recoveries
|
7,458,875
|
7.05
|
|||
|
Total Other Income
|
847,053
|
0.80
|
|||
|
Less: Vacancy(2)
|
(1,756,434)
|
(1.66)
|
|||
|
Effective Gross Income
|
$48,402,604
|
$45.76
|
|||
|
Total Operating Expenses
|
7,731,477
|
7.31
|
|||
|
Net Operating Income
|
$40,671,127
|
$38.45
|
|||
|
TI/LC
|
0
|
0.00
|
|||
|
Capital Expenditures
|
211,562
|
0.20
|
|||
|
Net Cash Flow
|
$40,459,565
|
$38.25
|
|||
|
Average Annual Rent PSF(3)
|
$39.57
|
||||
|
(1)
|
U/W Base Rent includes $5,907,087 in contractual step rents through November 2014 and the straight line average of step rents through the earlier of the termination option or lease term.
|
|
(2)
|
U/W Vacancy represents 3.5% of gross income.
|
|
(3)
|
Average Annual Rent PSF is based on operating statements and occupancy rates provided by the Google and Amazon Office Portfolio Loan Combination borrowers. The Technology Corners Property was previously 100.0% occupied by Ariba, which vacated in 2013. The Technology Corners Property was subsequently leased by Google and underwent substantial renovations prior to Google taking occupancy of the property. The Moffett Towers Building D Property was constructed in 2013 and pre-leased during construction by A2Z Development Center, Inc., a subsidiary of Amazon.com, Inc; therefore, historical average annual rent PSF figures are not available.
|
Property Management. The Google and Amazon Office Portfolio Properties are managed by Paul Holdings, Inc. d/b/a Jay Paul Company, an affiliate of the borrowers.
Lockbox / Cash Management. The Google and Amazon Office Portfolio Loan Combination is structured with a hard lockbox and in place cash management. The borrowers sent tenant direction letters to all tenants instructing them to deposit all rents and other payments into the lockbox account controlled by the lender. All funds in the lockbox account are swept daily to a cash management account under the control of the lender and disbursed in accordance with the Google and Amazon Office Portfolio Loan Combination documents.
The depositor has filed a registration statement (including the prospectus) with the SEC (SEC File No. 333-193376) for the offering to which this communication relates. Before you invest, you should read the prospectus in the registration statement and other documents the depositor has filed with the SEC for more complete information about the depositor, the issuing trust and this offering. You may get these documents for free by visiting EDGAR on the SEC website at www.sec.gov. Alternatively, the depositor or Deutsche Bank Securities Inc., any other underwriter, or any dealer participating in this offering will arrange to send you the prospectus if you request it by calling toll-free 1-800-503-4611 or by email to the following address: prospectus.cpdg@db.com. The offered certificates referred to in these materials, and the asset pool backing them, are subject to modification or revision (including the possibility that one or more classes of certificates may be split, combined or eliminated at any time prior to issuance or availability of a final prospectus) and are offered on a “when, as and if issued” basis. You understand that, when you are considering the purchase of these certificates, a contract of sale will come into being no sooner than the date on which the relevant class has been priced and we have verified the allocation of certificates to be made to you; any “indications of interest” expressed by you, and any “soft circles” generated by us, will not create binding contractual obligations for you or us.
26
|
Sunnyvale, CA 94089
|
Collateral Asset Summary – Loan No. 1
Google and Amazon Office Portfolio
|
Cut-off Date Balance:
Cut-off Date LTV:
U/W NCF DSCR:
U/W NOI Debt Yield:
|
$120,000,000
66.6%
1.40x
9.0%
|
Additionally, all excess cash will be swept into a lender controlled account (i) upon an event of default, (ii) from and after the second anniversary of the loan closing date, if there exists a Low Debt Service Period (as defined herein), (iii) during the continuance of certain Lease Sweep Periods (as defined herein), or (iv) during the continuance of an event of default under the mezzanine loan.
A “Low Debt Service Period” commences if the DSCR, as determined by lender, is less than 1.20x and ends if the DSCR, as determined by lender, is at least 1.25x for two consecutive quarters.
A “Lease Sweep Period” commences upon the earliest to occur of, among other events, (i) the January 2021 payment date, (ii) the date on which the tenant under a Lease Sweep Lease (as defined herein) surrenders or terminates its Lease Sweep Lease with respect to all or a Material Surrender Portion (as defined herein) of its space prior to the then current expiration date, or the date on which such a tenant notifies the borrower that it is surrendering or terminating its Lease Sweep Lease with respect to all or a Material Surrender Portion of its space, (iii) the date on which a tenant under a Lease Sweep Lease “goes dark” at any of the Google and Amazon Office Portfolio Properties or at substantially all of its premises (unless such tenant is investment grade), (iv) upon the occurrence of an event of default under a Lease Sweep Lease, (v) upon the occurrence of a bankruptcy or insolvency involving the tenant (or its parent) under a Lease Sweep Lease and (vi) the date on which there occurs a casualty at either the Technology Corners Property or at the Moffett Towers Building D Property or at any of the four Technology Corners Property buildings.
A “Lease Sweep Lease” means any of (i) the Amazon lease, (ii) the Google lease for 803 11th Avenue, (iii) the Google lease for 805 11th Avenue, (iv) the Google lease for 807 11th Avenue, (v) the Google lease for 809 11th Avenue or (vi) any lease which is entered into by the borrowers in replacement of any of the Amazon lease or any of the Google leases. A “Material Surrender Portion” means at least 46,000 sq. ft. of space (or if a full floor of space is less than 46,000 sq. ft. of space, a full floor of space) demised under a Lease Sweep Lease.
If a Lease Sweep Period exists, then the borrower is required to deposit into the lease sweep account (i) the Required Minimum Monthly Lease Sweep Deposit Amount (as defined herein) (regardless of whether rents are sufficient to make the payments otherwise required and such Required Minimum Monthly Lease Sweep Deposit Amount) and (ii) in addition, all excess cash, on a monthly basis, but only until the aggregate amounts so swept (inclusive of any lease termination payments, if any) equal the Lease Sweep Reserve Threshold (as defined herein) (or, if the Lease Sweep Period was triggered because space leased to Google at the Technology Corners Property is affected by a casualty, the Google Lease Sweep Threshold (as defined herein)).
“Required Minimum Monthly Lease Sweep Deposit Amount” means, on each monthly payment date during the continuance of a Lease Sweep Period, an amount equal to $897,223. The “Lease Sweep Reserve Threshold” means $28,000,000, which amount is proportionately reduced if the Technology Corners Property, the Moffett Towers Building D Property or one of the buildings at the Technology Corners Property is sold. The “Google Lease Sweep Threshold” means $30.53 per rentable square foot affected by the casualty giving rise to the Lease Sweep Period.
If a Lease Sweep Period exists and the aggregate funds transferred in the lease sweep account (inclusive of any lease termination payments) equals the Lease Sweep Reserve Threshold (or, if the Lease Sweep Period was triggered because space leased to Google at the Technology Corners Property is affected by a casualty, the Google Lease Sweep Threshold), thereafter the borrower is required to deposit the Required Minimum Monthly Lease Sweep Deposit and all excess cash into a debt service reserve account up to the Lease Sweep and Debt Service Reserve Cap (as defined herein). However, if the Lease Sweep Period is continuing due to the insolvency of a Lease Sweep Tenant (or its parent) or due to a casualty, then the Lease Sweep and Debt Service Reserve Cap will not be in effect.
“Lease Sweep and Debt Service Reserve Cap” is $32,300,000, although (i) such amount is proportionately reduced if the Technology Corners Property, the Moffett Towers Building D Property or one of the buildings at the Technology Corners Property is sold and (ii) if the Lease Sweep Period commenced because of the surrender, termination or cancellation of a Material Surrender Portion of (but not the entirety of) the space under a Lease Sweep Lease (or notice is given) prior to its then current expiration date, then, the Lease Sweep and Debt Service Reserve Cap with respect to the affected space will be equal to $30.00 times the number of sq. ft. of space that has been (or is to be) surrendered, terminated or cancelled.
Initial Reserves. At closing, the borrowers deposited (i) $31,289,848 into the TI/LC reserve account, $24,129,968 of which was reserved for outstanding tenant improvements and leasing commissions related to Amazon and $7,159,880 of which was reserved for outstanding tenant improvements related to Google and (ii) $2,209,233 into a free rent reserve account for outstanding free rent related to Amazon, which reserve has since been fully released.
Ongoing Reserves. On a monthly basis, the borrowers are required to deposit reserves of (i) 1/12 of the estimated annual real estate taxes, which currently equates to $172,473, into a tax reserve account and (ii) $17,630 into a capital expenditure account. The borrower will be required to deposit 1/12 of the annual insurance premiums into the insurance reserve if an acceptable blanket insurance policy is no longer in place.
The depositor has filed a registration statement (including the prospectus) with the SEC (SEC File No. 333-193376) for the offering to which this communication relates. Before you invest, you should read the prospectus in the registration statement and other documents the depositor has filed with the SEC for more complete information about the depositor, the issuing trust and this offering. You may get these documents for free by visiting EDGAR on the SEC website at www.sec.gov. Alternatively, the depositor or Deutsche Bank Securities Inc., any other underwriter, or any dealer participating in this offering will arrange to send you the prospectus if you request it by calling toll-free 1-800-503-4611 or by email to the following address: prospectus.cpdg@db.com. The offered certificates referred to in these materials, and the asset pool backing them, are subject to modification or revision (including the possibility that one or more classes of certificates may be split, combined or eliminated at any time prior to issuance or availability of a final prospectus) and are offered on a “when, as and if issued” basis. You understand that, when you are considering the purchase of these certificates, a contract of sale will come into being no sooner than the date on which the relevant class has been priced and we have verified the allocation of certificates to be made to you; any “indications of interest” expressed by you, and any “soft circles” generated by us, will not create binding contractual obligations for you or us.
27
|
Sunnyvale, CA 94089
|
Collateral Asset Summary – Loan No. 1
Google and Amazon Office Portfolio
|
Cut-off Date Balance:
Cut-off Date LTV:
U/W NCF DSCR:
U/W NOI Debt Yield:
|
$120,000,000
66.6%
1.40x
9.0%
|
Current Mezzanine or Subordinate Indebtedness. A $67,800,000 mezzanine loan was funded at closing. The mezzanine loan is coterminous with the Google and Amazon Office Portfolio Loan Combination and accrues interest at a rate of 7.8500% per annum. The mezzanine loan has a 10-year term and after a four-year interest only period, amortizes on a fixed schedule, which results in a 360-month effective amortization period. The mezzanine loan is held by Hanwha U.S. Mezzanine Investment SCA, LLC.
Future Mezzanine or Subordinate Indebtedness Permitted. None.
Partial Release. After the prepayment lockout expiration date, which is the earlier to occur of (i) two years after the closing date of the securitization which includes the last pari passu note to be securitized and (ii) February 6, 2017, the applicable borrower may in conjunction with an arm’s length sale to an unrelated third party sale obtain the release of (A) the Moffett Towers Building D Property, (B) the entirety of the Technology Corners Property or (C) one of the four buildings at the Technology Corners Property (a “Parcel Release”), provided, among other conditions set forth in the Google and Amazon Office Portfolio Loan Combination documents, (1) the applicable borrower makes a principal payment equal to the Lender’s Proportionate Share (as defined herein) of (a) if the release is a release of the Moffett Towers Building D Property, 150% of the allocated loan amount for the Moffett Towers Building D Property (as set forth in the Google and Amazon Office Portfolio Loan Combination documents), (b) if the release is a release of the entirety of the Technology Corners Property, 120% of the allocated loan amount for the entirety of the Technology Corners Property (as set forth in the Google and Amazon Office Portfolio Loan Combination documents), and (c) if the release is a Parcel Release, 150% of the allocated loan amount for such building (as set forth in the Google and Amazon Office Portfolio Loan Combination documents); (2) if the property being released is the Technology Corners Property or a Parcel Release, (a) Amazon maintains at the time of such release a credit rating from S&P and Moody’s (with Fitch not currently rating Amazon) that is no more than one rating notch below the respective credit ratings of Amazon from S&P and Moody’s as of the closing date and (b) at the time of the release, there exists no material default under the Amazon lease at the Moffett Towers Building D Property; (3) if the release is a Parcel Release, the Google lease relating to the parcel being released is required to be amended so that it is no longer cross-defaulted with any other Google lease, and the Google leases relating to the remaining parcels (still subject to the lien of the mortgage) is required to be amended so that they are no longer cross-defaulted with any other Google lease or with the Google lease to Building 6; (4) if the release is a Parcel Release, (a) Google maintains at the time of such release a credit rating from S&P and Moody’s (with Fitch not currently rating Google) that is no more than one rating notch below the respective credit ratings of Google from S&P and Moody’s as of the closing date, and (b) there exists no material default under the Google lease at the portions of the Technology Corners Property remaining subject to the lien of the mortgage; (5) if the property being released is the Moffett Towers Building D Property (a) Google maintains at the time of such release a credit rating from S&P and Moody’s (with Fitch not currently rating Google) that is no more than one rating notch below the respective credit ratings of Google from S&P and Moody’s as of the closing date and (b) at the time of the release, there exists no material default under any Google lease at the Technology Corners Property; (6) if, after the release and prepayment described above, the LTV ratio of the properties remaining subject to the lien of the Google and Amazon Office Portfolio Loan Combination documents (as determined by lender) is greater than 125%, the principal balance of the Loan must be paid down by an amount such that the LTV ratio is no more than 125% immediately after such release; (7) the DSCR after giving effect to such release is no less than the greater of (a) 1.20x and (b) the aggregate DSCR immediately prior to such sale; (8) the LTV ratio after giving effect to such release is no more than the lesser of (a) 76.6% and (b) the aggregate LTV ratio immediately prior to such release; (9) adequate funds as determined by lender in its reasonable discretion have been escrowed with lender to cover any potential shortfalls in the lease sweep reserve amounts required to be collected from the cash flow from the remaining properties; and (10) no event of default under the Google and Amazon Office Portfolio Loan Combination documents has occurred and is continuing.
In no event can more than one office building at the Technology Corners Property be released from the collateral (unless the entirety of the Technology Corners Property is released) and, in addition, in no event can any sale include a conveyance of all or any portion of the Moffett Towers Building D Property common areas or Technology Corners Property common areas (including the amenities building at each property).
As used herein, the “Lender’s Proportionate Share” means a fraction, the numerator of which is the then outstanding principal balance of the Google and Amazon Office Portfolio Loan Combination and the denominator of which is the aggregate outstanding principal balances of the Google and Amazon Office Portfolio Loan Combination and the mezzanine loan.
Substitution. None permitted.
The depositor has filed a registration statement (including the prospectus) with the SEC (SEC File No. 333-193376) for the offering to which this communication relates. Before you invest, you should read the prospectus in the registration statement and other documents the depositor has filed with the SEC for more complete information about the depositor, the issuing trust and this offering. You may get these documents for free by visiting EDGAR on the SEC website at www.sec.gov. Alternatively, the depositor or Deutsche Bank Securities Inc., any other underwriter, or any dealer participating in this offering will arrange to send you the prospectus if you request it by calling toll-free 1-800-503-4611 or by email to the following address: prospectus.cpdg@db.com. The offered certificates referred to in these materials, and the asset pool backing them, are subject to modification or revision (including the possibility that one or more classes of certificates may be split, combined or eliminated at any time prior to issuance or availability of a final prospectus) and are offered on a “when, as and if issued” basis. You understand that, when you are considering the purchase of these certificates, a contract of sale will come into being no sooner than the date on which the relevant class has been priced and we have verified the allocation of certificates to be made to you; any “indications of interest” expressed by you, and any “soft circles” generated by us, will not create binding contractual obligations for you or us.
28
|
Sunnyvale, CA 94089
|
Collateral Asset Summary – Loan No. 1
Google and Amazon Office Portfolio
|
Cut-off Date Balance:
Cut-off Date LTV:
U/W NCF DSCR:
U/W NOI Debt Yield:
|
$120,000,000
66.6%
1.40x
9.0%
|

The depositor has filed a registration statement (including the prospectus) with the SEC (SEC File No. 333-193376) for the offering to which this communication relates. Before you invest, you should read the prospectus in the registration statement and other documents the depositor has filed with the SEC for more complete information about the depositor, the issuing trust and this offering. You may get these documents for free by visiting EDGAR on the SEC website at www.sec.gov. Alternatively, the depositor or Deutsche Bank Securities Inc., any other underwriter, or any dealer participating in this offering will arrange to send you the prospectus if you request it by calling toll-free 1-800-503-4611 or by email to the following address: prospectus.cpdg@db.com. The offered certificates referred to in these materials, and the asset pool backing them, are subject to modification or revision (including the possibility that one or more classes of certificates may be split, combined or eliminated at any time prior to issuance or availability of a final prospectus) and are offered on a “when, as and if issued” basis. You understand that, when you are considering the purchase of these certificates, a contract of sale will come into being no sooner than the date on which the relevant class has been priced and we have verified the allocation of certificates to be made to you; any “indications of interest” expressed by you, and any “soft circles” generated by us, will not create binding contractual obligations for you or us.
29
|
Sunnyvale, CA 94089
|
Collateral Asset Summary – Loan No. 1
Google and Amazon Office Portfolio
|
Cut-off Date Balance:
Cut-off Date LTV:
U/W NCF DSCR:
U/W NOI Debt Yield:
|
$120,000,000
66.6%
1.40x
9.0%
|
The depositor has filed a registration statement (including the prospectus) with the SEC (SEC File No. 333-193376) for the offering to which this communication relates. Before you invest, you should read the prospectus in the registration statement and other documents the depositor has filed with the SEC for more complete information about the depositor, the issuing trust and this offering. You may get these documents for free by visiting EDGAR on the SEC website at www.sec.gov. Alternatively, the depositor or Deutsche Bank Securities Inc., any other underwriter, or any dealer participating in this offering will arrange to send you the prospectus if you request it by calling toll-free 1-800-503-4611 or by email to the following address: prospectus.cpdg@db.com. The offered certificates referred to in these materials, and the asset pool backing them, are subject to modification or revision (including the possibility that one or more classes of certificates may be split, combined or eliminated at any time prior to issuance or availability of a final prospectus) and are offered on a “when, as and if issued” basis. You understand that, when you are considering the purchase of these certificates, a contract of sale will come into being no sooner than the date on which the relevant class has been priced and we have verified the allocation of certificates to be made to you; any “indications of interest” expressed by you, and any “soft circles” generated by us, will not create binding contractual obligations for you or us.
30
(THIS PAGE INTENTIONALLY LEFT BLANK)
31
|
One Kendall Square
Cambridge, MA 02139
|
Collateral Asset Summary – Loan No. 2
One Kendall Square
|
Cut-off Date Balance:
Cut-off Date LTV:
U/W NCF DSCR:
U/W NOI Debt Yield:
|
$120,000,000
62.3%
1.34x
9.2%
|

The depositor has filed a registration statement (including the prospectus) with the SEC (SEC File No. 333-193376) for the offering to which this communication relates. Before you invest, you should read the prospectus in the registration statement and other documents the depositor has filed with the SEC for more complete information about the depositor, the issuing trust and this offering. You may get these documents for free by visiting EDGAR on the SEC website at www.sec.gov. Alternatively, the depositor or Deutsche Bank Securities Inc., any other underwriter, or any dealer participating in this offering will arrange to send you the prospectus if you request it by calling toll-free 1-800-503-4611 or by email to the following address: prospectus.cpdg@db.com. The offered certificates referred to in these materials, and the asset pool backing them, are subject to modification or revision (including the possibility that one or more classes of certificates may be split, combined or eliminated at any time prior to issuance or availability of a final prospectus) and are offered on a “when, as and if issued” basis. You understand that, when you are considering the purchase of these certificates, a contract of sale will come into being no sooner than the date on which the relevant class has been priced and we have verified the allocation of certificates to be made to you; any “indications of interest” expressed by you, and any “soft circles” generated by us, will not create binding contractual obligations for you or us.
32
|
One Kendall Square
Cambridge, MA 02139
|
Collateral Asset Summary – Loan No. 2
One Kendall Square
|
Cut-off Date Balance:
Cut-off Date LTV:
U/W NCF DSCR:
U/W NOI Debt Yield:
|
$120,000,000
62.3%
1.34x
9.2%
|
|
Mortgage Loan Information
|
Property Information
|
||||||
|
Loan Seller:
|
GACC
|
Single Asset / Portfolio:
|
Single Asset
|
||||
|
Loan Purpose:
|
Acquisition
|
Property Type:
|
Office/Lab/Retail
|
||||
|
Sponsor:
|
DivcoWest Fund IV REIT, LP
|
Collateral:
|
Fee Simple
|
||||
|
Borrower:
|
DWF IV One Kendall, LLC
|
Location:
|
Cambridge, MA
|
||||
|
Original Balance(1):
|
$120,000,000
|
Year Built / Renovated:
|
1887-1994 / 1986, 2007-2013
|
||||
|
Cut-off Date Balance(1):
|
$120,000,000
|
Total Sq. Ft.:
|
610,110
|
||||
|
% by Initial UPB:
|
9.7%
|
Property Management:
|
Divco West Real Estate Services, Inc.
|
||||
|
Interest Rate:
|
4.8200%
|
Underwritten NOI(6):
|
$18,714,340
|
||||
|
Payment Date:
|
6th of each month
|
Underwritten NCF:
|
$17,154,662
|
||||
|
First Payment Date:
|
March 6, 2014
|
Appraised Value:
|
$325,600,000
|
||||
|
Maturity Date:
|
February 6, 2024
|
Appraisal Date:
|
December 9, 2013
|
||||
|
Amortization:
|
Interest only for first 48 months; 360
|
||||||
|
months thereafter
|
Historical NOI(6)
|
||||||
|
Additional Debt(1):
|
$83,000,000 Pari Passu Debt;
|
Most Recent NOI:
|
$13,501,810 (T-12 November 30, 2013)
|
||||
|
Future Mezzanine Debt Permitted
|
2012 NOI:
|
$12,593,841 (December 31, 2012)
|
|||||
|
Call Protection(2):
|
L(25), D(91), O(4)
|
2011 NOI:
|
$10,443,482 (December 31, 2011)
|
||||
|
Lockbox / Cash Management:
|
Hard / In Place
|
2010 NOI:
|
$7,880,812 (December 31, 2010)
|
||||
|
Reserves(3)
|
Historical Occupancy
|
||||||
|
Initial
|
Monthly
|
Current Occupancy(7):
|
93.2% (November 23, 2013)
|
||||
|
Taxes:
|
$1,103,422
|
$275,856
|
2012 Occupancy:
|
86.7% (December 31, 2012)
|
|||
|
Insurance:
|
$0
|
Springing
|
2011 Occupancy:
|
82.9% (December 31, 2011)
|
|||
|
Replacement:
|
$0
|
$12,711
|
2010 Occupancy:
|
73.9% (December 31, 2010)
|
|||
|
TI/LC:
|
$5,137,394
|
$169,814
|
(1) The Original Balance and Cut-off Date Balance of $120.0 Million represent the controlling Note A-1 of the $203.0 million One Kendall Square Loan Combination evidenced by two pari passu notes. The pari passu companion loan is comprised of the non-controlling Note A-2, with an original principal balance of $83.0 million. For additional information on the pari passu companion loan, see “The Loan” herein. For additional information on permitted future indebtedness, see “Future Mezzanine or Subordinate Indebtedness Permitted” herein.
(2) The lockout period will be at least 25 payments beginning with and including the first payment date of March 6, 2014. Defeasance of the full $203.0 million One Kendall Square Loan Combination is permitted after the date that is earlier to occur of (i) two years after the closing date of the securitization that includes the last pari passu companion loan and (ii) January 16, 2017.
(3) See “Initial Reserves” and “Ongoing Reserves” herein.
(4) DSCR, LTV, Debt Yield and Balance / Sq. Ft. calculations are based on the aggregate One Kendall Square Loan Combination.
(5) Based on amortizing debt service payments. Based on the current interest only payments, the Underwritten NOI DSCR and Underwritten NCF DSCR are 1.89x and 1.73x, respectively.
(6) The increase in Underwritten NOI over Historical NOI is due primarily to recent leasing by Akamai Technologies and M.I.T., which have leases that commence in September 2013 and March 2014, respectively, and contribute approximately $3.7 million in underwritten base rent.
(7) Current Occupancy includes Akamai Technologies (51,693 sq. ft., 8.5% of net rentable area), M.I.T. (22,506 sq. ft., 3.7% of net rentable area) and a 3,617 sq. ft. portion of Merrimack, all of which have signed leases but are not yet occupying their space.
|
||||
|
Free Rent:
|
$673,135
|
NAP
|
|||||
|
Required Repairs:
|
$114,713
|
NAP
|
|||||
|
Lease Sweep:
|
$0
|
Springing
|
|||||
|
Financial Information(4)
|
|||||||
|
Cut-off Date Balance / Sq. Ft.:
|
$333
|
||||||
|
Balloon Balance / Sq. Ft.:
|
$300
|
||||||
|
Cut-off Date LTV:
|
62.3%
|
||||||
|
Balloon LTV:
|
56.2%
|
||||||
|
Underwritten NOI DSCR(5):
|
1.46x
|
||||||
|
Underwritten NCF DSCR(5):
|
1.34x
|
||||||
|
Underwritten NOI Debt Yield:
|
9.2%
|
||||||
|
Underwritten NCF Debt Yield:
|
8.5%
|
||||||
|
Underwritten NOI Debt Yield at Balloon:
|
10.2%
|
||||||
|
Underwritten NCF Debt Yield at Balloon:
|
9.4%
|
||||||
The depositor has filed a registration statement (including the prospectus) with the SEC (SEC File No. 333-193376) for the offering to which this communication relates. Before you invest, you should read the prospectus in the registration statement and other documents the depositor has filed with the SEC for more complete information about the depositor, the issuing trust and this offering. You may get these documents for free by visiting EDGAR on the SEC website at www.sec.gov. Alternatively, the depositor or Deutsche Bank Securities Inc., any other underwriter, or any dealer participating in this offering will arrange to send you the prospectus if you request it by calling toll-free 1-800-503-4611 or by email to the following address: prospectus.cpdg@db.com. The offered certificates referred to in these materials, and the asset pool backing them, are subject to modification or revision (including the possibility that one or more classes of certificates may be split, combined or eliminated at any time prior to issuance or availability of a final prospectus) and are offered on a “when, as and if issued” basis. You understand that, when you are considering the purchase of these certificates, a contract of sale will come into being no sooner than the date on which the relevant class has been priced and we have verified the allocation of certificates to be made to you; any “indications of interest” expressed by you, and any “soft circles” generated by us, will not create binding contractual obligations for you or us.
33
|
One Kendall Square
Cambridge, MA 02139
|
Collateral Asset Summary – Loan No. 2
One Kendall Square
|
Cut-off Date Balance:
Cut-off Date LTV:
U/W NCF DSCR:
U/W NOI Debt Yield:
|
$120,000,000
62.3%
1.34x
9.2%
|
|
Tenant Summary
|
|||||||||||||
|
Tenant
|
Type of
Space |
Ratings
(Fitch/Moody’s/S&P) |
Net Rentable
Area (Sq. Ft.)
|
% of Net
Rentable Area
|
U/W Base
Rent PSF
|
% of Total
U/W Base Rent
|
Lease
Expiration
|
||||||
|
Merrimack(1)
|
Lab/Office
|
NR/NR/NR
|
121,704
|
19.9%
|
$40.93
|
22.4%
|
6/30/2019
|
||||||
|
Akamai Technologies(2)
|
Office
|
NR/NR/NR
|
51,693
|
8.5%
|
$49.00
|
11.4%
|
12/31/2019
|
||||||
|
Nine Point Medical(3)
|
Lab
|
NR/NR/NR
|
31,916
|
5.2%
|
$42.24
|
6.1%
|
12/31/2016
|
||||||
|
InVivo(4)
|
Lab/Office
|
NR/NR/NR
|
26,150
|
4.3%
|
$43.80
|
5.1%
|
10/31/2018
|
||||||
|
Abcam Limited(5)
|
Office
|
NR/NR/NR
|
22,925
|
3.8%
|
$34.25
|
3.5%
|
12/31/2016
|
||||||
|
Total Major Tenants
|
254,388
|
41.7%
|
$42.43
|
48.5%
|
|||||||||
|
Remaining Tenants
|
314,027
|
51.5%
|
$36.53
|
51.5%
|
|||||||||
|
Total Occupied Collateral
|
568,415
|
93.2%
|
$39.17
|
100.0%
|
|||||||||
|
Vacant
|
41,695
|
6.8%
|
|||||||||||
|
Total
|
610,110
|
100.0%
|
|||||||||||
|
(1)
|
The 121,704 total Net Rentable Area (Sq. Ft.) for Merrimack includes a 3,617 sq. ft. lease for a space that has not yet been completed. Merrimack is paying full rent on the space and build out is estimated to be complete in early 2014. Merrimack has either (i) one five-year renewal option at market rent upon written notice given no later than March 31, 2018, or (ii) one one-year renewal option at market rent upon written notice given no later than December 31, 2016
|
|
(2)
|
Akamai Technologies is estimated to take occupancy of its space in April 2014 and will commence paying base rent on April 19, 2014. At closing, $652,323 was reserved, representing three months of rent abatements due to Akamai Technologies under its lease. In addition, Akamai Technologies has two five-year renewal options at market rent upon written notice given on or before 15 months prior to the expiration of the then-existing lease term.
|
|
(3)
|
Nine Point Medical has one two-year renewal option at 95% of market rent upon nine months prior written notice.
|
|
(4)
|
InVivo has one five-year renewal option at market rent with 14 months prior written notice.
|
|
(5)
|
Abcam Limited has one three-year renewal option at the greater of market rent or the prior year’s rent with nine months prior written notice.
|
|
Lease Rollover Schedule(1)
|
|||||||||||||||
|
Year
|
# of
Leases
Expiring
|
Total
Expiring
Sq. Ft.
|
% of Total Sq.
Ft. Expiring |
Cumulative
Sq. Ft. Expiring |
Cumulative % of
Sq. Ft. Expiring
|
Annual U/W
Base Rent Per Sq. Ft. |
% U/W
Base Rent Rolling
|
Cumulative %
of U/W
Base Rent
|
|||||||
|
MTM
|
0
|
0
|
0.0%
|
0
|
0.0%
|
$0.00
|
0.0%
|
0.0%
|
|||||||
|
2014
|
33
|
57,465
|
9.4%
|
57,465
|
9.4%
|
$34.55
|
8.9%
|
8.9%
|
|||||||
|
2015
|
17
|
96,027
|
15.7%
|
153,492
|
25.2%
|
$40.71
|
17.6%
|
26.5%
|
|||||||
|
2016
|
24
|
100,765
|
16.5%
|
254,257
|
41.7%
|
$39.12
|
17.7%
|
44.2%
|
|||||||
|
2017
|
7
|
30,351
|
5.0%
|
284,608
|
46.6%
|
$41.12
|
5.6%
|
49.8%
|
|||||||
|
2018
|
7
|
40,902
|
6.7%
|
325,510
|
53.4%
|
$41.66
|
7.7%
|
57.4%
|
|||||||
|
2019
|
29
|
195,165
|
32.0%
|
520,675
|
85.3%
|
$41.82
|
36.7%
|
94.1%
|
|||||||
|
2020
|
1
|
22,506
|
3.7%
|
543,181
|
89.0%
|
$50.00
|
5.1%
|
99.1%
|
|||||||
|
2021
|
0
|
0
|
0.0%
|
543,181
|
89.0%
|
$0.00
|
0.0%
|
99.1%
|
|||||||
|
2022
|
4
|
10,170
|
1.7%
|
553,351
|
90.7%
|
$18.72
|
0.9%
|
100.0%
|
|||||||
|
2023
|
0
|
0
|
0.0%
|
553,351
|
90.7%
|
$0.00
|
0.0%
|
100.0%
|
|||||||
|
2024
|
0
|
0
|
0.0%
|
553,351
|
90.7%
|
$0.00
|
0.0%
|
100.0%
|
|||||||
|
Thereafter
|
7
|
15,064
|
2.5%
|
568,415
|
93.2%
|
$0.00
|
0.0%
|
100.0%
|
|||||||
|
Vacant
|
NAP
|
41,695
|
6.8%
|
610,110
|
100.0%
|
NAP
|
NAP
|
||||||||
|
Total / Wtd. Avg.
|
129
|
610,110
|
100.0%
|
$39.17
|
100.0%
|
||||||||||
|
(1)
|
Certain tenants have lease termination options that may become exercisable prior to the originally stated expiration date of the tenant lease and that are not considered in the lease rollover schedule.
|
The depositor has filed a registration statement (including the prospectus) with the SEC (SEC File No. 333-193376) for the offering to which this communication relates. Before you invest, you should read the prospectus in the registration statement and other documents the depositor has filed with the SEC for more complete information about the depositor, the issuing trust and this offering. You may get these documents for free by visiting EDGAR on the SEC website at www.sec.gov. Alternatively, the depositor or Deutsche Bank Securities Inc., any other underwriter, or any dealer participating in this offering will arrange to send you the prospectus if you request it by calling toll-free 1-800-503-4611 or by email to the following address: prospectus.cpdg@db.com. The offered certificates referred to in these materials, and the asset pool backing them, are subject to modification or revision (including the possibility that one or more classes of certificates may be split, combined or eliminated at any time prior to issuance or availability of a final prospectus) and are offered on a “when, as and if issued” basis. You understand that, when you are considering the purchase of these certificates, a contract of sale will come into being no sooner than the date on which the relevant class has been priced and we have verified the allocation of certificates to be made to you; any “indications of interest” expressed by you, and any “soft circles” generated by us, will not create binding contractual obligations for you or us.
34
|
One Kendall Square
Cambridge, MA 02139
|
Collateral Asset Summary – Loan No. 2
One Kendall Square
|
Cut-off Date Balance:
Cut-off Date LTV:
U/W NCF DSCR:
U/W NOI Debt Yield:
|
$120,000,000
62.3%
1.34x
9.2%
|
The Loan. The One Kendall Square loan (the “One Kendall Square Loan”) consists of the controlling Note A-1 in the original principal amount of $120.0 million of a fixed rate loan in the aggregate principal amount of $203.0 million (the “One Kendall Square Loan Combination”). The One Kendall Square Loan Combination is secured by the borrowers’ fee simple interest in a seven building, Class A mixed use campus containing 610,110 sq. ft. located at One Kendall Square in Cambridge, Massachusetts (the “One Kendall Square Property”). The $203.0 million One Kendall Square Loan Combination is evidenced by two pari passu notes. Only the controlling Note A-1, with an original principal balance of $120.0 million, will be included in the COMM 2014-UBS2 mortgage trust. The non-controlling Note A-2, with an original principal balance of $83.0 million is expected to be contributed to a future securitization. GACC has reserved the right to further split Note A-2 into multiple notes. The One Kendall Square Loan Combination has a 10-year term and amortizes on a 360-month schedule, after an initial four-year interest only period.
The One Kendall Square Loan accrues interest at a fixed rate equal to 4.8200% and has a cut-off date balance of $120.0 million. Proceeds of the One Kendall Square Loan Combination, along with approximately $114.7 million of sponsor equity, was used to purchase the One Kendall Square Property for approximately $310.0 million, fund upfront reserves of approximately $7.0 million and pay closing costs of approximately $0.7 million. Based on the appraised value of $325.6 million as of December 9, 2013, the cut-off date LTV ratio of the One Kendall Square Loan Combination is 62.3%. The most recent prior financing of the One Kendall Square Property was included in the COMM 2011-FL1 mortgage trust.
The relationship between the holders of Note A-1 and Note A-2 is governed by an intercreditor agreement which is described under “Description of the Mortgage Pool―Loan Combinations―The One Kendall Square Loan Combination” in the Free Writing Prospectus.
|
Pari Passu Note Summary
|
|||||
|
|
Original Balance
|
Cut-off Date Balance
|
Note Holder
|
Controlling Piece
|
|
|
Note A-1
|
$120,000,000
|
$120,000,000
|
COMM 2014-UBS2
|
Yes
|
|
|
Note A-2
|
$83,000,000
|
$83,000,000
|
GACC
|
No
|
|
|
Total
|
$203,000,000
|
$203,000,000
|
|||
|
Sources and Uses
|
||||||||
|
Sources
|
Proceeds
|
% of Total
|
Uses
|
Proceeds
|
% of Total
|
|||
|
Loan Amount
|
$203,000,000
|
63.9%
|
Purchase Price
|
$310,000,000
|
97.6%
|
|||
|
Sponsor Equity
|
$114,693,263
|
36.1%
|
Reserves
|
$7,028,664
|
2.2%
|
|||
|
Closing Costs
|
$664,599
|
0.2%
|
||||||
|
Total Sources
|
$317,693,263
|
100.0%
|
Total Uses
|
$317,693,263
|
100.0%
|
|||
The Borrower / Sponsor. The borrower, DWF IV One Kendall, LLC, is a single purpose Delaware limited liability company structured to be bankruptcy-remote, with two independent directors in its organizational structure. The sponsor of the borrower and the nonrecourse carve-out guarantor is DivcoWest Fund IV REIT, LP. The sponsor did not sign the environmental indemnity, but provided an environmental insurance policy. See “Risk Factors―Risks Related to the Mortgage Loans―Potential Issuing Entity Liability Related to a Materially Adverse Environmental Condition” in the Free Writing Prospectus.
DivcoWest Fund IV REIT, LP is a subsidiary of DivcoWest, which is a privately-owned real estate investment firm that was founded in 1993 with offices in San Francisco and Boston. DivcoWest has acquired more than 30.0 million square feet of commercial space throughout the United States, and offers a range of services including asset and property management. DivcoWest’s technology focused office portfolio consists of assets in Silicon Valley and Austin, Texas, as well as approximately 10 properties located in Massachusetts. DivcoWest and its affiliates manage over $2.5 billion of equity for major pension funds, sovereign wealth funds, endowments and high net worth individuals.
The Property. The One Kendall Square Property consists of seven, three- to five-story Class A office, lab and retail buildings totaling 610,110 sq. ft., located south of Binney Street in Cambridge, Massachusetts. The One Kendall Square Property is part of a mixed-use campus, which totals approximately 669,000 sq. ft. and includes multiple buildings owned by the sponsor located north of Binney Street. These buildings are not part of the One Kendall Square Property collateral and include a 25,800 sq. ft. nine-screen movie theater, 33,272 sq. ft. of office and lab space and a parking garage with 1,574 parking spaces. There is a parking and access easement that allows tenants of the One Kendall Square Property to use the parking garage.
The One Kendall Square Property was constructed in phases from 1887 to 1994. The One Kendall Square Property was originally renovated in 1986 and from 2007 to 2013 the full campus underwent an approximately $74.0 million renovation ($111 PSF based on total campus square feet). Renovations consisted of a complete campus revitalization project, including HVAC and common area renovations along with base building upgrades. Approximately $36.0 million of the total renovation was spent upgrading laboratory
The depositor has filed a registration statement (including the prospectus) with the SEC (SEC File No. 333-193376) for the offering to which this communication relates. Before you invest, you should read the prospectus in the registration statement and other documents the depositor has filed with the SEC for more complete information about the depositor, the issuing trust and this offering. You may get these documents for free by visiting EDGAR on the SEC website at www.sec.gov. Alternatively, the depositor or Deutsche Bank Securities Inc., any other underwriter, or any dealer participating in this offering will arrange to send you the prospectus if you request it by calling toll-free 1-800-503-4611 or by email to the following address: prospectus.cpdg@db.com. The offered certificates referred to in these materials, and the asset pool backing them, are subject to modification or revision (including the possibility that one or more classes of certificates may be split, combined or eliminated at any time prior to issuance or availability of a final prospectus) and are offered on a “when, as and if issued” basis. You understand that, when you are considering the purchase of these certificates, a contract of sale will come into being no sooner than the date on which the relevant class has been priced and we have verified the allocation of certificates to be made to you; any “indications of interest” expressed by you, and any “soft circles” generated by us, will not create binding contractual obligations for you or us.
35
|
One Kendall Square
Cambridge, MA 02139
|
Collateral Asset Summary – Loan No. 2
One Kendall Square
|
Cut-off Date Balance:
Cut-off Date LTV:
U/W NCF DSCR:
U/W NOI Debt Yield:
|
$120,000,000
62.3%
1.34x
9.2%
|
space, including the creation of the incubator lab space which is useful for smaller biotech companies. Of the total renovation, approximately $45.1 million ($74 PSF) was spent on the seven buildings which comprise the One Kendall Square Property.
As of November 23, 2013 the One Kendall Square Property is 93.2% leased to 64 tenants. The majority of the One Kendall Square Property is built out as lab space, which encompasses 51.6% of the net rentable area. Of the 64 tenants, the largest industry concentration is within the lab sector, which makes up approximately 55.0% of the leased area and includes two of the largest tenants, Merrimack and Nine Point Medical. Since the beginning of 2013, approximately 31.2% of the net rentable area at the One Kendall Square Property was signed to a new or renewing tenant. The subsequent chart summarizes the various types of space at the One Kendall Square Property:
|
Unit Breakdown(1)
|
|||||||||||
|
Type of Space
|
Net Rentable
Area (Sq. Ft.)
|
% of Net
Rentable Area
|
% Occupied
|
U/W Base
Rent PSF
|
% of Total
U/W Base Rent
|
Market Rent
PSF(2)
|
|||||
|
Lab(3)
|
342,287
|
56.1%
|
89.9%
|
$43.25
|
59.8%
|
$38.00 - $54.00
|
|||||
|
Office
|
201,834
|
33.1%
|
98.0%
|
$40.05
|
35.6%
|
$45.00 - $52.00
|
|||||
|
Retail
|
38,388
|
6.3%
|
100.0%
|
$23.97
|
4.1%
|
$22.00 - $31.00
|
|||||
|
Storage and Miscellaneous
|
27,601
|
4.5%
|
88.5%
|
$5.11
|
0.5%
|
$12.00
|
|||||
|
Total/Wtd. Avg.
|
610,110
|
100.0%
|
93.2%
|
$39.17
|
100.0%
|
$38.13 - $49.99
|
|||||
|
|
(1)
|
Based on the underwritten rent roll.
|
|
|
(2)
|
Source: Appraisal.
|
|
|
(3)
|
Includes lab and incubator lab space.
|
Environmental Matters. The Phase I environmental report dated January 3, 2014 recommended no further action at the One Kendall Square Property, other than the continued implementation of the asbestos operation and maintenance plan.
Major Tenants.
Merrimack (121,704 sq. ft., 19.9% of NRA, 22.4% of GPR). Merrimack Pharmaceuticals, Inc. (“Merrimack”) is headquartered at the One Kendall Square Property and is a biopharmaceutical company that develops and commercializes innovative medicines paired with companion diagnostics for the treatment of serious diseases, with an initial focus on cancer. Merrimack provides patients, physicians and the healthcare system with the medicines, tools and information on the diagnosis and treatment of illness through a precise mechanistic understanding of disease. At the One Kendall Square Property, Merrimack consists mostly of lab space, with approximately 10,600 sq. ft. of office space and approximately 3,100 sq. ft. of storage space.
Merrimack has been leasing space at the One Kendall Square Property since 2006 when it occupied 31,747 sq. ft. and has since expanded multiple times to its current 121,704 sq. ft. of leased space. This includes a lease for 3,617 sq. ft. which Merrimack began in November 2013. Merrimack is not yet in occupancy of this space but is paying full rent. Merrimack is estimated to begin build out on this space in early 2014. Merrimack’s lease expires June 30, 2019 with either (i) one five-year renewal option at market rent upon written notice given no later than March 31, 2018, or (ii) one one-year renewal option at market rent upon written notice given no later than December 31, 2016.
Akamai Technologies (51,693 sq. ft., 8.5% of NRA, 11.4% of GPR). Akamai Technologies (“Akamai”) (Nasdaq: AKAM) is a leading provider of cloud services, which allows users to share secured data on multiple devices. Founded in 1998, Akamai helps enterprises accelerate innovation by removing the complexities of technology so companies can focus on driving business forward. With over 137,000 servers in 87 countries, Akamai’s network is one of the world’s largest distributed-computing platforms and is responsible for serving 15% to 30% of all web traffic. Akamai has over 3,400 employees and had year-end 2013 revenues of approximately $1.6 billion. Akamai is headquartered at 8 Cambridge Center, which is located adjacent to the One Kendall Square Property. Akamai uses the One Kendall Square Property for office space.
Akamai signed its lease at the One Kendall Square Property in September 2013, and is estimated to take occupancy of its space in April 2014, with rent commencing on April 19, 2014. At closing, $652,323 was reserved for all outstanding rent abatements due to Akamai under its lease. Akamai has two five-year renewal options at market rent upon written notice given on or before 15 months prior to the expiration of the then-existing lease term.
Nine Point Medical (31,916 sq. ft., 5.2% of NRA, 6.1% of GPR). Nine Point Medical (“Nine Point”) is headquartered at the One Kendall Square Property and is positioned to improve patient care through the development of medical devices that enable high-resolution in-vivo imaging. Utilizing advanced optical technologies, Nine Point enables physicians and pathologists to visualize disease in real time and eventually treat patients during the same procedure. Applications of Nine Point’s technology include gastroenterology, pulmonary
The depositor has filed a registration statement (including the prospectus) with the SEC (SEC File No. 333-193376) for the offering to which this communication relates. Before you invest, you should read the prospectus in the registration statement and other documents the depositor has filed with the SEC for more complete information about the depositor, the issuing trust and this offering. You may get these documents for free by visiting EDGAR on the SEC website at www.sec.gov. Alternatively, the depositor or Deutsche Bank Securities Inc., any other underwriter, or any dealer participating in this offering will arrange to send you the prospectus if you request it by calling toll-free 1-800-503-4611 or by email to the following address: prospectus.cpdg@db.com. The offered certificates referred to in these materials, and the asset pool backing them, are subject to modification or revision (including the possibility that one or more classes of certificates may be split, combined or eliminated at any time prior to issuance or availability of a final prospectus) and are offered on a “when, as and if issued” basis. You understand that, when you are considering the purchase of these certificates, a contract of sale will come into being no sooner than the date on which the relevant class has been priced and we have verified the allocation of certificates to be made to you; any “indications of interest” expressed by you, and any “soft circles” generated by us, will not create binding contractual obligations for you or us.
36
|
One Kendall Square
Cambridge, MA 02139
|
Collateral Asset Summary – Loan No. 2
One Kendall Square
|
Cut-off Date Balance:
Cut-off Date LTV:
U/W NCF DSCR:
U/W NOI Debt Yield:
|
$120,000,000
62.3%
1.34x
9.2%
|
medicine, breast cancer, gynecology, urology, and ENT and plans to gradually incorporate therapeutic devices. Nine Point uses the One Kendall Square Property for lab space, with one basement storage space.
Nine Point has been a tenant at the One Kendall Square Property since December 2010 and expanded its space in January 2013. Nine Point has one two-year option at 95% of market rent upon nine months prior written notice.
The Market. The One Kendall Square Property is located in the Kendall Square area of East Cambridge, Massachusetts, which is part of the Greater Boston metropolitan area. Within the United States, the largest distribution of biotechnology companies is located in Massachusetts. This is largely due to the presence of the Massachusetts Institute of Technology (“M.I.T.”) and Harvard, as well as some of the country’s leading hospitals located within the Massachusetts General Complex or Longwood Medical Area. The Kendall Square area consists primarily of office buildings, research and development facilities, and some industrial uses throughout the area. In many of the neighborhood office buildings, retail uses occupy the first floor. The One Kendall Square Property is surrounded by major institutional, research facilities and corporate biotech users which include the M.I.T. Stata Center, the M.I.T. Brain & Cognitive Science Project, The Whitehead Institute for Biomedical Research, Draper Laboratories and two lab facilities for Biogen. In addition, the One Kendall Square Property is proximate to multiple transportation lines, including the Massachusetts Bay Transportation Authority (MBTA) Red Line subway, which services Harvard University, M.I.T., Massachusetts General Hospital, Boston’s Financial District and South Station. Within a three-mile radius of the One Kendall Square Property, the 2013 population is 467,490, with an average household income of $91,120.
The Cambridge office and laboratory market consists of three submarkets: West Cambridge, Mid Cambridge and East Cambridge. The One Kendall Square Property is located in the East Cambridge submarket, which has a wide variety of industries such as high-tech, bio-tech, financial services, retail services, manufacturing and healthcare for approximately 59.0% of total market inventory. As of Q3 2013, the overall Cambridge office market reflects a vacancy rate of 6.5%, with 11.1 million sq. ft. of inventory. The East Cambridge submarket has a total office inventory of approximately 7.3 million square feet with a vacancy rate of 5.9% and average asking rent of $48.83 PSF Gross. The subsequent chart presents some comparable office leases:
|
Comparable Office Rentals(1)
|
||||||
|
Name
|
One Kendall Square
Property |
5 Cambridge
Center |
4 Cambridge
Center |
101 Main Street
|
1 Cambridge
Center |
One Main Street
|
|
Distance from Subject
|
NAP
|
0.4 miles
|
0.3 miles
|
0.6 miles
|
0.4 miles
|
0.7 miles
|
|
Building Sq. Ft.(2)
|
201,834
|
237,752
|
198,295
|
341,830
|
215,385
|
305,589
|
|
Year Built / Renovated
|
1887-1994 / 1986, 2007-2013
|
1981
|
1986
|
1983
|
1987
|
1986
|
|
Tenant Name
|
Comparable Leases
|
Mass Eye Research
|
The Frankel Group
|
Matrix Partners
|
Johnson & Johnson
|
Schneider Electric
|
|
Size (Sq. Ft.)(3)
|
6,116
|
1,465
|
4,302
|
11,567
|
9,121
|
7,639
|
|
Rent PSF(4)
|
$40.05
|
$62.00
|
$58.00
|
$55.00
|
$58.00
|
$53.00
|
|
(1)
|
Source: Appraisal.
|
|
(2)
|
Building Sq. Ft. for the One Kendall Square Property represents total office space per the November 23, 2013 rent roll.
|
|
(3)
|
Size (Sq. Ft.) for the One Kendall Square Property represents the average size of office space per the November 23, 2013 rent roll.
|
|
(4)
|
Rent PSF for the One Kendall Square Property represents the average rent for office space per the November 23, 2013 rent roll.
|
Barriers to entry are formidable in the East Cambridge laboratory market. East Cambridge has little available land currently zoned for lab use. The approval process for lab space is long and includes significant community input, so it is typical for lab tenants to renovate existing structures to suit their needs. In addition, the One Kendall Square Property offers contiguous and Class A lab space where the majority of lab space in East Cambridge represents inferior class B space or non-contiguous space. The East Cambridge submarket also has a total lab space inventory of approximately 7.3 million square feet with a vacancy rate of 5.9% and average asking rent of $52.12 PSF NNN. The subsequent chart presents some comparable lab space leases:
The depositor has filed a registration statement (including the prospectus) with the SEC (SEC File No. 333-193376) for the offering to which this communication relates. Before you invest, you should read the prospectus in the registration statement and other documents the depositor has filed with the SEC for more complete information about the depositor, the issuing trust and this offering. You may get these documents for free by visiting EDGAR on the SEC website at www.sec.gov. Alternatively, the depositor or Deutsche Bank Securities Inc., any other underwriter, or any dealer participating in this offering will arrange to send you the prospectus if you request it by calling toll-free 1-800-503-4611 or by email to the following address: prospectus.cpdg@db.com. The offered certificates referred to in these materials, and the asset pool backing them, are subject to modification or revision (including the possibility that one or more classes of certificates may be split, combined or eliminated at any time prior to issuance or availability of a final prospectus) and are offered on a “when, as and if issued” basis. You understand that, when you are considering the purchase of these certificates, a contract of sale will come into being no sooner than the date on which the relevant class has been priced and we have verified the allocation of certificates to be made to you; any “indications of interest” expressed by you, and any “soft circles” generated by us, will not create binding contractual obligations for you or us.
37
|
One Kendall Square
Cambridge, MA 02139
|
Collateral Asset Summary – Loan No. 2
One Kendall Square
|
Cut-off Date Balance:
Cut-off Date LTV:
U/W NCF DSCR:
U/W NOI Debt Yield:
|
$120,000,000
62.3%
1.34x
9.2%
|
|
Comparable Lab Rentals(1)
|
|||||||||||
|
Name
|
One Kendall Square
Property |
400 Technology
Square |
400 Technology
Square |
790 Memorial
Drive |
320 Bent Street
|
320 Bent Street
|
|||||
|
Distance from Subject
|
NAP
|
0.2 miles
|
0.2 miles
|
2.1 miles
|
0.3 miles
|
0.3 miles
|
|||||
|
Building Sq. Ft.(2)
|
342,287
|
213,000
|
213,000
|
47,874
|
184,445
|
184,445
|
|||||
|
Year Built / Renovated
|
1887-1994 / 1986, 2007-2013
|
1966/1999
|
1966/1999
|
2001
|
2000
|
2000
|
|||||
|
Tenant Name
|
Comparable Leases
|
Aramco Services
|
Warp Drive
|
Infinity Pharma
|
Momento Pharma
|
Idenix Pharma
|
|||||
|
Unit Size (Sq. Ft.)(3)
|
6,339
|
32,403
|
21,621
|
15,783
|
104,678
|
46,418
|
|||||
|
Rent PSF(4)
|
$43.25
|
$56.00
|
$59.25
|
$62.00
|
$58.00
|
$48.26
|
|||||
|
(1)
|
Source: Appraisal.
|
|
(2)
|
Building Sq. Ft. for the One Kendall Square Property represents total lab and incubator lab space per the November 23, 2013 rent roll.
|
|
(3)
|
Size (Sq. Ft.) for the One Kendall Square Property represents the average size of lab space per the November 23, 2013 rent roll.
|
|
(4)
|
Rent PSF for the One Kendall Square Property represents the average rent for lab space per the November 23, 2013 rent roll.
|
The appraiser concluded market rent for the One Kendall Square Property to be $38.00 to $54.00 PSF NNN for lab space tenants, $45.00 to $52.00 PSF gross for office tenants, $22.00 to $31.00 PSF NNN for ground floor retail tenants and $12.00 PSF gross for storage space.
Cash Flow Analysis.
|
Cash Flow Analysis
|
|||||||
|
2010
|
2011
|
2012
|
T-12 11/30/2013
|
U/W
|
U/W PSF
|
||
|
Base Rent(1)
|
$12,967,983
|
$14,845,894
|
$17,298,314
|
$18,482,225
|
$22,828,190
|
$37.42
|
|
|
Value of Vacant Space
|
0
|
0
|
0
|
0
|
2,309,888
|
3.79
|
|
|
Gross Potential Rent
|
$12,967,983
|
$14,845,894
|
$17,298,314
|
$18,482,225
|
$25,138,078
|
$41.20
|
|
|
Total Recoveries
|
3,494,275
|
5,389,436
|
5,573,452
|
6,124,526
|
6,491,507
|
10.64
|
|
|
Total Other Income
|
110,516
|
93,776
|
18,482
|
150,139
|
105,965
|
0.17
|
|
|
Less: Vacancy(2)
|
0
|
0
|
0
|
0
|
(2,309,888)
|
(3.79)
|
|
|
Effective Gross Income
|
$16,572,774
|
$20,329,107
|
$22,890,248
|
$24,756,891
|
$29,425,662
|
$48.23
|
|
|
Total Operating Expenses
|
8,691,962
|
9,885,624
|
10,296,408
|
11,255,081
|
10,711,322
|
17.56
|
|
|
Net Operating Income(3)
|
$7,880,812
|
$10,443,482
|
$12,593,841
|
$13,501,810
|
$18,714,340
|
$30.67
|
|
|
TI/LC
|
0
|
0
|
0
|
0
|
1,407,150
|
2.31
|
|
|
Capital Expenditures
|
0
|
0
|
0
|
0
|
152,528
|
0.25
|
|
|
Net Cash Flow
|
$7,880,812
|
$10,443,482
|
$12,593,841
|
$13,501,810
|
$17,154,662
|
$28.12
|
|
|
(1)
|
U/W Base Rent includes $563,123 in contractual step rent through December 2014.
|
|
(2)
|
U/W Vacancy represents 7.3% of gross income compared to a market vacancy rate of 6.5% and a submarket vacancy rate of 5.9%. U/W Vacancy represents vacant space grossed up at $55.40 PSF based on recent leasing.
|
|
(3)
|
The increase in U/W Net Operating Income over historical Net Operating Income is primarily due to recent leasing by Akamai Technologies and M.I.T., which have leases that commence in September 2013 and March 2014, respectively, and contribute approximately $3.7 million in underwritten base rent.
|
Property Management. The One Kendall Square Property is managed by Divco West Real Estate Services, Inc., a borrower affiliate.
Lockbox / Cash Management. The One Kendall Square Loan Combination is structured with a hard lockbox and in place cash management. The borrower was required to send tenant direction letters to all tenants instructing them to deposit all rents and other payments into the lockbox account controlled by the lender. All funds in the lockbox account are swept daily to a cash management account under the control of the lender and disbursed during each interest period of the loan term in accordance with the One Kendall Square Loan Combination documents.
Additionally, all excess cash will be swept into a lender controlled account upon (i) an event of default, (ii) the DSCR falls below 1.15x as of the last day of any calendar quarter or (iii) the occurrence of a Lease Sweep Period (as defined herein), until such time as (a) with respect to clause (i), the event of default has been cured, (b) with respect to clause (ii), the DSCR is at least 1.20x for two consecutive quarters and (c) with respect to clause (iii), the Lease Sweep Period is no longer continuing.
A “Lease Sweep Period” will commence upon the first to occur of (i) the date that is 12 months prior to the earliest stated expiration date (including the stated expiration of any renewal term) of a Lease Sweep Lease (defined herein) or the final date required under a
The depositor has filed a registration statement (including the prospectus) with the SEC (SEC File No. 333-193376) for the offering to which this communication relates. Before you invest, you should read the prospectus in the registration statement and other documents the depositor has filed with the SEC for more complete information about the depositor, the issuing trust and this offering. You may get these documents for free by visiting EDGAR on the SEC website at www.sec.gov. Alternatively, the depositor or Deutsche Bank Securities Inc., any other underwriter, or any dealer participating in this offering will arrange to send you the prospectus if you request it by calling toll-free 1-800-503-4611 or by email to the following address: prospectus.cpdg@db.com. The offered certificates referred to in these materials, and the asset pool backing them, are subject to modification or revision (including the possibility that one or more classes of certificates may be split, combined or eliminated at any time prior to issuance or availability of a final prospectus) and are offered on a “when, as and if issued” basis. You understand that, when you are considering the purchase of these certificates, a contract of sale will come into being no sooner than the date on which the relevant class has been priced and we have verified the allocation of certificates to be made to you; any “indications of interest” expressed by you, and any “soft circles” generated by us, will not create binding contractual obligations for you or us.
38
|
One Kendall Square
Cambridge, MA 02139
|
Collateral Asset Summary – Loan No. 2
One Kendall Square
|
Cut-off Date Balance:
Cut-off Date LTV:
U/W NCF DSCR:
U/W NOI Debt Yield:
|
$120,000,000
62.3%
1.34x
9.2%
|
Lease Sweep Lease by which the tenant is required to give notice to exercise its renewal option, (ii) the date that a Lease Sweep Lease is surrendered, cancelled, or terminated prior to its then current expiration date, (iii) the date that any tenant under a Lease Sweep Lease goes dark or (iv) upon a default or insolvency proceeding under a Lease Sweep Lease.
A “Lease Sweep Lease” means (i) the Akamai lease, (ii) the Merrimack lease, (iii) any Akamai or Merrimack replacement tenant lease, which, either individually or when combined with any other lease of the same tenant or its affiliates, demises 50,000 or more rentable sq. ft. at the One Kendall Square Property, or (iv) any Akamai or Merrimack replacement tenant lease that expires within the same 12-month period, and when aggregated together demise at least 35,000 or more net rentable sq. ft.
Initial Reserves. At closing, the borrower deposited (i) $1,103,422 into a tax reserve account, (ii) $5,137,394 into the TI/LC reserve account for approved leasing expenses, (iii) $673,135 into a free rent reserve account and (iv) $114,713 into the required repairs reserve account.
Ongoing Reserves. On a monthly basis, the borrower is required to deposit reserves of (i) 1/12 of the estimated annual real estate taxes, which currently equates to $275,856 into a tax reserve account, (ii) $12,711 into a capital expenditure account and (iii) $169,814 into a TI/LC reserve account, subject to a reserve cap of $7.0 million on or prior to December 31, 2019 and a cap of $5.0 million on or after January 1, 2020. In addition, the borrower is required to deposit 1/12 of the estimated annual insurance premiums into an insurance reserve account if an acceptable blanket insurance policy is no longer in place. During a Lease Sweep Period, all excess cash will be deposited into the lease sweep reserve, subject to a reserve cap of $55.00 PSF based on the aggregate rentable square feet of the Lease Sweep Lease that caused the Lease Sweep Period to spring into effect.
Current Mezzanine or Subordinate Indebtedness. None.
Future Mezzanine or Subordinate Indebtedness Permitted. Mezzanine debt is permitted solely in connection with a transfer and assumption of the One Kendall Square Loan Combination, provided, among other things per the One Kendall Square Loan Combination documents, (i) the combined LTV is less than or equal to 62.3%, (ii) the combined DSCR is greater than or equal to 1.29x, (iii) the combined debt yield is not less than 8.0% and (iv) the mezzanine lender provides an acceptable intercreditor agreement. The sponsor of the borrower or an affiliate may be the mezzanine lender of such permitted mezzanine loan.
The depositor has filed a registration statement (including the prospectus) with the SEC (SEC File No. 333-193376) for the offering to which this communication relates. Before you invest, you should read the prospectus in the registration statement and other documents the depositor has filed with the SEC for more complete information about the depositor, the issuing trust and this offering. You may get these documents for free by visiting EDGAR on the SEC website at www.sec.gov. Alternatively, the depositor or Deutsche Bank Securities Inc., any other underwriter, or any dealer participating in this offering will arrange to send you the prospectus if you request it by calling toll-free 1-800-503-4611 or by email to the following address: prospectus.cpdg@db.com. The offered certificates referred to in these materials, and the asset pool backing them, are subject to modification or revision (including the possibility that one or more classes of certificates may be split, combined or eliminated at any time prior to issuance or availability of a final prospectus) and are offered on a “when, as and if issued” basis. You understand that, when you are considering the purchase of these certificates, a contract of sale will come into being no sooner than the date on which the relevant class has been priced and we have verified the allocation of certificates to be made to you; any “indications of interest” expressed by you, and any “soft circles” generated by us, will not create binding contractual obligations for you or us.
39
|
One Kendall Square
Cambridge, MA 02139
|
Collateral Asset Summary – Loan No. 2
One Kendall Square
|
Cut-off Date Balance:
Cut-off Date LTV:
U/W NCF DSCR:
U/W NOI Debt Yield:
|
$120,000,000
62.3%
1.34x
9.2%
|

The depositor has filed a registration statement (including the prospectus) with the SEC (SEC File No. 333-193376) for the offering to which this communication relates. Before you invest, you should read the prospectus in the registration statement and other documents the depositor has filed with the SEC for more complete information about the depositor, the issuing trust and this offering. You may get these documents for free by visiting EDGAR on the SEC website at www.sec.gov. Alternatively, the depositor or Deutsche Bank Securities Inc., any other underwriter, or any dealer participating in this offering will arrange to send you the prospectus if you request it by calling toll-free 1-800-503-4611 or by email to the following address: prospectus.cpdg@db.com. The offered certificates referred to in these materials, and the asset pool backing them, are subject to modification or revision (including the possibility that one or more classes of certificates may be split, combined or eliminated at any time prior to issuance or availability of a final prospectus) and are offered on a “when, as and if issued” basis. You understand that, when you are considering the purchase of these certificates, a contract of sale will come into being no sooner than the date on which the relevant class has been priced and we have verified the allocation of certificates to be made to you; any “indications of interest” expressed by you, and any “soft circles” generated by us, will not create binding contractual obligations for you or us.
40
|
One Kendall Square
Cambridge, MA 02139
|
Collateral Asset Summary – Loan No. 2
One Kendall Square
|
Cut-off Date Balance:
Cut-off Date LTV:
U/W NCF DSCR:
U/W NOI Debt Yield:
|
$120,000,000
62.3%
1.34x
9.2%
|

The depositor has filed a registration statement (including the prospectus) with the SEC (SEC File No. 333-193376) for the offering to which this communication relates. Before you invest, you should read the prospectus in the registration statement and other documents the depositor has filed with the SEC for more complete information about the depositor, the issuing trust and this offering. You may get these documents for free by visiting EDGAR on the SEC website at www.sec.gov. Alternatively, the depositor or Deutsche Bank Securities Inc., any other underwriter, or any dealer participating in this offering will arrange to send you the prospectus if you request it by calling toll-free 1-800-503-4611 or by email to the following address: prospectus.cpdg@db.com. The offered certificates referred to in these materials, and the asset pool backing them, are subject to modification or revision (including the possibility that one or more classes of certificates may be split, combined or eliminated at any time prior to issuance or availability of a final prospectus) and are offered on a “when, as and if issued” basis. You understand that, when you are considering the purchase of these certificates, a contract of sale will come into being no sooner than the date on which the relevant class has been priced and we have verified the allocation of certificates to be made to you; any “indications of interest” expressed by you, and any “soft circles” generated by us, will not create binding contractual obligations for you or us.
41
|
9350 and 9380 Excelsior Boulevard
Hopkins, MN 55343
|
Collateral Asset Summary – Loan No. 3
Excelsior Crossings
|
Cut-off Date Balance:
Cut-off Date LTV:
U/W NCF DSCR:
U/W NOI Debt Yield:
|
$88,000,000
62.4%
1.58x
10.3%
|
The depositor has filed a registration statement (including the prospectus) with the SEC (SEC File No. 333-193376) for the offering to which this communication relates. Before you invest, you should read the prospectus in the registration statement and other documents the depositor has filed with the SEC for more complete information about the depositor, the issuing trust and this offering. You may get these documents for free by visiting EDGAR on the SEC website at www.sec.gov. Alternatively, the depositor or Deutsche Bank Securities Inc., any other underwriter, or any dealer participating in this offering will arrange to send you the prospectus if you request it by calling toll-free 1-800-503-4611 or by email to the following address: prospectus.cpdg@db.com. The offered certificates referred to in these materials, and the asset pool backing them, are subject to modification or revision (including the possibility that one or more classes of certificates may be split, combined or eliminated at any time prior to issuance or availability of a final prospectus) and are offered on a “when, as and if issued” basis. You understand that, when you are considering the purchase of these certificates, a contract of sale will come into being no sooner than the date on which the relevant class has been priced and we have verified the allocation of certificates to be made to you; any “indications of interest” expressed by you, and any “soft circles” generated by us, will not create binding contractual obligations for you or us.
42
|
9350 and 9380 Excelsior Boulevard
Hopkins, MN 55343
|
Collateral Asset Summary – Loan No. 3
Excelsior Crossings
|
Cut-off Date Balance:
Cut-off Date LTV:
U/W NCF DSCR:
U/W NOI Debt Yield:
|
$88,000,000
62.4%
1.58x
10.3%
|
|
Mortgage Loan Information
|
Property Information
|
||||
|
Loan Seller:
|
GACC
|
Single Asset / Portfolio:
|
Single Asset
|
||
|
Loan Purpose:
|
Acquisition
|
Property Type:
|
Suburban Office
|
||
|
Sponsor:
|
Colony Financial, Inc.
|
Collateral:
|
Fee Simple
|
||
|
Borrower:
|
ColFin Midwest NNN Investor, LLC
|
Location:
|
Hopkins, MN
|
||
|
Original Balance:
|
$88,000,000
|
Year Built / Renovated:
|
2008-2009 / NAP
|
||
|
Cut-off Date Balance:
|
$88,000,000
|
Total Sq. Ft.:
|
501,603
|
||
|
% by Initial UPB:
|
7.1%
|
Property Management:
|
Self-managed
|
||
|
Interest Rate:
|
4.8350%
|
Underwritten NOI:
|
$9,096,055
|
||
|
Payment Date:
|
1st of each month
|
Underwritten NCF:
|
$8,768,097
|
||
|
First Payment Date:
|
February 1, 2014
|
Appraised Value:
|
$141,000,000
|
||
|
Maturity Date:
|
January 1, 2024
|
Appraisal Date:
|
December 3, 2013
|
||
|
Amortization:
|
Interest only for first 24 months, 360
|
||||
|
months thereafter
|
Historical NOI
|
||||
|
Additional Debt:
|
None
|
Most Recent NOI:
|
$9,002,478 (T-12 October 31, 2013)
|
||
|
Call Protection(1):
|
L(24), YM(2), DorYM(90), O(4)
|
2012 NOI:
|
$8,822,764 (December 31, 2012)
|
||
|
Lockbox / Cash Management:
|
Hard / In Place
|
2011 NOI:
|
$8,710,021 (December 31, 2011)
|
||
|
2010 NOI:
|
NAV
|
||||
|
Reserves(2)
|
|||||
|
Initial
|
Monthly
|
Historical Occupancy
|
|||
|
Taxes:
|
$0
|
Springing
|
Current Occupancy:
|
100.0% (March 6, 2014)
|
|
|
Insurance:
|
$0
|
Springing
|
2012 Occupancy:
|
100.0% (December 31, 2012)
|
|
|
Replacement:
|
$0
|
$10,450
|
2011 Occupancy:
|
100.0% (December 31, 2011)
|
|
|
TI/LC:
|
$0
|
$10,450
|
2010 Occupancy:
|
100.0% (December 31, 2010)
|
|
|
Lease Sweep:
|
$0
|
Springing
|
(1) The lockout period will be 24 payments beginning with and including the first payment date of February 1, 2014. The defeasance lockout period will be 26 payments beginning with and including the first payment date of February 1, 2014. Partial defeasance (without property release) is permitted in lieu of a cash trap. See “Ongoing Reserves” herein.
(2) See “Initial Reserves” and “Ongoing Reserves” herein.
(3) Based on amortizing debt service payments. Based on the current interest only payments, the Underwritten NOI DSCR and Underwritten NCF DSCR are 2.11x and 2.03x, respectively.
|
||
|
Financial Information
|
|||||
|
Cut-off Date Balance / Sq. Ft.:
|
$175
|
||||
|
Balloon Balance / Sq. Ft.:
|
$151
|
||||
|
Cut-off Date LTV:
|
62.4%
|
||||
|
Balloon LTV:
|
53.8%
|
||||
|
Underwritten NOI DSCR(3):
|
1.64x
|
||||
|
Underwritten NCF DSCR(3):
|
1.58x
|
||||
|
Underwritten NOI Debt Yield:
|
10.3%
|
||||
|
Underwritten NCF Debt Yield:
|
10.0%
|
||||
|
Underwritten NOI Debt Yield at Balloon:
|
12.0%
|
||||
|
Underwritten NCF Debt Yield at Balloon:
|
11.6%
|
||||
The depositor has filed a registration statement (including the prospectus) with the SEC (SEC File No. 333-193376) for the offering to which this communication relates. Before you invest, you should read the prospectus in the registration statement and other documents the depositor has filed with the SEC for more complete information about the depositor, the issuing trust and this offering. You may get these documents for free by visiting EDGAR on the SEC website at www.sec.gov. Alternatively, the depositor or Deutsche Bank Securities Inc., any other underwriter, or any dealer participating in this offering will arrange to send you the prospectus if you request it by calling toll-free 1-800-503-4611 or by email to the following address: prospectus.cpdg@db.com. The offered certificates referred to in these materials, and the asset pool backing them, are subject to modification or revision (including the possibility that one or more classes of certificates may be split, combined or eliminated at any time prior to issuance or availability of a final prospectus) and are offered on a “when, as and if issued” basis. You understand that, when you are considering the purchase of these certificates, a contract of sale will come into being no sooner than the date on which the relevant class has been priced and we have verified the allocation of certificates to be made to you; any “indications of interest” expressed by you, and any “soft circles” generated by us, will not create binding contractual obligations for you or us.
43
|
9350 and 9380 Excelsior Boulevard
Hopkins, MN 55343
|
Collateral Asset Summary – Loan No. 3
Excelsior Crossings
|
Cut-off Date Balance:
Cut-off Date LTV:
U/W NCF DSCR:
U/W NOI Debt Yield:
|
$88,000,000
62.4%
1.58x
10.3%
|
|
Tenant Summary
|
||||||||
|
Tenant
|
Ratings
(Fitch/Moody’s/S&P)
|
Net Rentable
Area (Sq. Ft.)
|
% of Net
Rentable Area
|
U/W Base
Rent PSF
|
% of Total
U/W Base Rent
|
Lease
Expiration
|
||
|
Cargill
|
A/A2/A
|
501,603
|
100.0%
|
$18.33
|
100.0%
|
9/30/2020(1)
|
||
|
Total Occupied Collateral
|
501,603
|
100.0%
|
$18.33
|
100.0%
|
||||
|
Vacant
|
0
|
0.0%
|
||||||
|
Total
|
501,603
|
100.0%
|
||||||
|
(1)
|
Cargill has three five-year renewal options at 95% of the market rate which are exercisable between 15 and 30 months prior to the expiration of the then current term. The tenant has no termination options.
|
|
Lease Rollover Schedule
|
|||||||||||||||||||||||
|
Year
|
# of
Leases
Expiring
|
Total
Expiring
Sq. Ft.
|
% of Total Sq.
Ft. Expiring
|
Cumulative
Sq. Ft.
Expiring
|
Cumulative % of
Sq. Ft. Expiring
|
Annual U/W
Base Rent Per Sq. Ft.
|
% U/W
Base Rent Rolling
|
Cumulative %
of U/W
Base Rent
|
|||||||||||||||
|
MTM
|
0
|
0
|
0.0%
|
0
|
0.0%
|
$0.00
|
0.0%
|
0.0%
|
|||||||||||||||
|
2014
|
0
|
0
|
0.0%
|
0
|
0.0%
|
$0.00
|
0.0%
|
0.0%
|
|||||||||||||||
|
2015
|
0
|
0
|
0.0%
|
0
|
0.0%
|
$0.00
|
0.0%
|
0.0%
|
|||||||||||||||
|
2016
|
0
|
0
|
0.0%
|
0
|
0.0%
|
$0.00
|
0.0%
|
0.0%
|
|||||||||||||||
|
2017
|
0
|
0
|
0.0%
|
0
|
0.0%
|
$0.00
|
0.0%
|
0.0%
|
|||||||||||||||
|
2018
|
0
|
0
|
0.0%
|
0
|
0.0%
|
$0.00
|
0.0%
|
0.0%
|
|||||||||||||||
|
2019
|
0
|
0
|
0.0%
|
0
|
0.0%
|
$0.00
|
0.0%
|
0.0%
|
|||||||||||||||
|
2020
|
2
|
501,603
|
100.0%
|
501,603
|
100.0%
|
$18.33
|
100.0%
|
100.0%
|
|||||||||||||||
|
2021
|
0
|
0
|
0.0%
|
501,603
|
100.0%
|
$0.00
|
0.0%
|
100.0%
|
|||||||||||||||
|
2022
|
0
|
0
|
0.0%
|
501,603
|
100.0%
|
$0.00
|
0.0%
|
100.0%
|
|||||||||||||||
|
2023
|
0
|
0
|
0.0%
|
501,603
|
100.0%
|
$0.00
|
0.0%
|
100.0%
|
|||||||||||||||
|
2024
|
0
|
0
|
0.0%
|
501,603
|
100.0%
|
$0.00
|
0.0%
|
100.0%
|
|||||||||||||||
|
Thereafter
|
0
|
0
|
0.0%
|
501,603
|
100.0%
|
$0.00
|
0.0%
|
100.0%
|
|||||||||||||||
|
Vacant
|
NAP
|
0
|
0.0%
|
501,603
|
100.0%
|
NAP
|
NAP
|
||||||||||||||||
|
Total / Wtd. Avg.
|
2
|
501,603
|
100.0%
|
$18.33
|
100.0%
|
||||||||||||||||||
The Loan. The Excelsior Crossings loan (the “Excelsior Crossings Loan”) is a fixed rate loan secured by the borrower’s fee simple interest in two seven-story Class A office buildings located 9350 and 9380 Excelsior Boulevard in Hopkins, Minnesota (the “Excelsior Crossings Property”) with an original principal balance of $88.0 million. The Excelsior Crossings Loan has a 10-year term and amortizes on a 30-year schedule after an initial two-year interest only period. The Excelsior Crossings Loan accrues interest at a fixed rate equal to 4.8350% and has a cut-off date balance of $88.0 million. Loan proceeds, along with approximately $35.5 million in equity from the sponsor, were used to purchase the Excelsior Crossings Property for $122.75 million and pay closing costs of approximately $0.7 million. Based on the appraised value of $141.0 million as of December 3, 2013, the cut-off date LTV ratio is 62.4%. The most recent prior financing of the Excelsior Crossings Property was not included a securitization.
|
Sources and Uses
|
|||||||
|
Sources
|
Proceeds
|
% of Total
|
Uses
|
Proceeds
|
% of Total
|
||
|
Loan Amount
|
$88,000,000
|
71.3%
|
Purchase Price
|
$122,750,000
|
99.4%
|
||
|
Sponsor Equity
|
$35,460,755
|
28.7%
|
Closing Costs
|
$710,755
|
0.6%
|
||
|
Total Sources
|
$123,460,755
|
100.0%
|
Total Uses
|
$123,460,755
|
100.0%
|
||
The Borrower / Sponsor. The borrower, ColFin Midwest NNN Investor, LLC, is a single purpose Delaware limited liability company structured to be bankruptcy-remote, with two independent directors in its organizational structure. The sponsor of the borrower and the nonrecourse carve-out guarantor is Colony Financial, Inc. Colony Financial, Inc. is a real estate investment and finance company that is focused on acquiring, originating and managing a diversified portfolio of real estate-related debt and equity investments. The company is externally managed and advised by Colony Financial Manager, LLC, a wholly-owned subsidiary of Colony Capital, LLC, a privately held global real estate investment firm. As of September 30, 2013, Colony Financial, Inc. had total assets of approximately $2.1 billion and net worth and liquidity of approximately $1.5 billion and approximately $334.6 million, respectively.
The depositor has filed a registration statement (including the prospectus) with the SEC (SEC File No. 333-193376) for the offering to which this communication relates. Before you invest, you should read the prospectus in the registration statement and other documents the depositor has filed with the SEC for more complete information about the depositor, the issuing trust and this offering. You may get these documents for free by visiting EDGAR on the SEC website at www.sec.gov. Alternatively, the depositor or Deutsche Bank Securities Inc., any other underwriter, or any dealer participating in this offering will arrange to send you the prospectus if you request it by calling toll-free 1-800-503-4611 or by email to the following address: prospectus.cpdg@db.com. The offered certificates referred to in these materials, and the asset pool backing them, are subject to modification or revision (including the possibility that one or more classes of certificates may be split, combined or eliminated at any time prior to issuance or availability of a final prospectus) and are offered on a “when, as and if issued” basis. You understand that, when you are considering the purchase of these certificates, a contract of sale will come into being no sooner than the date on which the relevant class has been priced and we have verified the allocation of certificates to be made to you; any “indications of interest” expressed by you, and any “soft circles” generated by us, will not create binding contractual obligations for you or us.
44
|
9350 and 9380 Excelsior Boulevard
Hopkins, MN 55343
|
Collateral Asset Summary – Loan No. 3
Excelsior Crossings
|
Cut-off Date Balance:
Cut-off Date LTV:
U/W NCF DSCR:
U/W NOI Debt Yield:
|
$88,000,000
62.4%
1.58x
10.3%
|
The Property. The Excelsior Crossings Property consists of two seven-story Class A office buildings totaling 501,603 sq. ft. located approximately 10 miles from the Minneapolis/St. Paul central business district in Hopkins, Minnesota. The Excelsior Crossings Property is located approximately a minute’s drive from I-169, which provides north-south access throughout the Twin Cities metropolitan area. There is currently a Southwest Corridor light rail extension project under construction which will include a stop across the street from the Excelsior Crossings Property. This stop is expected to be in operation by 2017 and the light rail will provide access to the Minneapolis central business district as well as to the Minneapolis/St. Paul International Airport.
Constructed in 2008 and 2009 by Opus Corporation, the Excelsior Crossings Property is LEED Gold certified. Parking is provided via 2,216 ramp and surface parking spaces, which provide a parking ratio of 4.42 parking spaces per 1,000 sq. ft. The Excelsior Crossings Property is part of a larger 756,500 sq. ft. campus which contains a third building located at 9320 Excelsior Boulevard, which is leased to Cargill pursuant to a sale-leaseback agreement that was executed in 2012 and is not part of the collateral for the Excelsior Crossings Loan. The campus features a full service cafeteria, fitness center with showers and locker facilities, a high efficiency HVAC system, indirect lighting throughout, UPS power back up, a dual electrical feed and a 300 seat-auditorium. All three buildings on the campus are connected via a link system on the first floors and lower levels. Cargill consolidated space at several different locations to move into the Excelsior Crossings Property in 2008 and 2009.
As of March 6, 2014, the Excelsior Crossings Property is 100.0% leased to Cargill.
Environmental Matters. The Phase I environmental report dated November 25, 2013 recommended no further action at the Excelsior Crossings Property.
Tenant. The Excelsior Crossings Property is fully leased to Cargill (rated A/A2/A by Fitch/Moody’s/S&P) pursuant to two separate leases (a lease for Building 9350 (the “Building 9350 Lease”) and a lease for Building 9380 (the “Building 9380 Lease,” and together with the Building 9350 Lease, the “Cargill Leases”)). Founded in 1865, Cargill is a privately-held international producer and marketer of food, agricultural, financial and industrial products and services. Cargill has 142,000 employees in 67 countries and is headquartered in Wayzata, Minnesota, less than 10 miles from the Excelsior Crossings Property. In fiscal year 2013, Cargill reported sales of approximately $136.7 billion and net earnings of approximately $2.3 billion.
Each of the Cargill Leases is a triple net lease having a term that expires in September 2020. The tenant uses its space at the Excelsior Crossings Property as its operational headquarters and the campus accommodates 3,050 employees. Cargill has three five-year renewal options at 95% of the market rate which are exercisable between 15 and 30 months prior to the expiration of the then current term. The tenant has no termination options.
The Market. The Excelsior Crossings Property is located in Hopkins, Minnesota, a small inner ring suburb of Minneapolis. The Twin Cities region is the largest urban area in the upper Midwest, with a population of approximately 3.4 million people in a 13 county area. Minneapolis/St. Paul has a relatively diverse economic base which allows the metropolitan area to consistently remain under the national average unemployment rate. Nineteen Fortune 500 public companies are headquartered in Minnesota including Target, 3M, General Mills and Ameriprise Financial. As of August 2013, the metropolitan area’s unemployment rate was 4.7%, which was lower than the Minnesota rate of 4.8% and the overall national rate of 7.3%. The metropolitan area serves as a distribution hub for the upper Midwest as well as a governmental and cultural center.
The Minneapolis office market ended the fourth quarter of 2013 with a vacancy rate of 9.4% overall and 7.9% for Class A. Average asking rents were $18.03 PSF overall, which represented a 6.4% increase over the previous quarter. For Class A office, average asking rents were $23.22, which represented an increase of 1.4% over the previous quarter. Net absorption was positive at 314,683 sq. ft. during the quarter for the overall market and positive at 8,476 sq. ft. for Class A space.
The Excelsior Crossings Property is located within the I-394 office submarket which as of the fourth quarter of 2013 had a vacancy rate of 7.0% overall and 9.1% for Class A. Average asking rents were $20.79 PSF overall and $23.89 PSF for Class A space. Net absorption for 2013 was positive at 176,375 sq. ft. for the overall market and negative at 73,878 sq. ft. for Class A space.
The depositor has filed a registration statement (including the prospectus) with the SEC (SEC File No. 333-193376) for the offering to which this communication relates. Before you invest, you should read the prospectus in the registration statement and other documents the depositor has filed with the SEC for more complete information about the depositor, the issuing trust and this offering. You may get these documents for free by visiting EDGAR on the SEC website at www.sec.gov. Alternatively, the depositor or Deutsche Bank Securities Inc., any other underwriter, or any dealer participating in this offering will arrange to send you the prospectus if you request it by calling toll-free 1-800-503-4611 or by email to the following address: prospectus.cpdg@db.com. The offered certificates referred to in these materials, and the asset pool backing them, are subject to modification or revision (including the possibility that one or more classes of certificates may be split, combined or eliminated at any time prior to issuance or availability of a final prospectus) and are offered on a “when, as and if issued” basis. You understand that, when you are considering the purchase of these certificates, a contract of sale will come into being no sooner than the date on which the relevant class has been priced and we have verified the allocation of certificates to be made to you; any “indications of interest” expressed by you, and any “soft circles” generated by us, will not create binding contractual obligations for you or us.
45
|
9350 and 9380 Excelsior Boulevard
Hopkins, MN 55343
|
Collateral Asset Summary – Loan No. 3
Excelsior Crossings
|
Cut-off Date Balance:
Cut-off Date LTV:
U/W NCF DSCR:
U/W NOI Debt Yield:
|
$88,000,000
62.4%
1.58x
10.3%
|
The appraiser identified seven comparable office leases which are presented in the subsequent chart.
|
Lease Comparables(1)
|
||||||||||||
|
Property
|
Tenant
|
Year Built
|
Lease Area
(Sq. Ft.)
|
Base
Rent (PSF) |
Lease
Term (yrs) |
|||||||
|
Excelsior Crossings Property(2)
|
Cargill
|
2008-2009
|
501,603
|
$18.33
|
11.9
|
|||||||
|
Norman Point II
|
GSA
|
2006
|
244,561
|
$20.55
|
5.0
|
|||||||
|
Interchange North
|
Aetna
|
1980
|
43,308
|
$13.75
|
3.0
|
|||||||
|
Cargill Building
|
Cargill
|
1998
|
148,220
|
$14.50
|
5.0
|
|||||||
|
MarketPointe II
|
CB Richard Ellis
|
2008
|
70,000
|
$19.00
|
10.0
|
|||||||
|
ATK Facility
|
ATK
|
2008
|
107,209
|
$19.76
|
15.0
|
|||||||
|
XATA Corporation Building
|
XATA Corporation
|
1986
|
26,791
|
$14.07
|
7.0
|
|||||||
|
Windsor Plaza
|
Virtual Radiologic
|
2007
|
70,000
|
$20.80
|
10.0
|
|||||||
|
(1)
|
Source: Appraisal.
|
|
(2)
|
Based on rent roll dated March 6, 2014.
|
The appraiser determined the market rent for the Excelsior Crossings Property to be $19.00 PSF.
Cash Flow Analysis.
|
Cash Flow Analysis
|
|||||
|
2011
|
2012
|
T-12 10/31/2013
|
U/W
|
U/W PSF
|
|
|
Base Rent(1)
|
$8,709,560
|
$8,822,621
|
$9,000,462
|
$9,586,397
|
$19.11
|
|
Value of Vacant Space
|
0
|
0
|
0
|
0
|
0
|
|
Gross Potential Rent
|
$8,709,560
|
$8,822,621
|
$9,000,462
|
$9,586,397
|
$19.11
|
|
Total Recoveries
|
31,253
|
33,343
|
43,786
|
219,658
|
0.44
|
|
Total Other Income
|
1,000
|
1,111
|
0
|
0
|
0
|
|
Less: Vacancy(2)
|
0
|
0
|
0
|
(490,303)
|
(0.98)
|
|
Effective Gross Income
|
$8,741,813
|
$8,857,075
|
$9,044,248
|
$9,315,752
|
$18.57
|
|
Total Operating Expenses
|
31,792
|
34,311
|
41,770
|
219,697
|
0.44
|
|
Net Operating Income
|
$8,710,021
|
$8,822,764
|
$9,002,478
|
$9,096,055
|
$18.13
|
|
TI/LC
|
0
|
0
|
0
|
252,718
|
0.50
|
|
Capital Expenditures
|
0
|
0
|
0
|
75,240
|
0.15
|
|
Net Cash Flow
|
$8,710,021
|
$8,822,764
|
$9,002,478
|
$8,768,097
|
$17.48
|
|
(1)
|
U/W Base Rent includes $391,592 in step rent which represents the straight line of average rent underwritten throughout Cargill’s lease term.
|
|
(2)
|
U/W Vacancy represents 5.0% of gross income.
|
Property Management. Currently, there is no third party manager engaged to manage the Excelsior Crossings Property (and, instead, Cargill manages and operates the Excelsior Crossings Property in accordance with its Cargill Leases).
Lockbox / Cash Management. The Excelsior Crossings Loan is structured with a hard lockbox and in place cash management. The borrower sent a tenant direction letter to Cargill instructing the tenant to deposit all rents and payments into the lockbox account controlled by the lender. All funds in the lockbox account are swept daily to a cash management account under the control of the lender and disbursed in accordance with the Excelsior Crossings Loan documents.
Additionally, all excess cash will be swept into a lender controlled account (i) upon an event of default, (ii) during the continuance of a Lease Sweep Period (as defined below) or (iii) if there exists a Low Debt Service Period (as defined herein).
A “Low Debt Service Period” commences if the DSCR, as determined by the lender, is less than 1.25x and ends if the DSCR, as determined by the lender, is at least 1.25x for two consecutive quarters.
Initial Reserves. None.
The depositor has filed a registration statement (including the prospectus) with the SEC (SEC File No. 333-193376) for the offering to which this communication relates. Before you invest, you should read the prospectus in the registration statement and other documents the depositor has filed with the SEC for more complete information about the depositor, the issuing trust and this offering. You may get these documents for free by visiting EDGAR on the SEC website at www.sec.gov. Alternatively, the depositor or Deutsche Bank Securities Inc., any other underwriter, or any dealer participating in this offering will arrange to send you the prospectus if you request it by calling toll-free 1-800-503-4611 or by email to the following address: prospectus.cpdg@db.com. The offered certificates referred to in these materials, and the asset pool backing them, are subject to modification or revision (including the possibility that one or more classes of certificates may be split, combined or eliminated at any time prior to issuance or availability of a final prospectus) and are offered on a “when, as and if issued” basis. You understand that, when you are considering the purchase of these certificates, a contract of sale will come into being no sooner than the date on which the relevant class has been priced and we have verified the allocation of certificates to be made to you; any “indications of interest” expressed by you, and any “soft circles” generated by us, will not create binding contractual obligations for you or us.
46
|
9350 and 9380 Excelsior Boulevard
Hopkins, MN 55343
|
Collateral Asset Summary – Loan No. 3
Excelsior Crossings
|
Cut-off Date Balance:
Cut-off Date LTV:
U/W NCF DSCR:
U/W NOI Debt Yield:
|
$88,000,000
62.4%
1.58x
10.3%
|
Ongoing Reserves. On a monthly basis, the borrower is required to deposit reserves of (i) $10,450 into a replacement reserve account and (ii) $10,450 into a reserve for future tenant improvements and leasing commissions. Reserves for taxes and insurance are waived so long as, among other things, (i) the Cargill leases are in full force, (ii) Cargill is obligated under the Cargill leases to pay all taxes directly, (iii) in the case of the insurance reserve, Cargill reimburses its landlord for insurance premiums and pays such amounts, (iv) no monetary event of default is continuing under the Cargill leases and (v) the credit rating of Cargill remains at or above BBB+ (although the lender may waive the condition described in (v)).
In addition, during the continuance of a Lease Sweep Period (as defined herein), with respect to any of (i) the Cargill lease of Building 9350, (ii) the Cargill lease of Building 9380 or (iii) any lease that, either individually, or when taken together with any other lease with the same tenant or its affiliates, covers at least 245,000 sq. ft. (a “Lease Sweep Lease”), all excess funds will be swept into a lease sweep reserve account to be held as additional collateral for the Excelsior Crossings Loan. Provided there is no event of default, and conditions to disbursement (as more fully provided for in the Excelsior Crossings Loan documents) are satisfied, funds in the lease sweep reserve account will be made available to the borrower to pay for certain tenant improvements, leasing commissions and other costs incurred by the borrower in connection with the re-tenanting of the space covered by the respective lease (with excess funds being released as more fully provided in, and on satisfaction of the conditions set forth in, the Excelsior Crossings Loan documents).
A “Lease Sweep Period” will commence on the monthly payment date following the occurrence of any of the following with respect to a tenant under a Lease Sweep Lease: (a) upon the earlier of (i) the date that is 15 months prior to the expiration of any Lease Sweep Lease, or (ii) the final date required under each Lease Sweep Lease by which the tenant is required to give notice of its exercise of a renewal option thereunder (and such renewal has not been so exercised); (b) the date that a Lease Sweep Lease (or a “material portion” (defined as 25% or more)) is surrendered, cancelled or terminated prior to its then current expiration date or the borrower receives notice by such tenant of its intent to surrender, cancel, terminate or not renew all or a material portion of the space leased under its Lease Sweep Lease; (c) if such tenant has ceased or intends to cease operating its business at all or substantially all of its space at the Excelsior Crossings Property; (d) upon a default under a Lease Sweep Lease by the tenant beyond any applicable notice and cure period, (e) upon a bankruptcy or insolvency proceeding of a tenant under a Lease Sweep Lease or its parent, (f) upon a decline in the credit rating of a tenant under a Lease Sweep Lease (or its parent entity) below “BBB+” or equivalent by any of the rating agencies or (g) assuming that the conditions to curing a Lease Sweep Period that commenced as described in the immediately preceding subclause (f) have occurred (which conditions to cure are more fully described below), upon a decline in the credit rating of the tenant under a Lease Sweep Lease (or its parent entity) below “BBB-”.
If a Lease Sweep Period commenced due to a credit rating decline (as described in clause (f) above), the Lease Sweep Period will terminate if the credit rating of the related tenant is restored to “BBB+” or equivalent or, so long as the tenant under the Lease Sweep Lease’s (or its parent entity’s) credit rating has not declined below “BBB-” or equivalent, by any of the rating agencies, once a total of $6,000,000 has been swept into the lease sweep reserve (and will only recommence upon a further decline in the credit rating below “BBB-”). In addition, following the expiration of the defeasance lockout period, the borrower has the option, within 90 days of any initial downgrade below BBB+, to partially defease the Excelsior Crossings Loan in the amount of $6,000,000 (provided that such partial defeasance will not include the release of any real estate collateral but will include delivery of a defeasance note with an original principal balance of $6,000,000), and upon the consummation of such partial defeasance, the Lease Sweep Period will terminate until such time, if applicable, that the credit rating of the applicable tenant has declined below “BBB-”.
Current Mezzanine or Subordinate Indebtedness. None.
Future Mezzanine or Subordinate Indebtedness Permitted. None.
The depositor has filed a registration statement (including the prospectus) with the SEC (SEC File No. 333-193376) for the offering to which this communication relates. Before you invest, you should read the prospectus in the registration statement and other documents the depositor has filed with the SEC for more complete information about the depositor, the issuing trust and this offering. You may get these documents for free by visiting EDGAR on the SEC website at www.sec.gov. Alternatively, the depositor or Deutsche Bank Securities Inc., any other underwriter, or any dealer participating in this offering will arrange to send you the prospectus if you request it by calling toll-free 1-800-503-4611 or by email to the following address: prospectus.cpdg@db.com. The offered certificates referred to in these materials, and the asset pool backing them, are subject to modification or revision (including the possibility that one or more classes of certificates may be split, combined or eliminated at any time prior to issuance or availability of a final prospectus) and are offered on a “when, as and if issued” basis. You understand that, when you are considering the purchase of these certificates, a contract of sale will come into being no sooner than the date on which the relevant class has been priced and we have verified the allocation of certificates to be made to you; any “indications of interest” expressed by you, and any “soft circles” generated by us, will not create binding contractual obligations for you or us.
47
|
9350 and 9380 Excelsior Boulevard
Hopkins, MN 55343
|
Collateral Asset Summary – Loan No. 3
Excelsior Crossings
|
Cut-off Date Balance:
Cut-off Date LTV:
U/W NCF DSCR:
U/W NOI Debt Yield:
|
$88,000,000
62.4%
1.58x
10.3%
|

The depositor has filed a registration statement (including the prospectus) with the SEC (SEC File No. 333-193376) for the offering to which this communication relates. Before you invest, you should read the prospectus in the registration statement and other documents the depositor has filed with the SEC for more complete information about the depositor, the issuing trust and this offering. You may get these documents for free by visiting EDGAR on the SEC website at www.sec.gov. Alternatively, the depositor or Deutsche Bank Securities Inc., any other underwriter, or any dealer participating in this offering will arrange to send you the prospectus if you request it by calling toll-free 1-800-503-4611 or by email to the following address: prospectus.cpdg@db.com. The offered certificates referred to in these materials, and the asset pool backing them, are subject to modification or revision (including the possibility that one or more classes of certificates may be split, combined or eliminated at any time prior to issuance or availability of a final prospectus) and are offered on a “when, as and if issued” basis. You understand that, when you are considering the purchase of these certificates, a contract of sale will come into being no sooner than the date on which the relevant class has been priced and we have verified the allocation of certificates to be made to you; any “indications of interest” expressed by you, and any “soft circles” generated by us, will not create binding contractual obligations for you or us.
48
|
9350 and 9380 Excelsior Boulevard
Hopkins, MN 55343
|
Collateral Asset Summary – Loan No. 3
Excelsior Crossings
|
Cut-off Date Balance:
Cut-off Date LTV:
U/W NCF DSCR:
U/W NOI Debt Yield:
|
$88,000,000
62.4%
1.58x
10.3%
|

The depositor has filed a registration statement (including the prospectus) with the SEC (SEC File No. 333-193376) for the offering to which this communication relates. Before you invest, you should read the prospectus in the registration statement and other documents the depositor has filed with the SEC for more complete information about the depositor, the issuing trust and this offering. You may get these documents for free by visiting EDGAR on the SEC website at www.sec.gov. Alternatively, the depositor or Deutsche Bank Securities Inc., any other underwriter, or any dealer participating in this offering will arrange to send you the prospectus if you request it by calling toll-free 1-800-503-4611 or by email to the following address: prospectus.cpdg@db.com. The offered certificates referred to in these materials, and the asset pool backing them, are subject to modification or revision (including the possibility that one or more classes of certificates may be split, combined or eliminated at any time prior to issuance or availability of a final prospectus) and are offered on a “when, as and if issued” basis. You understand that, when you are considering the purchase of these certificates, a contract of sale will come into being no sooner than the date on which the relevant class has been priced and we have verified the allocation of certificates to be made to you; any “indications of interest” expressed by you, and any “soft circles” generated by us, will not create binding contractual obligations for you or us.
49
|
Colorado
|
Collateral Asset Summary – Loan No. 4
AMC Portfolio Pool II
|
Cut-off Date Balance:
Cut-off Date LTV:
U/W NCF DSCR:
U/W NOI Debt Yield:
|
$87,807,474
74.8%
1.26x
8.1%
|

The depositor has filed a registration statement (including the prospectus) with the SEC (SEC File No. 333-193376) for the offering to which this communication relates. Before you invest, you should read the prospectus in the registration statement and other documents the depositor has filed with the SEC for more complete information about the depositor, the issuing trust and this offering. You may get these documents for free by visiting EDGAR on the SEC website at www.sec.gov. Alternatively, the depositor or Deutsche Bank Securities Inc., any other underwriter, or any dealer participating in this offering will arrange to send you the prospectus if you request it by calling toll-free 1-800-503-4611 or by email to the following address: prospectus.cpdg@db.com. The offered certificates referred to in these materials, and the asset pool backing them, are subject to modification or revision (including the possibility that one or more classes of certificates may be split, combined or eliminated at any time prior to issuance or availability of a final prospectus) and are offered on a “when, as and if issued” basis. You understand that, when you are considering the purchase of these certificates, a contract of sale will come into being no sooner than the date on which the relevant class has been priced and we have verified the allocation of certificates to be made to you; any “indications of interest” expressed by you, and any “soft circles” generated by us, will not create binding contractual obligations for you or us.
50
|
Colorado
|
Collateral Asset Summary – Loan No. 4
AMC Portfolio Pool II
|
Cut-off Date Balance:
Cut-off Date LTV:
U/W NCF DSCR:
U/W NOI Debt Yield:
|
$87,807,474
74.8%
1.26x
8.1%
|
|
Mortgage Loan Information
|
Property Information
|
||||||
|
Loan Seller:
|
GACC
|
Single Asset / Portfolio:
|
Portfolio of three properties
|
||||
|
Loan Purpose:
|
Acquisition
|
Property Type:
|
Manufactured Housing Community
|
||||
|
Sponsor:
|
RHP Properties, Inc.; NorthStar Realty
|
Collateral:
|
Fee Simple
|
||||
|
Finance Corp.
|
Location:
|
Colorado
|
|||||
|
Borrower:
|
AMC Pine Lakes Ranch LLC; AMC
|
Year Built / Renovated:
|
Various / NAP
|
||||
|
Countryside Village Denver LLC; AMC
|
Total Pads:
|
1,417
|
|||||
|
Countryside Village Longmont LLC
|
Property Management:
|
Newbury Management Company
|
|||||
|
Original Balance:
|
$87,807,474
|
Underwritten NOI:
|
$7,139,637
|
||||
|
Cut-off Date Balance:
|
$87,807,474
|
Underwritten NCF:
|
$7,033,362
|
||||
|
% by Initial UPB:
|
7.1%
|
Appraised Value:
|
$117,360,000
|
||||
|
Interest Rate:
|
4.9150%
|
Appraisal Date:
|
December 2, 2013
|
||||
|
Payment Date:
|
1st of each month
|
||||||
|
First Payment Date:
|
February 1, 2014
|
Historical NOI
|
|||||
|
Maturity Date:
|
January 1, 2024
|
Most Recent NOI:
|
$7,014,004 (T-12 September 30, 2013)
|
||||
|
Amortization:
|
Interest only for first 47 months; 360
|
2012 NOI:
|
$6,736,442 (December 31, 2012)
|
||||
|
months thereafter
|
2011 NOI:
|
$6,576,525 (December 31, 2011)
|
|||||
|
Additional Debt(1):
|
Future Mezzanine Debt Permitted
|
2010 NOI:
|
$6,337,851 (December 31, 2010)
|
||||
|
Call Protection(2):
|
L(26), YM1(87), O(7)
|
||||||
|
Lockbox / Cash Management:
|
Springing Soft / Springing
|
Historical Occupancy(5)
|
|||||
|
Current Occupancy:
|
92.2% (November 1, 2013)
|
||||||
|
Reserves(3)
|
2012 Occupancy:
|
88.1% (December 31, 2012)
|
|||||
|
Initial
|
Monthly
|
2011 Occupancy:
|
86.3% (December 31, 2011)
|
||||
|
Taxes:
|
$204,689
|
$18,608
|
2010 Occupancy:
|
86.1% (December 31, 2010)
|
|||
|
Insurance:
|
$0
|
Springing
|
(1) See “Future Mezzanine or Subordinate Indebtedness Permitted” herein.
(2) Partial release and substitution are permitted. See “Partial Release” and “Substitution of Collateral” herein.
(3) See “Initial Reserves” and “Ongoing Reserves” herein.
(4) Based on amortizing debt service payments. Based on the current interest only payments, the Underwritten NOI DSCR and Underwritten NCF DSCR are 1.63x and 1.61x, respectively.
(5) Occupancy includes 143 sponsor owned homes, which represent 10.1% of the 1,417 total pads.
|
||||
|
Replacement:
|
$251,656
|
Springing
|
|||||
|
Required Repairs:
|
$209,220
|
NAP
|
|||||
|
Financial Information
|
|||||||
|
Cut-off Date Balance / Pad:
|
$61,967
|
||||||
|
Balloon Balance / Pad:
|
$55,846
|
||||||
|
Cut-off Date LTV:
|
74.8%
|
||||||
|
Balloon LTV:
|
67.4%
|
||||||
|
Underwritten NOI DSCR(4):
|
1.27x
|
||||||
|
Underwritten NCF DSCR(4):
|
1.26x
|
||||||
|
Underwritten NOI Debt Yield:
|
8.1%
|
||||||
|
Underwritten NCF Debt Yield:
|
8.0%
|
||||||
|
Underwritten NOI Debt Yield at Balloon:
|
9.0%
|
||||||
|
Underwritten NCF Debt Yield at Balloon:
|
8.9%
|
||||||
|
Property Summary
|
|||||||||||||||||
|
Allocated
|
|||||||||||||||||
|
Property Name
|
Location
|
Pads
|
Year Built / Renovated
|
Loan Amount
|
Appraised Value
|
Occupancy(1)
|
|||||||||||
|
Pine Lakes Ranch
|
Thornton, CO
|
762
|
1970-1997 / NAP
|
$45,661,981
|
$61,030,000
|
87.0%
|
|||||||||||
|
Countryside Village of Denver
|
Federal Heights, CO
|
345
|
1973 / NAP
|
$22,363,373
|
$29,890,000
|
96.8%
|
|||||||||||
|
Countryside Village of Longmont
|
Longmont, CO
|
310
|
1972 / NAP
|
$19,782,120
|
$26,440,000
|
100.0%
|
|||||||||||
|
Total / Wtd. Avg.
|
1,417
|
$87,807,474
|
$117,360,000
|
92.2%
|
|||||||||||||
(1) Based on the November 1, 2013 rent roll. Occupancy includes 95 sponsor owned homes at Pine Lakes Ranch, 31 sponsor owned homes at Countryside Village of Denver and 17 sponsor owned homes at Countryside Village of Longmont for a total of 143 sponsor owned homes, which represents 10.1% of the 1,417 total pads. For additional information, see “The Properties” below.
The depositor has filed a registration statement (including the prospectus) with the SEC (SEC File No. 333-193376) for the offering to which this communication relates. Before you invest, you should read the prospectus in the registration statement and other documents the depositor has filed with the SEC for more complete information about the depositor, the issuing trust and this offering. You may get these documents for free by visiting EDGAR on the SEC website at www.sec.gov. Alternatively, the depositor or Deutsche Bank Securities Inc., any other underwriter, or any dealer participating in this offering will arrange to send you the prospectus if you request it by calling toll-free 1-800-503-4611 or by email to the following address: prospectus.cpdg@db.com. The offered certificates referred to in these materials, and the asset pool backing them, are subject to modification or revision (including the possibility that one or more classes of certificates may be split, combined or eliminated at any time prior to issuance or availability of a final prospectus) and are offered on a “when, as and if issued” basis. You understand that, when you are considering the purchase of these certificates, a contract of sale will come into being no sooner than the date on which the relevant class has been priced and we have verified the allocation of certificates to be made to you; any “indications of interest” expressed by you, and any “soft circles” generated by us, will not create binding contractual obligations for you or us.
51
|
Colorado
|
Collateral Asset Summary – Loan No. 4
AMC Portfolio Pool II
|
Cut-off Date Balance:
Cut-off Date LTV:
U/W NCF DSCR:
U/W NOI Debt Yield:
|
$87,807,474
74.8%
1.26x
8.1%
|
The Loan. The AMC Portfolio Pool II loan (the “AMC Portfolio Pool II Loan”) is a fixed rate loan secured by the borrowers’ fee simple interest in three manufactured housing communities totaling 1,417 pads all located in Colorado (the “AMC Portfolio Pool II Properties”) with an original principal balance of approximately $87.8 million. The AMC Portfolio Pool II Loan has a 10-year term and amortizes on a 30-year schedule after an initial 47-month interest only period. The AMC Portfolio Pool II Loan accrues interest at a fixed rate equal to 4.9150% and has a cut-off date balance of approximately $87.8 million. Loan proceeds, along with approximately $31.3 million of equity from the sponsors, were used to acquire the properties for an allocated purchase price of approximately $117.2 million. Based on the appraised value of approximately $117.4 million as of December 2, 2013, the cut-off date LTV ratio is 74.8%. The most recent prior financings of the AMC Portfolio Pool II Properties were included in (i) JPMCC 2003-CIBC7 with respect to the Pine Lakes Ranch property, (ii) JPMCC 2004-C1 with respect to the Countryside Village of Denver property and (iii) JPMCC 2004-CIBC8 with respect to the Countryside Village of Longmont property.
|
Sources and Uses
|
||||||
|
Sources
|
Proceeds
|
% of Total
|
Uses
|
Proceeds
|
% of Total
|
|
|
Loan Amount
|
$87,807,474
|
73.7%
|
Purchase Price
|
$117,214,672
|
98.4%
|
|
|
Sponsor Equity
|
$31,342,998
|
26.3%
|
Reserves
|
$665,565
|
0.6%
|
|
|
Closing Costs
|
$1,270,235
|
1.1%
|
||||
|
Total Sources
|
$119,150,472
|
100.0%
|
Total Uses
|
$119,150,472
|
100.0%
|
|
The Borrower / Sponsor. The borrowers, AMC Pine Lakes Ranch LLC, AMC Countryside Village Denver LLC and AMC Countryside Village Longmont LLC, are each a single purpose Delaware limited liability company structured to be bankruptcy-remote. The managing member of each of the borrowers is AMC Portfolio SPE-2, LLC, a single purpose Delaware limited liability company structured to be bankruptcy-remote with two independent directors in its organizational structure. The sponsors of the borrowers are RHP Properties, Inc. (“RHP”) and NorthStar Realty Finance Corp. (“NorthStar”), and the nonrecourse carve-out guarantor is Ross H. Partrich, the owner and CEO of RHP.
RHP is a real estate investment firm specializing in the acquisition and management of manufactured home and apartment communities. By number of communities, RHP is the nation’s second largest private owner and operator of manufactured housing, owning and managing approximately 212 communities with over 52,000 housing units and sites across 25 states, with a combined value of approximately $2.25 billion.
NorthStar is a publicly traded real estate investment trust (NYSE: NRF) with primary business activities that include origination, structuring, acquisition and managing of commercial real estate debt, commercial real estate securities and net lease properties. NorthStar had approximately $10.1 billion of real estate assets under management as of September 30, 2013.
The AMC Portfolio Pool II Properties were acquired in December 2013 as part of a 16-property portfolio acquisition by the sponsors. In connection with the acquisition, NorthStar obtained a $88,973,357 preferred equity interest in the borrowers related to the 16 manufactured housing community properties. This preferred equity position may be converted to mezzanine debt as described below under “Future Mezzanine or Subordinate Indebtedness Permitted”.
The Properties. The AMC Portfolio Pool II Properties consist of three manufactured housing communities totaling 1,417 pads located in Colorado. The AMC Portfolio Pool II Properties were developed between 1970 and 1997, and were acquired in December 2013 for an allocated purchase price of approximately $117.2 million. The AMC Portfolio Pool II Properties are part of a 16-property portfolio acquisition that includes 13 other manufactured housing community properties, which do not serve as collateral for the AMC Portfolio Pool II Loan. All three of the AMC Portfolio Pool II Properties are Class A communities. From 2010 to 2012, aggregate net operating income for the AMC Portfolio Pool II Properties increased 6.3% from approximately $6.3 million to approximately $6.7 million, while overall average occupancy has increased 6.1% from 86.1% in 2010 to 92.2% as of November 2013.
In addition, an affiliate of the borrowers (the “Excluded Homes Owner”) owns certain homes located on the pads owned by the borrowers. The equity owner of the Excluded Homes Owner pledged its equity interest in the Excluded Homes Owner to the lender as additional security for the AMC Portfolio Pool II Loan. Additionally, the borrowers agreed to prohibit the Excluded Homes Owner from selling the homes (except to third party tenants at the respective property), or otherwise removing these homes from their pad sites (other than as a result of a casualty or ordinary course de-commissioning). The Excluded Homes Owner is permitted to obtain a third party loan secured by any such homes, provided the loan is not greater than 80.0% of the fair market value of such homes. The sale (other than pursuant to a sale of such home to a tenant at such property) or removal (other than as a result of a casualty or de-commissioning in the ordinary course of business) of an excluded home or encumbering of any excluded home with a chattel loan other than as permitted by the AMC Portfolio Pool II Loan documents will trigger recourse to the guarantor for any loss incurred as a result of such action.
The depositor has filed a registration statement (including the prospectus) with the SEC (SEC File No. 333-193376) for the offering to which this communication relates. Before you invest, you should read the prospectus in the registration statement and other documents the depositor has filed with the SEC for more complete information about the depositor, the issuing trust and this offering. You may get these documents for free by visiting EDGAR on the SEC website at www.sec.gov. Alternatively, the depositor or Deutsche Bank Securities Inc., any other underwriter, or any dealer participating in this offering will arrange to send you the prospectus if you request it by calling toll-free 1-800-503-4611 or by email to the following address: prospectus.cpdg@db.com. The offered certificates referred to in these materials, and the asset pool backing them, are subject to modification or revision (including the possibility that one or more classes of certificates may be split, combined or eliminated at any time prior to issuance or availability of a final prospectus) and are offered on a “when, as and if issued” basis. You understand that, when you are considering the purchase of these certificates, a contract of sale will come into being no sooner than the date on which the relevant class has been priced and we have verified the allocation of certificates to be made to you; any “indications of interest” expressed by you, and any “soft circles” generated by us, will not create binding contractual obligations for you or us.
52
|
Colorado
|
Collateral Asset Summary – Loan No. 4
AMC Portfolio Pool II
|
Cut-off Date Balance:
Cut-off Date LTV:
U/W NCF DSCR:
U/W NOI Debt Yield:
|
$87,807,474
74.8%
1.26x
8.1%
|
Pine Lakes Ranch. The Pine Lakes Ranch property is located at 10201 Riverdale Road in Thornton, Colorado. Built in phases from 1970 to 1997, the property consists of 762 pads located on 135.0 acres, and as of November 1, 2013, is 87.0% occupied. The property is an all-age Class A community with amenities that include two clubhouses, three swimming pools, spa, a basketball court, playgrounds and picnic areas. Pine Lakes Ranch includes 95 sponsor owned homes.
Countryside Village of Denver. The Countryside Village of Denver property is located at 9850 Federal Boulevard in Federal Heights, Colorado. Built in 1973, the property consists of 345 pads located on 44.5 acres, and as of November 1, 2013, is 96.8% occupied. The property is an all-age Class A community with amenities that include a clubhouse, swimming pool, spa, playground and laundry. Countryside Village of Denver includes 31 sponsor owned homes.
Countryside Village of Longmont. The Countryside Village of Longmont property is located at 1400 South Collyer Street in Longmont, Colorado. Built in 1972, the property consists of 310 pads located on 38.3 acres, and as of November 1, 2013, is 100.0% occupied. The property is an all-age Class A community with amenities that include a clubhouse, swimming pool, spa, playground, library, fitness center, RV storage and organized activities for residents. Countryside Village of Longmont includes 17 sponsor owned homes.
Environmental Matters. The Phase I environmental reports dated December 18, 2013 recommended no further action other than continuing or implementing asbestos and lead based paint operation and maintenance plans at each of the AMC Portfolio Pool II Properties.
The Market. The AMC Portfolio Pool II Properties are located within the Denver metropolitan statistical area (the “Denver MSA”). The Denver MSA is the 8th most extensive and 22nd most populous in the United States and serves as an economic hub of the Rocky Mountain region. The largest employers in the Denver MSA include government employers such as the US Government and the State of Colorado, education employers such as the University of Colorado System and Denver Public Schools, healthcare employers such as HealthONE Corporation and manufacturing employers such as Lockheed Martin Corporation. All modes of transportation except water converge in the Denver MSA, providing both domestic and international access. Denver International Airport is the sixth busiest airport in the United States and the 10th busiest in the world. The Regional Transportation District services 41 municipalities and operates approximately 1,100 buses and 31 light rail trains.
In 2012, the Denver MSA had a reported population of over 2.6 million and has experienced population growth of 1.4% per year over the past decade. Approximately 50.7% of Colorado’s total population lives within the Denver MSA.
The Pine Lakes Ranch property is located in the northeastern portion of Thornton, Colorado, approximately nine miles northeast of the Denver central business district and is within three miles of both I-76 and I-25. The 2013 population within a three-mile radius of the Pine Lakes Ranch property was 94,429, a 2.9% increase since 2010, and the average household income within a three-mile radius was $67,372.
The Countryside Village of Denver property is located approximately nine miles northwest of the Denver central business district and is within two miles of both US 36 and I-25. The 2013 population within a three-mile radius of the Countryside Village of Denver property was 137,533, a 2.4% increase since 2010, and the average household income within a three-mile radius was $67,603.
The Countryside Village of Longmont property is located in the southern portion of the city of Longmont, less than a mile from Highway 119, which provides access to the city of Boulder, Colorado, and I-25. The 2013 population within a three-mile radius of the Countryside Village of Longmont property was 40,269, a 2.7% increase since 2010, and the average household income within a three-mile radius was $80,659.
The depositor has filed a registration statement (including the prospectus) with the SEC (SEC File No. 333-193376) for the offering to which this communication relates. Before you invest, you should read the prospectus in the registration statement and other documents the depositor has filed with the SEC for more complete information about the depositor, the issuing trust and this offering. You may get these documents for free by visiting EDGAR on the SEC website at www.sec.gov. Alternatively, the depositor or Deutsche Bank Securities Inc., any other underwriter, or any dealer participating in this offering will arrange to send you the prospectus if you request it by calling toll-free 1-800-503-4611 or by email to the following address: prospectus.cpdg@db.com. The offered certificates referred to in these materials, and the asset pool backing them, are subject to modification or revision (including the possibility that one or more classes of certificates may be split, combined or eliminated at any time prior to issuance or availability of a final prospectus) and are offered on a “when, as and if issued” basis. You understand that, when you are considering the purchase of these certificates, a contract of sale will come into being no sooner than the date on which the relevant class has been priced and we have verified the allocation of certificates to be made to you; any “indications of interest” expressed by you, and any “soft circles” generated by us, will not create binding contractual obligations for you or us.
53
|
Colorado
|
Collateral Asset Summary – Loan No. 4
AMC Portfolio Pool II
|
Cut-off Date Balance:
Cut-off Date LTV:
U/W NCF DSCR:
U/W NOI Debt Yield:
|
$87,807,474
74.8%
1.26x
8.1%
|
The subsequent chart displays historical occupancies for each of the AMC Portfolio Pool II Properties along with a comparison of average actual and market rent.
|
Historical Occupancy and Market Rent Summary
|
||||||||||||||||||
|
Property Name
|
City
|
Pads
|
2011
Occ. (1) |
2012
Occ. (1) |
Current
Occ. (1)(2)
|
Avg. Monthly Rent per Pad(2)
|
Comparable
Property Avg. Occupancy(3) |
Comparable Property
Rent(3) |
Appraisal Market Rent(3)
|
|||||||||
|
Pine Lakes Ranch
|
Thornton
|
762
|
81.0%
|
83.2%
|
87.0%
|
$566
|
89.2%
|
$535 - $613
|
$591
|
|||||||||
|
Countryside Village of Denver
|
Federal Heights
|
345
|
89.9%
|
89.6%
|
96.8%
|
$547
|
89.2%
|
$445 - $589
|
$588
|
|||||||||
|
Countryside Village of Longmont
|
Longmont
|
310
|
95.2%
|
98.7%
|
100.0%
|
$557
|
96.3%
|
$465 - $569
|
$570
|
|||||||||
|
Total / Wtd. Avg.
|
1,417
|
86.3%
|
88.1%
|
92.2%
|
$559
|
91.6%
|
$445 - $613
|
$586
|
||||||||||
|
(1)
|
Occupancy includes 143 sponsor owned homes, which represents 10.1% of the AMC Portfolio Pool II Properties’ total pads.
|
|
(2)
|
Based on occupied units per the November 1, 2013 rent roll.
|
|
(3)
|
Source: Appraisal.
|
Cash Flow Analysis.
|
Cash Flow Analysis
|
||||||
|
2010
|
2011
|
2012
|
T-12 9/30/2013
|
U/W
|
U/W per Pad
|
|
|
Gross Potential Rent(1)
|
$7,619,186
|
$7,913,727
|
$8,108,949
|
$8,594,190
|
$8,763,870
|
$6,185
|
|
Other Income
|
147,949
|
146,523
|
176,007
|
158,005
|
158,005
|
112
|
|
Utility Reimbursements
|
676,649
|
693,767
|
711,338
|
742,708
|
742,708
|
524
|
|
Less: Concessions & Credit Loss
|
0
|
0
|
0
|
(151,574)
|
(151,574)
|
(107)
|
|
Effective Gross Income
|
$8,443,784
|
$8,754,017
|
$8,996,294
|
$9,343,329
|
$9,513,009
|
$6,713
|
|
Total Operating Expenses
|
2,105,932
|
2,177,493
|
2,259,852
|
2,329,326
|
2,373,372
|
1,675
|
|
Net Operating Income
|
$6,337,851
|
$6,576,525
|
$6,736,442
|
$7,014,004
|
$7,139,637
|
$5,039
|
|
Capital Expenditures
|
106,275
|
106,275
|
106,275
|
106,275
|
106,275
|
75
|
|
Net Cash Flow
|
$6,231,576
|
$6,470,250
|
$6,630,167
|
$6,907,729
|
$7,033,362
|
$4,964
|
(1) U/W Gross Potential Rent is based on the in-place rent roll annualized and represents a vacancy of 7.8%.
Property Management. The AMC Portfolio Pool II Properties are managed by Newbury Management Company, an affiliate of the borrowers.
Lockbox / Cash Management. The AMC Portfolio Pool II Loan is structured with a springing soft lockbox and springing cash management. During a Cash Management Period (as defined below), the borrowers are required to deposit all rents and other payments received by the borrowers or the property manager into a clearing account within one business day of receipt. Funds deposited into the clearing account will be swept on a daily basis into a lender controlled deposit account and disbursed in accordance with the AMC Portfolio Pool II Loan documents.
Additionally, all excess cash will be swept into a lender controlled account during a Cash Management Period. So long as no event of default exists, at the borrowers’ request, the excess cash can be used to fund shortfalls in budgeted operating expenses.
A “Cash Management Period” will commence upon the occurrence of any of the following: (i) an event of default or (ii) if, on the last day of any calendar quarter, the DSCR for the trailing 12-month period is less than 1.05x (based on the combined mortgage and mezzanine loan debt service if the Approved Mezzanine Loan, as defined below, is outstanding). A Cash Management Period will end (x) with respect to clause (i), if the event of default has been cured, or (y) with respect to clause (ii), if the DSCR (based on the combined mortgage and mezzanine loan debt service if the Approved Mezzanine Loan is outstanding) is at least 1.05x for two consecutive calendar quarters.
Initial Reserves. At closing, the borrowers deposited (i) $204,689 into a tax reserve account, (ii) $251,656 into a replacement reserve account and (iii) $209,220 into a required repairs reserve.
The depositor has filed a registration statement (including the prospectus) with the SEC (SEC File No. 333-193376) for the offering to which this communication relates. Before you invest, you should read the prospectus in the registration statement and other documents the depositor has filed with the SEC for more complete information about the depositor, the issuing trust and this offering. You may get these documents for free by visiting EDGAR on the SEC website at www.sec.gov. Alternatively, the depositor or Deutsche Bank Securities Inc., any other underwriter, or any dealer participating in this offering will arrange to send you the prospectus if you request it by calling toll-free 1-800-503-4611 or by email to the following address: prospectus.cpdg@db.com. The offered certificates referred to in these materials, and the asset pool backing them, are subject to modification or revision (including the possibility that one or more classes of certificates may be split, combined or eliminated at any time prior to issuance or availability of a final prospectus) and are offered on a “when, as and if issued” basis. You understand that, when you are considering the purchase of these certificates, a contract of sale will come into being no sooner than the date on which the relevant class has been priced and we have verified the allocation of certificates to be made to you; any “indications of interest” expressed by you, and any “soft circles” generated by us, will not create binding contractual obligations for you or us.
54
|
Colorado
|
Collateral Asset Summary – Loan No. 4
AMC Portfolio Pool II
|
Cut-off Date Balance:
Cut-off Date LTV:
U/W NCF DSCR:
U/W NOI Debt Yield:
|
$87,807,474
74.8%
1.26x
8.1%
|
Ongoing Reserves. On a monthly basis, the borrowers are required to deposit reserves of (i) 1/12 of the estimated annual real estate taxes, which currently equates to $18,608, into a tax reserve account. Beginning on the payment date occurring in January 2017 and on each payment date thereafter, the borrowers will be required to make monthly payments of $5,904 into the replacement reserve, subject to a replacement reserve cap of $226,720. The borrowers will not be required to make monthly deposits for estimated insurance premiums so long as no event of default exists and an acceptable blanket policy is in place.
Current Mezzanine or Subordinate Indebtedness. None.
Future Mezzanine or Subordinate Indebtedness Permitted. NorthStar, which indirectly owns 92.0% of the membership interests in the borrowers, was granted a preferred equity interest in a parent of the borrowers, AMC Portfolio Group, LLC. NorthStar can convert its preferred equity, together with its equity interests in the owners of the 13 other manufactured housing properties that were acquired by the sponsors but do not serve as collateral for the AMC Portfolio Pool II Loan, into a mezzanine loan (which would be secured by the equity in the borrowers under the AMC Portfolio Pool II Loan and the equity in the owners of the other 13 manufactured housing properties) (“the Approved Mezzanine Loan”) subject to certain conditions, including without limitation: (i) the aggregate amount of the mezzanine loan cannot exceed $17,255,000, (ii) the LTV ratio using the AMC Portfolio Pool II Loan plus the portion of the Approved Mezzanine Loan allocable to the equity interest in the borrowers provided as security for the Approved Mezzanine Loan (the “Pool Allocated Amount”) must be no greater than 85.0%, (iii) the aggregate DSCR (calculated by aggregating debt service for the AMC Portfolio Pool II Loan and a portion of the debt service for the Approved Mezzanine Loan based on a fraction, the numerator of which is the Pool Allocated Amount and the denominator of which is the amount of the Approved Mezzanine Loan) must be at least 1.15x and (iv) the Approved Mezzanine Loan is subject to a customary form of intercreditor agreement with changes reasonably acceptable to the lender and the mezzanine lender. In addition, the AMC Portfolio Pool II Loan documents also permit an approved mezzanine loan with respect to the equity interests in the related AMC Portfolio Pool II borrowers only, provided, the mezzanine loan amount does not exceed $6,380,000. The mezzanine lender for the Approved Mezzanine Loan will be NorthStar or an entity that is a qualified real estate investor under the AMC Portfolio Pool II Loan documents.
Partial Release. After the expiration of the lockout period, the borrowers may obtain the release of any of the AMC Portfolio Pool II Properties from the lien of the related mortgage in connection with a bona-fide third-party sale of the property, subject to release conditions, which include: (i) a partial prepayment of the principal by an aggregate amount equal to (x) 120.0% of the allocated loan amount or (y) with respect to a sale of the property to a purchaser, other than NorthStar Realty Finance Corp., in which Ross H. Partrich owns an interest (so long as Ross H. Partrich owns at least 15.0% of the ownership in the borrowers), the greater of 125.0% of the allocated loan amount and 100.0% of the net sales proceeds for the applicable property (together with the payment of a yield maintenance premium) (the “Release Price”); (ii) satisfaction of REMIC requirements and (iii) after giving effect to such release, the DSCR of the properties (based on the combined mortgage and mezzanine loan debt service if the Approved Mezzanine Loan is outstanding) is not less than the greater of (x) the DSCR immediately prior to such release and (y) 1.15x. The borrowers may prepay principal (together with the payment of a yield maintenance premium) to satisfy a DSCR of 1.15x. In addition, if casualty or condemnation proceeds are applied to prepay principal, the borrowers will have the right to obtain a release of the affected AMC Portfolio Pool II Property from the lien of the mortgage by paying the Release Price (less the amount of casualty or condemnation proceeds applied to principal).
Substitution of Collateral. At any time prior to January 1, 2023, the borrowers are permitted to release collateral properties and substitute new properties as collateral for the AMC Portfolio Pool II Loan provided that, among other things: (i) the aggregate allocated loan amounts related to the properties being released (through one or more substitutions) does not exceed 25.0% of the original AMC Portfolio Pool II Loan amount, (ii) the borrower pays a fee of 0.25% of the allocated loan amount for the released property, (iii) both on the loan closing date and as of the date of substitution, (1) the fair market value of the new property is not less than the fair market value of the substituted property and (2) the net operating income of the new property is not less than the net operating income of the substituted property, (iv) the number of properties is not reduced as a result of the substitution and (v) the geographic diversity of the properties following the substitution is no different from the geographic diversity of the properties prior to the substitution.
The depositor has filed a registration statement (including the prospectus) with the SEC (SEC File No. 333-193376) for the offering to which this communication relates. Before you invest, you should read the prospectus in the registration statement and other documents the depositor has filed with the SEC for more complete information about the depositor, the issuing trust and this offering. You may get these documents for free by visiting EDGAR on the SEC website at www.sec.gov. Alternatively, the depositor or Deutsche Bank Securities Inc., any other underwriter, or any dealer participating in this offering will arrange to send you the prospectus if you request it by calling toll-free 1-800-503-4611 or by email to the following address: prospectus.cpdg@db.com. The offered certificates referred to in these materials, and the asset pool backing them, are subject to modification or revision (including the possibility that one or more classes of certificates may be split, combined or eliminated at any time prior to issuance or availability of a final prospectus) and are offered on a “when, as and if issued” basis. You understand that, when you are considering the purchase of these certificates, a contract of sale will come into being no sooner than the date on which the relevant class has been priced and we have verified the allocation of certificates to be made to you; any “indications of interest” expressed by you, and any “soft circles” generated by us, will not create binding contractual obligations for you or us.
55
|
Colorado
|
Collateral Asset Summary – Loan No. 4
AMC Portfolio Pool II
|
Cut-off Date Balance:
Cut-off Date LTV:
U/W NCF DSCR:
U/W NOI Debt Yield:
|
$87,807,474
74.8%
1.26x
8.1%
|

The depositor has filed a registration statement (including the prospectus) with the SEC (SEC File No. 333-193376) for the offering to which this communication relates. Before you invest, you should read the prospectus in the registration statement and other documents the depositor has filed with the SEC for more complete information about the depositor, the issuing trust and this offering. You may get these documents for free by visiting EDGAR on the SEC website at www.sec.gov. Alternatively, the depositor or Deutsche Bank Securities Inc., any other underwriter, or any dealer participating in this offering will arrange to send you the prospectus if you request it by calling toll-free 1-800-503-4611 or by email to the following address: prospectus.cpdg@db.com. The offered certificates referred to in these materials, and the asset pool backing them, are subject to modification or revision (including the possibility that one or more classes of certificates may be split, combined or eliminated at any time prior to issuance or availability of a final prospectus) and are offered on a “when, as and if issued” basis. You understand that, when you are considering the purchase of these certificates, a contract of sale will come into being no sooner than the date on which the relevant class has been priced and we have verified the allocation of certificates to be made to you; any “indications of interest” expressed by you, and any “soft circles” generated by us, will not create binding contractual obligations for you or us.
56
(THIS PAGE INTENTIONALLY LEFT BLANK)
57
|
621 Saint Louis Street
New Orleans, LA 70130
|
Collateral Asset Summary – Loan No. 5
Omni Royal Orleans
|
Cut-off Date Balance:
Cut-off Date LTV:
U/W NCF DSCR:
U/W NOI Debt Yield:
|
$64,907,463
59.0%
1.76x
13.6%
|
The depositor has filed a registration statement (including the prospectus) with the SEC (SEC File No. 333-193376) for the offering to which this communication relates. Before you invest, you should read the prospectus in the registration statement and other documents the depositor has filed with the SEC for more complete information about the depositor, the issuing trust and this offering. You may get these documents for free by visiting EDGAR on the SEC website at www.sec.gov. Alternatively, the depositor or Deutsche Bank Securities Inc., any other underwriter, or any dealer participating in this offering will arrange to send you the prospectus if you request it by calling toll-free 1-800-503-4611 or by email to the following address: prospectus.cpdg@db.com. The offered certificates referred to in these materials, and the asset pool backing them, are subject to modification or revision (including the possibility that one or more classes of certificates may be split, combined or eliminated at any time prior to issuance or availability of a final prospectus) and are offered on a “when, as and if issued” basis. You understand that, when you are considering the purchase of these certificates, a contract of sale will come into being no sooner than the date on which the relevant class has been priced and we have verified the allocation of certificates to be made to you; any “indications of interest” expressed by you, and any “soft circles” generated by us, will not create binding contractual obligations for you or us.
58
|
621 Saint Louis Street
New Orleans, LA 70130
|
Collateral Asset Summary – Loan No. 5
Omni Royal Orleans
|
Cut-off Date Balance:
Cut-off Date LTV:
U/W NCF DSCR:
U/W NOI Debt Yield:
|
$64,907,463
59.0%
1.76x
13.6%
|
|
Mortgage Loan Information
|
Property Information
|
|||||
|
Loan Seller:
|
UBSRES
|
Single Asset / Portfolio:
|
Single Asset
|
|||
|
Loan Purpose:
|
Refinance
|
Property Type:
|
Full Service Hospitality
|
|||
|
Sponsor:
|
Darryl D. Berger; Roger H. Ogden;
|
Collateral:
|
Fee Simple
|
|||
|
Joseph A. Jaeger, Jr.
|
Location:
|
New Orleans, LA
|
||||
|
Borrower:
|
Royal Orleans Hotel Partners II, L.L.C.
|
Year Built / Renovated:
|
1968 / 2012-2013
|
|||
|
Original Balance:
|
$65,000,000
|
Total Rooms:
|
345
|
|||
|
Cut-off Date Balance:
|
$64,907,463
|
Property Management:
|
Omni New Orleans Corporation
|
|||
|
% by Initial UPB:
|
5.3%
|
Underwritten NOI:
|
$8,825,902
|
|||
|
Interest Rate:
|
5.3460%
|
Underwritten NCF:
|
$7,677,573
|
|||
|
Payment Date:
|
6th of each month
|
Appraised Value:
|
$110,000,000
|
|||
|
First Payment Date:
|
March 6, 2014
|
Appraisal Date:
|
November 13, 2013
|
|||
|
Maturity Date:
|
February 6, 2024
|
|||||
|
Amortization:
|
360 months
|
Historical NOI
|
||||
|
Additional Debt:
|
None
|
Most Recent NOI:
|
$8,586,025 (T-12 November 30, 2013)
|
|||
|
Call Protection:
|
L(25), D(90), O(5)
|
2012 NOI(2):
|
$4,747,451 (December 31, 2012)
|
|||
|
Lockbox / Cash Management:
|
Soft Springing Hard / In place
|
2011 NOI:
|
$6,477,584 (December 31, 2011)
|
|||
|
2010 NOI:
|
$5,141,778 (December 31, 2010)
|
|||||
|
Reserves(1)
|
||||||
|
Initial
|
Monthly
|
Historical Occupancy
|
||||
|
Taxes:
|
$49,035
|
Springing
|
Most Recent Occupancy:
|
76.8% (November 30, 2013)
|
||
|
Insurance:
|
$369,771
|
Springing
|
2012 Occupancy(2):
|
57.7% (December 31, 2012)
|
||
| FF&E: | $0 |
1/12 of 4.0% of prior year’s
|
2011 Occupancy:
|
74.7% (December 31, 2011)
|
||
|
gross income
|
2010 Occupancy:
|
74.9% (December 31, 2010)
|
||||
|
Required Repairs:
|
$27,665
|
NAP
|
(1) See “Initial Reserves” and “Ongoing Reserves” herein.
(2) The decrease in 2012 NOI and 2012 Occupancy from 2011 NOI and 2011 Occupancy is due to certain rooms being taken offline in 2012 for ongoing renovations,which totaled $13.2 million ($38,140 per room) and were completed in January 2013.
|
|||
|
Financial Information
|
||||||
|
Cut-off Date Balance / Room:
|
$188,138
|
|||||
|
Balloon Balance / Room:
|
$156,583
|
|||||
|
Cut-off Date LTV:
|
59.0%
|
|||||
|
Balloon LTV:
|
49.1%
|
|||||
|
Underwritten NOI DSCR:
|
2.03x
|
|||||
|
Underwritten NCF DSCR:
|
1.76x
|
|||||
|
Underwritten NOI Debt Yield:
|
13.6%
|
|||||
|
Underwritten NCF Debt Yield:
|
11.8%
|
|||||
|
Underwritten NOI Debt Yield at Balloon:
|
16.3%
|
|||||
|
Underwritten NCF Debt Yield at Balloon:
|
14.2%
|
|||||
The depositor has filed a registration statement (including the prospectus) with the SEC (SEC File No. 333-193376) for the offering to which this communication relates. Before you invest, you should read the prospectus in the registration statement and other documents the depositor has filed with the SEC for more complete information about the depositor, the issuing trust and this offering. You may get these documents for free by visiting EDGAR on the SEC website at www.sec.gov. Alternatively, the depositor or Deutsche Bank Securities Inc., any other underwriter, or any dealer participating in this offering will arrange to send you the prospectus if you request it by calling toll-free 1-800-503-4611 or by email to the following address: prospectus.cpdg@db.com. The offered certificates referred to in these materials, and the asset pool backing them, are subject to modification or revision (including the possibility that one or more classes of certificates may be split, combined or eliminated at any time prior to issuance or availability of a final prospectus) and are offered on a “when, as and if issued” basis. You understand that, when you are considering the purchase of these certificates, a contract of sale will come into being no sooner than the date on which the relevant class has been priced and we have verified the allocation of certificates to be made to you; any “indications of interest” expressed by you, and any “soft circles” generated by us, will not create binding contractual obligations for you or us.
59
|
621 Saint Louis Street
New Orleans, LA 70130
|
Collateral Asset Summary – Loan No. 5
Omni Royal Orleans
|
Cut-off Date Balance:
Cut-off Date LTV:
U/W NCF DSCR:
U/W NOI Debt Yield:
|
$64,907,463
59.0%
1.76x
13.6%
|
|
Historical Occupancy, ADR, RevPAR(1)
|
|||||||||
|
Omni Royal Orleans Property(2)
|
Competitive Set
|
Penetration Factor
|
|||||||
|
Year
|
Occupancy
|
ADR
|
RevPAR
|
Occupancy
|
ADR
|
RevPAR
|
Occupancy
|
ADR
|
RevPAR
|
|
2011
|
73.7%
|
$175.52
|
$129.32
|
75.3%
|
$158.31
|
$119.14
|
97.9%
|
110.9%
|
108.5%
|
|
2012(3)
|
56.5%
|
$196.74
|
$111.25
|
73.1%
|
$176.30
|
$128.87
|
77.4%
|
111.6%
|
86.3%
|
|
2013
|
77.8%
|
$205.43
|
$159.80
|
73.5%
|
$188.98
|
$138.93
|
105.8%
|
108.7%
|
115.0%
|
|
(1)
|
Source: Hospitality research report.
|
|
(2)
|
The minor variances between the underwriting and the above table with respect to Occupancy, ADR and RevPAR at the Omni Royal Orleans Property are attributable to variances in reporting methodologies and/or timing differences.
|
|
(3)
|
The decrease in occupancy and RevPAR from 2011 to 2012, is due to certain rooms being taken offline in 2012 for ongoing renovations, which totaled $13.2 million ($38,140 per room) and were completed in January 2013.
|
The Loan. The Omni Royal Orleans loan (the “Omni Royal Orleans Loan”) is a fixed rate loan secured by the borrower’s fee simple interest in a 345-room full service hotel located at 621 Saint Louis Street in New Orleans, Louisiana (the “Omni Royal Orleans Property”) with an original principal balance of $65.0 million. The Omni Royal Orleans Loan has a 10-year term and amortizes on a 30-year schedule. The Omni Royal Orleans Loan accrues interest at a fixed rate equal to 5.3460% and has a cut-off date balance of approximately $64.9 million. The Omni Royal Orleans Loan proceeds were used to retire existing debt of approximately $42.3 million, fund upfront reserves of $446,471, pay closing costs of $739,606, and return equity to the sponsors of approximately $21.5 million. Based on the appraised value of $110.0 million as of November 13, 2013, the cut-off date LTV ratio is 59.0% and the remaining implied equity is $45.0 million. The most recent prior financing of the Omni Royal Orleans Property was not included in a securitization.
|
Sources and Uses
|
||||||
|
Sources
|
Proceeds
|
% of Total
|
Uses
|
Proceeds
|
% of Total
|
|
|
Loan Amount
|
$65,000,000
|
100.0%
|
Loan Payoff
|
$42,312,189
|
65.1%
|
|
|
Reserves
|
$446,471
|
0.7%
|
||||
|
Closing Costs
|
$739,606
|
1.1%
|
||||
|
Return of Equity
|
$21,501,734
|
33.1%
|
||||
|
Total Sources
|
$65,000,000
|
100.0%
|
Total Uses
|
$65,000,000
|
100.0%
|
|
The Borrower / Sponsor. The borrower, Royal Orleans Hotel Partners II, L.L.C., is a single purpose Delaware limited liability company structured to be bankruptcy-remote, with two independent directors in its organizational structure. The sponsors of the borrower and the non-recourse carve-out guarantors are Darryl D. Berger, Roger H. Ogden and Joseph A. Jaeger, Jr. (the “Sponsors”).
Darryl D. Berger is founder and president of The Berger Company, Inc., a diversified real estate investment and development firm based in New Orleans, with investments and developments in the Gulf South and other selected markets around the country. In addition to the Omni Royal Orleans Property, The Berger Company, Inc. has interests in the Shops and Garage at Canal Place, Loews New Orleans Hotel, Wyndham Riverfront Hotel, and the Windsor Court Hotel. Roger H. Ogden is on the Board of Directors of Stirling Properties (“Stirling”), a full service commercial real estate company based out of Covington, Louisiana. Mr. Ogden co-founded and led Stirling for 20 years in the development and acquisition of a $200.0 million portfolio of shopping centers. In 1996, Mr. Ogden developed the Wyndham Riverfront Hotel, a $43.0 million hotel project on Convention Center Boulevard in New Orleans. In 2000, Mr. Ogden completed the acquisition of the Shops at Canal Place, a 295,000 square foot mall featuring Saks Fifth Avenue, Brooks Brothers, Coach and others, together with the attached 1,650 space garage at Canal Place. In 2003, Mr. Ogden completed the $70.0 million Loews New Orleans Hotel on Poydras Street and the restoration of the adjacent Piazza d’Italia. Joseph A. Jaeger, Jr. has been President and CEO of MCC Real Estate and Development, LLC (“MCC”) since 1982. MCC is a real estate development and investment company located in Metairie, Louisiana, with a concentration in hotels and office buildings. In addition to the Omni Royal Orleans Property, some other major MCC developments and/or investments include Marriott New Orleans at the Convention Center, Bourbon Orleans Hotel, Wyndham Riverfront Hotel, Dauphine Orleans Hotel, Crowne Plaza – New Orleans Airport, Hotel Le Marais, Hotel Mazarin, Northpark II Office Building, and 3350 Ridgelake Executive Suites.
The Property. The Omni Royal Orleans Property consists of a seven-story, 345-room full service hotel with approximately 12,795 square feet of meeting space, an 8-story parking garage with 270 spaces, a business center, full-service restaurant, beauty salon, barber shop, Starbucks coffee shop and a gift shop. Rooftop amenities include a heated pool, terrace, bar, fitness center and panoramic views of the French Quarter and Mississippi River. The Omni Royal Orleans Property is located in the heart of the French Quarter neighborhood of New Orleans, Louisiana and was constructed in 1968 on a 1.13-acre site.
A $13.2 million ($38,140 per room) renovation of the Omni Royal Orleans Property was completed in January 2013. An $11.8 million portion of the renovation funds were used to upgrade guest rooms, meeting rooms, the courtyard, the lobby, the restaurant and the bar, while the remaining $1.4 million in renovation funds was used for structural and aesthetic enhancements of the exterior and for
The depositor has filed a registration statement (including the prospectus) with the SEC (SEC File No. 333-193376) for the offering to which this communication relates. Before you invest, you should read the prospectus in the registration statement and other documents the depositor has filed with the SEC for more complete information about the depositor, the issuing trust and this offering. You may get these documents for free by visiting EDGAR on the SEC website at www.sec.gov. Alternatively, the depositor or Deutsche Bank Securities Inc., any other underwriter, or any dealer participating in this offering will arrange to send you the prospectus if you request it by calling toll-free 1-800-503-4611 or by email to the following address: prospectus.cpdg@db.com. The offered certificates referred to in these materials, and the asset pool backing them, are subject to modification or revision (including the possibility that one or more classes of certificates may be split, combined or eliminated at any time prior to issuance or availability of a final prospectus) and are offered on a “when, as and if issued” basis. You understand that, when you are considering the purchase of these certificates, a contract of sale will come into being no sooner than the date on which the relevant class has been priced and we have verified the allocation of certificates to be made to you; any “indications of interest” expressed by you, and any “soft circles” generated by us, will not create binding contractual obligations for you or us.
60
|
621 Saint Louis Street
New Orleans, LA 70130
|
Collateral Asset Summary – Loan No. 5
Omni Royal Orleans
|
Cut-off Date Balance:
Cut-off Date LTV:
U/W NCF DSCR:
U/W NOI Debt Yield:
|
$64,907,463
59.0%
1.76x
13.6%
|
maintaining HVAC equipment. The renovation added 24 wrought iron balconies to the property, bringing the total number of balcony rooms to 49.
The Omni Royal Orleans Property has 345 guest rooms, with 107 configured as king, 94 as queen, 73 as European queen, 48 as double/double, 14 as king one-bedroom suites, 4 jacuzzi suites, 3 penthouse suites and 2 royal suites. The hotel has received a AAA Four-Diamond luxury award in each of the past 31 years. As of the November 2013 Omni guest satisfaction survey, the Omni Royal Orleans Property is rated 9.02 out of 10 and is in the top 25.0% of all Omni hotels with regard to overall guest experience.
Environmental Matters. The Phase I environmental report dated November 25, 2013 recommended the continued implementation of an asbestos operation and maintenance plan at the Omni Royal Orleans Property.
The Market. The Omni Royal Orleans Property is located in the heart of the French Quarter in downtown New Orleans, Louisiana on Saint Louis Street between Chartres Street and Royal Street. Known for its culture, music, architecture and cuisine, New Orleans is largely recognized as a tourist destination, but is also a significant logistics center, owing to its access to the Mississippi River, Gulf of Mexico and numerous railways. According to a market research report, the New Orleans Metropolitan Statistical Area had a population of 1.2 million in 2012 and an unemployment rate of 7.2% as of August 2013, up from 6.9% in August 2012. Tourism in New Orleans continues to draw millions of visitors to the city. According to a market research report, 9.0 million tourists visited New Orleans in 2012 and spent an estimated $6.0 billion, compared to 8.3 million tourists in 2010 spending $5.3 billion, an increase of 8.6% and 13.2%, respectively.
The French Quarter dates back to the founding of New Orleans and is a National Historic Landmark. Since the 1920’s, historic buildings in the French Quarter have been protected by law and cannot be demolished, and any new construction or renovations must be done according to regulations. Further, according to the appraisal and the City of New Orleans Planning Commission, the number of hotel rooms in the French Quarter is regulated and currently no extra hotel rooms are allowed to be added to the area. The French Quarter comprises 85 square blocks of hotels, bars, restaurants and museums, as well as the outdoor French Market. The Omni Royal Orleans Property’s location in the French Quarter provides access to many of the tourist attractions in New Orleans including Bourbon Street, Jackson Square, and the St. Louis Cathedral.
The subsequent chart presents primary competitors to the Omni Royal Orleans Property:
|
Primary Competitive Set(1)
|
||||||
|
Property
|
# of Rooms
|
Year Opened
|
Meeting Space
(Sq. Ft.) |
2013
Occupancy(2)
|
2013 ADR(2)
|
2013 RevPAR(2)
|
|
Omni Royal Orleans Property
|
345
|
1968
|
12,795
|
77.0%
|
$202.00
|
$155.14
|
|
Royal Sonesta New Orleans
|
482
|
1969
|
19,212
|
73.0%
|
$205.00
|
$149.65
|
|
Monteleone New Orleans
|
570
|
1886
|
23,669
|
72.0%
|
$218.00
|
$156.96
|
|
JW Marriott New Orleans
|
496
|
1984
|
19,400
|
82.0%
|
$172.00
|
$141.04
|
|
Hyatt French Quarter
|
254
|
1995
|
10,200
|
78.0%
|
$168.00
|
$131.04
|
|
Total/Wtd. Avg.
|
2,147
|
76.0%
|
$195.07
|
$148.28
|
||
|
(1)
|
Source: Appraisal
|
|
(2)
|
2013 Occupancy, 2013 ADR and 2013 RevPAR represent estimates from the appraiser.
|
The depositor has filed a registration statement (including the prospectus) with the SEC (SEC File No. 333-193376) for the offering to which this communication relates. Before you invest, you should read the prospectus in the registration statement and other documents the depositor has filed with the SEC for more complete information about the depositor, the issuing trust and this offering. You may get these documents for free by visiting EDGAR on the SEC website at www.sec.gov. Alternatively, the depositor or Deutsche Bank Securities Inc., any other underwriter, or any dealer participating in this offering will arrange to send you the prospectus if you request it by calling toll-free 1-800-503-4611 or by email to the following address: prospectus.cpdg@db.com. The offered certificates referred to in these materials, and the asset pool backing them, are subject to modification or revision (including the possibility that one or more classes of certificates may be split, combined or eliminated at any time prior to issuance or availability of a final prospectus) and are offered on a “when, as and if issued” basis. You understand that, when you are considering the purchase of these certificates, a contract of sale will come into being no sooner than the date on which the relevant class has been priced and we have verified the allocation of certificates to be made to you; any “indications of interest” expressed by you, and any “soft circles” generated by us, will not create binding contractual obligations for you or us.
61
|
621 Saint Louis Street
New Orleans, LA 70130
|
Collateral Asset Summary – Loan No. 5
Omni Royal Orleans
|
Cut-off Date Balance:
Cut-off Date LTV:
U/W NCF DSCR:
U/W NOI Debt Yield:
|
$64,907,463
59.0%
1.76x
13.6%
|
Cash Flow Analysis.
|
Cash Flow Analysis
|
||||||
|
2010
|
U/W
|
U/W per Room
|
||||
|
Occupancy
|
74.9%
|
|||||
|
ADR
|
$159.55
|
|||||
|
RevPAR
|
$119.45
|
|||||
|
Room Revenue
|
$15,041,188
|
$58,353
|
||||
|
F&B Revenue
|
5,916,023
|
18,561
|
||||
|
Other Revenue(2)
|
1,602,800
|
6,298
|
||||
|
Total Dept. Revenue
|
$22,560,011
|
$83,212
|
||||
|
Total Dept. Expenses
|
9,248,676
|
28,179
|
||||
|
Total Dept. Profit
|
$13,311,335
|
$55,034
|
||||
|
Undistributed Expenses
|
7,360,250
|
26,246
|
||||
|
Total Fixed Expenses
|
809,307
|
3,205
|
||||
|
Net Operating Income
|
$5,141,778
|
$25,582
|
||||
|
FF&E
|
0
|
3,328
|
||||
|
Net Cash Flow
|
$5,141,778
|
$22,254
|
||||
|
(1)
|
The decrease in occupancy and room revenue from 2011 to 2012, and increase in occupancy and room revenue from 2012 to T-12 11/30/2013 were due to certain rooms being taken offline in 2012 for ongoing renovations, which totaled $13.2 million ($38,140 per room) and were completed in January 2013.
|
|
(2)
|
Other Revenue includes parking, retail, telephone income, cancellation fees and miscellaneous income.
|
Property Management. The Omni Royal Orleans Property is managed by Omni New Orleans Corporation (the “Manager”), which is not affiliated with the borrower, pursuant to an operating lease between the Manager and the borrower (the “Omni Lease”).
Lockbox / Cash Management. The Omni Royal Orleans Loan is structured with a soft, springing hard lockbox and in place cash management. For so long as the Omni Lease is in full force and effect, all rent from the Omni Royal Orleans Property will be deposited directly into an account controlled by the Manager (the “Property Account”). The Omni Royal Orleans Loan requires all amounts the Manager is required to disburse to the borrower pursuant to the Omni Lease be transmitted directly from the Property Account into the lender controlled cash management account, where the funds are required to be disbursed in accordance with the loan agreement. Upon a Cash Sweep Period (defined below), all excess cash will be swept into a lender controlled account.
However, if at any time during the term of the Omni Royal Orleans Loan the Manager elects not to maintain the Property Account, or if the Omni Lease is no longer in full force and effect, the Omni Royal Orleans Loan requires all rent to be transmitted directly into the clearing account. All funds deposited into the clearing account are required to be swept daily by the clearing bank into the lender controlled cash management account, where the funds are required to be disbursed in accordance with the loan agreement. Upon a Cash Sweep Period (defined below), all excess cash will be swept into a lender controlled account.
A “Cash Sweep Period” will commence upon the occurrence of one of the following events: (i) an event of default by the borrower, (ii) the occurrence of certain bankruptcy events relating to the guarantor or manager, or (iii) the DSCR falling below 1.20x based on the trailing twelve month period immediately preceding the date of determination; and will end (a) with respect to clause (i), upon the date the event of default has been cured, (b) with respect to clause (ii) upon the date such bankruptcy action has been discharged, stayed or dismissed along with other requirements as indicated in the loan documents, and (c) with respect to clause (iii), at such time that the DSCR is equal to or greater than 1.20x based on the trailing twelve month period immediately preceding the date of determination for two consecutive quarters.
Initial Reserves. At closing, the borrower deposited (i) $49,035 into the tax reserve account, (ii) $369,771 into the insurance reserve account and (iii) $27,665 into the required repairs reserve account, which represents 110% of the amount required per the engineering report.
The depositor has filed a registration statement (including the prospectus) with the SEC (SEC File No. 333-193376) for the offering to which this communication relates. Before you invest, you should read the prospectus in the registration statement and other documents the depositor has filed with the SEC for more complete information about the depositor, the issuing trust and this offering. You may get these documents for free by visiting EDGAR on the SEC website at www.sec.gov. Alternatively, the depositor or Deutsche Bank Securities Inc., any other underwriter, or any dealer participating in this offering will arrange to send you the prospectus if you request it by calling toll-free 1-800-503-4611 or by email to the following address: prospectus.cpdg@db.com. The offered certificates referred to in these materials, and the asset pool backing them, are subject to modification or revision (including the possibility that one or more classes of certificates may be split, combined or eliminated at any time prior to issuance or availability of a final prospectus) and are offered on a “when, as and if issued” basis. You understand that, when you are considering the purchase of these certificates, a contract of sale will come into being no sooner than the date on which the relevant class has been priced and we have verified the allocation of certificates to be made to you; any “indications of interest” expressed by you, and any “soft circles” generated by us, will not create binding contractual obligations for you or us.
62
|
621 Saint Louis Street
New Orleans, LA 70130
|
Collateral Asset Summary – Loan No. 5
Omni Royal Orleans
|
Cut-off Date Balance:
Cut-off Date LTV:
U/W NCF DSCR:
U/W NOI Debt Yield:
|
$64,907,463
59.0%
1.76x
13.6%
|
Ongoing Reserves. On a monthly basis, the borrower is required to deposit reserves of (i) 1/12 of the estimated annual real estate taxes, which currently equates to $30,647, into a tax reserve account, (ii) 1/12 of the annual insurance premiums, which currently equates to $66,030, into an insurance reserve account, and (iii) 1/12 of 4.0% of the prior year’s gross income, which currently equates to $95,694, into an FF&E reserve account. Notwithstanding the foregoing, the borrower’s obligation to make monthly deposits into the tax reserve account and the insurance reserve account will be suspended for such time as (i) no event of default is occurring, (ii) the Manager pays the real estate taxes and insurance premiums on a timely basis, (iii) the Omni Lease remains in full force and effect, and (iv) the lender receives proof of timely payment (collectively, the “Waiver Conditions”). The borrower acknowledged that at closing, the Waiver Conditions were not satisfied, and therefore the borrower is required to make monthly deposits into the tax reserve account and the insurance reserve account.
Current Mezzanine or Subordinate Indebtedness. None.
Future Mezzanine or Subordinate Indebtedness Permitted. None.
The depositor has filed a registration statement (including the prospectus) with the SEC (SEC File No. 333-193376) for the offering to which this communication relates. Before you invest, you should read the prospectus in the registration statement and other documents the depositor has filed with the SEC for more complete information about the depositor, the issuing trust and this offering. You may get these documents for free by visiting EDGAR on the SEC website at www.sec.gov. Alternatively, the depositor or Deutsche Bank Securities Inc., any other underwriter, or any dealer participating in this offering will arrange to send you the prospectus if you request it by calling toll-free 1-800-503-4611 or by email to the following address: prospectus.cpdg@db.com. The offered certificates referred to in these materials, and the asset pool backing them, are subject to modification or revision (including the possibility that one or more classes of certificates may be split, combined or eliminated at any time prior to issuance or availability of a final prospectus) and are offered on a “when, as and if issued” basis. You understand that, when you are considering the purchase of these certificates, a contract of sale will come into being no sooner than the date on which the relevant class has been priced and we have verified the allocation of certificates to be made to you; any “indications of interest” expressed by you, and any “soft circles” generated by us, will not create binding contractual obligations for you or us.
63
|
621 Saint Louis Street
New Orleans, LA 70130
|
Collateral Asset Summary – Loan No. 5
Omni Royal Orleans
|
Cut-off Date Balance:
Cut-off Date LTV:
U/W NCF DSCR:
U/W NOI Debt Yield:
|
$64,907,463
59.0%
1.76x
13.6%
|
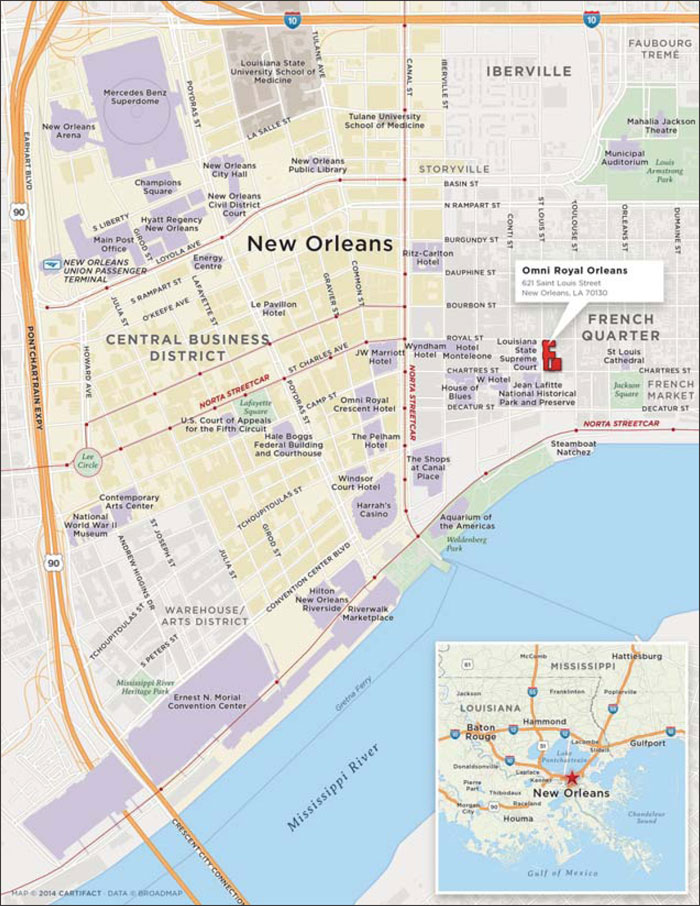
The depositor has filed a registration statement (including the prospectus) with the SEC (SEC File No. 333-193376) for the offering to which this communication relates. Before you invest, you should read the prospectus in the registration statement and other documents the depositor has filed with the SEC for more complete information about the depositor, the issuing trust and this offering. You may get these documents for free by visiting EDGAR on the SEC website at www.sec.gov. Alternatively, the depositor or Deutsche Bank Securities Inc., any other underwriter, or any dealer participating in this offering will arrange to send you the prospectus if you request it by calling toll-free 1-800-503-4611 or by email to the following address: prospectus.cpdg@db.com. The offered certificates referred to in these materials, and the asset pool backing them, are subject to modification or revision (including the possibility that one or more classes of certificates may be split, combined or eliminated at any time prior to issuance or availability of a final prospectus) and are offered on a “when, as and if issued” basis. You understand that, when you are considering the purchase of these certificates, a contract of sale will come into being no sooner than the date on which the relevant class has been priced and we have verified the allocation of certificates to be made to you; any “indications of interest” expressed by you, and any “soft circles” generated by us, will not create binding contractual obligations for you or us.
64
(THIS PAGE INTENTIONALLY LEFT BLANK)
65
|
One North State Street
Chicago, IL 60602
|
Collateral Asset Summary – Loan No. 6
One North State Street
|
Cut-off Date Balance:
Cut-off Date LTV:
U/W NCF DSCR:
U/W NOI Debt Yield:
|
$59,907,080
59.3%
1.33x
8.5%
|

The depositor has filed a registration statement (including the prospectus) with the SEC (SEC File No. 333-193376) for the offering to which this communication relates. Before you invest, you should read the prospectus in the registration statement and other documents the depositor has filed with the SEC for more complete information about the depositor, the issuing trust and this offering. You may get these documents for free by visiting EDGAR on the SEC website at www.sec.gov. Alternatively, the depositor or Deutsche Bank Securities Inc., any other underwriter, or any dealer participating in this offering will arrange to send you the prospectus if you request it by calling toll-free 1-800-503-4611 or by email to the following address: prospectus.cpdg@db.com. The offered certificates referred to in these materials, and the asset pool backing them, are subject to modification or revision (including the possibility that one or more classes of certificates may be split, combined or eliminated at any time prior to issuance or availability of a final prospectus) and are offered on a “when, as and if issued” basis. You understand that, when you are considering the purchase of these certificates, a contract of sale will come into being no sooner than the date on which the relevant class has been priced and we have verified the allocation of certificates to be made to you; any “indications of interest” expressed by you, and any “soft circles” generated by us, will not create binding contractual obligations for you or us.
66
|
One North State Street
Chicago, IL 60602
|
Collateral Asset Summary – Loan No. 6
One North State Street
|
Cut-off Date Balance:
Cut-off Date LTV:
U/W NCF DSCR:
U/W NOI Debt Yield:
|
$59,907,080
59.3%
1.33x
8.5%
|
|
Mortgage Loan Information
|
Property Information
|
|||||
|
Loan Seller:
|
GACC
|
Single Asset / Portfolio:
|
Single Asset
|
|||
|
Loan Purpose:
|
Refinance
|
Property Type:
|
Anchored Retail
|
|||
|
Sponsor:
|
Isaac Shalom
|
Collateral:
|
Fee Simple
|
|||
|
Borrower:
|
TBG State Street LLC
|
Location:
|
Chicago, IL
|
|||
|
Original Balance:
|
$60,000,000
|
Year Built / Renovated:
|
1912 / 1998
|
|||
|
Cut-off Date Balance:
|
$59,907,080
|
Total Sq. Ft.:
|
170,507
|
|||
|
% by Initial UPB:
|
4.8%
|
Property Management:
|
Madison Realty Management Corp.
|
|||
|
Interest Rate:
|
4.6000%
|
Underwritten NOI:
|
$5,109,866
|
|||
|
Payment Date:
|
6th of each month
|
Underwritten NCF:
|
$4,924,053
|
|||
|
First Payment Date:
|
March 6, 2014
|
Appraised Value:
|
$100,950,000
|
|||
|
Maturity Date:
|
February 6, 2024
|
Appraisal Date:
|
December 2, 2013
|
|||
|
Amortization:
|
360 months
|
|||||
|
Additional Debt:
|
None
|
Historical NOI
|
||||
|
Call Protection:
|
L(25), D(90), O(5)
|
Most Recent NOI:
|
$5,366,324 (T-12 October 31, 2013)
|
|||
|
Lockbox / Cash Management:
|
Hard / Springing
|
2012 NOI:
|
$4,705,772 (December 31, 2012)
|
|||
|
2011 NOI:
|
$4,687,527 (December 31, 2011)
|
|||||
|
Reserves(1)
|
2010 NOI:
|
$4,303,708 (December 31, 2010)
|
||||
|
Initial
|
Monthly
|
|||||
|
Taxes:
|
$744,418
|
$89,330
|
Historical Occupancy(2)
|
|||
|
Insurance:
|
$0
|
Springing
|
Current Occupancy:
|
97.9% (October 31, 2013)
|
||
|
Replacement:
|
$0
|
$2,131
|
2012 Occupancy:
|
99.8% (December 31, 2012)
|
||
|
Lease Sweep:
|
$0
|
Springing
|
2011 Occupancy:
|
62.6% (December 31, 2011)
|
||
|
2010 Occupancy:
|
97.2% (December 31, 2010)
|
|||||
|
Financial Information
|
(1) See “Lockbox / Cash Management”, “Initial Reserves” and “Ongoing Reserves” herein.
(2) The decline in 2011 Occupancy was due to Filenes Basement vacating its space at the property at the end of 2011 due to the bankruptcy of the chain. The subsequent increase in 2012 Occupancy was due to Burlington Coat Factory taking occupancy of the former Filenes Basement space in 2012. The subsequent increase in Most Recent NOI from 2012 NOI is also due to Burlington Coat Factory backfilling the Filenes Basement space.
|
|||||
|
Cut-off Date Balance / Sq. Ft.:
|
$351
|
|||||
|
Balloon Balance / Sq. Ft.:
|
$285
|
|||||
|
Cut-off Date LTV:
|
59.3%
|
|||||
|
Balloon LTV:
|
48.2%
|
|||||
|
Underwritten NOI DSCR:
|
1.38x
|
|||||
|
Underwritten NCF DSCR:
|
1.33x
|
|||||
|
Underwritten NOI Debt Yield:
|
8.5%
|
|||||
|
Underwritten NCF Debt Yield:
|
8.2%
|
|||||
|
Underwritten NOI Debt Yield at Balloon:
|
10.5%
|
|||||
|
Underwritten NCF Debt Yield at Balloon:
|
10.1%
|
|||||
The depositor has filed a registration statement (including the prospectus) with the SEC (SEC File No. 333-193376) for the offering to which this communication relates. Before you invest, you should read the prospectus in the registration statement and other documents the depositor has filed with the SEC for more complete information about the depositor, the issuing trust and this offering. You may get these documents for free by visiting EDGAR on the SEC website at www.sec.gov. Alternatively, the depositor or Deutsche Bank Securities Inc., any other underwriter, or any dealer participating in this offering will arrange to send you the prospectus if you request it by calling toll-free 1-800-503-4611 or by email to the following address: prospectus.cpdg@db.com. The offered certificates referred to in these materials, and the asset pool backing them, are subject to modification or revision (including the possibility that one or more classes of certificates may be split, combined or eliminated at any time prior to issuance or availability of a final prospectus) and are offered on a “when, as and if issued” basis. You understand that, when you are considering the purchase of these certificates, a contract of sale will come into being no sooner than the date on which the relevant class has been priced and we have verified the allocation of certificates to be made to you; any “indications of interest” expressed by you, and any “soft circles” generated by us, will not create binding contractual obligations for you or us.
67
|
One North State Street
Chicago, IL 60602
|
Collateral Asset Summary – Loan No. 6
One North State Street
|
Cut-off Date Balance:
Cut-off Date LTV:
U/W NCF DSCR:
U/W NOI Debt Yield:
|
$59,907,080
59.3%
1.33x
8.5%
|
|
Tenant Summary
|
||||||||||
|
Ratings
(Fitch/Moody’s/S&P)(1)
|
Total
Sq. Ft.
|
% of Total
Sq. Ft.
|
Lease
Expiration
|
Annual UW
Base Rent PSF |
Sales PSF(2)
|
Occupancy
Cost (% of Sales)(2)
|
||||
|
Anchor Tenants
|
||||||||||
|
TJ Maxx(3)
|
NR/A3/A+
|
70,029
|
41.1%
|
7/31/2024
|
$20.78
|
$438
|
9.3%
|
|||
|
Burlington Coat Factory(4)
|
NR/B2/B
|
60,096
|
35.2%
|
2/28/2023
|
$26.00
|
$220
|
20.1%
|
|||
|
Subtotal
|
130,125
|
76.3%
|
$320
|
13.3%
|
||||||
|
Major Tenants
|
||||||||||
|
Garrett Popcorn Shops(5)
|
NR/NR/NR
|
7,665
|
4.5%
|
1/31/2026
|
$37.54
|
$1,426
|
9.5%
|
|||
|
Pay Half
|
NR/NR/NR
|
6,200
|
3.6%
|
2/28/2017
|
$39.50
|
$218
|
24.1%
|
|||
|
Dunkin Donuts(6)
|
NR/NR/NR
|
3,720
|
2.2%
|
10/31/2020
|
$41.51
|
$470
|
16.3%
|
|||
|
Subtotal
|
17,585
|
10.3%
|
$473
|
15.2%
|
||||||
|
Other In-line Tenants
|
19,207
|
11.3%
|
$85.53
|
$419
|
29.0%
|
|||||
|
Total Occupied Collateral
|
166,917
|
97.9%
|
$342
|
15.3%
|
||||||
|
Vacant
|
3,590
|
2.1%
|
||||||||
|
Total/Wtd. Avg.
|
170,507
|
100.0%
|
||||||||
|
(1)
|
Certain ratings may be those of the parent company whether or not the parent company guarantees the lease.
|
|
(2)
|
Sales PSF and Occupancy Cost (% of Sales) provided by the borrower are as of the trailing twelve months ended August 2013 through November 2013, depending on the tenants’ individual sales reporting cycles, and only include tenants reporting sales. Approximately 94.3% of all tenants by sq. ft. and 59.7% of Other In-Line Tenants by sq. ft. report sales.
|
|
(3)
|
Total Sq. Ft. for TJ Maxx includes 25,029 sq. ft. of storage space. Sales PSF and Occupancy Cost (% of Sales) are calculated excluding storage space.
|
|
(4)
|
Total Sq. Ft. for Burlington Coat Factory includes 7,213 sq. ft. of storage space. Sales PSF and Occupancy Cost (% of Sales) are calculated excluding storage space. Burlington Coat Factory has one 10-year renewal option at an initial fixed rent of $31.46 PSF with a minimum of one year’s notice due on or before February 28, 2022.
|
|
(5)
|
Total Sq. Ft. for Garrett Popcorn Shops includes 6,000 sq. ft. of storage space. Sales PSF and Occupancy Cost (% of Sales) are calculated excluding storage space.
|
|
(6)
|
Total Sq. Ft. for Dunkin Donuts includes 1,070 sq. ft. of storage space. Sales PSF and Occupancy Cost (% of Sales) are calculated excluding storage space.
|
|
Lease Rollover Schedule(1)
|
||||||||||||||||
|
Year
|
# of Leases
Expiring
|
Total Expiring
Sq. Ft.
|
% of Total Sq.
Ft. Expiring
|
Cumulative
Sq. Ft.
Expiring
|
Cumulative
% of Sq. Ft.
Expiring |
Annual U/W
Base Rent Per Sq. Ft. |
% U/W
Base Rent Rolling |
Cumulative %
of U/W
Base Rent
|
||||||||
|
MTM
|
0
|
0
|
0.0%
|
0
|
0.0%
|
$0.00
|
0.0%
|
0.0%
|
||||||||
|
2014
|
1
|
3,283
|
1.9%
|
3,283
|
1.9%
|
$112.55
|
6.9%
|
6.9%
|
||||||||
|
2015
|
1
|
1,807
|
1.1%
|
5,090
|
3.0%
|
$84.87
|
2.9%
|
9.8%
|
||||||||
|
2016
|
3
|
5,148
|
3.0%
|
10,238
|
6.0%
|
$76.43
|
7.4%
|
17.1%
|
||||||||
|
2017
|
3
|
9,102
|
5.3%
|
19,340
|
11.3%
|
$47.04
|
8.0%
|
25.1%
|
||||||||
|
2018
|
2
|
2,883
|
1.7%
|
22,223
|
13.0%
|
$64.96
|
3.5%
|
28.6%
|
||||||||
|
2019
|
0
|
0
|
0.0%
|
22,223
|
13.0%
|
$0.00
|
0.0%
|
28.6%
|
||||||||
|
2020
|
2
|
3,720
|
2.2%
|
25,943
|
15.2%
|
$41.51
|
2.9%
|
31.5%
|
||||||||
|
2021
|
2
|
3,184
|
1.9%
|
29,127
|
17.1%
|
$111.78
|
6.7%
|
38.2%
|
||||||||
|
2022
|
0
|
0
|
0.0%
|
29,127
|
17.1%
|
$0.00
|
0.0%
|
38.2%
|
||||||||
|
2023
|
2
|
60,096
|
35.2%
|
89,223
|
52.3%
|
$26.00
|
29.2%
|
67.4%
|
||||||||
|
2024
|
2
|
70,029
|
41.1%
|
159,252
|
93.4%
|
$20.78
|
27.2%
|
94.6%
|
||||||||
|
Thereafter
|
2
|
7,665
|
4.5%
|
166,917
|
97.9%
|
$37.54
|
5.4%
|
100.0%
|
||||||||
|
Vacant
|
NAP
|
3,590
|
2.1%
|
170,507
|
100.0%
|
NAP
|
NAP
|
|||||||||
|
Total / Wtd. Avg.
|
20
|
170,507
|
100.0%
|
$32.04
|
100.0%
|
|||||||||||
|
(1)
|
Certain tenants have lease termination options, including those related to co-tenancy provisions and sales thresholds, that may become exercisable prior to the originally stated expiration date of the tenant lease and that are not considered in the lease rollover schedule.
|
The depositor has filed a registration statement (including the prospectus) with the SEC (SEC File No. 333-193376) for the offering to which this communication relates. Before you invest, you should read the prospectus in the registration statement and other documents the depositor has filed with the SEC for more complete information about the depositor, the issuing trust and this offering. You may get these documents for free by visiting EDGAR on the SEC website at www.sec.gov. Alternatively, the depositor or Deutsche Bank Securities Inc., any other underwriter, or any dealer participating in this offering will arrange to send you the prospectus if you request it by calling toll-free 1-800-503-4611 or by email to the following address: prospectus.cpdg@db.com. The offered certificates referred to in these materials, and the asset pool backing them, are subject to modification or revision (including the possibility that one or more classes of certificates may be split, combined or eliminated at any time prior to issuance or availability of a final prospectus) and are offered on a “when, as and if issued” basis. You understand that, when you are considering the purchase of these certificates, a contract of sale will come into being no sooner than the date on which the relevant class has been priced and we have verified the allocation of certificates to be made to you; any “indications of interest” expressed by you, and any “soft circles” generated by us, will not create binding contractual obligations for you or us.
68
|
One North State Street
Chicago, IL 60602
|
Collateral Asset Summary – Loan No. 6
One North State Street
|
Cut-off Date Balance:
Cut-off Date LTV:
U/W NCF DSCR:
U/W NOI Debt Yield:
|
$59,907,080
59.3%
1.33x
8.5%
|
The Loan. The One North State Street loan (the “One North State Street Loan”) is a fixed rate loan secured by the borrower’s fee simple interest in a 170,507 sq. ft., Class A, anchored retail vertical subdivision of a 713,423 sq. ft., 16-story building located at One North State Street in Chicago, Illinois (the “One North State Street Property”) with an original principal balance of $60.0 million. The One North State Street Loan has a 10-year term and amortizes on a 30-year schedule. The One North State Street Loan accrues interest at a fixed rate equal to 4.6000% and has a cut-off date balance of approximately $59.9 million. Loan proceeds were used to retire existing debt of approximately $37.4 million, fund reserves of approximately $0.7 million and pay closing costs of approximately $0.6 million, giving the borrower a return of equity of approximately $21.3 million. Based on the appraised value of $100.95 million as of December 2, 2013, the cut-off date LTV is 59.3% and the remaining implied equity is approximately $41.0 million. The most recent prior financing of the One North State Street Property was included in the BSCMS 2004-PWR4 transaction.
|
Sources and Uses
|
||||||||
|
Sources
|
Proceeds
|
% of Total
|
Uses
|
Proceeds
|
% of Total
|
|||
|
Loan Amount
|
$60,000,000
|
100.0%
|
Loan Payoff
|
$37,387,314
|
62.3%
|
|||
|
Reserves
|
$744,418
|
1.2%
|
||||||
|
Closing Costs
|
$572,776
|
1.0%
|
||||||
|
Return of Equity
|
$21,295,492
|
35.5%
|
||||||
|
Total Sources
|
$60,000,000
|
100.0%
|
Total Uses
|
$60,000,000
|
100.0%
|
|||
The Borrower / Sponsor. The borrower, TBG State Street LLC, is a single purpose Delaware limited liability company structured to be bankruptcy-remote, with two independent directors in its organizational structure. The sponsor of the borrower and the nonrecourse carve-out guarantor is Isaac Shalom. Isaac Shalom and the Shalom family have been active in the real estate business for over 25 years and currently own and operate a portfolio of more than 20 commercial real estate properties, with a focus on retail properties. The Shalom family owns and manages properties in a variety of markets nationwide, including Chicago, IL, Santa Monica, CA, and Charlotte, NC, with a focus on properties located in New York City.
The Property. The One North State Street Property is a 170,507 sq. ft. vertical subdivision of a 16-story, 713,423 sq. ft. mixed-use office and retail building consisting of retail and storage space located in the basement through third floor. The One North State Street Property is located at the northeast corner of the intersection of North State Street and East Madison Street in downtown Chicago. Burlington Coat Factory occupies the entirety of the basement retail space and TJ Maxx occupies the entirety of the second floor retail space and third floor storage space, with the remainder of the retail tenants occupying ground level space with frontage along North State Street, East Madison Street and North Wabash Avenue. Access to TJ Maxx and Burlington Coat Factory is provided via escalators, elevators and stairs from the ground level. Access to the non-collateral office portion of the building is provided via a separate lobby and elevator bank at ground level. As of October 31, 2013, the One North State Street Property was 97.9% occupied by 15 tenants, including national tenants such as GNC, Jimmy Johns, Chipotle Mexican Grill, Payless Shoe Source and The Body Shop.
The One North State Street Property was originally developed in three phases between 1900 and 1912 and underwent a $30.0 million renovation in 1991 to modernize the building’s HVAC systems, fire systems and elevators and since 1998 an additional $8.0 million has been spent on capital improvements to the property. In 2004, the building was bifurcated into a vertical subdivision containing a retail component which serves as collateral for the One North State Street Loan, and the non-collateral office component. The sponsor acquired the retail component in 2004 for approximately $54.5 million. Historical sales for tenants at the One North State Street Property are presented in the subsequent chart.
|
Historical Sales PSF(1)
|
|||||||||||
|
2009
|
2010
|
2011
|
2012
|
T-12 2013(2)
|
2012 National
Average |
T-12 Occupancy
Cost(2) |
|||||
|
TJ Maxx
|
$374
|
$380
|
$379
|
$399
|
$438
|
$274
|
9.3%
|
||||
|
Burlington Coat Factory
|
NAP
|
NAP
|
NAP
|
NAP
|
$219
|
$102
|
20.2%
|
||||
|
Garrett Popcorn Shops
|
$1,269
|
$1,222
|
$1,265
|
$1,387
|
$1,426
|
NAV
|
9.5%
|
||||
|
Pay Half
|
$216
|
$234
|
$227
|
$223
|
$218
|
NAV
|
24.1%
|
||||
|
Dunkin Donuts
|
NAP
|
NAP
|
$424
|
$446
|
$470
|
NAV
|
16.3%
|
||||
|
Other In-Line Tenants(3)
|
$424
|
$438
|
$440
|
$406
|
$418
|
NAP
|
29.0%
|
||||
|
(1)
|
Historical Sales PSF is based on historical operating statements provided by the borrower.
|
|
(2)
|
T-12 2013 sales and T-12 Occupancy Cost for the period ending August 2013 through November 2013, depending on individual tenants’ sales reporting cycles.
|
|
(3)
|
Four additional tenants, representing 7,824 sq. ft., reported sales in 2009 through 2011. Six additional tenants, representing 10,692 sq. ft., reported sales in 2012 and T-12 2013.
|
The depositor has filed a registration statement (including the prospectus) with the SEC (SEC File No. 333-193376) for the offering to which this communication relates. Before you invest, you should read the prospectus in the registration statement and other documents the depositor has filed with the SEC for more complete information about the depositor, the issuing trust and this offering. You may get these documents for free by visiting EDGAR on the SEC website at www.sec.gov. Alternatively, the depositor or Deutsche Bank Securities Inc., any other underwriter, or any dealer participating in this offering will arrange to send you the prospectus if you request it by calling toll-free 1-800-503-4611 or by email to the following address: prospectus.cpdg@db.com. The offered certificates referred to in these materials, and the asset pool backing them, are subject to modification or revision (including the possibility that one or more classes of certificates may be split, combined or eliminated at any time prior to issuance or availability of a final prospectus) and are offered on a “when, as and if issued” basis. You understand that, when you are considering the purchase of these certificates, a contract of sale will come into being no sooner than the date on which the relevant class has been priced and we have verified the allocation of certificates to be made to you; any “indications of interest” expressed by you, and any “soft circles” generated by us, will not create binding contractual obligations for you or us.
69
|
One North State Street
Chicago, IL 60602
|
Collateral Asset Summary – Loan No. 6
One North State Street
|
Cut-off Date Balance:
Cut-off Date LTV:
U/W NCF DSCR:
U/W NOI Debt Yield:
|
$59,907,080
59.3%
1.33x
8.5%
|
Environmental Matters. The Phase I environmental report dated December 11, 2013 recommended no further action at the One North State Street Property other than the development and implementation of an asbestos operation and maintenance plan, which is in place.
The Market. The One North State Street Property is located in Chicago’s central business district, in the area generally known as the Loop, along the State Street retail corridor. The State Street shopping corridor is approximately six blocks long and extends between Lake Street to the north and Jackson Boulevard to the south. The State Street retail corridor is anchored by a 1.4 million sq. ft. Macy’s, which is the second largest department store in the world, occupying an entire city block between Randolph Street and Washington Street, one block to the north of the One North State Street Property. Other notable retail developments along the corridor include Block 37, located one block to the northwest of the One North State Street Property, which features Zara, Anthropologie, Sephora and the Disney Store, as well as Sullivan Center, located one block to the south of the One North State Street Property, which features Target and DSW.
The One North State Street Property is located in the City North submarket, which as of Q3 2013 had an overall retail vacancy of 5.8%, compared to the Chicago metropolitan statistical area overall retail vacancy of 8.9% for the same time period. As of Q3 2013, the City North submarket vacancy was below the historical average vacancy of 6.1%. Absorption in the submarket for Q3 2013 was 356,308 sq. ft., above the historical average of 51,009 sq. ft.
Rental rates for the City North submarket were $20.86 per sq. ft. as of Q3 2013, an increase over 2012 of $20.00 per sq. ft., but well below the historical average of $25.22 per sq. ft. The City North submarket outperformed the Chicago metropolitan statistical average overall, which had average base rents of $16.97 per sq. ft. as of Q3 2013. Market rent conclusions and lease comparables for the One North State Street Property are presented in the subsequent charts.
|
Market Rent Conclusions(1)
|
||||||
|
Lease Category
|
Anchor
|
State Street
|
Madison Street
|
Wabash Avenue
|
Storage
|
Corner Suite
|
|
Total Building Sq. Ft.
|
97,883
|
11,193
|
12,632
|
6,200
|
40,792
|
1,807
|
|
Market Rent (PSF)
|
$30.00
|
$150.00
|
$70.00
|
$60.00
|
$10.00
|
$90.00
|
|
Concessions
|
None
|
None
|
None
|
None
|
None
|
None
|
|
Reimbursements
|
NNN
|
NNN
|
NNN
|
NNN
|
Gross
|
NNN
|
|
Annual Escalation
|
10% Midterm
|
10% Midterm
|
10% Midterm
|
10% Midterm
|
None
|
10% Midterm
|
|
Tenant Improvements (New)
|
$10.00
|
$20.00
|
$20.00
|
$20.00
|
$0.00
|
$20.00
|
|
Tenant Improvements (Renewals)
|
$5.00
|
$5.00
|
$5.00
|
$5.00
|
$0.00
|
$5.00
|
|
Average Lease Term
|
10 Years
|
10 Years
|
10 Years
|
10 Years
|
10 Years
|
10 Years
|
|
(1)
|
Source: Appraisal
|
|
Lease Comparables(1)
|
||||||
|
Property
|
Tenant
|
Lease Category
|
Sq. Ft.
|
Base Rent (PSF)
|
Lease Term (yrs)
|
Reimbursements
|
|
151 North State Street
|
Walgreens
|
Anchor
|
27,385
|
$47.80
|
30
|
NNN
|
|
1 South State Street
|
DSW
|
Anchor
|
21,423
|
$40.00
|
10
|
NNN
|
|
150 North State Street
|
Old Navy
|
Anchor
|
31,382
|
$44.61
|
10
|
NNN
|
|
1 South State Street
|
Target
|
Anchor
|
131,980
|
$35.00
|
10
|
NNN
|
|
108 North State Street
|
Zara
|
Anchor
|
15,029
|
$32.19
|
10
|
NNN
|
|
6 North Michigan Avenue
|
Panera Bread
|
State Street
|
5,076
|
$90.00
|
15
|
NNN
|
|
6 North Michigan Avenue
|
Starbucks
|
State Street
|
1,995
|
$90.00
|
15
|
NNN
|
|
25-39 East Oak Street
|
Hermes
|
State Street
|
7,734
|
$158.95
|
10
|
NNN
|
|
1-15 East Oak Street
|
Citibank
|
State Street
|
4,600
|
$114.53
|
10
|
NNN
|
|
830 North Michigan Avenue
|
Columbia
|
State Street
|
12,000
|
$180.00
|
10
|
NNN
|
|
555 West Monroe Street
|
Hannah’s Bretzels
|
Madison/Wabash
|
3,391
|
$40.00
|
11
|
NNN
|
|
30 East Oak Street
|
Prada
|
Madison/Wabash
|
10,786
|
$91.05
|
10
|
NNN
|
|
227 East Ontario Street
|
Pei Wei
|
Madison/Wabash
|
3,418
|
$55.00
|
10
|
NNN
|
|
11 East Adams Street
|
New Era
|
Madison/Wabash
|
4,550
|
$87.97
|
10
|
NNN
|
|
1203 South Wabash Avenue
|
UPS
|
Madison/Wabash
|
990
|
$66.95
|
15
|
Gross
|
|
(1)
|
Source: Appraisal
|
The depositor has filed a registration statement (including the prospectus) with the SEC (SEC File No. 333-193376) for the offering to which this communication relates. Before you invest, you should read the prospectus in the registration statement and other documents the depositor has filed with the SEC for more complete information about the depositor, the issuing trust and this offering. You may get these documents for free by visiting EDGAR on the SEC website at www.sec.gov. Alternatively, the depositor or Deutsche Bank Securities Inc., any other underwriter, or any dealer participating in this offering will arrange to send you the prospectus if you request it by calling toll-free 1-800-503-4611 or by email to the following address: prospectus.cpdg@db.com. The offered certificates referred to in these materials, and the asset pool backing them, are subject to modification or revision (including the possibility that one or more classes of certificates may be split, combined or eliminated at any time prior to issuance or availability of a final prospectus) and are offered on a “when, as and if issued” basis. You understand that, when you are considering the purchase of these certificates, a contract of sale will come into being no sooner than the date on which the relevant class has been priced and we have verified the allocation of certificates to be made to you; any “indications of interest” expressed by you, and any “soft circles” generated by us, will not create binding contractual obligations for you or us.
70
|
One North State Street
Chicago, IL 60602
|
Collateral Asset Summary – Loan No. 6
One North State Street
|
Cut-off Date Balance:
Cut-off Date LTV:
U/W NCF DSCR:
U/W NOI Debt Yield:
|
$59,907,080
59.3%
1.33x
8.5%
|
Cash Flow Analysis.
|
Cash Flow Analysis
|
||||||
|
2011
|
2012
|
T-12 10/31/2013
|
U/W
|
U/W PSF
|
||
|
Base Rent(1)
|
$4,959,023
|
$4,924,497
|
$5,598,398
|
$5,390,413
|
$31.61
|
|
|
Value of Vacant Space
|
$0
|
$0
|
$0
|
$479,200
|
$2.81
|
|
|
Gross Potential Rent
|
$4,959,023
|
$4,924,497
|
$5,598,398
|
$5,869,613
|
$34.42
|
|
|
Total Recoveries
|
1,814,051
|
1,819,210
|
1,901,501
|
1,991,944
|
$11.68
|
|
|
Total Other Income
|
67,821
|
3,300
|
8,957
|
8,957
|
$0.05
|
|
|
Less: Vacancy & Credit Loss(2)
|
0
|
0
|
0
|
(520,275)
|
($3.05)
|
|
|
Effective Gross Income
|
$6,840,896
|
$6,747,007
|
$7,508,856
|
$7,350,239
|
$43.11
|
|
|
Total Operating Expenses
|
2,153,369
|
2,041,235
|
2,142,533
|
2,240,372
|
$13.14
|
|
|
Net Operating Income
|
$4,687,527
|
$4,705,772
|
$5,366,324
|
$5,109,866
|
$29.97
|
|
|
TI/LC
|
0
|
0
|
0
|
160,237
|
$0.94
|
|
|
Capital Expenditures
|
0
|
0
|
0
|
25,576
|
$0.15
|
|
|
Net Cash Flow
|
$4,687,527
|
$4,705,772
|
$5,366,324
|
$4,924,053
|
$28.88
|
|
|
(1)
|
U/W Base Rent includes $42,903 in contractual step rent through December 2014.
|
|
(2)
|
U/W Vacancy represents 6.6% of gross income and is based on in-place economic vacancy.
|
Property Management. The One North State Street Property is managed by Madison Realty Management Corp., a borrower affiliate.
Lockbox / Cash Management. The One North State Street Loan is structured with a hard lockbox and springing cash management. The borrower was required to send tenant direction letters to all tenants instructing them to deposit all rents and other payments into the lockbox account controlled by the lender. All funds in the lockbox account are swept daily to the borrower’s operating account until the occurrence of a Trigger Period (as defined herein). After the occurrence of and during the continuance of a Trigger Period, all funds in the lockbox in the account will be swept daily to a lender controlled account and disbursed in accordance with the loan documents, and all excess cash flow will be held as additional collateral for the loan, unless a Lease Sweep Period exists, in which case excess cash flow will be swept into a lease sweep account to be used for approved leasing expenses in connection with re-tenanting the Lease Sweep Space (as defined below).
A “Trigger Period” will commence upon the occurrence of (i) an event of default, (ii) if the DSCR for the trailing 12-month period is less than 1.15x, or (iii) upon the occurrence of a Lease Sweep Period (as defined herein), and will end, (A) with respect to a Trigger Period continuing due to clause (i) above, upon the cure of such event of default and acceptance of such cure by lender, (B) with respect to a Trigger Period continuing due to clause (ii) above, if the DSCR for the trailing twelve month period is at least 1.20x for two consecutive calendar quarters, or (C) with respect to a Trigger Period continuing due to clause (iii) above, if such Lease Sweep Period has ended.
A “Lease Sweep Period” will commence on the first monthly payment date following the occurrence of any of the following (i) the date required under the Lease Sweep Lease (as defined herein) by which the related Lease Sweep Tenant (as defined below) is required to give notice of its exercise of the renewal option (and such renewal has not been exercised), and (ii) the date that a Lease Sweep Lease (or any material portion thereof) is surrendered, cancelled or terminated prior to its then current expiration date or the date on which the borrower or property manager receive notice from the Lease Sweep Tenant of its intention to surrender, cancel or terminate the Lease Sweep Lease (or any material portion thereof prior to its then current expiration date, but specifically excluding any right of the tenant under the Lease Sweep Lease to discontinue its business or “go dark”), and will end upon the first to occur of the following of (A) the entirety of the Lease Sweep Space is leased pursuant to one or more leases and sufficient funds have been accumulated in the lease sweep account to cover all anticipated leasing expenses, free rent periods and/or rent abatement periods set forth in such leases, or (B) the date on which the Lease Sweep Tenant exercises its renewal or extension option with respect to all of its Lease Sweep Space and sufficient funds have been accumulated in the lease sweep account to cover all anticipated leasing expenses, free rent periods and/or rent abatement periods set forth in connection with renewal or extension such leases.
The “Lease Sweep Lease” means the Burlington Coat Factory lease or any replacement lease for the space demised under the Burlington Coat Factory lease, and the tenant under such lease, a “Lease Sweep Tenant”. “Lease Sweep Space” means the space demised under the Lease Sweep Lease.
Initial Reserves. At closing, the borrower deposited $744,418 into a tax reserve account.
The depositor has filed a registration statement (including the prospectus) with the SEC (SEC File No. 333-193376) for the offering to which this communication relates. Before you invest, you should read the prospectus in the registration statement and other documents the depositor has filed with the SEC for more complete information about the depositor, the issuing trust and this offering. You may get these documents for free by visiting EDGAR on the SEC website at www.sec.gov. Alternatively, the depositor or Deutsche Bank Securities Inc., any other underwriter, or any dealer participating in this offering will arrange to send you the prospectus if you request it by calling toll-free 1-800-503-4611 or by email to the following address: prospectus.cpdg@db.com. The offered certificates referred to in these materials, and the asset pool backing them, are subject to modification or revision (including the possibility that one or more classes of certificates may be split, combined or eliminated at any time prior to issuance or availability of a final prospectus) and are offered on a “when, as and if issued” basis. You understand that, when you are considering the purchase of these certificates, a contract of sale will come into being no sooner than the date on which the relevant class has been priced and we have verified the allocation of certificates to be made to you; any “indications of interest” expressed by you, and any “soft circles” generated by us, will not create binding contractual obligations for you or us.
71
|
One North State Street
Chicago, IL 60602
|
Collateral Asset Summary – Loan No. 6
One North State Street
|
Cut-off Date Balance:
Cut-off Date LTV:
U/W NCF DSCR:
U/W NOI Debt Yield:
|
$59,907,080
59.3%
1.33x
8.5%
|
Ongoing Reserves. On a monthly basis, the borrower is required to deposit reserves of (i) 1/12 of the estimated annual real estate taxes, which currently equates to $89,330 into a tax reserve account and (ii) $2,131 into a capital expenditure account. The borrower will also be required to deposit 1/12 of the annual insurance premiums into the insurance reserve on a monthly basis if an acceptable blanket insurance policy is no longer in place.
Current Mezzanine or Subordinate Indebtedness. None.
Future Mezzanine or Subordinate Indebtedness Permitted. None.
The depositor has filed a registration statement (including the prospectus) with the SEC (SEC File No. 333-193376) for the offering to which this communication relates. Before you invest, you should read the prospectus in the registration statement and other documents the depositor has filed with the SEC for more complete information about the depositor, the issuing trust and this offering. You may get these documents for free by visiting EDGAR on the SEC website at www.sec.gov. Alternatively, the depositor or Deutsche Bank Securities Inc., any other underwriter, or any dealer participating in this offering will arrange to send you the prospectus if you request it by calling toll-free 1-800-503-4611 or by email to the following address: prospectus.cpdg@db.com. The offered certificates referred to in these materials, and the asset pool backing them, are subject to modification or revision (including the possibility that one or more classes of certificates may be split, combined or eliminated at any time prior to issuance or availability of a final prospectus) and are offered on a “when, as and if issued” basis. You understand that, when you are considering the purchase of these certificates, a contract of sale will come into being no sooner than the date on which the relevant class has been priced and we have verified the allocation of certificates to be made to you; any “indications of interest” expressed by you, and any “soft circles” generated by us, will not create binding contractual obligations for you or us.
72
|
One North State Street
Chicago, IL 60602
|
Collateral Asset Summary – Loan No. 6
One North State Street
|
Cut-off Date Balance:
Cut-off Date LTV:
U/W NCF DSCR:
U/W NOI Debt Yield:
|
$59,907,080
59.3%
1.33x
8.5%
|

The depositor has filed a registration statement (including the prospectus) with the SEC (SEC File No. 333-193376) for the offering to which this communication relates. Before you invest, you should read the prospectus in the registration statement and other documents the depositor has filed with the SEC for more complete information about the depositor, the issuing trust and this offering. You may get these documents for free by visiting EDGAR on the SEC website at www.sec.gov. Alternatively, the depositor or Deutsche Bank Securities Inc., any other underwriter, or any dealer participating in this offering will arrange to send you the prospectus if you request it by calling toll-free 1-800-503-4611 or by email to the following address: prospectus.cpdg@db.com. The offered certificates referred to in these materials, and the asset pool backing them, are subject to modification or revision (including the possibility that one or more classes of certificates may be split, combined or eliminated at any time prior to issuance or availability of a final prospectus) and are offered on a “when, as and if issued” basis. You understand that, when you are considering the purchase of these certificates, a contract of sale will come into being no sooner than the date on which the relevant class has been priced and we have verified the allocation of certificates to be made to you; any “indications of interest” expressed by you, and any “soft circles” generated by us, will not create binding contractual obligations for you or us.
73
|
One North State Street
Chicago, IL 60602
|
Collateral Asset Summary – Loan No. 6
One North State Street
|
Cut-off Date Balance:
Cut-off Date LTV:
U/W NCF DSCR:
U/W NOI Debt Yield:
|
$59,907,080
59.3%
1.33x
8.5%
|
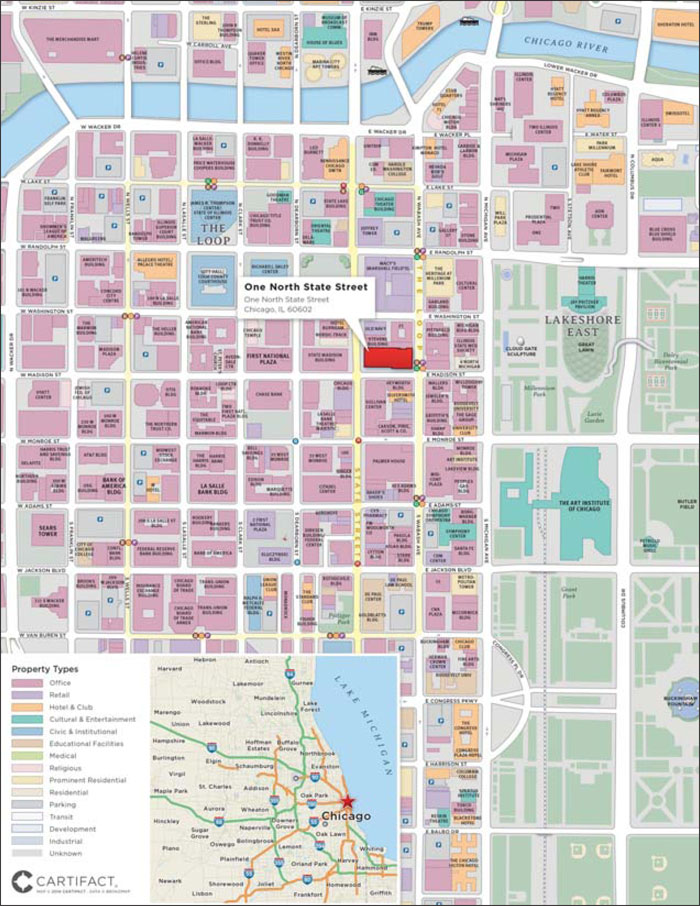
The depositor has filed a registration statement (including the prospectus) with the SEC (SEC File No. 333-193376) for the offering to which this communication relates. Before you invest, you should read the prospectus in the registration statement and other documents the depositor has filed with the SEC for more complete information about the depositor, the issuing trust and this offering. You may get these documents for free by visiting EDGAR on the SEC website at www.sec.gov. Alternatively, the depositor or Deutsche Bank Securities Inc., any other underwriter, or any dealer participating in this offering will arrange to send you the prospectus if you request it by calling toll-free 1-800-503-4611 or by email to the following address: prospectus.cpdg@db.com. The offered certificates referred to in these materials, and the asset pool backing them, are subject to modification or revision (including the possibility that one or more classes of certificates may be split, combined or eliminated at any time prior to issuance or availability of a final prospectus) and are offered on a “when, as and if issued” basis. You understand that, when you are considering the purchase of these certificates, a contract of sale will come into being no sooner than the date on which the relevant class has been priced and we have verified the allocation of certificates to be made to you; any “indications of interest” expressed by you, and any “soft circles” generated by us, will not create binding contractual obligations for you or us.
74
(THIS PAGE INTENTIONALLY LEFT BLANK)
75
|
11767 Harbor Boulevard
Garden Grove, CA 92840
|
Collateral Asset Summary – Loan No. 7
Embassy Suites - Anaheim
|
Cut-off Date Balance:
Cut-off Date LTV:
U/W NCF DSCR:
U/W NOI Debt Yield:
|
$50,000,000
66.1%
1.85x
12.0%
|
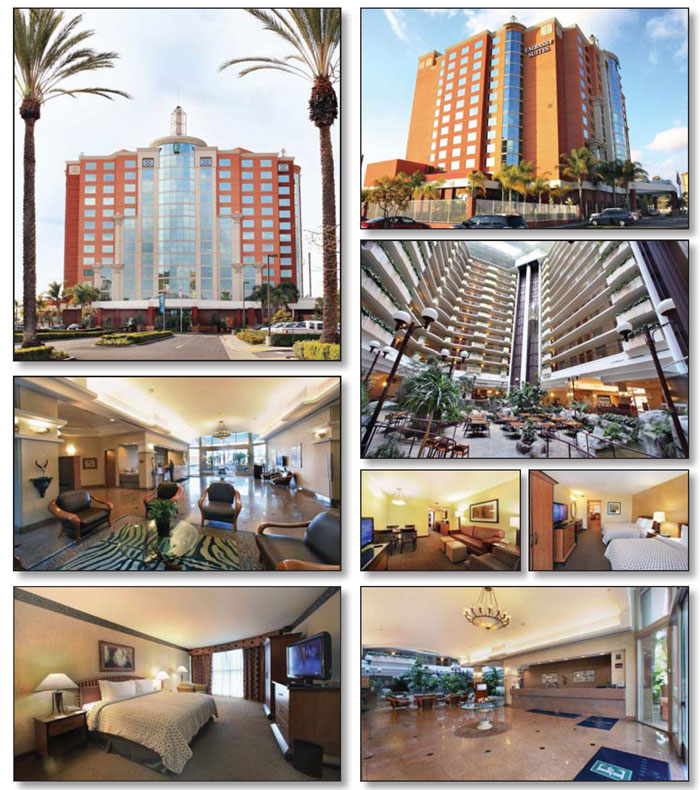
The depositor has filed a registration statement (including the prospectus) with the SEC (SEC File No. 333-193376) for the offering to which this communication relates. Before you invest, you should read the prospectus in the registration statement and other documents the depositor has filed with the SEC for more complete information about the depositor, the issuing trust and this offering. You may get these documents for free by visiting EDGAR on the SEC website at www.sec.gov. Alternatively, the depositor or Deutsche Bank Securities Inc., any other underwriter, or any dealer participating in this offering will arrange to send you the prospectus if you request it by calling toll-free 1-800-503-4611 or by email to the following address: prospectus.cpdg@db.com. The offered certificates referred to in these materials, and the asset pool backing them, are subject to modification or revision (including the possibility that one or more classes of certificates may be split, combined or eliminated at any time prior to issuance or availability of a final prospectus) and are offered on a “when, as and if issued” basis. You understand that, when you are considering the purchase of these certificates, a contract of sale will come into being no sooner than the date on which the relevant class has been priced and we have verified the allocation of certificates to be made to you; any “indications of interest” expressed by you, and any “soft circles” generated by us, will not create binding contractual obligations for you or us.
76
|
11767 Harbor Boulevard
Garden Grove, CA 92840
|
Collateral Asset Summary – Loan No. 7
Embassy Suites - Anaheim
|
Cut-off Date Balance:
Cut-off Date LTV:
U/W NCF DSCR:
U/W NOI Debt Yield:
|
$50,000,000
66.1%
1.85x
12.0%
|
|
Mortgage Loan Information
|
Property Information
|
|||||
|
Loan Seller:
|
UBSRES
|
Single Asset / Portfolio:
|
Single Asset
|
|||
|
Loan Purpose:
|
Refinance
|
Property Type:
|
Full Service Hospitality
|
|||
|
Sponsor:
|
Mark B. David; Richard H. Packard;
|
Collateral:
|
Fee Simple
|
|||
|
Lauren Packard
|
Location:
|
Garden Grove, CA
|
||||
|
Borrower:
|
Landmark Hotels II, LLC
|
Year Built / Renovated:
|
2001 / 2011
|
|||
|
Original Balance:
|
$50,000,000
|
Total Rooms:
|
375
|
|||
|
Cut-off Date Balance:
|
$50,000,000
|
Property Management:
|
Dow Anaheim LLC
|
|||
|
% by Initial UPB:
|
4.0%
|
Underwritten NOI:
|
$6,019,640
|
|||
|
Interest Rate:
|
5.4200%
|
Underwritten NCF:
|
$5,078,539
|
|||
|
Payment Date:
|
6th of each month
|
Appraised Value:
|
$75,600,000
|
|||
|
First Payment Date:
|
March 6, 2014
|
Appraisal Date:
|
November 25, 2013
|
|||
|
Maturity Date:
|
February 6, 2019
|
|||||
|
Amortization:
|
Interest Only
|
Historical NOI
|
||||
|
Additional Debt(1):
|
$10,000,000 Mezzanine Debt
|
Most Recent NOI:
|
$6,114,609 (December 31, 2013)
|
|||
|
Call Protection:
|
L(25), D(31), O(4)
|
2012 NOI:
|
$5,313,033 (December 31, 2012)
|
|||
|
Lockbox / Cash Management:
|
Hard / Springing
|
2011 NOI:
|
$4,502,418 (December 31, 2011)
|
|||
|
2010 NOI:
|
$4,020,330 (December 31, 2010)
|
|||||
|
Reserves(2)
|
||||||
|
Initial
|
Monthly
|
Historical Occupancy
|
||||
|
Taxes:
|
$0
|
$53,887
|
Most Recent Occupancy:
|
81.0% (December 31, 2013)
|
||
|
Insurance:
|
$60,640
|
Springing
|
2012 Occupancy:
|
78.6% (December 31, 2012)
|
||
|
FF&E:
|
$1,093,858
|
1/12 of 5.0% of prior year’s
|
2011 Occupancy:
|
75.4% (December 31, 2011)
|
||
|
gross income
|
2010 Occupancy:
|
71.9% (December 31, 2010)
|
||||
|
(1) For additional information on the mezzanine loan, see “Current Mezzanine or Subordinate Indebtedness” herein.
(2) See “Initial Reserves” and “Ongoing Reserves” herein.
|
||||||
|
Financial Information
|
||||||
|
Mortgage Loan
|
Total Debt
|
|||||
|
Cut-off Date Balance / Room:
|
$133,333
|
$160,000
|
||||
|
Balloon Balance / Room:
|
$133,333
|
$160,000
|
||||
|
Cut-off Date LTV:
|
66.1%
|
79.4%
|
||||
|
Balloon LTV:
|
66.1%
|
79.4%
|
||||
|
Underwritten NOI DSCR:
|
2.19x
|
1.59x
|
||||
|
Underwritten NCF DSCR:
|
1.85x
|
1.34x
|
||||
|
Underwritten NOI Debt Yield:
|
12.0%
|
10.0%
|
||||
|
Underwritten NCF Debt Yield:
|
10.2%
|
8.5%
|
||||
|
Underwritten NOI Debt Yield at Balloon:
|
12.0%
|
10.0%
|
||||
|
Underwritten NCF Debt Yield at Balloon:
|
10.2%
|
8.5%
|
||||
The depositor has filed a registration statement (including the prospectus) with the SEC (SEC File No. 333-193376) for the offering to which this communication relates. Before you invest, you should read the prospectus in the registration statement and other documents the depositor has filed with the SEC for more complete information about the depositor, the issuing trust and this offering. You may get these documents for free by visiting EDGAR on the SEC website at www.sec.gov. Alternatively, the depositor or Deutsche Bank Securities Inc., any other underwriter, or any dealer participating in this offering will arrange to send you the prospectus if you request it by calling toll-free 1-800-503-4611 or by email to the following address: prospectus.cpdg@db.com. The offered certificates referred to in these materials, and the asset pool backing them, are subject to modification or revision (including the possibility that one or more classes of certificates may be split, combined or eliminated at any time prior to issuance or availability of a final prospectus) and are offered on a “when, as and if issued” basis. You understand that, when you are considering the purchase of these certificates, a contract of sale will come into being no sooner than the date on which the relevant class has been priced and we have verified the allocation of certificates to be made to you; any “indications of interest” expressed by you, and any “soft circles” generated by us, will not create binding contractual obligations for you or us.
77
|
11767 Harbor Boulevard
Garden Grove, CA 92840
|
Collateral Asset Summary – Loan No. 7
Embassy Suites - Anaheim
|
Cut-off Date Balance:
Cut-off Date LTV:
U/W NCF DSCR:
U/W NOI Debt Yield:
|
$50,000,000
66.1%
1.85x
12.0%
|
|
Historical Occupancy, ADR, RevPAR(1)
|
|||||||||
|
Embassy Suites - Anaheim Property(2)
|
Competitive Set
|
Penetration Factor
|
|||||||
|
Year
|
Occupancy
|
ADR
|
RevPAR
|
Occupancy
|
ADR
|
RevPAR
|
Occupancy
|
ADR
|
RevPAR
|
|
2011
|
74.8%
|
$131.73
|
$98.53
|
70.3%
|
$111.55
|
$78.45
|
106.4%
|
118.1%
|
125.6%
|
|
2012
|
78.0%
|
$134.23
|
$104.64
|
72.9%
|
$114.17
|
$83.24
|
106.9%
|
117.6%
|
125.7%
|
|
2013
|
80.6%
|
$143.32
|
$115.52
|
74.0%
|
$120.90
|
$89.43
|
109.0%
|
118.5%
|
129.2%
|
|
(1)
|
Source: Hospitality research report.
|
|
(2)
|
The minor variances between the underwriting and the above table with respect to Occupancy, ADR and RevPAR at the Embassy Suites - Anaheim Property are attributable to variances in reporting methodologies and/or timing differences.
|
The Loan. The Embassy Suites - Anaheim loan (the “Embassy Suites - Anaheim Loan”) is a fixed rate loan secured by the borrower’s fee simple interest in a 375-room full service hotel located at 11767 Harbor Boulevard in Garden Grove, California (the “Embassy Suites - Anaheim Property”) with an original principal balance of $50.0 million. The Embassy Suites - Anaheim Loan is interest only for its entire five-year term. The Embassy Suites - Anaheim Loan accrues interest at a fixed rate equal to 5.4200% and has a cut-off date balance of $50.0 million. The Embassy Suites - Anaheim Loan, along with a $10.0 million mezzanine loan and additional borrower equity of approximately $0.5 million, were used to pay off previous debt of approximately $58.3 million, fund upfront reserves of approximately $1.2 million and pay closing costs of approximately $1.1 million. Based on the appraised value of $75.6 million as of November 25, 2013, the cut-off date LTV ratio is 66.1%. The most recent prior financing of the Embassy Suites - Anaheim Property was included in the GKKRE 2007-1A mortgage trust.
|
Sources and Uses
|
||||||
|
Sources
|
Proceeds
|
% of Total
|
Uses
|
Proceeds
|
% of Total
|
|
|
Loan Amount
|
$50,000,000
|
82.7%
|
Loan Payoff
|
$58,256,767
|
96.3%
|
|
|
Mezzanine Loan
|
$10,000,000
|
16.5%
|
Reserves
|
$1,154,498
|
1.9%
|
|
|
Sponsor Equity
|
$467,632
|
0.8%
|
Closing Costs
|
$1,056,368
|
1.7%
|
|
|
Total Sources
|
$60,467,632
|
100.0%
|
Total Uses
|
$60,467,632
|
100.0%
|
|
The Borrower / Sponsor. The borrower, Landmark Hotels II, LLC, is a single purpose Delaware limited liability company structured to be bankruptcy-remote with two independent directors in its organizational structure. The sponsors of the borrower and the non-recourse carve-out guarantors are Mark B. David, Richard H. Packard and Lauren Packard.
Mark B. David founded the Landmark Companies, LLC (“Landmark”) in 1982 and currently serves as its chief executive officer. Landmark is a southern California based real estate company with experience in the commercial, hospitality and residential sectors. Landmark developed the Embassy Suites - Anaheim Property as well as the nearby 371-room Marriott Suites Anaheim in 2001. Landmark has also constructed and developed over 4,000 residential units, of which approximately 1,000 units are currently under its ownership. Through its various entities, Landmark has business relationships with several Fortune 100 companies including General Electric Capital, Westinghouse and Bank of America, and continued partnerships with Chevron Oil and GMAC. Richard H. Packard joined Landmark in 1986 and has overseen the construction and development of over 4,000 residential units and commercial projects including 1,500 apartment units and an 18-hole golf course adjoining a residential development. Mr. Packard is currently the President and Chief Operating Officer of Landmark.
The Property. The Embassy Suites - Anaheim Property is a full service hotel consisting of 375 suites built around a 14-story atrium setting located in Garden Grove, California. The Embassy Suites - Anaheim Property is situated on a 4.06-acre site within a master-planned hotel and restaurant development located on Harbor Boulevard, a primary thoroughfare in Garden Grove, approximately one mile from Disneyland resort attractions, including Disneyland Park, Disney’s California Adventure Park and Downtown Disney. The Embassy Suites - Anaheim Property features approximately 11,000 sq. ft. of meeting and ballroom space, a restaurant and lounge, a breakfast dining area, an outdoor swimming pool and whirlpool, an exercise room, a business center, a gift shop and a Disney tour desk. The Embassy Suites - Anaheim Property has 375 guest suites, with 179 king suites and 196 double suites. All guest suites are made up of two rooms with separate living and sleeping areas and feature a granite-topped wet-bar area with microwave, fridge, sink, and coffeemaker. The Embassy Suites - Anaheim Property was built in 2001 as an Embassy Suites and has benefitted from a consistent capital improvement program, including more than $4.8 million ($12,912 per suite) of improvements since 2007. According to a market research report, the Embassy Suites - Anaheim Property has consistently demonstrated high occupancy levels and outperformed its competitive set, with RevPAR penetration rates ranging from 125.6% to 144.5% over the past five years.
Environmental Matters. A site adjacent to the Embassy Suites – Anaheim Property was formerly utilized as a landfill until 1960. Based upon historical testing at the adjacent site confirming that contaminants were non-detect or below cleanup levels, the Phase I environmental report dated December 5, 2013 recommends no further action at the Embassy Suites - Anaheim Property.
The depositor has filed a registration statement (including the prospectus) with the SEC (SEC File No. 333-193376) for the offering to which this communication relates. Before you invest, you should read the prospectus in the registration statement and other documents the depositor has filed with the SEC for more complete information about the depositor, the issuing trust and this offering. You may get these documents for free by visiting EDGAR on the SEC website at www.sec.gov. Alternatively, the depositor or Deutsche Bank Securities Inc., any other underwriter, or any dealer participating in this offering will arrange to send you the prospectus if you request it by calling toll-free 1-800-503-4611 or by email to the following address: prospectus.cpdg@db.com. The offered certificates referred to in these materials, and the asset pool backing them, are subject to modification or revision (including the possibility that one or more classes of certificates may be split, combined or eliminated at any time prior to issuance or availability of a final prospectus) and are offered on a “when, as and if issued” basis. You understand that, when you are considering the purchase of these certificates, a contract of sale will come into being no sooner than the date on which the relevant class has been priced and we have verified the allocation of certificates to be made to you; any “indications of interest” expressed by you, and any “soft circles” generated by us, will not create binding contractual obligations for you or us.
78
|
11767 Harbor Boulevard
Garden Grove, CA 92840
|
Collateral Asset Summary – Loan No. 7
Embassy Suites - Anaheim
|
Cut-off Date Balance:
Cut-off Date LTV:
U/W NCF DSCR:
U/W NOI Debt Yield:
|
$50,000,000
66.1%
1.85x
12.0%
|
The Market. The Embassy Suites - Anaheim Property is located in Garden Grove, Orange County, California, approximately one mile from Disneyland resort attractions, including Disneyland Park, Disney’s California Adventure Park and Downtown Disney. Orange County is located along the coastline in Southern California, just south of greater Los Angeles and north of San Diego. Orange County is known for its sunny beaches and tourism attractions, which attracted approximately 43.8 million visitors in 2012. Major demand generators in Orange County, all of which are less than nine miles from the Embassy Suites - Anaheim Property, include the Disneyland resort attractions, Knott’s Berry Farm, Anaheim Convention Center, the Discovery Science Center, Angel Stadium of Anaheim and Honda Center. As of 2012, the Los Angeles combined statistical area had a population of 18.3 million, an increase of 2.0% since 2010, and Orange County had a population of 3.1 million, an increase of 3.0% since 2010. As of 2012, the unemployment rate in Orange County was 7.6%, down from 8.8% in 2011.
The Walt Disney Company is the largest private‐sector employer in Orange County. Its operations include Disneyland Park and the Disney California Adventure Park theme parks, three Disneyland hotels, the Mighty Ducks NHL hockey franchise, and the Anaheim Angels major league baseball team, among others. Recent updates to its theme parks include the opening of the “Cars Land” and “Ariel’s Undersea Adventure” attractions at Disney’s California Adventure in the summer of 2012 at a reported cost of $1.1 billion, which have boosted visitation levels. According to a market research report, in 2012 Disneyland Park had approximately 15.9 million visitors and Disney’s California Adventure Park hosted 7.8 million visitors. The Anaheim Convention Center, located approximately 0.6 miles north of the Embassy Suites - Anaheim Property, offers 815,000 square feet of exhibit space, more than 130,000 square feet of meeting space, and a 7,500-seat arena facility. The center recently expanded its outdoor and special event space by 100,000 square feet into a new multi‐use venue area called the Grand Plaza, which opened in December 2012. The Anaheim Convention Center has welcomed over 1.0 million visitors per year in each of the past eight years.
The subsequent chart presents primary competitors to the Embassy Suites - Anaheim Property:
|
Primary Competitive Set(1)
|
||||||
|
Property
|
# of Rooms
|
Year Opened
|
Meeting Space (Sq. Ft.)
|
2013
Occupancy(2)
|
2013 ADR(2)
|
2013
RevPAR(2) |
|
Embassy Suites – Anaheim Property
|
375
|
2001
|
10,812
|
80.9%
|
$142.05
|
$114.92
|
|
Marriott Suites Anaheim
|
371
|
2002
|
9,922
|
84.0%
|
$113.00
|
$94.92
|
|
Sheraton Garden Grove Anaheim South
|
285
|
2008
|
8,330
|
69.0%
|
$95.00
|
$65.55
|
|
Crowne Plaza Resort Anaheim Garden Grove
|
376
|
2000
|
36,000
|
78.0%
|
$100.00
|
$78.00
|
|
Hyatt Regency Orange County
|
654
|
1986
|
65,032
|
78.0%
|
$143.00
|
$111.54
|
|
Sheraton Park Hotel at the Anaheim Resort
|
490
|
1971
|
27,112
|
75.0%
|
$132.00
|
$99.00
|
|
DoubleTree by Hilton Suites Anaheim Resort Convention Center
|
251
|
2006
|
7,500
|
85.0%
|
$142.00
|
$120.70
|
|
Total/Wtd. Avg.
|
2,802
|
78.4%
|
$126.63
|
$99.24
|
||
|
(1)
|
Source: Appraisal
|
|
(2)
|
2013 Occupancy, 2013 ADR and 2013 RevPAR represent estimates from the appraiser.
|
Cash Flow Analysis.
|
Cash Flow Analysis
|
||||||
|
2010
|
2011
|
2012
|
12/31/2013
|
U/W
|
U/W per Room
|
|
|
Occupancy
|
71.9%
|
75.4%
|
78.6%
|
81.0%
|
81.0%
|
|
|
ADR
|
$135.47
|
$130.30
|
$132.65
|
$142.13
|
$142.13
|
|
|
RevPAR
|
$97.47
|
$98.21
|
$104.26
|
$115.06
|
$115.06
|
|
|
Room Revenue
|
$13,340,657
|
$13,442,823
|
$14,310,165
|
$15,749,488
|
$15,749,488
|
$41,999
|
|
F&B Revenue
|
1,966,163
|
1,880,670
|
1,750,308
|
1,905,717
|
1,905,717
|
5,082
|
|
Other Revenue(1)
|
638,479
|
620,616
|
1,101,088
|
1,166,822
|
1,166,822
|
3,112
|
|
Total Dept. Revenue
|
$15,945,299
|
$15,944,109
|
$17,161,561
|
$18,822,027
|
$18,822,027
|
$50,192
|
|
Total Dept. Expenses
|
5,887,773
|
5,680,798
|
5,958,555
|
6,390,264
|
6,390,264
|
17,041
|
|
Total Dept. Profit
|
$10,057,526
|
$10,263,311
|
$11,203,006
|
$12,431,763
|
$12,431,763
|
$33,151
|
|
Undistributed Expenses
|
5,223,023
|
4,799,991
|
4,880,486
|
5,269,931
|
5,366,776
|
14,311
|
|
Total Fixed Expenses
|
814,173
|
960,902
|
1,009,487
|
1,047,223
|
1,045,346
|
2,788
|
|
Net Operating Income
|
$4,020,330
|
$4,502,418
|
$5,313,033
|
$6,114,609
|
$6,019,640
|
$16,052
|
|
FF&E
|
0
|
798,970
|
903,517
|
987,107
|
941,101
|
2,510
|
|
Net Cash Flow
|
$4,020,330
|
$3,703,448
|
$4,409,516
|
$5,127,502
|
$5,078,539
|
$13,543
|
|
(1)
|
Other Revenue includes parking and event revenue, transportation sales, ticket sales, laundry fees, internet fees, cancellation fees, gift shop and other rental and miscellaneous revenue.
|
The depositor has filed a registration statement (including the prospectus) with the SEC (SEC File No. 333-193376) for the offering to which this communication relates. Before you invest, you should read the prospectus in the registration statement and other documents the depositor has filed with the SEC for more complete information about the depositor, the issuing trust and this offering. You may get these documents for free by visiting EDGAR on the SEC website at www.sec.gov. Alternatively, the depositor or Deutsche Bank Securities Inc., any other underwriter, or any dealer participating in this offering will arrange to send you the prospectus if you request it by calling toll-free 1-800-503-4611 or by email to the following address: prospectus.cpdg@db.com. The offered certificates referred to in these materials, and the asset pool backing them, are subject to modification or revision (including the possibility that one or more classes of certificates may be split, combined or eliminated at any time prior to issuance or availability of a final prospectus) and are offered on a “when, as and if issued” basis. You understand that, when you are considering the purchase of these certificates, a contract of sale will come into being no sooner than the date on which the relevant class has been priced and we have verified the allocation of certificates to be made to you; any “indications of interest” expressed by you, and any “soft circles” generated by us, will not create binding contractual obligations for you or us.
79
|
11767 Harbor Boulevard
Garden Grove, CA 92840
|
Collateral Asset Summary – Loan No. 7
Embassy Suites - Anaheim
|
Cut-off Date Balance:
Cut-off Date LTV:
U/W NCF DSCR:
U/W NOI Debt Yield:
|
$50,000,000
66.1%
1.85x
12.0%
|
Lockbox / Cash Management. The Embassy Suites - Anaheim Loan is structured with a hard lockbox and springing cash management. All rents and other payments are required to be deposited directly into a clearing account controlled by the lender. So long as no Cash Management Trigger Event Period (defined below) exists, all funds in the clearing account will be released to the borrower. During the existence of a Cash Management Trigger Event Period, all funds in the clearing account will be swept daily into an account controlled by the lender (the “Cash Management Account”) and, in the absence of any Cash Sweep Event Period (defined below), all funds in the Cash Management Account will be applied by the lender to payments of debt service, required reserves, approved operating expenses and other items required under the loan documents and the remaining cash flow will be released to the mezzanine lender and/or the borrower. During the existence of any Cash Sweep Event Period (other than an event of default or a mezzanine event of default), the remaining cash flow (after payment of mezzanine debt service) will be held by the lender as additional collateral for the loan. Upon the occurrence and during the continuation of any event of default, funds in the Cash Management Account may, in the lender’s discretion, be held as additional collateral for the loan or applied to any obligations under the loan documents. Upon the occurrence and during the continuation of any mezzanine event of default, provided no Cash Sweep Event Period otherwise exists, the remaining cash flow will be held by the mezzanine lender as additional collateral for the mezzanine loan.
A “Cash Management Trigger Event Period” will exist (a) during a Cash Sweep Event Period, or (b) if the DSCR based on the trailing twelve month period immediately preceding the date of determination falls below 1.20x, until such time that the DSCR is greater than 1.25x for two consecutive quarters.
A “Cash Sweep Event Period” will exist (i) during an event of default under the loan documents, (ii) upon a bankruptcy action of the borrower, guarantor or property manager, until such time that, (a) with respect to the borrower or guarantor, the bankruptcy action has been discharged, stayed or dismissed or (b) with respect to the property manager, the bankruptcy action has been discharged, stayed or dismissed or such property manager has been replaced in accordance with the loan documents, (iii) during a mezzanine event of default as evidenced by the delivery of a written notice from the mezzanine lender to the lender until such time that written evidence of a cure of such default under the mezzanine loan is delivered to the lender by the mezzanine lender, or (iv) if the DSCR based on the trailing twelve month period immediately preceding the date of determination falls below 1.10x, until such time that the DSCR is greater than 1.15x for two consecutive quarters.
Initial Reserves. At closing, the borrower deposited (i) $60,640 into the insurance reserve account, and (ii) $1,093,858 into the FF&E reserve account.
Ongoing Reserves. On a monthly basis, the borrower is required to deposit reserves of (i) 1/12 of the estimated annual real estate taxes, which currently equates to $53,887, into a tax reserve account, (ii) 1/12 of the annual insurance premiums into an insurance reserve account, and (iii) 1/12 of 5.0% of the prior year’s gross income, which currently equates to $78,425, into an FF&E reserve account. Notwithstanding the foregoing, the borrower’s obligation to make monthly deposits into the insurance reserve account is suspended for such time that the borrower maintains an acceptable blanket insurance policy, is financing its insurance premiums and no Insurance Reserve Trigger Event (defined below) has occurred.
An “Insurance Reserve Trigger Event” means the occurrence of any of the following events: (i) the lender’s receipt of any notice of non-payment from the insurance premium finance company, (ii) the borrower’s failure to provide evidence that the insurance coverage is in effect in accordance with the loan documents, (iii) the date that is 8 months following the date on which the DSCR based on the trailing twelve month period immediately preceding the date of determination falls below 1.25x, or (iv) the date on which the DSCR based on the trailing twelve month period immediately preceding the date of determination falls below 1.20x.
Current Mezzanine or Subordinate Indebtedness. In conjunction with the Embassy Suites - Anaheim Loan, Annaly CRE Holdings LLC provided a $10.0 million mezzanine loan (the “Embassy Suites - Anaheim Mezzanine Loan”) that is secured by a pledge of the equity interests in the borrower. The Embassy Suites - Anaheim Mezzanine Loan requires payments of interest only at a rate of 10.25% per annum and is coterminous with the Embassy Suites - Anaheim Loan.
Future Mezzanine or Subordinate Indebtedness Permitted. None.
The depositor has filed a registration statement (including the prospectus) with the SEC (SEC File No. 333-193376) for the offering to which this communication relates. Before you invest, you should read the prospectus in the registration statement and other documents the depositor has filed with the SEC for more complete information about the depositor, the issuing trust and this offering. You may get these documents for free by visiting EDGAR on the SEC website at www.sec.gov. Alternatively, the depositor or Deutsche Bank Securities Inc., any other underwriter, or any dealer participating in this offering will arrange to send you the prospectus if you request it by calling toll-free 1-800-503-4611 or by email to the following address: prospectus.cpdg@db.com. The offered certificates referred to in these materials, and the asset pool backing them, are subject to modification or revision (including the possibility that one or more classes of certificates may be split, combined or eliminated at any time prior to issuance or availability of a final prospectus) and are offered on a “when, as and if issued” basis. You understand that, when you are considering the purchase of these certificates, a contract of sale will come into being no sooner than the date on which the relevant class has been priced and we have verified the allocation of certificates to be made to you; any “indications of interest” expressed by you, and any “soft circles” generated by us, will not create binding contractual obligations for you or us.
80
|
11767 Harbor Boulevard
Garden Grove, CA 92840
|
Collateral Asset Summary – Loan No. 7
Embassy Suites - Anaheim
|
Cut-off Date Balance:
Cut-off Date LTV:
U/W NCF DSCR:
U/W NOI Debt Yield:
|
$50,000,000
66.1%
1.85x
12.0%
|

The depositor has filed a registration statement (including the prospectus) with the SEC (SEC File No. 333-193376) for the offering to which this communication relates. Before you invest, you should read the prospectus in the registration statement and other documents the depositor has filed with the SEC for more complete information about the depositor, the issuing trust and this offering. You may get these documents for free by visiting EDGAR on the SEC website at www.sec.gov. Alternatively, the depositor or Deutsche Bank Securities Inc., any other underwriter, or any dealer participating in this offering will arrange to send you the prospectus if you request it by calling toll-free 1-800-503-4611 or by email to the following address: prospectus.cpdg@db.com. The offered certificates referred to in these materials, and the asset pool backing them, are subject to modification or revision (including the possibility that one or more classes of certificates may be split, combined or eliminated at any time prior to issuance or availability of a final prospectus) and are offered on a “when, as and if issued” basis. You understand that, when you are considering the purchase of these certificates, a contract of sale will come into being no sooner than the date on which the relevant class has been priced and we have verified the allocation of certificates to be made to you; any “indications of interest” expressed by you, and any “soft circles” generated by us, will not create binding contractual obligations for you or us.
81
|
Cut-off Date Balance:
|
$44,700,000
|
||
| 2550 Canyon Springs Parkway |
Collateral Asset Summary – Loan No. 8
|
Cut-off Date LTV:
|
71.0%
|
|
Riverside, CA 92507
|
Canyon Crossing
|
U/W NCF DSCR:
|
1.36x
|
|
U/W NOI Debt Yield:
|
9.3%
|

The depositor has filed a registration statement (including the prospectus) with the SEC (SEC File No. 333-193376) for the offering to which this communication relates. Before you invest, you should read the prospectus in the registration statement and other documents the depositor has filed with the SEC for more complete information about the depositor, the issuing trust and this offering. You may get these documents for free by visiting EDGAR on the SEC website at www.sec.gov. Alternatively, the depositor or Deutsche Bank Securities Inc., any other underwriter, or any dealer participating in this offering will arrange to send you the prospectus if you request it by calling toll-free 1-800-503-4611 or by email to the following address: prospectus.cpdg@db.com. The offered certificates referred to in these materials, and the asset pool backing them, are subject to modification or revision (including the possibility that one or more classes of certificates may be split, combined or eliminated at any time prior to issuance or availability of a final prospectus) and are offered on a “when, as and if issued” basis. You understand that, when you are considering the purchase of these certificates, a contract of sale will come into being no sooner than the date on which the relevant class has been priced and we have verified the allocation of certificates to be made to you; any “indications of interest” expressed by you, and any “soft circles” generated by us, will not create binding contractual obligations for you or us.
82
|
Cut-off Date Balance:
|
$44,700,000
|
||
| 2550 Canyon Springs Parkway |
Collateral Asset Summary – Loan No. 8
|
Cut-off Date LTV:
|
71.0%
|
|
Riverside, CA 92507
|
Canyon Crossing
|
U/W NCF DSCR:
|
1.36x
|
|
U/W NOI Debt Yield:
|
9.3%
|
|
Mortgage Loan Information
|
Property Information
|
|||||
|
Loan Seller:
|
UBSRES
|
Single Asset / Portfolio:
|
Single Asset
|
|||
|
Loan Purpose:
|
Acquisition
|
Property Type:
|
Anchored Retail
|
|||
|
Sponsor:
|
William L. Hutchinson
|
Collateral:
|
Fee Simple
|
|||
|
Borrower:
|
Canyon Crossing Dunhill LLC
|
Location:
|
Riverside, CA
|
|||
|
Original Balance:
|
$44,700,000
|
Year Built / Renovated:
|
2008 / NAP
|
|||
|
Cut-off Date Balance:
|
$44,700,000
|
Total Sq. Ft.:
|
295,949
|
|||
|
% by Initial UPB:
|
3.6%
|
Property Management:
|
Dunhill Partners West
|
|||
|
Interest Rate:
|
4.9975%
|
Underwritten NOI:
|
$4,172,725
|
|||
|
Payment Date:
|
6th of each month
|
Underwritten NCF:
|
$3,924,631
|
|||
|
First Payment Date:
|
January 6, 2014
|
Appraised Value:
|
$62,945,000
|
|||
|
Maturity Date:
|
December 6, 2023
|
Appraisal Date:
|
October 7, 2013
|
|||
|
Amortization:
|
Interest only for first 48 months; 360
|
|||||
|
months thereafter
|
Historical NOI
|
|||||
|
Additional Debt(1):
|
$5,960,000 Mezzanine Debt
|
Most Recent NOI:
|
$3,745,960 (T-12 October 31, 2013)
|
|||
|
Call Protection(2):
|
L(27), D(89), O(4)
|
2012 NOI:
|
$3,630,030 (December 31, 2012)
|
|||
|
Lockbox / Cash Management:
|
Hard / Springing
|
2011 NOI:
|
$3,865,753 (December 31, 2011)
|
|||
|
2010 NOI:
|
$3,710,752 (December 31, 2010)
|
|||||
|
Reserves(3)(4)
|
||||||
|
Initial
|
Monthly
|
Historical Occupancy
|
||||
|
Taxes:
|
$183,508
|
$50,974
|
Most Recent Occupancy:
|
92.5% (October 1, 2013)
|
||
|
Insurance:
|
$48,763
|
$4,600
|
2012 Occupancy:
|
90.8% (December 31, 2012)
|
||
|
TI/LC:
|
$0
|
$16,667
|
2011 Occupancy:
|
90.3% (December 31, 2011)
|
||
|
Replacement:
|
$0
|
$3,699
|
2010 Occupancy:
|
81.2% (December 31, 2010)
|
||
|
Phenix Salon Reserve:
|
$2,000,000
|
$0
|
(1) For additional information on the mezzanine loan, see “Current Mezzanine or Subordinate Indebtedness” herein.
(2) Partial release is permitted. See “Partial Release” herein.
(3) See “Initial Reserves” and “Ongoing Reserves” herein.
(4) In connection with the acquisition of the mortgaged property, an escrow (which is not security for the mortgage loan) was established to secure the performance of Easy Life Furniture, Inc., a tenant at the mortgaged property, under its lease. Pursuant to the related escrow agreement, if any funds from such escrow are released to the borrower, the escrow agent will be required to deposit such funds directly into the clearing account. Upon the occurrence of certain events specified in such escrow agreement (including, without limitation, such tenant being more than 60 days in arrears in the payment of rent, or having gone dark for 15 consecutive days, or such tenant filing for bankruptcy protection), the borrower may elect to have the entire remaining portion of such escrow account disbursed; in such event, a portion of such funds up to the amount of $350,000 will be deposited into the TI/LC reserve account (to be applied to secure a new tenant for the space related to such lease) and any remainder of such funds will be deposited into a separate reserve account (to be paid to the borrower, in monthly installments equal to the amount of rent that such tenant would have paid, in accordance with the mortgage loan agreement).
(5) Based on amortizing debt service payments for the Canyon Crossing Loan and interest only payments on the Canyon Crossing Mezzanine Loan. Based on the current interest only payments, the Underwritten NOI DSCR and Underwritten NCF DSCR are 1.84x and 1.73x, respectively, for the mortgage loan and the Underwritten NOI DSCR and Underwritten NCF DSCR are 1.45x and 1.37x, respectively, for the total debt.
|
|||
|
Waba Reserve:
|
$89,756
|
$0
|
||||
|
Financial Information
|
||||||
|
Mortgage Loan
|
Total Debt
|
|||||
| Cut-off Date Balance / Sq. Ft.: |
$151
|
$171
|
||||
|
Balloon Balance / Sq. Ft.:
|
$137
|
$157
|
||||
|
Cut-off Date LTV:
|
71.0%
|
80.5%
|
||||
|
Balloon LTV:
|
64.2%
|
73.7%
|
||||
|
Underwritten NOI DSCR(6):
|
1.45x
|
1.20x
|
||||
|
Underwritten NCF DSCR(6):
|
1.36x
|
1.13x
|
||||
|
Underwritten NOI Debt Yield:
|
9.3%
|
8.2%
|
||||
|
Underwritten NCF Debt Yield:
|
8.8%
|
7.7%
|
||||
|
Underwritten NOI Debt Yield at Balloon:
|
10.3%
|
9.0%
|
||||
|
Underwritten NCF Debt Yield at Balloon:
|
9.7%
|
8.5%
|
||||
The depositor has filed a registration statement (including the prospectus) with the SEC (SEC File No. 333-193376) for the offering to which this communication relates. Before you invest, you should read the prospectus in the registration statement and other documents the depositor has filed with the SEC for more complete information about the depositor, the issuing trust and this offering. You may get these documents for free by visiting EDGAR on the SEC website at www.sec.gov. Alternatively, the depositor or Deutsche Bank Securities Inc., any other underwriter, or any dealer participating in this offering will arrange to send you the prospectus if you request it by calling toll-free 1-800-503-4611 or by email to the following address: prospectus.cpdg@db.com. The offered certificates referred to in these materials, and the asset pool backing them, are subject to modification or revision (including the possibility that one or more classes of certificates may be split, combined or eliminated at any time prior to issuance or availability of a final prospectus) and are offered on a “when, as and if issued” basis. You understand that, when you are considering the purchase of these certificates, a contract of sale will come into being no sooner than the date on which the relevant class has been priced and we have verified the allocation of certificates to be made to you; any “indications of interest” expressed by you, and any “soft circles” generated by us, will not create binding contractual obligations for you or us.
83
|
Cut-off Date Balance:
|
$44,700,000
|
||
| 2550 Canyon Springs Parkway |
Collateral Asset Summary – Loan No. 8
|
Cut-off Date LTV:
|
71.0%
|
|
Riverside, CA 92507
|
Canyon Crossing
|
U/W NCF DSCR:
|
1.36x
|
|
U/W NOI Debt Yield:
|
9.3%
|
|
Tenant Summary
|
|||||||||||||||||||||||||||
|
Ratings
(Fitch/Moody’s/S&P)(1)
|
Total
Sq. Ft.
|
% of Total
Sq. Ft.
|
Lease
Expiration |
Annual U/W
Base Rent PSF(2) |
Total Sales
(000s)(3) |
Sales PSF(3)
|
Occupancy
Cost (% of Sales)(3) |
||||||||||||||||||||
|
Anchor Tenant
|
|||||||||||||||||||||||||||
|
Toys “R” Us(4)
|
B-/B2/B
|
73,370 | 24.8 | % |
1/31/2024
|
$16.50 |
NAV
|
NAV
|
NAV
|
||||||||||||||||||
|
Major Tenants
|
|||||||||||||||||||||||||||
|
Johns Incredible Pizza(5)
|
NR/NR/NR
|
50,000 | 16.9 | % |
10/31/2022
|
$13.44 |
NAV
|
NAV
|
NAV
|
||||||||||||||||||
|
Mor Furniture for Less(6)
|
NR/NR/NR
|
45,875 | 15.5 | % |
8/31/2020
|
$10.20 | $12,000 | $262 | 3.9% | ||||||||||||||||||
|
Staples(7)
|
BBB/Baa2/BBB
|
20,388 | 6.9 | % |
3/31/2018
|
$14.25 |
NAV
|
NAV
|
NAV
|
||||||||||||||||||
|
Howard’s Appliances(8)
|
NR/NR/NR
|
18,293 | 6.2 | % |
3/31/2018
|
$19.77 |
NAV
|
NAV
|
NAV
|
||||||||||||||||||
|
Party City(9)
|
NR/B3/B
|
15,625 | 5.3 | % |
1/31/2019
|
$18.70 | $2,433 | $156 | 13.6% | ||||||||||||||||||
|
Easy Life Furniture(10)
|
NR/NR/NR
|
14,950 | 5.1 | % |
12/31/2017
|
$16.34 | $2,391 | $160 | 13.1% | ||||||||||||||||||
|
Subtotal
|
165,131 | 55.8 | % | ||||||||||||||||||||||||
|
In-line Tenants (<10,000 sq. ft.)
|
22,895 | 7.7 | % |
Various
|
$29.07 |
NAV
|
NAV
|
NAV
|
|||||||||||||||||||
|
Outparcel Tenants
|
12,280 | 4.1 | % |
Various
|
$34.61 | $3,720 | $303 | 12.8% | |||||||||||||||||||
|
Total Occupied Collateral
|
273,676 | 92.5 | % | ||||||||||||||||||||||||
|
Vacant
|
22,273 | 7.5 | % | ||||||||||||||||||||||||
|
Total/Wtd. Avg.
|
295,949 | 100.0 | % | ||||||||||||||||||||||||
|
(1)
|
Certain ratings are those of the parent company whether or not the parent company guarantees the lease.
|
|
(2)
|
Annual U/W Base Rent PSF includes contractual rent steps through September 1, 2014.
|
|
(3)
|
Total Sales (000s), Sales PSF and Occupancy Cost (% of Sales) are provided by the borrower and only include tenants reporting an entire 12 months of sales as of September 30, 2013. Total Sales (000s), Sales PSF and Occupancy Cost (% of Sales) for Mor Furniture for Less was estimated by the tenant.
|
|
(4)
|
Toys “R” Us has seven, five-year renewal options remaining with 180 days prior notice.
|
|
(5)
|
Johns Incredible Pizza has three, five-year renewal options and one, four-year renewal option remaining with 270 days prior notice.
|
|
(6)
|
Mor Furniture for Less has two, five-year renewal options remaining with 12 months prior notice.
|
|
(7)
|
Staples has four, five-year renewal options remaining with 180 days prior notice.
|
|
(8)
|
Howard’s Appliances has two, five-year renewal options remaining with 180 days prior notice.
|
|
(9)
|
Party City has three, five-year renewal options remaining with 270 days prior notice.
|
|
(10)
|
Easy Life Furniture has two, five-year renewal options remaining with 180 days prior notice.
|
|
(1)
|
Certain tenants have lease termination options that may become exercisable prior to the originally stated expiration date of the tenant lease that are not considered in the lease rollover schedule.
|
|
(2)
|
Annual U/W Base Rent Per Sq. Ft., % U/W Base Rent Rolling and Cumulative % of U/W Base Rent include contractual rent steps through September 1, 2014.
|
|
(3)
|
Annual U/W Base Rent Per Sq. Ft., % U/W Base Rent Rolling and Cumulative % of U/W Base Rent are based on the underwritten occupied base rent and underwritten occupied sq. ft., and exclude any gross up of vacant space.
|
The depositor has filed a registration statement (including the prospectus) with the SEC (SEC File No. 333-193376) for the offering to which this communication relates. Before you invest, you should read the prospectus in the registration statement and other documents the depositor has filed with the SEC for more complete information about the depositor, the issuing trust and this offering. You may get these documents for free by visiting EDGAR on the SEC website at www.sec.gov. Alternatively, the depositor or Deutsche Bank Securities Inc., any other underwriter, or any dealer participating in this offering will arrange to send you the prospectus if you request it by calling toll-free 1-800-503-4611 or by email to the following address: prospectus.cpdg@db.com. The offered certificates referred to in these materials, and the asset pool backing them, are subject to modification or revision (including the possibility that one or more classes of certificates may be split, combined or eliminated at any time prior to issuance or availability of a final prospectus) and are offered on a “when, as and if issued” basis. You understand that, when you are considering the purchase of these certificates, a contract of sale will come into being no sooner than the date on which the relevant class has been priced and we have verified the allocation of certificates to be made to you; any “indications of interest” expressed by you, and any “soft circles” generated by us, will not create binding contractual obligations for you or us.
84
|
Cut-off Date Balance:
|
$44,700,000
|
||
| 2550 Canyon Springs Parkway |
Collateral Asset Summary – Loan No. 8
|
Cut-off Date LTV:
|
71.0%
|
|
Riverside, CA 92507
|
Canyon Crossing
|
U/W NCF DSCR:
|
1.36x
|
|
U/W NOI Debt Yield:
|
9.3%
|
The Loan. The Canyon Crossing loan (the “Canyon Crossing Loan”) is a fixed rate loan secured by the borrower’s fee simple interest in a 295,949 sq. ft. anchored retail center located at 2550 Canyon Springs Parkway in Riverside, California (the “Canyon Crossing Property”) with an original principal balance of $44.7 million. The Canyon Crossing Loan has a ten-year term and amortizes on a 30-year schedule after an initial four-year interest only period. The Canyon Crossing Loan accrues interest at a fixed rate equal to 4.9975% and has a cut-off date balance of $44.7 million. The Canyon Crossing Loan, together with approximately $15.5 million of sponsor equity and an approximately $6.0 million mezzanine loan, were used to acquire the Canyon Crossing Property for a purchase price of approximately $62.9 million, fund upfront reserves of approximately $2.3 million and pay closing costs of approximately $0.9 million. Based on the appraised value of approximately $62.9 million as of October 7, 2013, the cut-off date LTV is 71.0%. The most recent prior financing of the Canyon Crossing Property was not included in a securitization.
|
Sources and Uses
|
|||||||||||||||||||
|
Sources
|
Proceeds
|
% of Total
|
Uses
|
Proceeds
|
% of Total
|
||||||||||||||
|
Loan Amount
|
$44,700,000 | 67.5 | % |
Purchase Price
|
$62,944,162 | 95.1 | % | ||||||||||||
|
Mezzanine Loan
|
$5,960,000 | 9.0 | % |
Reserves
|
$2,322,027 | 3.5 | % | ||||||||||||
|
Sponsor Equity
|
$15,547,513 | 23.5 | % |
Closing Costs
|
$941,324 | 1.4 | % | ||||||||||||
|
Total Sources
|
$66,207,513 | 100.0 | % |
Total Uses
|
$66,207,513 | 100.0 | % | ||||||||||||
The Borrower / Sponsor. The borrower, Canyon Crossing Dunhill LLC, is a single purpose Delaware limited liability structured to be bankruptcy-remote with two independent directors in its organizational structure. The nonrecourse carve-out guarantor is William L. Hutchinson, President of Dunhill Partners and the sponsor of the borrower.
Dunhill Partners (“Dunhill”) is a full-service real estate investment, leasing and management company based in Dallas, Texas. William L. Hutchinson founded Dunhill in 1984. Dunhill has acquired and sold over $3 billion worth of shopping centers over the last ten years and currently owns and manages more than 4.5 million sq. ft. of retail properties in Texas, California, and Hawaii. Dunhill frequently invests in properties with joint venture capital partners, which currently include Kimco Realty, RioCan Real Estate Investment Trust, Pacific Coast Capital Partners, LLC, as well as a number of high net worth individuals. Dunhill’s key employees invest in every Dunhill deal.
The Property. The Canyon Crossing Property is a 295,949 sq. ft. anchored retail shopping center constructed in 2008 on a 35.3-acre site located in Riverside, California, approximately 55 miles east of Los Angeles. The Canyon Crossing Property is comprised of seven retail buildings, two outparcel restaurant buildings, and six undeveloped outparcels, and is shadow-anchored by an approximately 185,000 sq. ft. Walmart Supercenter and an approximately 45,000 sq. ft. LA Fitness. The Canyon Crossing Property is anchored by Toys “R” Us and includes major tenants Johns Incredible Pizza, Mor Furniture for Less, Staples and Howard’s Appliances. Hooter’s and Jason’s Deli occupy the outparcel restaurant buildings. As of the October 1, 2013 rent roll, the Canyon Crossing Property was 92.5% occupied.
The Canyon Crossing Property is located in a major retail hub at the junction of Interstate 215 (Escondido Freeway) and State Route 60 (Pomona Freeway) featuring Walmart, Sam’s Club, Target, Costco, Lowe’s, Sports Authority and Best Buy among other national tenants as well as the Moreno Valley Mall, which is anchored by Macy’s, JCPenney and Sears. The Canyon Crossing Property features direct frontage and exposure on both Interstate 215 and State Route 60, with average daily traffic counts of 122,852 and 137,456, respectively. Interstate 215 is a north-south business loop connecting the San Bernardino Freeway, a transcontinental highway, which connects Los Angeles to the rest of the nation, and the Ontario Freeway, which connects San Diego County and Nevada. State Route 60 connects Los Angeles to the cities of Riverside and Banning.
The Market. The Canyon Crossing Property is located in Riverside, California, within Riverside County. Riverside County is located in the southern portion of the state to the east of Los Angeles and together with San Bernardino County is known as the Inland Empire. Large-scale development in the Inland Empire began in the 1970’s with residential bedroom communities due to low housing costs and ample freeway access to larger employment centers in Los Angeles County and Orange County. Industrial development followed as well due to lower costs and transportation infrastructure. According to the appraisal, the estimated population of the Inland Empire as of 2013 was 4.4 million, an increase of 3.9% since 2010, and unemployment as of June 2013 was 10.2%, a decrease from 13.9% in 2010. The population within a one-, three- and five-mile radius is 6,522, 90,781, and 246,667, respectively. The average household income within a one-, three-, and five-mile radius is $63,645, $63,628, and $68,678, respectively.
According to the appraisal, the Canyon Crossing Property is located in the Moreno Valley / Riverside / Corona retail submarket, which contains approximately 10.2 million square feet. As of the second quarter of 2013, the overall vacancy rate was 6.8%, which represented a decrease of 20 basis points over the previous quarter and a decrease of 230 basis points from its recession peak of 9.1% in 2009. The average rental rate for the market was $20.36 per sq. ft. which represented a $0.09 per sq. ft. increase over the previous quarter’s average rental rate of $20.27 per sq. ft. and a slight increase over the 2012 year-end rate of $20.34 per sq. ft.
The depositor has filed a registration statement (including the prospectus) with the SEC (SEC File No. 333-193376) for the offering to which this communication relates. Before you invest, you should read the prospectus in the registration statement and other documents the depositor has filed with the SEC for more complete information about the depositor, the issuing trust and this offering. You may get these documents for free by visiting EDGAR on the SEC website at www.sec.gov. Alternatively, the depositor or Deutsche Bank Securities Inc., any other underwriter, or any dealer participating in this offering will arrange to send you the prospectus if you request it by calling toll-free 1-800-503-4611 or by email to the following address: prospectus.cpdg@db.com. The offered certificates referred to in these materials, and the asset pool backing them, are subject to modification or revision (including the possibility that one or more classes of certificates may be split, combined or eliminated at any time prior to issuance or availability of a final prospectus) and are offered on a “when, as and if issued” basis. You understand that, when you are considering the purchase of these certificates, a contract of sale will come into being no sooner than the date on which the relevant class has been priced and we have verified the allocation of certificates to be made to you; any “indications of interest” expressed by you, and any “soft circles” generated by us, will not create binding contractual obligations for you or us.
85
|
Cut-off Date Balance:
|
$44,700,000
|
||
| 2550 Canyon Springs Parkway |
Collateral Asset Summary – Loan No. 8
|
Cut-off Date LTV:
|
71.0%
|
|
Riverside, CA 92507
|
Canyon Crossing
|
U/W NCF DSCR:
|
1.36x
|
|
U/W NOI Debt Yield:
|
9.3%
|
The chart below details the Canyon Crossing Property’s competitive set.
|
Competitive Set(1)
|
|||||||
|
Name
|
Canyon
Crossing Property(2) |
Towngate
Center |
Moreno Valley Plaza
|
TownGate Crossing
|
Mission Grove Plaza
|
Canyon Crest Town Center
|
University Village
|
|
Distance
from Subject |
NAP
|
1.5 miles
|
2.2 miles
|
0.5 miles
|
4.3 miles
|
4.1 miles
|
5.1 miles
|
|
Property
Type |
Anchored Retail
|
Anchored Retail
|
Anchored Retail
|
Anchored Retail
|
Anchored Retail
|
Anchored Retail
|
Anchored Retail
|
|
Year Built / Renovated
|
2008
|
1988
|
1983
|
2003
|
1992
|
1978
|
1997
|
|
Total
Occupancy |
92.5%
|
91.0%
|
85.0%
|
96.0%
|
91.0%
|
97.0%
|
84.0%
|
|
Size (Sq. Ft.)
|
295,949
|
379,775
|
341,000
|
246,350
|
351,745
|
250,884
|
222,336
|
|
Anchors /
Major Tenants |
Toys “R” Us, Johns Incredible Pizza,
Mor Furniture for Less
|
Burlington Coat Factory, TJ Maxx/Home Goods, Regency Theaters
|
Superior Warehouse, Harbor Freight Tools, Big Lots
|
Lowe’s Home Improvement, Sports Authority
|
Super K-Mart, SteinMart, Ralphs
|
Ralphs, Rite-Aid
|
Regency Movie Theater
|
|
(1)
|
Source: Appraisal
|
|
(2)
|
Based on the rent roll dated October 1, 2013.
|
Cash Flow Analysis.
|
(1)
|
U/W Vacancy Gross Up is based on vacant sq. ft. as of the rent roll dated October 1, 2013 grossed up at the appraiser’s market rent conclusion for each respective space type.
|
|
(2)
|
U/W Rent Steps includes contractual rent increases through September 1, 2014.
|
|
(3)
|
Total Other Income includes interest income and late fees.
|
|
(4)
|
U/W Vacancy is based on the actual economic vacancy of 10.1%. Actual physical vacancy is 7.5% as of rent roll dated October 1, 2013.
|
|
(5)
|
The increase in U/W Net Operating Income over the trailing 12-months ended October 31, 2012 is primarily attributable to (i) an approximately $287,381 increase in base rent due to recent leases being executed including Phenix Salon, Round Table Pizza, Burger Boss and Waba Grill, (ii) scheduled rent increases of $184,049, and (iii) a $334,051 increase in recoveries due to increases in occupancy.
|
Property Management. The Canyon Crossing Property is managed by Dunhill Partners West, an affiliate of the borrower.
Lockbox / Cash Management. The Canyon Crossing Loan is structured with a hard lockbox and springing cash management. All rents and other payments are required to be deposited directly into a clearing account controlled by the lender. So long as no Cash Management Trigger Event Period (defined below) exists, all funds in the clearing account shall be released to the borrower. During the existence of a Cash Management Trigger Event Period, all funds in the clearing account shall be swept daily into an account controlled by the lender (the “Cash Management Account”) and all funds in the Cash Management Account shall be applied by the lender to payments of debt service, required reserves, approved operating expenses and other items required under the loan documents and then to pay debt service on the mezzanine loan to the borrower’s affiliate and, in the absence of any Cash Sweep Event Period (defined below), the remaining cash flow will be released to the borrower. During the existence of any Cash Sweep Event Period (other than an
The depositor has filed a registration statement (including the prospectus) with the SEC (SEC File No. 333-193376) for the offering to which this communication relates. Before you invest, you should read the prospectus in the registration statement and other documents the depositor has filed with the SEC for more complete information about the depositor, the issuing trust and this offering. You may get these documents for free by visiting EDGAR on the SEC website at www.sec.gov. Alternatively, the depositor or Deutsche Bank Securities Inc., any other underwriter, or any dealer participating in this offering will arrange to send you the prospectus if you request it by calling toll-free 1-800-503-4611 or by email to the following address: prospectus.cpdg@db.com. The offered certificates referred to in these materials, and the asset pool backing them, are subject to modification or revision (including the possibility that one or more classes of certificates may be split, combined or eliminated at any time prior to issuance or availability of a final prospectus) and are offered on a “when, as and if issued” basis. You understand that, when you are considering the purchase of these certificates, a contract of sale will come into being no sooner than the date on which the relevant class has been priced and we have verified the allocation of certificates to be made to you; any “indications of interest” expressed by you, and any “soft circles” generated by us, will not create binding contractual obligations for you or us.
86
|
Cut-off Date Balance:
|
$44,700,000
|
||
| 2550 Canyon Springs Parkway |
Collateral Asset Summary – Loan No. 8
|
Cut-off Date LTV:
|
71.0%
|
|
Riverside, CA 92507
|
Canyon Crossing
|
U/W NCF DSCR:
|
1.36x
|
|
U/W NOI Debt Yield:
|
9.3%
|
event of default), the remaining cash flow shall be held by the lender as additional collateral for the loan. Upon the occurrence and during the continuation of any event of default, funds in the Cash Management Account may, in the lender’s discretion, be held as additional collateral for the loan or applied to any obligations under the loan documents.
A “Cash Management Trigger Event Period” will exist (a) during a Cash Sweep Event Period, or (b) if the DSCR based on the trailing six month period immediately preceding the date of determination falls below 1.20x, until such time that the DSCR is greater than 1.25x for two consecutive quarters.
A “Cash Sweep Event Period” will exist (i) during an event of default under the loan documents, (ii) upon the bankruptcy or insolvency of guarantor, sponsor or manager, upon a bankruptcy action of the borrower, mezzanine borrower, guarantor or property manager, until such time that, (a) with respect to the borrower, mezzanine borrower, or guarantor, the bankruptcy action has been discharged, stayed or dismissed within 60 days or (b) with respect to the property manager, such property manager has been replaced in accordance with the loan documents, or (iii) if the DSCR based on the trailing six month period immediately preceding the date of determination falls below 1.15x, until such time that the DSCR is greater than 1.20x for two consecutive quarters.
Initial Reserves. At closing, the borrower deposited (i) $183,508 into the tax reserve account, (ii) $48,763 into the insurance reserve account, (iii) $2,000,000 into a Phenix Salon Reserve fund, and (iv) $89,756 into the Waba Reserve fund. Phenix Salon and Waba are tenants that have executed leases but were not yet in occupancy at closing. However, Phenix Salon is now in occupancy and, with respect to the $2,000,000 reserve established with respect to such tenant, (i) a $46,612 portion of such reserve related to leasing commissions will be released to the borrower to pay such leasing commissions in accordance with the provisions of the loan documents generally applicable to leasing commissions, (ii) a $126,606 portion of such reserve related to the remaining portion of a tenant improvement allowance will be released to the borrower, subject to, among other things, delivery of a satisfactory estoppel from Phenix Salon confirming Phenix Salon has accepted delivery of its premises, is open for business, has completed all tenant’s work required to be performed under its lease, and the date through which rent has been paid, and (iii) with respect to the remaining $1,826,783 in the rent reserve related to Phenix Salon, such amount will be released to the borrower given, among other things, (a) delivery of a satisfactory estoppel from Phenix Salon confirming Phenix Salon has accepted delivery of its premises, is open for business, all free rent periods have expired and Phenix Salon is paying full, unabated rent, and (b) delivery of a certification by the borrower confirming the matters in the estoppel.
Ongoing Reserves. On a monthly basis, the borrower is required to deposit reserves of (i) 1/12 of the estimated annual real estate taxes, which currently equates to $50,974, into a tax reserve account, (ii) 1/12 of the annual insurance premiums, which currently equates to $4,600, into an insurance reserve account, (iii) $3,699 into a replacement reserve account, and (iv) $16,667 into a TI/LC reserve account, subject to a cap of $600,000.
Current Mezzanine or Subordinate Indebtedness. In conjunction with the Canyon Crossing Loan, Soma Specialty Finance LLC provided a $5.96 million mezzanine loan (the “Canyon Crossing Mezzanine Loan”) that is secured by a pledge of the equity interests in the borrower. The Canyon Crossing Mezzanine Loan is coterminous with the Canyon Crossing Loan and requires payments of interest only at a rate of 10.000% per annum.
Future Mezzanine or Subordinate Indebtedness Permitted. None.
Partial Releases. The borrower may obtain the release of non-income producing portions of the Canyon Crossing Property provided, among other things, that: (i) the borrower shall either (a) prepay a portion of the Canyon Crossing Loan equal to the release price for such parcel, together with a yield maintenance premium of 1.0%, or (b) if the release date of such parcel occurs (after the expiration of the lockout period, defease a portion of the Canyon Crossing Loan equal to the release price of such parcel, notwithstanding the foregoing clauses (a) and (b), with respect to the release of the parcel identified in the loan documents as “Assessor’s Parcel Number 291-460-017”, if such release occurs within nine months after the Canyon Crossing Loan closing date, the borrower has the right to deposit an amount equal to the release price for such parcel into a substitute collateral reserve account); (ii) immediately following the release of a release parcel, either (a) the ratio of the outstanding Canyon Crossing Loan balance to the value of the Canyon Crossing Property less the release parcel is less than or equal to 125%, or (b) the Canyon Crossing Loan is paid down by the lesser of the following amounts: (1) if the release parcel is sold to a third party not affiliated with the borrower, the net proceeds of the sale, (2) the fair market value of the release parcel, or (3) an amount such that the loan to value ratio does not increase at the time of the release.
The depositor has filed a registration statement (including the prospectus) with the SEC (SEC File No. 333-193376) for the offering to which this communication relates. Before you invest, you should read the prospectus in the registration statement and other documents the depositor has filed with the SEC for more complete information about the depositor, the issuing trust and this offering. You may get these documents for free by visiting EDGAR on the SEC website at www.sec.gov. Alternatively, the depositor or Deutsche Bank Securities Inc., any other underwriter, or any dealer participating in this offering will arrange to send you the prospectus if you request it by calling toll-free 1-800-503-4611 or by email to the following address: prospectus.cpdg@db.com. The offered certificates referred to in these materials, and the asset pool backing them, are subject to modification or revision (including the possibility that one or more classes of certificates may be split, combined or eliminated at any time prior to issuance or availability of a final prospectus) and are offered on a “when, as and if issued” basis. You understand that, when you are considering the purchase of these certificates, a contract of sale will come into being no sooner than the date on which the relevant class has been priced and we have verified the allocation of certificates to be made to you; any “indications of interest” expressed by you, and any “soft circles” generated by us, will not create binding contractual obligations for you or us.
87
|
Cut-off Date Balance:
|
$44,700,000
|
||
| 2550 Canyon Springs Parkway |
Collateral Asset Summary – Loan No. 8
|
Cut-off Date LTV:
|
71.0%
|
|
Riverside, CA 92507
|
Canyon Crossing
|
U/W NCF DSCR:
|
1.36x
|
|
U/W NOI Debt Yield:
|
9.3%
|

The depositor has filed a registration statement (including the prospectus) with the SEC (SEC File No. 333-193376) for the offering to which this communication relates. Before you invest, you should read the prospectus in the registration statement and other documents the depositor has filed with the SEC for more complete information about the depositor, the issuing trust and this offering. You may get these documents for free by visiting EDGAR on the SEC website at www.sec.gov. Alternatively, the depositor or Deutsche Bank Securities Inc., any other underwriter, or any dealer participating in this offering will arrange to send you the prospectus if you request it by calling toll-free 1-800-503-4611 or by email to the following address: prospectus.cpdg@db.com. The offered certificates referred to in these materials, and the asset pool backing them, are subject to modification or revision (including the possibility that one or more classes of certificates may be split, combined or eliminated at any time prior to issuance or availability of a final prospectus) and are offered on a “when, as and if issued” basis. You understand that, when you are considering the purchase of these certificates, a contract of sale will come into being no sooner than the date on which the relevant class has been priced and we have verified the allocation of certificates to be made to you; any “indications of interest” expressed by you, and any “soft circles” generated by us, will not create binding contractual obligations for you or us.
88
|
Cut-off Date Balance:
|
$44,700,000
|
||
| 2550 Canyon Springs Parkway |
Collateral Asset Summary – Loan No. 8
|
Cut-off Date LTV:
|
71.0%
|
|
Riverside, CA 92507
|
Canyon Crossing
|
U/W NCF DSCR:
|
1.36x
|
|
U/W NOI Debt Yield:
|
9.3%
|

The depositor has filed a registration statement (including the prospectus) with the SEC (SEC File No. 333-193376) for the offering to which this communication relates. Before you invest, you should read the prospectus in the registration statement and other documents the depositor has filed with the SEC for more complete information about the depositor, the issuing trust and this offering. You may get these documents for free by visiting EDGAR on the SEC website at www.sec.gov. Alternatively, the depositor or Deutsche Bank Securities Inc., any other underwriter, or any dealer participating in this offering will arrange to send you the prospectus if you request it by calling toll-free 1-800-503-4611 or by email to the following address: prospectus.cpdg@db.com. The offered certificates referred to in these materials, and the asset pool backing them, are subject to modification or revision (including the possibility that one or more classes of certificates may be split, combined or eliminated at any time prior to issuance or availability of a final prospectus) and are offered on a “when, as and if issued” basis. You understand that, when you are considering the purchase of these certificates, a contract of sale will come into being no sooner than the date on which the relevant class has been priced and we have verified the allocation of certificates to be made to you; any “indications of interest” expressed by you, and any “soft circles” generated by us, will not create binding contractual obligations for you or us.
89
|
53 Broadway
Brooklyn, NY 11249
|
Collateral Asset Summary – Loan No. 9
53 Broadway
|
Cut-off Date Balance:
Cut-off Date LTV:
U/W NCF DSCR:
U/W NOI Debt Yield:
|
$37,000,000
62.4%
1.22x
7.9%
|

The depositor has filed a registration statement (including the prospectus) with the SEC (SEC File No. 333-193376) for the offering to which this communication relates. Before you invest, you should read the prospectus in the registration statement and other documents the depositor has filed with the SEC for more complete information about the depositor, the issuing trust and this offering. You may get these documents for free by visiting EDGAR on the SEC website at www.sec.gov. Alternatively, the depositor or Deutsche Bank Securities Inc., any other underwriter, or any dealer participating in this offering will arrange to send you the prospectus if you request it by calling toll-free 1-800-503-4611 or by email to the following address: prospectus.cpdg@db.com. The offered certificates referred to in these materials, and the asset pool backing them, are subject to modification or revision (including the possibility that one or more classes of certificates may be split, combined or eliminated at any time prior to issuance or availability of a final prospectus) and are offered on a “when, as and if issued” basis. You understand that, when you are considering the purchase of these certificates, a contract of sale will come into being no sooner than the date on which the relevant class has been priced and we have verified the allocation of certificates to be made to you; any “indications of interest” expressed by you, and any “soft circles” generated by us, will not create binding contractual obligations for you or us.
90
|
53 Broadway
Brooklyn, NY 11249
|
Collateral Asset Summary – Loan No. 9
53 Broadway
|
Cut-off Date Balance:
Cut-off Date LTV:
U/W NCF DSCR:
U/W NOI Debt Yield:
|
$37,000,000
62.4%
1.22x
7.9%
|
|
Mortgage Loan Information
|
Property Information
|
|||||||
|
Loan Seller:
|
GACC
|
Single Asset / Portfolio:
|
Single Asset
|
|||||
|
Loan Purpose:
|
Acquisition
|
Property Type:
|
Mid-Rise Multifamily
|
|||||
|
Sponsor:
|
Jonathan Joels; Richard Kreisel-Kilstock
|
Collateral:
|
Fee Simple
|
|||||
|
Borrower:
|
Broadway Brooklyn Acquisition, LLC
|
Location:
|
Brooklyn, NY
|
|||||
|
Original Balance:
|
$37,000,000
|
Year Built / Renovated:
|
2013 / NAP
|
|||||
|
Cut-off Date Balance:
|
$37,000,000
|
Total Units(5)(7):
|
75
|
|||||
|
% by Initial UPB:
|
3.0%
|
Property Management:
|
Metro Management Development, Inc.
|
|||||
|
Interest Rate:
|
4.9800%
|
Underwritten NOI:
|
$2,917,856
|
|||||
|
Payment Date:
|
6th of each month
|
Underwritten NCF:
|
$2,899,106
|
|||||
|
First Payment Date:
|
March 6, 2014
|
“As-is” Appraised Value(8):
|
$59,300,000
|
|||||
|
Maturity Date:
|
February 6, 2024
|
“As-is” Appraisal Date:
|
December 12, 2013
|
|||||
|
Amortization:
|
Interest only for first 60 months; 360 months thereafter
|
“As Stabilized” Appraised Value(9):
|
$59,700,000
|
|||||
|
Additional Debt:
|
None
|
“As Stabilized” Appraisal Date:
|
July 1, 2014
|
|||||
|
Call Protection(1):
|
L(25), D(91), O(4)
|
|||||||
|
Lockbox / Cash Management(2):
|
Soft / Springing
|
Historical NOI(10)
|
||||||
|
Most Recent NOI:
|
NAP
|
|||||||
|
Reserves(3)
|
2012 NOI:
|
NAP
|
||||||
|
Initial
|
Monthly
|
2011 NOI:
|
NAP
|
|||||
|
Taxes:
|
$4,972
|
$2,486
|
2010 NOI:
|
NAP
|
||||
|
Insurance:
|
$3,552
|
$3,552
|
||||||
|
Replacement:
|
$0
|
$1,563
|
Historical Occupancy(10)
|
|||||
|
TI/LC:
|
$317,400
|
$1,428
|
Current Occupancy(11):
|
100.0% (January 9, 2014)
|
||||
|
Multifamily Pre-Paid Rent & Concessions:
|
$229,910
|
$0
|
2012 Occupancy:
|
NAP
|
||||
|
Additional Commercial Income:
|
$79,350
|
$0
|
2011 Occupancy:
|
NAP
|
||||
|
Other Income:
|
$154,320
|
$0
|
2010 Occupancy:
|
NAP
|
||||
|
Common Charges:
|
$0
|
1/12 of annual budget
|
(1) Partial release is permitted. See “Partial Release” herein.
(2) The lockbox is soft for residential tenants and hard for commercial tenants. See “Lockbox / Cash Management” herein.
(3) See “Initial Reserves” and “Ongoing Reserves” herein.
(4) Deposits to the Commercial/Parking Rent reserve come from an escrow funded by the previous owner of the 53 Broadway Property and are held by an escrow agent. See “Initial Reserves” and “Ongoing Reserves” herein.
(5) Based on 75 residential apartments.
(6) Based on amortizing debt service payments. Based on the current interest only payments, the Underwritten NOI DSCR and Underwritten NCF DSCR are 1.56x and 1.55x, respectively.
(7) The 53 Broadway Property consists of 75 residential apartments, 12,510 sq. ft. of commercial space and a 60-car parking lot.
(8) The “As-is” Appraised Value includes an “As-is” Appraised Value of $50.3 million for the residential component and an “As-is” Appraised Value of $9.0 million for the commercial component.
(9) The “As Stabilized” Appraised Value is based on the 53 Broadway Property achieving stabilized operations. The “As Stabilized” Appraised Value includes an “As Stabilized” Appraised Value of $50.3 million for the residential component which has achieved stabilized operations and is equal to the “As-is” Appraised Value, and an “As Stabilized” Appraised Value of $9.4 million for the commercial component. Based on the Cut-off Date Balance of $37.0 million, the “As Stabilized” LTV ratio is 62.0%.
(10) The 53 Broadway Property was constructed in 2013. As such, Historical NOI and Historical Occupancy are not applicable.
(11) Current Occupancy is based on the 75-unit residential component. The commercial component of the 53 Broadway Property is 77.6% leased.
|
|||||
|
Overage Payment:
|
$0
|
Springing
|
||||||
|
Commercial/Parking Rent(4):
|
$0
|
Ongoing
|
||||||
|
Financial Information
|
||||||||
|
Cut-off Date Balance / Unit(5):
|
$493,333
|
|||||||
|
Balloon Balance / Unit(5):
|
$454,805
|
|||||||
|
Cut-off Date LTV:
|
62.4%
|
|||||||
|
Balloon LTV:
|
57.5%
|
|||||||
|
Underwritten NOI DSCR(6):
|
1.23x
|
|||||||
|
Underwritten NCF DSCR(6):
|
1.22x
|
|||||||
|
Underwritten NOI Debt Yield:
|
7.9%
|
|||||||
|
Underwritten NCF Debt Yield:
|
7.8%
|
|||||||
|
Underwritten NOI Debt Yield at Balloon:
|
8.6%
|
|||||||
|
Underwritten NCF Debt Yield at Balloon:
|
8.5%
|
|||||||
The depositor has filed a registration statement (including the prospectus) with the SEC (SEC File No. 333-193376) for the offering to which this communication relates. Before you invest, you should read the prospectus in the registration statement and other documents the depositor has filed with the SEC for more complete information about the depositor, the issuing trust and this offering. You may get these documents for free by visiting EDGAR on the SEC website at www.sec.gov. Alternatively, the depositor or Deutsche Bank Securities Inc., any other underwriter, or any dealer participating in this offering will arrange to send you the prospectus if you request it by calling toll-free 1-800-503-4611 or by email to the following address: prospectus.cpdg@db.com. The offered certificates referred to in these materials, and the asset pool backing them, are subject to modification or revision (including the possibility that one or more classes of certificates may be split, combined or eliminated at any time prior to issuance or availability of a final prospectus) and are offered on a “when, as and if issued” basis. You understand that, when you are considering the purchase of these certificates, a contract of sale will come into being no sooner than the date on which the relevant class has been priced and we have verified the allocation of certificates to be made to you; any “indications of interest” expressed by you, and any “soft circles” generated by us, will not create binding contractual obligations for you or us.
91
|
53 Broadway
Brooklyn, NY 11249
|
Collateral Asset Summary – Loan No. 9
53 Broadway
|
Cut-off Date Balance:
Cut-off Date LTV:
U/W NCF DSCR:
U/W NOI Debt Yield:
|
$37,000,000
62.4%
1.22x
7.9%
|
The Loan. The 53 Broadway loan (the “53 Broadway Loan”) is a fixed rate loan secured by the borrower’s fee simple interest in the mid-rise multifamily property consisting of 75 residential apartments, 12,510 sq. ft. of commercial space and a 60-car parking lot, located at 53 Broadway in Brooklyn, New York (the “53 Broadway Property”) and has an original principal balance of $37.0 million. The 53 Broadway Loan has a 10-year term and amortizes on a 30-year schedule after an initial 60 month interest only period. The 53 Broadway Loan accrues interest at a fixed rate equal to 4.9800% and has a cut-off date balance of $37.0 million. Loan proceeds, along with approximately $25.2 million of sponsor equity, were used to acquire the 53 Broadway Property for approximately $58.9 million, fund upfront reserves of approximately $0.8 million and pay closing costs of approximately $2.5 million. Based on the “As-is” appraised value of $59.3 million as of December 12, 2013, the cut-off date LTV ratio is 62.4%. Based on the “As Stabilized” appraised value of $59.7 million as of July 1, 2014, the cut-off date “As Stabilized” LTV ratio is 62.0%. The most recent prior financing of the 53 Broadway Property was not included in a securitization.
|
Sources and Uses
|
||||||
|
Sources
|
Proceeds
|
% of Total
|
Uses
|
Proceeds
|
% of Total
|
|
|
Loan Amount
|
$37,000,000
|
59.5%
|
Purchase Price
|
$58,910,000
|
94.7%
|
|
|
Sponsor Equity
|
$25,206,019
|
40.5%
|
Reserves
|
$789,504
|
1.3%
|
|
|
Closing Costs
|
$2,506,515
|
4.0%
|
||||
|
Total Sources
|
$62,206,019
|
100.0%
|
Total Uses
|
$62,206,019
|
100.0%
|
|
The Borrower / Sponsor. The borrower, Broadway Brooklyn Acquisition, LLC, is a single-purpose Delaware limited liability company structured to be bankruptcy-remote, with two independent directors in its organizational structure. The sponsors of the borrower and the nonrecourse carve-out guarantors are Jonathan Joels and Richard Kreisel-Kilstock, jointly and severally.
Richard Kreisel-Kilstock has over 20 years of experience in commercial and residential real estate investment, development and management. He has overseen the acquisition and development of several residential, retail and hotel properties. In the last five years Kreisel-Kilstock has managed a $100.0 million portfolio of investment properties for a European family that includes assets across Europe and the United States.
Jonathan Joels has been in the real estate industry for 30 years, including a position as CFO of London & Leeds Corporation, the United States subsidiary of Ladbrokes PLC, a major United Kingom-based multinational corporation. London & Leeds Corporation developed a commercial office portfolio in excess of 2.0 million square feet of office space, located primarily in the Northeastern part of the United States. During that time Joels was involved in structuring partnerships with several domestic and international institutions and banks. Joels has been involved with Richard Kreisel-Kilstock in various private investments and joint ventures.
The Property. The 53 Broadway Property consists of a seven-story, Class A mid-rise apartment building located in the Williamsburg neighborhood of Brooklyn, New York. The 53 Broadway Property was constructed in 2013 and contains 75 residential apartments, three retail spaces (each with its own storage facility), one community office facility and a 60-car parking lot. The lobby contains a doorman station, two passenger elevators and two seating areas. Tenants have access to common amenities including a roof terrace, fitness center, tenant lounge/game room, and for additional fees, tenants have access to 60 parking spaces, 88 bicycle storage racks, and 74 individual storage units. In addition, each apartment contains a stacked washer and dryer and most units have private outdoor balconies or terraces. As of January 9, 2014, the residential portion is 100.0% occupied. A breakdown of the residential apartment mix is presented in the subsequent chart.
|
Unit Mix Summary(1)
|
|||||||
|
Unit Type
|
# of Units
|
% of Total
|
Occupancy(2)
|
Average Unit Size
(Sq. Ft.)
|
Average Monthly
Rental Rate
|
Average Monthly
Rental Rate PSF
|
|
|
Studio
|
8
|
10.7%
|
100.0%
|
486
|
$2,568
|
$5.28
|
|
|
1 BD / 1 BA
|
45
|
60.0%
|
100.0%
|
617
|
$3,084
|
$5.00
|
|
|
1 BD / 1 BA + Home Office
|
14
|
18.7%
|
100.0%
|
675
|
$3,323
|
$4.92
|
|
|
2 BD / 2 BA
|
7
|
9.3%
|
100.0%
|
980
|
$4,714
|
$4.81
|
|
|
3 BD / 2 BA
|
1
|
1.3%
|
100.0%
|
1,205
|
$7,300
|
$6.06
|
|
|
Total / Wtd. Avg.
|
75
|
100.0%
|
100.0%
|
656
|
$3,282
|
$5.01
|
|
|
(1)
|
Based on the Appraisal.
|
|
(2)
|
Based on the rent roll date January 9, 2014.
|
The commercial space consists of a 1,232 sq. ft. community facility and three retail spaces totaling 7,935 sq. ft., with each space containing an accompanying basement storage area, which total in the aggregate 3,343 sq. ft. As of February 12, 2014, the commercial space is 77.6% leased. The sponsor signed leases with two tenants totaling 67.7% of the commercial square feet in February 2014. Xin Development is a sales office for a nearby residential condominium and Streets BK LLC is a restaurant tenant. The
The depositor has filed a registration statement (including the prospectus) with the SEC (SEC File No. 333-193376) for the offering to which this communication relates. Before you invest, you should read the prospectus in the registration statement and other documents the depositor has filed with the SEC for more complete information about the depositor, the issuing trust and this offering. You may get these documents for free by visiting EDGAR on the SEC website at www.sec.gov. Alternatively, the depositor or Deutsche Bank Securities Inc., any other underwriter, or any dealer participating in this offering will arrange to send you the prospectus if you request it by calling toll-free 1-800-503-4611 or by email to the following address: prospectus.cpdg@db.com. The offered certificates referred to in these materials, and the asset pool backing them, are subject to modification or revision (including the possibility that one or more classes of certificates may be split, combined or eliminated at any time prior to issuance or availability of a final prospectus) and are offered on a “when, as and if issued” basis. You understand that, when you are considering the purchase of these certificates, a contract of sale will come into being no sooner than the date on which the relevant class has been priced and we have verified the allocation of certificates to be made to you; any “indications of interest” expressed by you, and any “soft circles” generated by us, will not create binding contractual obligations for you or us.
92
|
53 Broadway
Brooklyn, NY 11249
|
Collateral Asset Summary – Loan No. 9
53 Broadway
|
Cut-off Date Balance:
Cut-off Date LTV:
U/W NCF DSCR:
U/W NOI Debt Yield:
|
$37,000,000
62.4%
1.22x
7.9%
|
community facility is leased by Britt Realty LLC, the developer of the 53 Broadway Property, which uses the space for its corporate office. A breakdown of the commercial unit mix is presented in the subsequent chart.
|
Commercial Unit Mix(1)
|
|||||||
|
Tenant
|
Space
|
Commercial
Sq. Ft.
|
% of Total
Commercial Sq. Ft.
|
In-Place Rent
(PSF)
|
Market Rent
(PSF)(2)
|
Lease Start
|
Lease
Expiration
|
|
Britt Realty LLC
|
Community Facility
|
1,232
|
9.8%
|
$30.00
|
$30.00
|
1/27/2014
|
1/26/2017
|
|
Xin Development
|
Retail Unit A
|
3,440
|
27.5%
|
$60.10
|
$60.00
|
2/12/2014
|
2/28/2016
|
|
Xin Development
|
Storage Unit A
|
1,457
|
11.6%
|
$0
|
$0
|
2/12/2014
|
2/28/2016
|
|
Streets BK LLC
|
Retail Unit C
|
2,582
|
20.6%
|
$60.00
|
$60.00
|
2/1/2014
|
7/15/2024
|
|
Streets BK LLC
|
Storage Unit C
|
996
|
8.0%
|
$0
|
$0
|
2/1/2014
|
7/15/2024
|
|
Total Occupied Space
|
9,707
|
77.6%
|
$41.07
|
$41.03
|
|||
|
Vacant
|
Retail Unit B
|
1,913
|
15.3%
|
NAP
|
$60.00
|
||
|
Vacant
|
Storage Unit B
|
890
|
7.1%
|
NAP
|
$0
|
||
|
Total Vacant Space(3)
|
2,803
|
22.4%
|
|||||
|
Total
|
12,510
|
100.0%
|
|||||
|
(1)
|
Based on leases signed in January and February 2014.
|
|
(2)
|
Market Rent (PSF) represents market rent represented in the appraisal.
|
|
(3)
|
At closing, the borrower deposited $317,400 into a TI/LC reserve to be used for leasing up the vacant retail space. In addition, on a monthly basis, funds will be deposited into the commercial rent and parking income escrow account in an amount equal to $55.00 PSF of vacant commercial space.
|
The 60-car surface parking lot is located at the rear of the 53 Broadway Property. The parking lot has hydraulic lifts accommodating four cars per space and will be leased to a third party owner and staffed with 24-hour parking attendants.
The 53 Broadway Property is structured with two condominium units (a residential condominium unit and a commercial condominium unit). The residential condominium unit consists of the 75 residential apartments and 53 parking spaces in the parking lot while the commercial condominium unit consists of the community facility, the three retail units and the remaining seven parking spaces. The residential component benefits from a 15-year property tax abatement that began in July 2011. The residential-related taxes are fixed for the first 11 years through June 2022, and beginning in July 2022, the tax abatement will burn off at 20.0% per year until June 2026. Due to the real estate tax benefits, rental increases for the residential units will be subject to New York City rent stabilization guidelines until the expiration of the tax benefits in June 2026. The commercial component is in the fourth year of a 25-year industrial and commercial incentive program (“ICIP”), where the tax assessment related to the commercial improvements is fixed through June 2026 and will only increase as a result of an increased land assessment or tax rate change. Beginning in July 2026, the tax abatement will burn off at 10.0% per year until June 2035.
Environmental Matters. The Phase I environmental report dated October 23, 2013 recommended no further action at the 53 Broadway Property.
The Residential Market. The 53 Broadway Property is located within the Brooklyn Community District 1, which encompasses the neighborhoods of Greenpoint, Williamsburg and East Williamsburg. Access to Manhattan is provided via the Williamsburg Bridge, which is located one block north of the 53 Broadway Property. Public transportation is frequent with multiple bus stops located nearby and the J, M, and Z subway lines are accessible three blocks east of the 53 Broadway Property. Brooklyn had a 2012 estimated population of 2.5 million and an average household income of $49,090, with 10.5% of the households earning more than $100,000 per year. The number of apartment building sales fell approximately 2.4% from Q3 2012 to Q3 2013, but the median sales price of apartment buildings increased 11.6% over the same period, to $564,720.
As of November 2013, average rents across Brooklyn have increased 2.5% since November 2012 from $2,553 per unit to $2,617 per unit. The main drivers of this annual change are studios, which have increased an average of 7.6% and 2-bedroom units, which have increased an average of 2.6%. Concessions are minimal in the market, with newly constructed properties typically offering one month of concessions. Tenants at the 53 Broadway Property were given concessions of up to a month of free rent, though future concessions are not expected. The appraiser determined rents at the 53 Broadway Property to be supported by market rates, but due to the real estate tax benefit, the 53 Broadway Property units will be subject to rent stabilization until the expiration of the tax benefits. The appraiser identified six comparable rental properties having a range of 31 to 113 units. All of the comparables are recently constructed rental apartment buildings in the immediate area and are in similar condition to the 53 Broadway Property.
The depositor has filed a registration statement (including the prospectus) with the SEC (SEC File No. 333-193376) for the offering to which this communication relates. Before you invest, you should read the prospectus in the registration statement and other documents the depositor has filed with the SEC for more complete information about the depositor, the issuing trust and this offering. You may get these documents for free by visiting EDGAR on the SEC website at www.sec.gov. Alternatively, the depositor or Deutsche Bank Securities Inc., any other underwriter, or any dealer participating in this offering will arrange to send you the prospectus if you request it by calling toll-free 1-800-503-4611 or by email to the following address: prospectus.cpdg@db.com. The offered certificates referred to in these materials, and the asset pool backing them, are subject to modification or revision (including the possibility that one or more classes of certificates may be split, combined or eliminated at any time prior to issuance or availability of a final prospectus) and are offered on a “when, as and if issued” basis. You understand that, when you are considering the purchase of these certificates, a contract of sale will come into being no sooner than the date on which the relevant class has been priced and we have verified the allocation of certificates to be made to you; any “indications of interest” expressed by you, and any “soft circles” generated by us, will not create binding contractual obligations for you or us.
93
|
53 Broadway
Brooklyn, NY 11249
|
Collateral Asset Summary – Loan No. 9
53 Broadway
|
Cut-off Date Balance:
Cut-off Date LTV:
U/W NCF DSCR:
U/W NOI Debt Yield:
|
$37,000,000
62.4%
1.22x
7.9%
|
The subsequent chart shows a comparison of the competitive set:
|
Competitive Set(1)
|
|||||||||
|
Name
|
53 Broadway
Property
|
146 South
4th Street
|
84-80 South
1st Street
|
185 South 4th
Street
|
205 North 9th
Street
|
225 North
9th Street
|
220 North
10th Street
|
||
|
Distance from Subject
|
NAP
|
0.3 miles
|
0.4 miles
|
0.4 miles
|
0.9 miles
|
1.0 mile
|
1.1 mile
|
||
|
Year Built / Renovated
|
2013
|
2011
|
2012
|
2008
|
2011
|
2012
|
2012
|
||
|
No. of Units
|
75
|
113
|
31
|
46
|
113
|
34
|
64
|
||
|
Unit Size (Sq. Ft.)
|
458 – 1,205
|
391 – 1,281
|
483 – 1,985
|
401 – 1,790
|
409 – 1,192
|
470 – 958
|
526 – 1,169
|
||
|
Rent/Unit
|
$2,400 - $7,300
|
$2,175 - $6,800
|
$3,200 - $6,450
|
$2,000 - $6,744
|
$2,075 - $5,960
|
$2,450 - $4,800
|
$3,200 - $4,750
|
||
|
Avg. Annual Rent PSF
|
$57.96
|
$65.39
|
$56.37
|
$46.73
|
$63.59
|
$61.53
|
$58.74
|
||
|
(1)
|
Source: Appraisal
|
The Retail Market. As of Q3 2013, Brooklyn contains over 71.0 million square feet of retail with a vacancy of 4.2%. The 53 Broadway Property is located in the North Brooklyn retail submarket, which totals approximately 36.2 million square feet of retail space and has a vacancy of 3.4%. The appraiser identified six comparable retail leases ranging in size from 800 to 2,500 sq. ft. and with annual base rents ranging from $38.71 to $79.50 PSF. The appraiser determined market rent at the 53 Broadway Property to be $60.00 PSF.
Cash Flow Analysis.
|
Cash Flow Analysis
|
|||||
|
U/W
|
U/W per Unit(1)
|
||||
|
Gross Potential Rent
|
$2,943,546
|
$39,247
|
|||
|
Commercial Income
|
516,229
|
$6,883
|
|||
|
Other Income(2)
|
125,160
|
$1,669
|
|||
|
Less: Commercial Vacancy(3)
|
(25,811)
|
($344)
|
|||
|
Less: Residential Vacancy(4)
|
(147,177)
|
($1,962)
|
|||
|
Effective Gross Income
|
$3,411,947
|
$45,493
|
|||
|
Total Operating Expenses
|
494,091
|
$6,588
|
|||
|
Net Operating Income
|
$2,917,856
|
$38,905
|
|||
|
Capital Expenditures
|
18,750
|
$250
|
|||
|
Net Cash Flow
|
$2,899,106
|
$38,655
|
|||
|
(1)
|
Based on 75 residential apartments.
|
|
(2)
|
U/W Other Income includes $66,600 from storage unit rental, $48,000 from parking rent and $10,560 from bike storage and miscellaneous fees.
|
|
(3)
|
U/W Commercial Vacancy represents 5.0% of Commercial Income. The commercial component is 77.6% leased. At closing, $317,400 was reserved for costs associated with leasing the vacant commercial space. In addition, on a monthly basis, funds will be deposited into the commercial rent and parking income escrow account in an amount equal to $55.00 PSF of vacant commercial space at the 53 Broadway Property.
|
|
(4)
|
U/W Residential Vacancy represents 5.0% of Gross Potential Rent.
|
Property Management. The 53 Broadway Property is managed by Metro Management Development, Inc., which entered into a sub-management agreement with BBA Manager LLC, an affiliate of the borrower.
Lockbox / Cash Management. The 53 Broadway Loan is structured with a soft lockbox and springing cash management for the residential component and a hard lockbox with springing cash management for the commercial component. All rents are to be transmitted directly by non–residential tenants into the clearing account, and the borrower or manager is required to deposit all residential gross revenues into a clearing account within one business day of receipt. Funds deposited into the clearing account will be swept on a daily basis to the borrower’s operating account unless a Trigger Period (as defined below) is continuing, in which event such funds will be swept into an account controlled by the lender.
A “Trigger Period” will begin upon the occurrence of (i) an event of default or (ii) the debt service coverage ratio falling below 1.10x as of the last day of any calendar quarter and will end upon (a) with respect to clause (i), the date the event of default has been cured and (b) with respect to clause (ii), the date that the debt service coverage ratio is calculated to be 1.15x or greater for two consecutive calendar quarters.
For purposes of calculating the debt service coverage ratio during the first twelve months of the term of the 53 Broadway Loan, the following amounts will be included in calculating cash flow for the 53 Broadway Property: (i) the underwritten net cash flow, (ii) all funds that have been deposited into the commercial/parking rent escrow (as described below) and (iii) $6,430 per month, which represents
The depositor has filed a registration statement (including the prospectus) with the SEC (SEC File No. 333-193376) for the offering to which this communication relates. Before you invest, you should read the prospectus in the registration statement and other documents the depositor has filed with the SEC for more complete information about the depositor, the issuing trust and this offering. You may get these documents for free by visiting EDGAR on the SEC website at www.sec.gov. Alternatively, the depositor or Deutsche Bank Securities Inc., any other underwriter, or any dealer participating in this offering will arrange to send you the prospectus if you request it by calling toll-free 1-800-503-4611 or by email to the following address: prospectus.cpdg@db.com. The offered certificates referred to in these materials, and the asset pool backing them, are subject to modification or revision (including the possibility that one or more classes of certificates may be split, combined or eliminated at any time prior to issuance or availability of a final prospectus) and are offered on a “when, as and if issued” basis. You understand that, when you are considering the purchase of these certificates, a contract of sale will come into being no sooner than the date on which the relevant class has been priced and we have verified the allocation of certificates to be made to you; any “indications of interest” expressed by you, and any “soft circles” generated by us, will not create binding contractual obligations for you or us.
94
|
53 Broadway
Brooklyn, NY 11249
|
Collateral Asset Summary – Loan No. 9
53 Broadway
|
Cut-off Date Balance:
Cut-off Date LTV:
U/W NCF DSCR:
U/W NOI Debt Yield:
|
$37,000,000
62.4%
1.22x
7.9%
|
the monthly amount that was reserved at closing into the other income reserve, for each month that has elapsed from closing of the 53 Broadway Loan through the calculation date.
Initial Reserves. At closing, the borrower deposited (i) $4,972 into a tax reserve account, (ii) $3,552 into an insurance reserve account, (iii) $317,400 into a TI/LC reserve account to be used for leasing up the ground level retail space, (iv) $229,910 into a multifamily pre-paid rent and concessions account, (v) $79,350 into an additional commercial income reserve account and (vi) $154,320 into the other income reserve account, which represents 24 months of projected other income.
Ongoing Reserves. On a monthly basis, the borrower is required to deposit reserves of (i) 1/12 of the estimated annual real estate taxes, which currently equates to $2,486, into a tax reserve account, (ii) 1/12 of the annual insurance premiums, which currently equates to $3,552, into an insurance reserve account, (iii) $1,563 ($250 per unit annually) into a replacement reserve account, (iv) $1,428 into a TI/LC reserve account and (v) 1/12 of the estimated annual budgeted common charges due. In addition, in the event the 1,913 sq. ft. retail unit B is leased at a rent higher than $55.00 PSF, the borrower will be required to deposit into an overage reserve account, an amount equal to the difference in the rental rate of retail unit B and $55.00 PSF, starting with the month after which such lease is signed until month 24 of the 53 Broadway Loan. The overage reserve account will be used to reimburse the previous owner of the 53 Broadway Property for preparing the retail unit B space for rent.
In addition, in connection with the acquisition of the 53 Broadway Property by the borrower, the previous owner of the 53 Broadway Property deposited $968,850 which represents approximately two years of commercial rent and parking income ($96,000 with respect to parking income and $872,850 with respect to commercial rent) into a commercial/parking rent escrow account held by an escrow agent. On a monthly basis, and until the earlier of (i) the date on which the parking lot and the vacant retail space has been leased with the related tenants paying full unabated rent and (ii) two years from the 53 Broadway Loan closing date, the escrow agent is required to disburse $4,000 (with respect to parking revenue) plus an amount equal to $55.00 PSF of the vacant commercial square feet to a lender controlled escrow account. At such time that the parking component and remaining vacant commercial space have been leased pursuant to acceptable third-party leases, with the related tenant paying full unabated rent, the escrow agent is required to release any amount attributed to such space to the previous owner of the 53 Broadway Property. Any such amount that has already been deposited into the lender controlled escrow account with regard to the parking component will be released to the borrower upon the parking component being leased to a third party at an annual rent of at least $48,000, with all tenant improvements and leasing commissions paid in full and the tenant thereunder paying full unabated rent. Any such amount that has already been deposited into the lender controlled escrow account with regard to the commercial space will be released to the borrower upon the entire commercial space being tenanted pursuant to one or more leases requiring annual rental payments of at least $55.00 PSF with all tenant improvements and leasing commissions paid in full and the related tenants are in occupancy and paying full unabated rent. Any such amount that has not been deposited into the lender’s escrow account and is still on deposit with the title company at the expiration of the two year period after closing will be released to the previous owner of the 53 Broadway Property.
Current Mezzanine or Subordinate Indebtedness. None.
Future Mezzanine or Subordinate Indebtedness Permitted. None.
Partial Release. On any date after the lockout period ends, the borrower may obtain the release of the commercial condominium unit, provided, among other things, (i) there is no event of default, (ii) the DSCR for the remaining property is no less than the greater of the DSCR immediately preceding such sale and 1.20x, (iii) the LTV ratio for the remaining property is no more than the lesser of the LTV ratio immediately preceding such sale and 62.4% and (iv) the borrower delivers defeasance collateral in an amount sufficient to defease the greater of (a) 100% of the net sales proceeds with respect to the commercial unit and (b) 125% of the allocated loan amount for the commercial unit.
The depositor has filed a registration statement (including the prospectus) with the SEC (SEC File No. 333-193376) for the offering to which this communication relates. Before you invest, you should read the prospectus in the registration statement and other documents the depositor has filed with the SEC for more complete information about the depositor, the issuing trust and this offering. You may get these documents for free by visiting EDGAR on the SEC website at www.sec.gov. Alternatively, the depositor or Deutsche Bank Securities Inc., any other underwriter, or any dealer participating in this offering will arrange to send you the prospectus if you request it by calling toll-free 1-800-503-4611 or by email to the following address: prospectus.cpdg@db.com. The offered certificates referred to in these materials, and the asset pool backing them, are subject to modification or revision (including the possibility that one or more classes of certificates may be split, combined or eliminated at any time prior to issuance or availability of a final prospectus) and are offered on a “when, as and if issued” basis. You understand that, when you are considering the purchase of these certificates, a contract of sale will come into being no sooner than the date on which the relevant class has been priced and we have verified the allocation of certificates to be made to you; any “indications of interest” expressed by you, and any “soft circles” generated by us, will not create binding contractual obligations for you or us.
95
|
53 Broadway
Brooklyn, NY 11249
|
Collateral Asset Summary – Loan No. 9
53 Broadway
|
Cut-off Date Balance:
Cut-off Date LTV:
U/W NCF DSCR:
U/W NOI Debt Yield:
|
$37,000,000
62.4%
1.22x
7.9%
|

The depositor has filed a registration statement (including the prospectus) with the SEC (SEC File No. 333-193376) for the offering to which this communication relates. Before you invest, you should read the prospectus in the registration statement and other documents the depositor has filed with the SEC for more complete information about the depositor, the issuing trust and this offering. You may get these documents for free by visiting EDGAR on the SEC website at www.sec.gov. Alternatively, the depositor or Deutsche Bank Securities Inc., any other underwriter, or any dealer participating in this offering will arrange to send you the prospectus if you request it by calling toll-free 1-800-503-4611 or by email to the following address: prospectus.cpdg@db.com. The offered certificates referred to in these materials, and the asset pool backing them, are subject to modification or revision (including the possibility that one or more classes of certificates may be split, combined or eliminated at any time prior to issuance or availability of a final prospectus) and are offered on a “when, as and if issued” basis. You understand that, when you are considering the purchase of these certificates, a contract of sale will come into being no sooner than the date on which the relevant class has been priced and we have verified the allocation of certificates to be made to you; any “indications of interest” expressed by you, and any “soft circles” generated by us, will not create binding contractual obligations for you or us.
96
(THIS PAGE INTENTIONALLY LEFT BLANK)
97
|
105 Town Center Road
King of Prussia, PA 19406
|
Collateral Asset Summary – Loan No. 10
Valley Forge Shopping Center
|
Cut-off Date Balance:
Cut-off Date LTV:
U/W NCF DSCR:
U/W NOI Debt Yield:
|
$35,000,000
71.9%
1.33x
8.6%
|
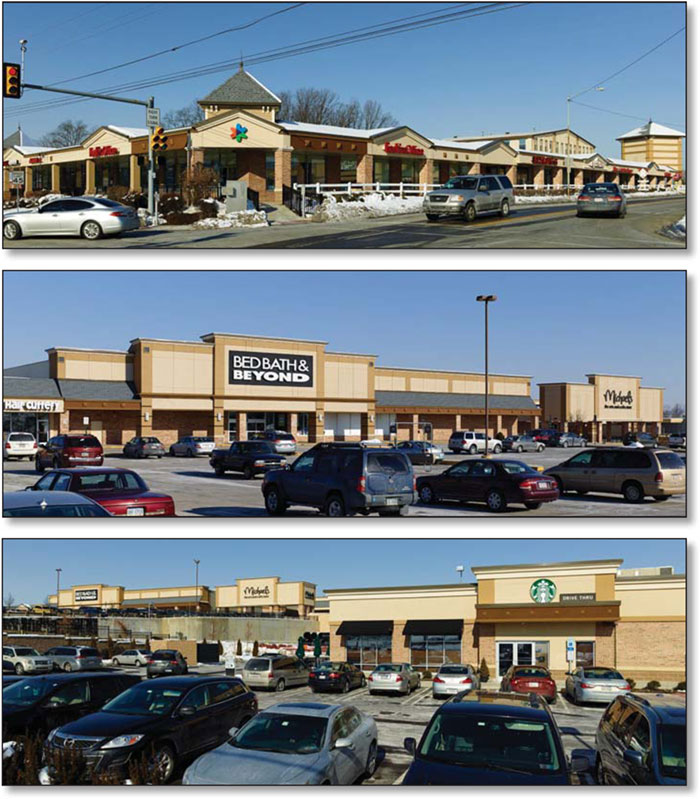
The depositor has filed a registration statement (including the prospectus) with the SEC (SEC File No. 333-193376) for the offering to which this communication relates. Before you invest, you should read the prospectus in the registration statement and other documents the depositor has filed with the SEC for more complete information about the depositor, the issuing trust and this offering. You may get these documents for free by visiting EDGAR on the SEC website at www.sec.gov. Alternatively, the depositor or Deutsche Bank Securities Inc., any other underwriter, or any dealer participating in this offering will arrange to send you the prospectus if you request it by calling toll-free 1-800-503-4611 or by email to the following address: prospectus.cpdg@db.com. The offered certificates referred to in these materials, and the asset pool backing them, are subject to modification or revision (including the possibility that one or more classes of certificates may be split, combined or eliminated at any time prior to issuance or availability of a final prospectus) and are offered on a “when, as and if issued” basis. You understand that, when you are considering the purchase of these certificates, a contract of sale will come into being no sooner than the date on which the relevant class has been priced and we have verified the allocation of certificates to be made to you; any “indications of interest” expressed by you, and any “soft circles” generated by us, will not create binding contractual obligations for you or us.
98
|
105 Town Center Road
King of Prussia, PA 19406
|
Collateral Asset Summary – Loan No. 10
Valley Forge Shopping Center
|
Cut-off Date Balance:
Cut-off Date LTV:
U/W NCF DSCR:
U/W NOI Debt Yield:
|
$35,000,000
71.9%
1.33x
8.6%
|
|
Mortgage Loan Information
|
Property Information
|
|||||
|
Loan Seller:
|
GACC
|
Single Asset / Portfolio:
|
Single Asset
|
|||
|
Loan Purpose:
|
Refinance
|
Property Type:
|
Anchored Retail
|
|||
|
Sponsor:
|
Andrew N. Heine
|
Collateral:
|
Fee Simple
|
|||
|
Borrower:
|
VF Center Associates, L.P.
|
Location:
|
King of Prussia, PA
|
|||
|
Original Balance:
|
$35,000,000
|
Year Built / Renovated:
|
1956 / 2012-2014
|
|||
|
Cut-off Date Balance:
|
$35,000,000
|
Total Sq. Ft.(3):
|
340,352
|
|||
|
% by Initial UPB:
|
2.8%
|
Property Management:
|
Great Hill Property Management LLC
|
|||
|
Interest Rate:
|
4.7600%
|
Underwritten NOI:
|
$3,024,743
|
|||
|
Payment Date:
|
6th of each month
|
Underwritten NCF:
|
$2,927,056
|
|||
|
First Payment Date:
|
March 6, 2014
|
“As-is” Appraised Value:
|
$48,700,000
|
|||
|
Maturity Date:
|
February 6, 2024
|
“As-is” Appraisal Date:
|
January 2, 2014
|
|||
|
Amortization:
|
Interest only for the first 12 months,
|
“As Complete” Appraised Value(4):
|
$50,800,000
|
|||
|
360 months thereafter
|
“As Complete” Appraisal Date(4):
|
August 1, 2014
|
||||
|
Additional Debt:
|
None
|
|||||
|
Call Protection:
|
L(25), D(91), O(4)
|
Historical NOI(5)
|
||||
|
Lockbox / Cash Management:
|
Hard / In Place
|
Most Recent NOI:
|
NAP
|
|||
|
2012 NOI:
|
NAP
|
|||||
|
Reserves(1)
|
2011 NOI:
|
NAP
|
||||
|
Initial
|
Monthly
|
2010 NOI:
|
NAP
|
|||
|
Taxes:
|
$242,399
|
$43,331
|
||||
|
Insurance:
|
$0
|
Springing
|
Historical Occupancy(5)
|
|||
|
Replacement:
|
$0
|
$2,630
|
Current Occupancy:
|
91.5% (December 31, 2013)
|
||
|
TI/LC:
|
$721,999
|
$6,100
|
2012 Occupancy:
|
NAP
|
||
|
Renovation Reserve:
|
$945,000
|
$0
|
2011 Occupancy:
|
NAP
|
||
|
Sleepy’s Holdback:
|
$890,750
|
$0
|
2010 Occupancy:
|
NAP
|
||
|
Rent Concession:
|
$322,538
|
$0
|
(1) See “Initial Reserves” and “Ongoing Reserves” herein.
(2) Based on amortizing debt service payments. Based on the current interest only payments, the Underwritten NOI DSCR and Underwritten NCF DSCR are 1.79x and 1.73x, respectively.
(3) Total Sq. Ft. includes Target and McDonald’s, totaling 168,957 sq. ft., which own their own improvements and operate under ground leases.
(4) The appraiser determined an “As Complete” Appraised Value of $50.8 million based on the completion of all improvements. Based on the Cut-off Date Balance of $35.0 million, the “As Complete” LTV ratio is 68.9%.
(5) The Valley Forge Shopping Center Property underwent a major renovation in 2012, when the sponsor vacated and demolished a portion of the center in order to add Target and an additional approximately 11,200 sq. ft. of retail space. The full redevelopment of the Valley Forge Shopping Center Property is estimated to be complete in 2014.
|
|||
|
Financial Information
|
||||||
|
Cut-off Date Balance / Sq. Ft.:
|
$103
|
|||||
|
Balloon Balance / Sq. Ft.:
|
$86
|
|||||
|
Cut-off Date LTV:
|
71.9%
|
|||||
|
Balloon LTV:
|
60.2%
|
|||||
|
Underwritten NOI DSCR(2):
|
1.38x
|
|||||
|
Underwritten NCF DSCR(2):
|
1.33x
|
|||||
|
Underwritten NOI Debt Yield:
|
8.6%
|
|||||
|
Underwritten NCF Debt Yield:
|
8.4%
|
|||||
|
Underwritten NOI Debt Yield at Balloon:
|
10.3%
|
|||||
|
Underwritten NCF Debt Yield at Balloon:
|
10.0%
|
|||||
The depositor has filed a registration statement (including the prospectus) with the SEC (SEC File No. 333-193376) for the offering to which this communication relates. Before you invest, you should read the prospectus in the registration statement and other documents the depositor has filed with the SEC for more complete information about the depositor, the issuing trust and this offering. You may get these documents for free by visiting EDGAR on the SEC website at www.sec.gov. Alternatively, the depositor or Deutsche Bank Securities Inc., any other underwriter, or any dealer participating in this offering will arrange to send you the prospectus if you request it by calling toll-free 1-800-503-4611 or by email to the following address: prospectus.cpdg@db.com. The offered certificates referred to in these materials, and the asset pool backing them, are subject to modification or revision (including the possibility that one or more classes of certificates may be split, combined or eliminated at any time prior to issuance or availability of a final prospectus) and are offered on a “when, as and if issued” basis. You understand that, when you are considering the purchase of these certificates, a contract of sale will come into being no sooner than the date on which the relevant class has been priced and we have verified the allocation of certificates to be made to you; any “indications of interest” expressed by you, and any “soft circles” generated by us, will not create binding contractual obligations for you or us.
99
|
105 Town Center Road
King of Prussia, PA 19406
|
Collateral Asset Summary – Loan No. 10
Valley Forge Shopping Center
|
Cut-off Date Balance:
Cut-off Date LTV:
U/W NCF DSCR:
U/W NOI Debt Yield:
|
$35,000,000
71.9%
1.33x
8.6%
|
|
Tenant Summary
|
||||||||||
|
Tenant
|
Ratings
(Fitch/Moody’s/S&P)(1)
|
Net Rentable
Area (Sq. Ft.)
|
% of Net
Rentable Area
|
U/W Base
Rent PSF
|
% of Total
U/W Base Rent
|
Lease
Expiration
|
||||
|
Target(2)
|
A-/A2/A+
|
165,000
|
48.5%
|
$4.24
|
22.3%
|
1/1/2040
|
||||
|
Bed Bath and Beyond(3)
|
NR/NR/BBB+
|
42,101
|
12.4%
|
$10.25
|
13.7%
|
1/31/2020
|
||||
|
Michaels(4)
|
NR/B3/B
|
22,242
|
6.5%
|
$15.00
|
10.6%
|
2/28/2018
|
||||
|
Michael’s Deli
|
NR/NR/NR
|
11,536
|
3.4%
|
$10.00
|
3.7%
|
4/30/2017
|
||||
|
Peppers
|
NR/NR/NR
|
6,592
|
1.9%
|
$14.06
|
2.9%
|
6/30/2016
|
||||
|
Total Major Tenants
|
247,471
|
72.7%
|
$6.76
|
53.2%
|
||||||
|
Outparcel
|
15,807
|
4.6%
|
$28.28
|
14.2%
|
||||||
|
Remaining Retail Tenants
|
41,778
|
12.3%
|
$23.33
|
31.0%
|
||||||
|
Total Retail Collateral
|
305,056
|
89.6%
|
$10.15
|
98.4%
|
||||||
|
Office Tenants(5)
|
4,790
|
1.4%
|
$7.82
|
1.2%
|
||||||
|
Storage
|
1,550
|
0.5%
|
$7.74
|
0.4%
|
||||||
|
Total Occupied
|
311,396
|
91.5%
|
$10.10
|
100.0%
|
||||||
|
Vacant
|
28,956
|
8.5%
|
||||||||
|
Total
|
340,352
|
100.0%
|
||||||||
|
(1)
|
Certain ratings may be those of the parent company whether or not the parent company guarantees the lease.
|
|
(2)
|
Target, which owns its own improvements and operates under a ground lease, is currently under construction with build out estimated to be completed in April 2014. Target is estimated to open in summer 2014 with rent commencing in April 2014. At closing, $58,333 was reserved representing the March rent payment for Target. Target has five 10-year extension options, each with 12 months prior notice, and no termination options.
|
|
(3)
|
Bed Bath and Beyond has two five-year extension options, and no termination options.
|
|
(4)
|
Michaels has a rent abatement through June 2014. At closing, $51,058 was reserved, representing rent payments through June 2014. Michaels has three five-year extension options remaining, each with 180 days prior notice. Michaels does not have any termination options.
|
|
(5)
|
Includes a 1,716 sq. ft. management office.
|
|
Lease Rollover Schedule(1)
|
||||||||||||||||
|
Year
|
# of Leases
Expiring
|
Total Expiring
Sq. Ft.
|
% of Total Sq.
Ft. Expiring
|
Cumulative
Sq. Ft.
Expiring
|
Cumulative
% of Sq. Ft.
Expiring |
Annual U/W
Base Rent Per Sq. Ft.
|
% U/W
Base Rent Rolling
|
Cumulative %
of U/W
Base Rent
|
||||||||
|
MTM
|
0
|
0
|
0.0%
|
0
|
0.0%
|
$0.00
|
0.0%
|
0.0%
|
||||||||
|
2014
|
16
|
22,369
|
6.6%
|
22,369
|
6.6%
|
$19.36
|
13.8%
|
13.8%
|
||||||||
|
2015
|
2
|
6,870
|
2.0%
|
29,239
|
8.6%
|
$33.27
|
7.3%
|
21.0%
|
||||||||
|
2016
|
2
|
9,092
|
2.7%
|
38,331
|
11.3%
|
$17.11
|
4.9%
|
26.0%
|
||||||||
|
2017
|
1
|
11,536
|
3.4%
|
49,867
|
14.7%
|
$10.00
|
3.7%
|
29.7%
|
||||||||
|
2018
|
6
|
31,768
|
9.3%
|
81,635
|
24.0%
|
$16.10
|
16.3%
|
45.9%
|
||||||||
|
2019
|
2
|
5,988
|
1.8%
|
87,623
|
25.7%
|
$29.39
|
5.6%
|
51.5%
|
||||||||
|
2020
|
1
|
42,101
|
12.4%
|
129,724
|
38.1%
|
$10.25
|
13.7%
|
65.3%
|
||||||||
|
2021
|
0
|
0
|
0.0%
|
129,724
|
38.1%
|
$0.00
|
0.0%
|
65.3%
|
||||||||
|
2022
|
1
|
3,957
|
1.2%
|
133,681
|
39.3%
|
$19.88
|
2.5%
|
67.8%
|
||||||||
|
2023
|
1
|
4,599
|
1.4%
|
138,280
|
40.6%
|
$30.00
|
4.4%
|
72.1%
|
||||||||
|
2024
|
1
|
6,400
|
1.9%
|
144,680
|
42.5%
|
$27.50
|
5.6%
|
77.7%
|
||||||||
|
Thereafter
|
2
|
166,716
|
49.0%
|
311,396
|
91.5%
|
$4.20
|
22.3%
|
100.0%
|
||||||||
|
Vacant
|
NAP
|
28,956
|
8.5%
|
340,352
|
100.0%
|
NAP
|
NAP
|
|||||||||
|
Total / Wtd. Avg.
|
35
|
340,352
|
100.0%
|
$10.10
|
100.0%
|
|||||||||||
|
(1)
|
Certain tenants have lease termination options that may become exercisable prior to the originally stated expiration date of the tenant lease and that are not considered in the lease rollover schedule or the site plan.
|
The depositor has filed a registration statement (including the prospectus) with the SEC (SEC File No. 333-193376) for the offering to which this communication relates. Before you invest, you should read the prospectus in the registration statement and other documents the depositor has filed with the SEC for more complete information about the depositor, the issuing trust and this offering. You may get these documents for free by visiting EDGAR on the SEC website at www.sec.gov. Alternatively, the depositor or Deutsche Bank Securities Inc., any other underwriter, or any dealer participating in this offering will arrange to send you the prospectus if you request it by calling toll-free 1-800-503-4611 or by email to the following address: prospectus.cpdg@db.com. The offered certificates referred to in these materials, and the asset pool backing them, are subject to modification or revision (including the possibility that one or more classes of certificates may be split, combined or eliminated at any time prior to issuance or availability of a final prospectus) and are offered on a “when, as and if issued” basis. You understand that, when you are considering the purchase of these certificates, a contract of sale will come into being no sooner than the date on which the relevant class has been priced and we have verified the allocation of certificates to be made to you; any “indications of interest” expressed by you, and any “soft circles” generated by us, will not create binding contractual obligations for you or us.
100
|
105 Town Center Road
King of Prussia, PA 19406
|
Collateral Asset Summary – Loan No. 10
Valley Forge Shopping Center
|
Cut-off Date Balance:
Cut-off Date LTV:
U/W NCF DSCR:
U/W NOI Debt Yield:
|
$35,000,000
71.9%
1.33x
8.6%
|
The Loan. The Valley Forge Shopping Center loan (the “Valley Forge Shopping Center Loan”) is a fixed rate loan secured by the borrower’s fee simple interest in a 340,352 sq. ft. anchored retail shopping center located at 105 Town Center Road in King of Prussia, Pennsylvania (the “Valley Forge Shopping Center Property”) and has an original principal balance of $35.0 million. The Valley Forge Shopping Center Loan has a 10-year term and amortizes on a 360-month schedule, after an initial one-year interest only period. The Valley Forge Shopping Center Loan accrues interest at a fixed rate equal to 4.7600% per annum and has a cut-off date balance of $35.0 million. Loan proceeds were used to retire existing debt of approximately $22.8 million, fund reserves of approximately $3.1 million and closing costs of approximately $0.4 million, giving the sponsor a return of equity of approximately $8.6 million. Based on the “As-is” appraised value of $48.7 million as of January 2, 2014, the “As-is” cut-off date LTV ratio is 71.9%. Based on the “As Complete” appraised value of $50.8 million, the “As Complete” cut-off date LTV ratio is 68.9%. The most recent prior financing of the Valley Forge Shopping Center Property was not included in a securitization.
|
Sources and Uses
|
||||||
|
Sources
|
Proceeds
|
% of Total
|
Uses
|
Proceeds
|
% of Total
|
|
|
Loan Amount
|
$35,000,000
|
100.0%
|
Loan Payoff
|
$22,813,897
|
65.2%
|
|
|
Reserves
|
$3,122,686
|
8.9%
|
||||
|
Closing Costs
|
$425,954
|
1.2%
|
||||
|
Return of Equity
|
$8,637,463
|
24.7%
|
||||
|
Total Sources
|
$35,000,000
|
100.0%
|
Total Uses
|
$35,000,000
|
100.0%
|
|
The Borrower / Sponsor. The borrower, VF Center Associates, L.P., is a single purpose Delaware limited partnership structured to be bankruptcy-remote, with two independent directors in its organizational structure. The sponsor of the borrower and nonrecourse carve-out guarantor is Andrew N. Heine, the Chairman and CEO of Camden Securities Company.
From 1953 to 1988 Andrew N. Heine practiced law, specializing in mergers and acquisitions. In 1990 Heine joined the family business, Camden Securities Company (“Camden”), acquiring and managing commercial properties throughout the United States. Camden is a third generation family-run business focused on principal investing in the commercial real estate sector and throughout the capital markets. It was founded in the 1940’s by Aaron Heine, and today is managed by Andrew N. Heine. Camden’s managers, and its affiliates, have owned, operated and managed residential, retail and industrial properties, having invested in over 5.0 million square feet of commercial property.
The Property. The Valley Forge Shopping Center Property consists of a 340,352 sq. ft. anchored shopping center located in King of Prussia, Pennsylvania. The Valley Forge Shopping Center Property was constructed in 1956 and acquired by the sponsor in 1971. In 2012, the sponsor began a $15.4 million redevelopment by demolishing and vacating a portion of the Valley Forge Shopping Center Property in order to add a Target building as well as approximately 11,200 sq. ft. of retail space. The Target building is estimated to be completed in April 2014 and the full redevelopment of the Valley Forge Shopping Center Property is estimated to be complete in the summer of 2014. The Valley Forge Shopping Center Property is anchored by Bed Bath and Beyond, which has been a tenant since 1994 and Michaels, which has been a tenant since 1998. As of December 31, 2013, the Valley Forge Shopping Center Property is 91.5% leased.
Major Tenants.
Target (165,000 sq. ft., 48.5% of NRA, 22.3% of U/W Base Rent). Target (NYSE: TGT), rated A-/A2/A+ by Fitch/Moody’s/S&P, was founded in 1902 and is headquartered in Minneapolis, Minnesota. Target is the second-largest discount U.S. retailer and is ranked 36 on the 2013 Fortune 500. Target operates approximately 1,921 general merchandise stores in the United States and Canada offering household essentials, electronics, food and pet supplies and home furnishings. For the year ended February 2, 2013, Target reported revenue of $73.3 billion and net earnings of $3 billion.
Target executed a 25-year, NNN ground lease in 2011 with five 10-year extension options, prompting a redevelopment of the Valley Forge Shopping Center Property. The Target building is estimated to be completed in April 2014, with the store estimated to open in summer of 2014. Rent for the space will commence in April 2014. The borrower reserved $58,333 at closing for the March rent payment.
Bed Bath and Beyond (42,101 sq. ft., 12.4% of NRA, 13.7% of U/W Base Rent). Bed Bath and Beyond (NASDAQ: BBBY), rated BBB+ by S&P, and subsidiaries operate a chain of retail stores under the names Bed Bath & Beyond in the United States and Canada, as well as, World Market, Cost Plus World Market, Christmas Tree Shops, andThat!, Harmon, Harmon Face Values and buybuy BABY in the United States. Bed Bath and Beyond was founded in 1971 and has more than 1,400 stores, ranging in size from 15,000 to 50,000 sq. ft., with some stores exceeding 80,000 sq. ft. For the fiscal third quarter ended November 30, 2013, Bed Bath and Beyond reported sales of $2.9 billion, and net earnings of $237.2 million.
The depositor has filed a registration statement (including the prospectus) with the SEC (SEC File No. 333-193376) for the offering to which this communication relates. Before you invest, you should read the prospectus in the registration statement and other documents the depositor has filed with the SEC for more complete information about the depositor, the issuing trust and this offering. You may get these documents for free by visiting EDGAR on the SEC website at www.sec.gov. Alternatively, the depositor or Deutsche Bank Securities Inc., any other underwriter, or any dealer participating in this offering will arrange to send you the prospectus if you request it by calling toll-free 1-800-503-4611 or by email to the following address: prospectus.cpdg@db.com. The offered certificates referred to in these materials, and the asset pool backing them, are subject to modification or revision (including the possibility that one or more classes of certificates may be split, combined or eliminated at any time prior to issuance or availability of a final prospectus) and are offered on a “when, as and if issued” basis. You understand that, when you are considering the purchase of these certificates, a contract of sale will come into being no sooner than the date on which the relevant class has been priced and we have verified the allocation of certificates to be made to you; any “indications of interest” expressed by you, and any “soft circles” generated by us, will not create binding contractual obligations for you or us.
101
|
105 Town Center Road
King of Prussia, PA 19406
|
Collateral Asset Summary – Loan No. 10
Valley Forge Shopping Center
|
Cut-off Date Balance:
Cut-off Date LTV:
U/W NCF DSCR:
U/W NOI Debt Yield:
|
$35,000,000
71.9%
1.33x
8.6%
|
Bed Bath and Beyond has been at the Valley Forge Shopping Center Property since 1994, and is not required to report sales. Bed Bath and Beyond has two five-year renewal options and does not have any termination options.
Michaels (22,242 sq. ft., 6.5% of NRA, 10.6% of U/W Base Rent). Michaels (NYSE: MIK), rated B3/B by Moody’s/S&P, together with its subsidiaries, is the largest arts and crafts specialty retailer in North America. As of May 2013, Michaels had more than 1,105 stores throughout 49 states in the United States and Canada. Michaels reported sales of approximately $4.4 billion in 2012.
Michaels has been at the Valley Forge Shopping Center Property since 1998 and has three 5-year extension options remaining. The tenant is not required to report sales and does not have any termination options.
Environmental Matters. The Phase I environmental report dated January 8, 2014 recommended no further action at the Valley Forge Shopping Center Property except for the implementation of an asbestos operation and maintenance plan. The sponsor obtained an environmental insurance policy related to the presence of a dry cleaner tenant at the Valley Forge Shopping Center Property. See “Risk Factors―Risks Related to the Mortgage Loans―Potential Issuing Entity Liability Related to a Materially Adverse Environmental Condition” in the Free Writing Prospectus.
The Market. The Valley Forge Shopping Center Property is located in the King of Prussia area of Montgomery County, Pennsylvania. The King of Prussia Mall is located approximately 1.0 mile west of the Valley Forge Shopping Center Property and is the largest super regional mall in the Philadelphia Metropolitan Area. The King of Prussia Mall consists of seven anchor department stores, including Macy’s, Bloomingdales, Neiman Marcus, Nordstrom, Sears, JCPenney and Lord & Taylor, and over 365 specialty stores, encompassing nearly 3.0 million square feet. The mall draws from a trade area that spans most of the Philadelphia MSA and has an estimated 15.0 million shoppers per year.
Public transportation in the area includes various bus routes provided by the Southeastern Pennsylvania Transportation Authority (“SEPTA”), as well as regional rail (train) service, providing access to Center City Philadelphia. In addition, the area has access to numerous roadways including the Pennsylvania Turnpike (Interstate 276), I-76 (Schuylkill Expressway) and Interstate 95, which provide access to New Jersey, Philadelphia, Western Pennsylvania and Pittsburgh. The 2013 population within the Valley Forge Shopping Center Property’s five-mile trade area radius is 194,225 with a median household income of $71,340.
The Philadelphia retail market has been stable over the last eight years. The overall 2014 retail market, consisting of an inventory of approximately 283.6 million square feet, has a vacancy rate of 6.4%, down from 6.7% in 2006. The Valley Forge Shopping Center Property is located within the Montgomery County submarket, which has a 2014 inventory of 50.1 million square feet and a vacancy rate of 6.3%, which has averaged 6.4% over the past five years and 6.3% over the past eight years. The average 2014 rental rate in the Montgomery County submarket is $17.38 PSF, up from $16.94 PSF in 2013.
Within the Valley Forge Shopping Center Property’s five mile trade area radius, there are 1,407 retail buildings with approximately 18.6 million sq. ft. Asking rental rates are higher than the Montgomery County submarket at $18.36 PSF, while the vacancy rate is 4.0%. Vacancy within the area has averaged 4.3% for the past five years and 4.2% for the past eight years.
The appraiser identified five comparable retail centers within a seven-mile radius of the Valley Forge Shopping Center Property. The comparable properties range in size from 102,002 sq. ft. to 223,258 sq. ft. and have a weighted average occupancy of 97.0%. The chart below shows a comparison of the competitive set:
|
Competitive Set(1)
|
|||||||||||||
|
Name
|
Valley Forge Shopping
Center Property |
King of Prussia
Center |
Henderson
Square |
Dekalb Plaza
|
Courtside Square
|
Gateway Shopping
Center |
|||||||
|
Distance from Subject
|
NAP
|
0.6 miles
|
2.7 miles
|
7.0 miles
|
1.3 miles
|
2.0 miles
|
|||||||
|
Property Type
|
Anchored Retail
|
Strip Center
|
Anchored Retail
|
Anchored Retail
|
Mixed Use
|
Shopping Center
|
|||||||
|
Year Built / Renovated
|
1956 / 2012-2014
|
1995/2003/2010
|
2000
|
1993
|
1961
|
1970 / 1999
|
|||||||
|
Total Occupancy(2)
|
91.5%
|
100.0%
|
98.2%
|
95.1%
|
90.5%
|
99.4%
|
|||||||
|
Size (Sq. Ft.)(2)
|
340,352
|
106,774
|
107,431
|
102,002
|
119,108
|
223,258
|
|||||||
|
Anchors / Major Tenants
|
Target, Bed Bath and Beyond, Michaels
|
Petco Grocery Store
|
GIANT Grocery
|
ACME Grocery
|
None
|
Five Below, TJ Maxx,
Staples
|
|||||||
|
(1)
|
Source: Appraisal
|
|
(2)
|
Total Occupancy and Size (Sq. Ft.) for the Valley Forge Shopping Center Property is as of the December 31, 2013 rent roll.
|
The depositor has filed a registration statement (including the prospectus) with the SEC (SEC File No. 333-193376) for the offering to which this communication relates. Before you invest, you should read the prospectus in the registration statement and other documents the depositor has filed with the SEC for more complete information about the depositor, the issuing trust and this offering. You may get these documents for free by visiting EDGAR on the SEC website at www.sec.gov. Alternatively, the depositor or Deutsche Bank Securities Inc., any other underwriter, or any dealer participating in this offering will arrange to send you the prospectus if you request it by calling toll-free 1-800-503-4611 or by email to the following address: prospectus.cpdg@db.com. The offered certificates referred to in these materials, and the asset pool backing them, are subject to modification or revision (including the possibility that one or more classes of certificates may be split, combined or eliminated at any time prior to issuance or availability of a final prospectus) and are offered on a “when, as and if issued” basis. You understand that, when you are considering the purchase of these certificates, a contract of sale will come into being no sooner than the date on which the relevant class has been priced and we have verified the allocation of certificates to be made to you; any “indications of interest” expressed by you, and any “soft circles” generated by us, will not create binding contractual obligations for you or us.
102
|
105 Town Center Road
King of Prussia, PA 19406
|
Collateral Asset Summary – Loan No. 10
Valley Forge Shopping Center
|
Cut-off Date Balance:
Cut-off Date LTV:
U/W NCF DSCR:
U/W NOI Debt Yield:
|
$35,000,000
71.9%
1.33x
8.6%
|
Cash Flow Analysis.
|
Cash Flow Analysis
|
|||||
|
U/W
|
U/W PSF
|
||||
|
Base Rent(1)
|
$2,490,925
|
$7.32
|
|||
|
Target Rent
|
700,000
|
2.06
|
|||
|
Value of Vacant Space
|
352,371
|
1.04
|
|||
|
Gross Potential Rent
|
$3,543,297
|
$10.41
|
|||
|
Total Recoveries
|
1,666,812
|
4.90
|
|||
|
Less: Vacancy(2)
|
(352,371)
|
(1.04)
|
|||
|
Effective Gross Income
|
$4,857,738
|
$14.27
|
|||
|
Total Operating Expenses
|
1,832,995
|
5.39
|
|||
|
Net Operating Income
|
$3,024,743
|
$8.89
|
|||
|
TI/LC
|
71,384
|
0.21
|
|||
|
Capital Expenditures
|
26,303
|
0.08
|
|||
|
Net Cash Flow
|
$2,927,056
|
$8.60
|
|||
|
(1)
|
U/W Base Rent includes $46,628 of step rent and is based on rent steps through February 2015.
|
|
(2)
|
U/W Vacancy represents 6.8% of gross income, compared to the submarket vacancy rate of 6.3% and the trade area vacancy rate of 4.0%.
|
Property Management. The Valley Forge Shopping Center Property is managed by Great Hill Property Management LLC.
Lockbox / Cash Management. The Valley Forge Shopping Center Loan is structured with a hard lockbox and in place cash management. All rents and other payments are required to be deposited directly into a clearing account controlled by the lender. All funds in the lockbox account are swept daily to a cash management account under the control of the lender and disbursed in accordance with the Valley Forge Shopping Center Loan.
Additionally, all excess cash will be swept into a lender controlled account (i) upon an event of default or (ii) if the DSCR falls below 1.05x as of the last day of any calendar quarter, until such time that, (x) with respect to clause (i) the event of default is cured and (b) with respect to clause (ii), the DSCR is at least 1.10x for two consecutive calendar quarters.
Initial Reserves. At closing, the borrower deposited (i) $242,399 into a tax reserve account, (ii) $721,999 into a TI/LC reserve account for approved outstanding TIs and LCs, (iii) $945,000 into a renovation reserve account, (iv) $890,750 into a Sleepy’s Holdback reserve account which will be held until Sleepy’s is open for business and paying full unabated rent and (v) $322,538 into a rent concession reserve account.
Ongoing Reserves. On a monthly basis, the borrower is required to deposit reserves of (i) 1/12 of the estimated annual real estate taxes, which currently equates to $43,331 per month, into the tax reserve account, (ii) $2,630 into the replacement reserve account, subject to a reserve cap of $75,000 and (iii) $6,100 into the TI/LC reserve account, subject to a reserve cap of $250,000. In addition, the borrower is required to deposit 1/12 of the estimated annual insurance premiums into the insurance reserve if an acceptable blanket insurance policy is no longer in place.
Current Mezzanine or Subordinate Indebtedness. None.
Future Mezzanine or Subordinate Indebtedness Permitted. None.
The depositor has filed a registration statement (including the prospectus) with the SEC (SEC File No. 333-193376) for the offering to which this communication relates. Before you invest, you should read the prospectus in the registration statement and other documents the depositor has filed with the SEC for more complete information about the depositor, the issuing trust and this offering. You may get these documents for free by visiting EDGAR on the SEC website at www.sec.gov. Alternatively, the depositor or Deutsche Bank Securities Inc., any other underwriter, or any dealer participating in this offering will arrange to send you the prospectus if you request it by calling toll-free 1-800-503-4611 or by email to the following address: prospectus.cpdg@db.com. The offered certificates referred to in these materials, and the asset pool backing them, are subject to modification or revision (including the possibility that one or more classes of certificates may be split, combined or eliminated at any time prior to issuance or availability of a final prospectus) and are offered on a “when, as and if issued” basis. You understand that, when you are considering the purchase of these certificates, a contract of sale will come into being no sooner than the date on which the relevant class has been priced and we have verified the allocation of certificates to be made to you; any “indications of interest” expressed by you, and any “soft circles” generated by us, will not create binding contractual obligations for you or us.
103
|
105 Town Center Road
King of Prussia, PA 19406
|
Collateral Asset Summary – Loan No. 10
Valley Forge Shopping Center
|
Cut-off Date Balance:
Cut-off Date LTV:
U/W NCF DSCR:
U/W NOI Debt Yield:
|
$35,000,000
71.9%
1.33x
8.6%
|

The depositor has filed a registration statement (including the prospectus) with the SEC (SEC File No. 333-193376) for the offering to which this communication relates. Before you invest, you should read the prospectus in the registration statement and other documents the depositor has filed with the SEC for more complete information about the depositor, the issuing trust and this offering. You may get these documents for free by visiting EDGAR on the SEC website at www.sec.gov. Alternatively, the depositor or Deutsche Bank Securities Inc., any other underwriter, or any dealer participating in this offering will arrange to send you the prospectus if you request it by calling toll-free 1-800-503-4611 or by email to the following address: prospectus.cpdg@db.com. The offered certificates referred to in these materials, and the asset pool backing them, are subject to modification or revision (including the possibility that one or more classes of certificates may be split, combined or eliminated at any time prior to issuance or availability of a final prospectus) and are offered on a “when, as and if issued” basis. You understand that, when you are considering the purchase of these certificates, a contract of sale will come into being no sooner than the date on which the relevant class has been priced and we have verified the allocation of certificates to be made to you; any “indications of interest” expressed by you, and any “soft circles” generated by us, will not create binding contractual obligations for you or us.
104
|
105 Town Center Road
King of Prussia, PA 19406
|
Collateral Asset Summary – Loan No. 10
Valley Forge Shopping Center
|
Cut-off Date Balance:
Cut-off Date LTV:
U/W NCF DSCR:
U/W NOI Debt Yield:
|
$35,000,000
71.9%
1.33x
8.6%
|
The depositor has filed a registration statement (including the prospectus) with the SEC (SEC File No. 333-193376) for the offering to which this communication relates. Before you invest, you should read the prospectus in the registration statement and other documents the depositor has filed with the SEC for more complete information about the depositor, the issuing trust and this offering. You may get these documents for free by visiting EDGAR on the SEC website at www.sec.gov. Alternatively, the depositor or Deutsche Bank Securities Inc., any other underwriter, or any dealer participating in this offering will arrange to send you the prospectus if you request it by calling toll-free 1-800-503-4611 or by email to the following address: prospectus.cpdg@db.com. The offered certificates referred to in these materials, and the asset pool backing them, are subject to modification or revision (including the possibility that one or more classes of certificates may be split, combined or eliminated at any time prior to issuance or availability of a final prospectus) and are offered on a “when, as and if issued” basis. You understand that, when you are considering the purchase of these certificates, a contract of sale will come into being no sooner than the date on which the relevant class has been priced and we have verified the allocation of certificates to be made to you; any “indications of interest” expressed by you, and any “soft circles” generated by us, will not create binding contractual obligations for you or us.
105
|
New York
|
Collateral Asset Summary – Loan No. 11
Tops Markets Grocery Anchored
Portfolio |
Cut-off Date Balance:
Cut-off Date LTV:
U/W NCF DSCR:
U/W NOI Debt Yield:
|
$34,948,224
63.4%
1.72x
12.1%
|
|
Mortgage Loan Information
|
Property Information
|
|||||
|
Loan Seller:
|
GACC
|
Single Asset / Portfolio:
|
Portfolio of six properties
|
|||
|
Loan Purpose:
|
Refinance
|
Property Type:
|
Anchored Retail
|
|||
|
Sponsor:
|
Cofinance, Inc.; James J. Maurer
|
Collateral:
|
Fee Simple
|
|||
|
Borrower:
|
TG-Cotops Youngmann NY LLC; TG-
|
Location:
|
Various, NY
|
|||
|
Cotops Tonawanda NY LLC; TG-
|
Year Built / Renovated:
|
1986-1997 / NAP
|
||||
|
Cotops Elmira NY LLC; TG-Cotops
|
Total Sq. Ft.:
|
593,295
|
||||
|
Arcade NY LLC; TG-Cotops Avon NY
|
Property Management:
|
Morgan Property Management LLC
|
||||
|
LLC; TG-Cotops Hamlin NY LLC
|
Underwritten NOI:
|
$4,231,035
|
||||
|
Original Balance:
|
$35,000,000
|
Underwritten NCF:
|
$3,877,466
|
|||
|
Cut-off Date Balance:
|
$34,948,224
|
Appraised Value:
|
$55,100,000
|
|||
|
% by Initial UPB:
|
2.8%
|
Appraisal Date:
|
July 2013
|
|||
|
Interest Rate:
|
5.0000%
|
|||||
|
Payment Date:
|
6th of each month
|
Historical NOI
|
||||
|
First Payment Date:
|
March 6, 2014
|
Most Recent NOI:
|
$5,533,575 (T-12 October 31, 2013)
|
|||
|
Maturity Date:
|
February 6, 2019
|
2012 NOI:
|
$5,665,911 (December 31, 2012)
|
|||
|
Amortization:
|
360 months
|
2011 NOI:
|
$5,645,763 (December 31, 2011)
|
|||
|
Additional Debt:
|
None
|
2010 NOI:
|
NAV
|
|||
|
Call Protection(1):
|
L(25), YM2(31), O(4)
|
|||||
|
Lockbox / Cash Management:
|
Hard / In Place
|
Historical Occupancy
|
||||
|
Current Occupancy:
|
90.6% (January 17, 2014)
|
|||||
|
Reserves
|
2012 Occupancy:
|
90.4% (December 31, 2012)
|
||||
|
Initial
|
Monthly
|
2011 Occupancy:
|
89.7% (December 31, 2011)
|
|||
|
Taxes:
|
$105,000
|
$87,548
|
2010 Occupancy:
|
NAV
|
||
|
Insurance(2):
|
$0
|
Springing
|
(1) On any date after the lockout period ends, the borrowers may obtain the release of any property upon a bona fide third-party sale of such property, provided, among other things, (i) the DSCR for the remaining properties is no less than the greater of the DSCR immediately preceding such sale and 1.72x, (ii) the LTV ratio for the remaining properties is no more than the lesser of the LTV ratio immediately preceding such sale and 63.5% and (iii) the payment of principal equal to the greater of (a) 100% of the net sales proceeds and (b) 125% of the allocated loan amount for such property, which in no event may be less than 94% of the gross sales price of such property, together with the applicable yield maintenance premium. In addition, the borrower may obtain the release of a non-income producing parcel at the Tops Plaza - Avon property.
(2) The borrower is required to deposit 1/12 of the estimated annual insurance premiums into an insurance reserve account if an acceptable blanket insurance policy is no longer in place.
(3) All excess cash will be deposited into the lease sweep reserve upon the first to occur of (i) an event of default, (ii) the DSCR falls below 1.30x on the last day of any calendar quarter, (iii) with respect to the Gander Mountain lease, the payment date in June 2015 (unless cash or a letter of credit in the amount of $22.00 PSF has been delivered) and, with respect to the Big Lots lease, the payment date in July 2016 (unless cash or a letter of credit in the amount of $19.00 PSF has been provided) or (iv) the date that Gander Mountain, Big Lots or any of the Tops Market tenants (a) surrenders, cancels or terminates its lease, (b) goes dark, (c) is in monetary default under its lease or (d) is party to an insolvency proceeding.
|
|||
|
Replacement:
|
$0
|
$16,810
|
||||
|
TI/LC:
|
$0
|
$15,621
|
||||
|
Lease Sweep(3):
|
$0
|
Springing
|
||||
|
Financial Information
|
||||||
|
Cut-off Date Balance / Sq. Ft.:
|
$59
|
|||||
|
Balloon Balance / Sq. Ft.:
|
$54
|
|||||
|
Cut-off Date LTV:
|
63.4%
|
|||||
|
Balloon LTV:
|
58.6%
|
|||||
|
Underwritten NOI DSCR:
|
1.88x
|
|||||
|
Underwritten NCF DSCR:
|
1.72x
|
|||||
|
Underwritten NOI Debt Yield:
|
12.1%
|
|||||
|
Underwritten NCF Debt Yield:
|
11.1%
|
|||||
| |
||||||
|
TRANSACTION HIGHLIGHTS
|
|
§
|
Portfolio Diversity. The portfolio is comprised of six anchored shopping centers totaling 593,295 square feet. The properties are anchored by Tops Market, Gander Mountain, Big Lots and Family Dollar. As of January 17, 2014, the portfolio is 90.6% occupied by 36 tenants, with individual property occupancies ranging from 85.2% to 95.0%. No individual property accounts for more than 25.7% of underwritten NOI and, except for the Youngmann Plaza property which accounts for 35.1% of total square feet, no individual property accounts for more than 16.6% of total square feet.
|
|
§
|
Major Tenant. Tops Market is an anchor tenant at all six properties and totals 334,515 sq. ft., which represents approximately 56.4% of the portfolio net rentable area. The Tops Market leases have a weighted average remaining term of approximately 14 years. In August 2012, Tops Market exercised two early extension options, totaling 10 years, for each of the Tops Market leases.
|
|
§
|
Sponsor. James J. Maurer is the president of Cofinance, Inc., a subsidiary of Cofinance Group SA. Cofinance Group SA owns, operates, develops and manages commercial real estate properties, and is a provider of capital for direct investment in real estate assets. James J. Mauer joined Cofinance, Inc. in 2004 and under Mr. Maurer’s leadership, Cofinance, Inc. has acquired property in New York City, New Jersey and Florida.
|
The depositor has filed a registration statement (including the prospectus) with the SEC (SEC File No. 333-193376) for the offering to which this communication relates. Before you invest, you should read the prospectus in the registration statement and other documents the depositor has filed with the SEC for more complete information about the depositor, the issuing trust and this offering. You may get these documents for free by visiting EDGAR on the SEC website at www.sec.gov. Alternatively, the depositor or Deutsche Bank Securities Inc., any other underwriter, or any dealer participating in this offering will arrange to send you the prospectus if you request it by calling toll-free 1-800-503-4611 or by email to the following address: prospectus.cpdg@db.com. The offered certificates referred to in these materials, and the asset pool backing them, are subject to modification or revision (including the possibility that one or more classes of certificates may be split, combined or eliminated at any time prior to issuance or availability of a final prospectus) and are offered on a “when, as and if issued” basis. You understand that, when you are considering the purchase of these certificates, a contract of sale will come into being no sooner than the date on which the relevant class has been priced and we have verified the allocation of certificates to be made to you; any “indications of interest” expressed by you, and any “soft circles” generated by us, will not create binding contractual obligations for you or us.
106
|
Seneca, SC
|
Collateral Asset Summary – Loan No. 12
Clemson Student Housing
|
Cut-off Date Balance:
Cut-off Date LTV:
U/W NCF DSCR:
U/W NOI Debt Yield:
|
$33,425,167
70.8%
1.27x
9.2%
|
|
Mortgage Loan Information
|
Property Information
|
|||||
|
Loan Seller:
|
CCRE
|
Single Asset / Portfolio:
|
Portfolio of two properties
|
|||
|
Loan Purpose:
|
Refinance
|
Property Type:
|
Student Housing
|
|||
|
Sponsors:
|
Thomas P. Winkopp; William W.
|
Collateral:
|
Fee Simple
|
|||
|
Huss, Jr.; James N. Workman, Jr.
|
Location:
|
Seneca, SC
|
||||
|
Borrowers:
|
High Pointe of Clemson LLC; The Pier
|
Year Built / Renovated:
|
2008-2013 / NAP
|
|||
|
at Clemson LLC
|
Total Beds:
|
873
|
||||
|
Original Balance:
|
$33,500,000
|
Property Management:
|
Tom Winkopp Realtor/Developer, LLC
|
|||
|
Cut-off Date Balance:
|
$33,425,167
|
Underwritten NOI:
|
$3,077,180
|
|||
|
% by Initial UPB:
|
2.7%
|
Underwritten NCF:
|
$2,989,880
|
|||
|
Interest Rate:
|
5.7990%
|
Appraised Value:
|
$47,200,000
|
|||
|
Payment Date:
|
6th of each month
|
Appraisal Date:
|
August 13, 2013
|
|||
|
First Payment Date:
|
February 6, 2014
|
|||||
|
Maturity Date:
|
January 6, 2024
|
Historical NOI(4)
|
||||
|
Amortization:
|
360 months
|
Most Recent NOI:
|
$2,525,145 (T-12 September 30, 2013)
|
|||
|
Additional Debt(1):
|
$3,000,000 Mezzanine Loan
|
2012 NOI:
|
$2,100,744 (December 31, 2012)
|
|||
|
Call Protection:
|
L(26), YM1(91), O(3)
|
2011 NOI:
|
NAP
|
|||
|
Lockbox / Cash Management:
|
Soft / In Place
|
2010 NOI:
|
NAP
|
|||
|
Reserves
|
Historical Occupancy(4)
|
|||||
|
Initial
|
Monthly
|
Most Recent Occupancy:
|
95.3% (September 30, 2013)
|
|||
|
Taxes:
|
$47,817
|
$47,817
|
2012 Occupancy:
|
97.4% (December 31, 2012)
|
||
|
Insurance:
|
$53,098
|
$8,639
|
2011 Occupancy:
|
NAP
|
||
|
Immediate Repairs:
|
$19,375
|
NAP
|
2010 Occupancy:
|
NAP
|
||
|
Replacement:
|
$0
|
$7,275
|
(1) Additional Debt consists of a $3.0 million mezzanine loan that is currently held by Terra Capital Partners LLC. The mezzanine loan is coterminous with the Clemson Student Housing loan and accrues interest at a rate of 13.0000% per annum.
(2) The borrower is required to deposit monthly 1/12 of the contractual annual HOA dues related to the Highpointe property. The borrower owns 154 of the 221 units at the Highpointe property, which property is subject to a condominium regime pursuant to which the borrower controls approximately 67.8% of the voting rights. The remaining units, which are not collateral for the loan, are privately owned by individuals and entities, none of which control more than 2.3% of the voting rights.
(3) The Bridge Program students are required to make semi-annual payments for rent. As a result, the borrower is required to make semi-annual deposits into the Highpointe Rent reserve to coincide with the Fall and Spring rent payments. The borrower deposited $1,389,666 for the Fall 2014 semester’s rent.
(4) The Pier property was built in 2012. As a result, Historical NOI and Historical Occupancy are not applicable.
|
|||
|
HOA(2):
|
$37,563
|
$37,563
|
||||
|
Highpointe Rent(3):
|
$1,389,666
|
Springing
|
||||
|
Financial Information
|
||||||
|
Mortgage Loan
|
Total Debt
|
|||||
|
Cut-off Date Balance / Bed:
|
$38,288
|
$41,724
|
||||
|
Balloon Balance / Bed:
|
$32,342
|
$35,779
|
||||
|
Cut-off Date LTV:
|
70.8%
|
77.2%
|
||||
|
Balloon LTV:
|
59.8%
|
66.2%
|
||||
|
Underwritten NOI DSCR:
|
1.30x
|
1.12x
|
||||
|
Underwritten NCF DSCR:
|
1.27x
|
1.09x
|
||||
|
Underwritten NOI Debt Yield:
|
9.2%
|
8.4%
|
||||
|
Underwritten NCF Debt Yield:
|
8.9%
|
8.2%
|
||||
|
TRANSACTION HIGHLIGHTS
|
|
§
|
Properties. The Clemson Student Housing loan is collateralized by two student housing complexes offering 873 collateral beds and located in Seneca, South Carolina, approximately 2.0 miles from Clemson University. Built in phases from 2008-2013 for approximately $40.1 million, amenities at each property include a campus shuttle, study lounge, fitness center, gaming rooms, volleyball court, a pool, hot tub, tanning salon and indoor/outdoor event space.
|
|
§
|
Occupancy. The properties are 95.3% leased for the 2013-2014 academic year. The leases are structured as 12-month leases or 9-month leases for Bridge to Clemson Program students with more than 95.0% of leases backed by parental guarantees.
|
|
§
|
Bridge to Clemson Program. The Highpointe property serves as the sole housing complex for the Bridge to Clemson Program, a program designed to transition strong academic freshman students who narrowly missed undergraduate acceptance at Clemson University, from Tri-County Technical College to Clemson University. The Bridge to Clemson Program represents over 95.0% of the occupied collateral units at the Highpointe property. For the fall 2013 academic semester, the Bridge to Clemson Program occupied 46.3% of the non-collateral units at the Highpointe property.
|
|
§
|
Sponsors. The sponsors are the original developers of the Clemson Student Housing properties and have more than 40 years of experience in real estate in the Clemson community. James N. Workman, Jr. currently serves as the Chairman of Clemson’s Department of Architecture and Humanities Advisory Board and William W. Huss, Jr. serves on the City of Clemson Board of Zoning Appeals.
|
|
§
|
Clemson University. Clemson University is a public university comprised of five colleges that offer approximately 80 undergraduate majors and 110 graduate programs. As of 2013, total enrollment was approximately 21,303, reflecting a 21.1% increase since 2007. Nearly 60.0% of students live off-campus. Additionally in 2013, Kiplinger magazine rated Clemson University among the best values in public higher education in its ranking of the “100 Best Values in Public Colleges.”
|
The depositor has filed a registration statement (including the prospectus) with the SEC (SEC File No. 333-193376) for the offering to which this communication relates. Before you invest, you should read the prospectus in the registration statement and other documents the depositor has filed with the SEC for more complete information about the depositor, the issuing trust and this offering. You may get these documents for free by visiting EDGAR on the SEC website at www.sec.gov. Alternatively, the depositor or Deutsche Bank Securities Inc., any other underwriter, or any dealer participating in this offering will arrange to send you the prospectus if you request it by calling toll-free 1-800-503-4611 or by email to the following address: prospectus.cpdg@db.com. The offered certificates referred to in these materials, and the asset pool backing them, are subject to modification or revision (including the possibility that one or more classes of certificates may be split, combined or eliminated at any time prior to issuance or availability of a final prospectus) and are offered on a “when, as and if issued” basis. You understand that, when you are considering the purchase of these certificates, a contract of sale will come into being no sooner than the date on which the relevant class has been priced and we have verified the allocation of certificates to be made to you; any “indications of interest” expressed by you, and any “soft circles” generated by us, will not create binding contractual obligations for you or us.
107
|
30 Superior Drive
Natick, MA 01760
|
Collateral Asset Summary – Loan No. 13
FedEx Distribution - Natick
|
Cut-off Date Balance:
Cut-off Date LTV:
U/W NCF DSCR:
U/W NOI Debt Yield:
|
$31,500,000
67.2%
1.31x
8.4%
|
|
Mortgage Loan Information
|
Property Information
|
|||||
|
Loan Seller:
|
KeyBank
|
Single Asset / Portfolio:
|
Single Asset
|
|||
|
Loan Purpose:
|
Refinance
|
Property Type:
|
Industrial Warehouse / Distribution
|
|||
|
Sponsor:
|
Robert J. Scannell; Robert J. Scannell
|
Collateral:
|
Fee Simple
|
|||
|
Revocable Trust dated September 9,
|
Location:
|
Natick, MA
|
||||
|
2002
|
Year Built / Renovated:
|
2013 / NAP
|
||||
|
Borrower:
|
Scannell Properties #123, LLC
|
Total Sq. Ft.:
|
173,174
|
|||
|
Original Balance:
|
$31,500,000
|
Property Management:
|
Self-managed
|
|||
|
Cut-off Date Balance:
|
$31,500,000
|
Underwritten NOI:
|
$2,645,502
|
|||
|
% by Initial UPB:
|
2.5%
|
Underwritten NCF:
|
$2,628,185
|
|||
|
Interest Rate:
|
5.0600%
|
Appraised Value:
|
$46,900,000
|
|||
|
Payment Date:
|
1st of each month
|
Appraisal Date:
|
January 23, 2014
|
|||
|
First Payment Date:
|
April 1, 2014
|
|||||
|
Maturity Date:
|
March 1, 2024
|
Historical NOI
|
||||
|
Amortization(1):
|
Interest only for first 36 months; 360
|
Most Recent NOI:
|
NAP
|
|||
|
months thereafter
|
2012 NOI:
|
NAP
|
||||
|
Additional Debt(2):
|
$3,500,000 Mezzanine Debt
|
2011 NOI:
|
NAP
|
|||
|
Call Protection:
|
L(24), D(93), O(3)
|
2010 NOI:
|
NAP
|
|||
|
Lockbox / Cash Management(3):
|
Hard / In Place
|
|||||
|
Historical Occupancy
|
||||||
|
Reserves
|
Current Occupancy:
|
100.0% (February 7, 2014)
|
||||
|
Initial
|
Monthly
|
2012 Occupancy:
|
NAP
|
|||
|
Taxes(4):
|
$0
|
Springing
|
2011 Occupancy:
|
NAP
|
||
|
Insurance(4):
|
$0
|
Springing
|
2010 Occupancy:
|
NAP
|
||
|
Replacement:
|
$1,443
|
$1,443
|
(1) Following the initial 36-month interest only period, the FedEx Distribution – Natick loan is structured with a fixed amortization schedule provided in Annex I of the Free Writing Prospectus, which is based on a 360-month amortization period for the FedEx Distribution – Natick loan, together with the related mezzanine loan.
(2) The mezzanine loan is coterminous with the mortgage loan and accrues interest at a rate of 12.0000% per annum.
(3) Cash management will be triggered upon (i) an event of default, (ii) the DSCR based on the trailing three month period is less than 1.10x, (iii) the tenant vacates/goes dark or if FedEx Corporation’s senior unsecured rating drops below BB+, (iv) a Mezzanine Loan Default, or (v) the bankruptcy of borrower or an affiliated manager.
(4) Tax and Insurance escrows will be suspended provided that: (i) no event of default exists, (ii) FedEx Corporation’s senior unsecured rating is at least BB+, (iii) the tenant is required per the lease to pay taxes and insurance expenses directly and provides evidence of payment, and (iv) the current lease is in full force/effect.
(5) Based on the maximum annual debt service payments by loan year per the fixed amortization schedule. Using the current interest only payments, the Underwritten NOI DSCR and Underwritten NCF DSCR are 1.64x and 1.63x for the mortgage loan respectively, and 1.30x and 1.29x for the total debt respectively.
|
|||
|
Financial Information
|
||||||
|
Mortgage Loan
|
Total Debt
|
|||||
|
Cut-off Date Balance / Sq. Ft.:
|
$182
|
$202
|
||||
|
Balloon Balance / Sq. Ft.:
|
$164
|
$182
|
||||
|
Cut-off Date LTV:
|
67.2%
|
74.6%
|
||||
|
Balloon LTV:
|
60.4%
|
67.1%
|
||||
|
Underwritten NOI DSCR(5):
|
1.32x
|
1.08x
|
||||
|
Underwritten NCF DSCR(5):
|
1.31x
|
1.07x
|
||||
|
Underwritten NOI Debt Yield:
|
8.4%
|
7.6%
|
||||
|
Underwritten NCF Debt Yield:
|
8.3%
|
7.5%
|
||||
| |
||||||
|
TRANSACTION HIGHLIGHTS
|
|
§
|
Tenancy. The property is 100.0% leased to FedEx Ground Package System, Inc. (“FedEx Ground”), a wholly owned subsidiary of FedEx Corporation (Moody’s: Baa1; S&P: BBB), on a 15-year NNN lease which expires in July 2028 and allows for two 5-year extension options. FedEx Ground specializes in small-package shipping for business-to-business and residential delivery. In FY 2013, FedEx Ground had revenue and operating income of approximately $10.6 billion and $1.8 billion, respectively, both of which have exhibited year over year increases since FY 2010. FedEx Ground accounted for approximately 23.9% and 70.1% of FedEx Corporation’s revenue and operating income for FY 2013, respectively.
|
|
§
|
Location. The property is located in Natick, MA, approximately one mile south of the Massachusetts Turnpike (Interstate 90) and approximately 15 miles west of downtown Boston. I-90 is the primary east-west route throughout central Massachusetts and connects to Interstate-95 approximately six miles east of the property, which provides north-south access throughout the Northeast. Route 9, Route 27 and Route 30 are all within blocks of the subject, providing strong distribution access to the local region. Route 9 provides access to the local commercial corridor which contains over 3.0 million sq. ft. of destination retail and connects to downtown Boston to the east.
|
|
§
|
Asset Quality. The property was developed in 2013 as a build-to-suit facility for FedEx Ground at a reported cost of approximately $38.25 million. The property features 24’ clear ceiling heights, 43 dock-high doors, 13 drive-in doors, perimeter fencing and security gate. Since completion, FedEx Ground has invested over $20 million in the construction of a mechanized conveyor distribution system within the facility.
|
|
§
|
Experienced Sponsor. Scannell Properties (“Scannell”), an Indianapolis based build-to-suit developer with over 20 years’ experience, has developed over 76 properties in 37 states and Canada including industrial, office, retail, government and educational facilities. Scannell is the largest developer of FedEx facilities in the U.S. As of 6/30/2013 Robert J. Scannell owned 41 properties, of which, 28 are leased to FedEx Ground.
|
The depositor has filed a registration statement (including the prospectus) with the SEC (SEC File No. 333-193376) for the offering to which this communication relates. Before you invest, you should read the prospectus in the registration statement and other documents the depositor has filed with the SEC for more complete information about the depositor, the issuing trust and this offering. You may get these documents for free by visiting EDGAR on the SEC website at www.sec.gov. Alternatively, the depositor or Deutsche Bank Securities Inc., any other underwriter, or any dealer participating in this offering will arrange to send you the prospectus if you request it by calling toll-free 1-800-503-4611 or by email to the following address: prospectus.cpdg@db.com. The offered certificates referred to in these materials, and the asset pool backing them, are subject to modification or revision (including the possibility that one or more classes of certificates may be split, combined or eliminated at any time prior to issuance or availability of a final prospectus) and are offered on a “when, as and if issued” basis. You understand that, when you are considering the purchase of these certificates, a contract of sale will come into being no sooner than the date on which the relevant class has been priced and we have verified the allocation of certificates to be made to you; any “indications of interest” expressed by you, and any “soft circles” generated by us, will not create binding contractual obligations for you or us.
108
|
500 Jefferson Street
Houston, TX 77002
|
Collateral Asset Summary – Loan No. 14
500 Jefferson
|
Cut-off Date Balance:
Cut-off Date LTV:
U/W NCF DSCR:
U/W NOI Debt Yield:
|
$31,200,000
68.3%
2.28x
11.9%
|
|
Mortgage Loan Information
|
Property Information
|
|||||||
|
Loan Seller:
|
UBSRES
|
Single Asset / Portfolio:
|
Single Asset
|
|||||
|
Loan Purpose:
|
Acquisition
|
Property Type:
|
CBD Office
|
|||||
|
Sponsor(1):
|
Corporate Property Associates 17-
|
Collateral:
|
Fee Simple
|
|||||
|
Global Incorporated
|
Location:
|
Houston, TX
|
||||||
|
Borrower:
|
500 Jefferson Tower (TX) LLC
|
Year Built / Renovated:
|
1963-1964 / 2004, 2005, 2007, 2013
|
|||||
|
Original Balance:
|
$31,200,000
|
Total Sq. Ft.:
|
390,479
|
|||||
|
Cut-off Date Balance:
|
$31,200,000
|
Property Management:
|
500 Jefferson Manager (DE) LLC;
|
|||||
|
% by Initial UPB:
|
2.5%
|
Brookfield Properties Management
|
||||||
|
Interest Rate:
|
4.9020%
|
LLC
|
||||||
|
Payment Date:
|
6th of each month
|
Underwritten NOI(4):
|
$3,712,970
|
|||||
|
First Payment Date:
|
February 6, 2014
|
Underwritten NCF:
|
$3,536,501
|
|||||
|
Anticipated Repayment Date(2):
|
January 6, 2024
|
Appraised Value:
|
$45,700,000
|
|||||
|
Maturity Date:
|
March 6, 2026
|
Appraisal Date:
|
November 25, 2013
|
|||||
|
Amortization:
|
Interest Only
|
|||||||
|
Additional Debt:
|
None
|
Historical NOI(4)
|
||||||
|
Call Protection:
|
L(26), D(87), O(7)
|
2012 NOI:
|
$2,750,084 (December 31, 2012)
|
|||||
|
Lockbox / Cash Management:
|
Hard / In Place
|
2011 NOI:
|
$2,814,660 (December 31, 2011)
|
|||||
|
2010 NOI:
|
$1,789,024 (December 31, 2010)
|
|||||||
|
Reserves
|
||||||||
|
Initial
|
Monthly
|
Historical Occupancy
|
||||||
|
Taxes(3):
|
$0
|
Springing
|
Most Recent Occupancy:
|
96.3% (October 1, 2013)
|
||||
|
Insurance(3):
|
$0
|
Springing
|
2012 Occupancy:
|
96.0% (December 31, 2012)
|
||||
|
Replacement(3):
|
$0
|
Springing
|
2011 Occupancy:
|
95.6% (December 31, 2011)
|
||||
|
TI/LC(3):
|
$170,384
|
Springing
|
2010 Occupancy:
|
95.6% (December 31, 2010)
|
||||
|
Utility Funds(3):
|
$0
|
Springing
|
(1) The sponsor is also the sponsor under the mortgage loan identified on Annex A-1 as Avnet Building, which has a Cut-off Date Balance of $14.8 million.
(2) If the 500 Jefferson loan is not repaid in full by the Anticipated Repayment Date, the interest rate will increase to 6.7500% per annum and all excess cash flow will be swept into a lender-controlled account.
(3) Upon the occurrence and continuation of (i) a monetary or material non-monetary event of default, (ii) a monetary or material non-monetary default by Kellogg Brown & Root, LLC (“KBR”) or a replacement tenant under its lease, (iii) a surrender, cancellation, or termination of the KBR or a replacement tenant lease before its then current expiration date, (iv) any bankruptcy action of KBR or a replacement tenant or its respective lease guarantor, or (v) the debt service coverage ratio falling below 1.30x after the occurrence and cure of clause (iii), on a monthly basis the borrower will be required to deposit (a) 1/12 of the estimated annual real estate taxes into a tax reserve account, (b) 1/12 of the estimated annual insurance premiums into an insurance reserve account, (c) $6,532 into a replacement reserve account, (d) $32,660 into a TI/LC reserve account, and (e) an amount equal to the next succeeding monthly utility costs as set forth in the annual budget.
(4) The increase from Historical NOI to Underwritten NOI is primarily a result of the 2013 rent bump for the largest tenant, KBR, and the net present value of the difference in KBR’s future rent steps through the lease term and its current rental rate.
|
|||||
|
Immediate Repairs:
|
$100,000
|
NAP
|
||||||
|
Financial Information
|
||||||||
|
Cut-off Date Balance / Sq. Ft.:
|
$80
|
|||||||
|
Balloon Balance / Sq. Ft.:
|
$80
|
|||||||
|
Cut-off Date LTV:
|
68.3%
|
|||||||
|
Balloon LTV:
|
68.3%
|
|||||||
|
Underwritten NOI DSCR:
|
2.39x
|
|||||||
|
Underwritten NCF DSCR:
|
2.28x
|
|||||||
|
Underwritten NOI Debt Yield:
|
11.9%
|
|||||||
|
Underwritten NCF Debt Yield:
|
11.3%
|
|||||||
|
TRANSACTION HIGHLIGHTS
|
|
■
|
Tenancy. As of the October 1, 2013 rent roll, the 500 Jefferson mortgaged property was 96.3% occupied with minimal tenant rollover consisting of 19,368 sq. ft. (5.0% of NRA) expected during the loan term. Further, in place rents at the 500 Jefferson mortgaged property, excluding storage and retail space, average $8.34 per square foot, well below the appraiser’s concluded market rent of $14.75 per square foot. Kellogg Brown & Root, LLC (“KBR”, NYSE: KBR) leases 355,993 sq. ft. (91.2% of NRA) at the mortgaged property and has been in occupancy since 1992. Since 2003, KBR has expanded its leased premises from 216,600 square feet to its current 355,993 square feet, and in 2010, KBR executed new twenty year leases at the 500 Jefferson mortgaged property and at its headquarters at 601 Jefferson Street, located across the street. KBR is a global engineering, construction and services company supporting energy, hydrocarbon, government services, mineral, infrastructure, power, industrial and commercial markets. As of February 18, 2014, KBR had a market capitalization of $4.7 billion.
|
|
■
|
Sponsorship. Corporate Property Associates 17-Global Incorporated is an affiliate of W.P. Carey Inc. (NYSE: WPC), which is a publicly traded real estate investment trust founded in 1973 that provides long-term sale-leaseback and build-to-suit leasing for companies worldwide. Per its 2012 annual report, W.P. Carey Inc. reported EBITDA of $170.6 million and net income of $62.1 million. As of the second quarter 2013, W.P. Carey Inc.’s holdings totaled 423 properties containing 39.5 million square feet with an occupancy of 98.9% and a weighted average remaining lease term of 8.8 years.
|
|
■
|
Location. The 500 Jefferson mortgaged property is located in Houston, Texas, within the Cullen Center complex, a Houston landmark which includes four office buildings, parking garages, a Crowne Plaza hotel and public spaces. KBR’s world headquarters is also located in the Cullen Center complex, and is connected to the 500 Jefferson mortgaged property via elevated walkways. Further, KBR’s largest private client, Chevron, is located one block north of the 500 Jefferson mortgaged property.
|
The depositor has filed a registration statement (including the prospectus) with the SEC (SEC File No. 333-193376) for the offering to which this communication relates. Before you invest, you should read the prospectus in the registration statement and other documents the depositor has filed with the SEC for more complete information about the depositor, the issuing trust and this offering. You may get these documents for free by visiting EDGAR on the SEC website at www.sec.gov. Alternatively, the depositor or Deutsche Bank Securities Inc., any other underwriter, or any dealer participating in this offering will arrange to send you the prospectus if you request it by calling toll-free 1-800-503-4611 or by email to the following address: prospectus.cpdg@db.com. The offered certificates referred to in these materials, and the asset pool backing them, are subject to modification or revision (including the possibility that one or more classes of certificates may be split, combined or eliminated at any time prior to issuance or availability of a final prospectus) and are offered on a “when, as and if issued” basis. You understand that, when you are considering the purchase of these certificates, a contract of sale will come into being no sooner than the date on which the relevant class has been priced and we have verified the allocation of certificates to be made to you; any “indications of interest” expressed by you, and any “soft circles” generated by us, will not create binding contractual obligations for you or us.
109
|
101-151 Mill Street
Gahanna, OH 43230
|
Collateral Asset Summary – Loan No. 15
Creekside Mixed Use Development
|
Cut-off Date Balance:
Cut-off Date LTV:
U/W NCF DSCR:
U/W NOI Debt Yield:
|
$25,265,615
74.8%
1.42x
10.2%
|
|
Mortgage Loan Information
|
Property Information
|
|||||||
|
Loan Seller:
|
UBSRES
|
Single Asset / Portfolio:
|
Single Asset
|
|||||
|
Loan Purpose:
|
Refinance
|
Property Type:
|
Office / Retail / Multifamily Mixed Use
|
|||||
|
Sponsor:
|
Laura A. Chappelle; Abbott Road
|
Collateral(8):
|
Fee Simple / Leasehold
|
|||||
|
Commons, L.L.C.
|
Location:
|
Gahanna, OH
|
||||||
|
Borrower:
|
Creekside Equity Partners LLC
|
Year Built / Renovated:
|
2007 / 2012-2013
|
|||||
|
Original Balance:
|
$25,350,000
|
Total Sq. Ft.:
|
191,586
|
|||||
|
Cut-off Date Balance:
|
$25,265,615
|
Property Management:
|
Strathmore Development Company
|
|||||
|
% by Initial UPB:
|
2.0%
|
Michigan LLC
|
||||||
|
Interest Rate:
|
5.4475%
|
Underwritten NOI:
|
$2,571,353
|
|||||
|
Payment Date:
|
6th of each month
|
Underwritten NCF:
|
$2,437,169
|
|||||
|
First Payment Date:
|
January 6, 2014
|
Appraised Value(9):
|
$33,800,000
|
|||||
|
Maturity Date:
|
December 6, 2023
|
Appraisal Date(9):
|
April 18, 2014
|
|||||
|
Amortization:
|
360 months
|
|||||||
|
Additional Debt(1):
|
Future Mezzanine Debt Permitted
|
Historical NOI
|
||||||
|
Call Protection:
|
L(12), YM1(15), D or YM1(89), O(4)
|
Most Recent NOI:
|
$1,806,360 (T-12 October 31, 2013)
|
|||||
|
Lockbox / Cash Management(2):
|
Hard / Springing
|
2012 NOI:
|
NAV
|
|||||
|
Reserves
|
Historical Occupancy(10)
|
|||||||
|
Initial
|
Monthly
|
Most Recent Occupancy:
|
96.5% (October 31, 2013)
|
|||||
|
Taxes:
|
$216,898
|
$38,389
|
2012 Occupancy:
|
NAV
|
||||
|
Insurance(3):
|
$0
|
$10,880
|
(1) Future mezzanine debt that is coterminous with the term of the mortgage loan is permitted, subject to terms and conditions as specified in the loan documents, in an amount that results in (i) a combined LTV ratio of no greater than 84.0%, and (ii) a combined debt service coverage ratio of not less than 1.15x.
(2) Cash management will be triggered upon (i) an event of default, (ii) any bankruptcy action of borrower, guarantor, sponsor, or manager, or (iii) the debt service coverage ratio based on the trailing twelve month period falls below 1.20x.
(3) Commencing on January 6, 2014 and ending on May 6, 2014, the borrower shall deposit an amount equal to $10,880 into an insurance reserve account, thereafter the borrower shall deposit an amount equal to 1/12 of the estimated annual insurance premiums.
(4) The borrower is required to perform the interior renovation of all residential units that were vacant as of the closing date. The borrower caused the renovations to be completed and the lender disbursed the applicable portion of the Renovation Funds to the borrower in accordance with the loan documents.
(5) Lender shall disburse funds in the Achievement Funds account to the borrower provided the following conditions are met on or prior to December 5, 2015: (i) no event of default is occurring, (ii) the residential portion of the Creekside Mixed Use Development property has an occupancy rate of at least 95.0%, (iii) the debt service coverage ratio based upon the trailing twelve month period is greater than 1.30x for two consecutive quarters, and (iv) the debt yield based upon the trailing twelve month period is equal to or greater than 9.0% for two consecutive quarters. If the foregoing conditions are not satisfied prior to December 5, 2015, lender has the right to use such funds to prepay the loan, subject to the Yield Maintenance Premium.
(6) Rent abatement funds are attributable to Yoga Burn and Creekside Carwash.
(7) The borrower is required to pay all amounts due under the settlement agreement dated December 4, 2013 between Creekside Investment Partners, LLC, Strathmore Development Company Michigan LLC and Gahanna-Jefferson City School Board of Education. The borrower is obligated to make monthly deposits into the school district funds reserve account through August 6, 2017.
(8) Two of the three buildings at the property are subject to a ground lease from the City of Gahanna with an extended maturity approximately 83 years beyond the loan term. In addition, the property consists of three condominiums, and the borrower controls the board of all three.
(9) Appraised Value reflects the “As Stabilized” amount per the appraisal and the recent execution of leases satisfies the assumption in the appraisal for the “As Stabilized” value. Based on the “As Is” Appraised Value of $33,300,000, the Cut-off Date LTV and Balloon LTV ratios are 75.9% and 63.5%, respectively.
(10) Most Recent Occupancy is based on the total occupied square footage at the commercial and residential components of the property and reflects an increase from 47.4% in 2012 when the sponsor purchased the property out of receivership and has since invested approximately $19.2 million in capital improvements in the property.
|
|||||
|
Replacement:
|
$0
|
$3,206
|
||||||
|
TI/LC:
|
$0
|
$8,138
|
||||||
|
Renovation Funds(4) :
|
$405,081
|
$0
|
||||||
|
Achievement Funds(5):
|
$375,000
|
$0
|
||||||
|
Rent Abatement Funds(6):
|
$57,882
|
$0
|
||||||
|
School District Funds(7):
|
$16,667
|
$4,167
|
||||||
|
Ground Rent:
|
$86,520
|
1/12 of annual ground
|
||||||
|
rent
|
||||||||
|
Financial Information
|
||||||||
|
Cut-off Date Balance / Sq. Ft.:
|
$132
|
|||||||
|
Balloon Balance / Sq. Ft.:
|
$110
|
|||||||
|
Cut-off Date LTV(9):
|
74.8%
|
|||||||
|
Balloon LTV(9):
|
62.5%
|
|||||||
|
Underwritten NOI DSCR:
|
1.50x
|
|||||||
|
Underwritten NCF DSCR:
|
1.42x
|
|||||||
|
Underwritten NOI Debt Yield:
|
10.2%
|
|||||||
|
Underwritten NCF Debt Yield:
|
9.6%
|
|||||||
|
TRANSACTION HIGHLIGHTS
|
|
■
|
Property Condition and Amenities. The Creekside Mixed Use Development mortgaged property is a recently renovated award winning public-private mixed use project made up of 97,361 square feet of office and retail space and 84 residential apartment units, totaling 94,225 square feet, and features a lagoon, a limestone waterwall, two fountains, a performance stage and a public plaza. Residential units feature stainless steel appliances, wooden cabinets and granite countertops, and project amenities include a heated rooftop pool and sundeck, fitness room and garage parking.
|
|
■
|
Recent Leasing and Occupancy. The commercial component of the Creekside Mixed Use Development property is currently 96.9% leased and the residential units are 100.0% leased. Over 2013 and 2014 twelve commercial tenants signed leases totaling 41,363 square feet and 43.4% of underwritten commercial base rent.
|
|
■
|
Market. The Creekside Mixed Use Development property is located in Gahanna, Ohio, approximately 8.0 miles east of Columbus, Ohio. According to a market research report, as of the second quarter 2013 the Whitehall / Gahanna multifamily submarket contained 20,063 units with a vacancy rate of 5.8%, down from the second quarter 2012 vacancy rate of 7.4%, and an asking rent of $665 per unit, up from the second quarter 2012 asking rent of $655 per unit.
|
The depositor has filed a registration statement (including the prospectus) with the SEC (SEC File No. 333-193376) for the offering to which this communication relates. Before you invest, you should read the prospectus in the registration statement and other documents the depositor has filed with the SEC for more complete information about the depositor, the issuing trust and this offering. You may get these documents for free by visiting EDGAR on the SEC website at www.sec.gov. Alternatively, the depositor or Deutsche Bank Securities Inc., any other underwriter, or any dealer participating in this offering will arrange to send you the prospectus if you request it by calling toll-free 1-800-503-4611 or by email to the following address: prospectus.cpdg@db.com. The offered certificates referred to in these materials, and the asset pool backing them, are subject to modification or revision (including the possibility that one or more classes of certificates may be split, combined or eliminated at any time prior to issuance or availability of a final prospectus) and are offered on a “when, as and if issued” basis. You understand that, when you are considering the purchase of these certificates, a contract of sale will come into being no sooner than the date on which the relevant class has been priced and we have verified the allocation of certificates to be made to you; any “indications of interest” expressed by you, and any “soft circles” generated by us, will not create binding contractual obligations for you or us.
110
|
6974 Schantz Road
Allentown, PA 18106
|
Collateral Asset Summary – Loan No. 16
Amcor Rigid Plastics
|
Cut-off Date Balance:
Cut-off Date LTV:
U/W NCF DSCR:
U/W NOI Debt Yield:
|
$24,039,352
65.0%
1.54x
10.4%
|
|
Mortgage Loan Information
|
Property Information
|
|||||
|
Loan Seller:
|
CCRE
|
Single Asset / Portfolio:
|
Single Asset
|
|||
|
Loan Purpose:
|
Acquisition
|
Property Type:
|
Industrial Warehouse/Distribution
|
|||
|
Sponsor:
|
Gramercy Property Trust Inc.
|
Collateral:
|
Fee Simple
|
|||
|
Borrower:
|
GPT Allentown Owner LP
|
Location:
|
Allentown, PA
|
|||
|
Original Balance:
|
$24,100,000
|
Year Built / Renovated:
|
1998 / NAP
|
|||
|
Cut-off Date Balance:
|
$24,039,352
|
Total Sq. Ft.:
|
480,000
|
|||
|
% by Initial UPB:
|
1.9%
|
Property Management:
|
GPT Realty Management LP
|
|||
|
Interest Rate:
|
5.0715%
|
Underwritten NOI:
|
$2,489,911
|
|||
|
Payment Date:
|
6th of each month
|
Underwritten NCF:
|
$2,417,911
|
|||
|
First Payment Date:
|
February 6, 2014
|
Appraised Value:
|
$37,000,000
|
|||
|
Maturity Date:
|
January 6, 2024
|
Appraisal Date:
|
December 17, 2013
|
|||
|
Amortization:
|
360 months
|
|||||
|
Additional Debt:
|
None
|
Historical NOI(5)
|
||||
|
Call Protection:
|
L(26), D(90), O(4)
|
Most Recent NOI:
|
NAP
|
|||
|
Lockbox / Cash Management:
|
Hard / In Place
|
2012 NOI:
|
NAP
|
|||
|
2011 NOI:
|
NAP
|
|||||
|
Reserves
|
Historical Occupancy(5)
|
|||||
|
Initial
|
Monthly
|
Most Recent Occupancy:
|
100.0% (March 6, 2014)
|
|||
|
Taxes(1):
|
$0
|
Springing
|
2012 Occupancy:
|
NAP
|
||
|
Insurance(1):
|
$0
|
Springing
|
2011 Occupancy:
|
NAP
|
||
|
Replacement(2):
|
$0
|
Springing
|
(1) Borrower will be required to deposit 1/12 of annual required taxes and insurance upon (i) an event of default, (ii) if Amcor fails to pay taxes or insurance directly, (iii) if the borrower fails to provide lender with evidence that taxes and insurance were paid, (iv) if the Amcor lease is no longer in full force and effect, (v) if the Amcor tenant is no longer obligated to pay taxes or maintain insurance on the property, (vi) upon the bankruptcy of property manager, borrower or guarantor or (vii) during a Lease Sweep Period (as defined below).
(2) Borrower will be required to deposit monthly replacement reserves of $6,000 upon the earlier of (i) an event of default, (ii) if either (a) Amcor is no longer obligated to pay for and perform all repairs identified in the property condition report pursuant to its lease or (b) the guarantor no longer guarantees completion of all repairs identified in the property condition report, (iii) the Amcor lease is no longer in full force and effect, (iv) the bankruptcy of property manager, borrower or guarantor or (v) a Lease Sweep Period (as defined below). In addition, if the borrower has failed to perform necessary required repairs, the lender may trap all excess cash and deposit such excess cash into the replacement reserve until 115.0% of the amount recommended by the engineer has been deposited. Notwithstanding the foregoing, the borrower may deliver a letter of credit in an amount equal to the estimated costs of replacements in lieu of monthly replacement deposits or the excess cash trap described above.
(3) All excess cash will be swept into the TI/LC reserve if the unsecured debt rating of Amcor Limited (as defined below) falls below BBB as rated by S&P (“Amcor Ratings Cash Trap Trigger”). The TI/LC Reserve will be capped at $16,000 per month for each month that has passed from December 31, 2013 plus $16,000 per month for each month that has passed since the commencement of the Amcor Ratings Cash Trap Trigger until the earlier of (i) (a) the unsecured debt rating for Amcor Limited is increased to BBB or better as rated by S&P for six consecutive months or (b) the Amcor tenant lease is replaced by one more replacement leases acceptable to lender and (ii) January 6, 2024. Notwithstanding the foregoing, to avoid commencement of this cash trap, the borrower may post a letter of credit equal to $16,000 per month for each month that has passed commencing on December 31, 2013 until the Amcor Ratings Cash Trap Trigger is cured.
(4) All excess cash will be swept during a Lease Sweep Period which will occur upon the first payment date following (i) receipt by borrower or property manager of notice that Amcor is exercising its termination option, (ii) the date the (A) Amcor lease is surrendered, canceled or terminated prior to its then current expiration date or (B) borrower receives written notice from Amcor of its intent to surrender, cancel or terminate its lease, (iii) a material non-monetary default or any monetary default, (iv) the date Amcor goes dark or (v) the occurrence of an insolvency proceeding related to Amcor; provided, however, the borrower may terminate a cash trap related to the Lease Sweep Period by posting a letter of credit in an amount equal to $3,000,000.
(5) A new lease was executed at the closing of the Amcor Rigid Plastics loan. See “Tenancy” below.
|
|||
|
TI/LC(3):
|
$0
|
Springing
|
||||
|
Lease Sweep Reserve(4):
|
$0
|
Springing
|
||||
|
Financial Information
|
||||||
|
Cut-off Date Balance / Sq. Ft.:
|
$50
|
|||||
|
Balloon Balance / Sq. Ft.:
|
$41
|
|||||
|
Cut-off Date LTV:
|
65.0%
|
|||||
|
Balloon LTV:
|
53.7%
|
|||||
|
Underwritten NOI DSCR:
|
1.59x
|
|||||
|
Underwritten NCF DSCR:
|
1.54x
|
|||||
|
Underwritten NOI Debt Yield:
|
10.4%
|
|||||
|
Underwritten NCF Debt Yield:
|
10.1%
|
|||||
|
TRANSACTION HIGHLIGHTS
|
|
▪
|
Sponsorship. Gramercy Property Trust Inc. (“GPT”) (NYSE: GPT) is a fully-integrated, self-managed commercial real estate investment company focused on acquiring and managing income-producing industrial and office properties net leased to high quality tenants in major markets throughout the United States. As of December 31, 2012, GPT owned directly or through joint ventures, a portfolio of 116 office and industrial buildings totaling 4.9 million sq. ft. In addition, GPT’s asset and property management business managed $1.7 billion of commercial properties leased primarily to regulated financial institutions across the United States.
|
|
▪
|
Tenancy. Amcor Rigid Plastics USA, Inc. (“Amcor”) is among the world’s largest manufacturers of plastic packaging for the beverage, food, spirits, personal and home care, and pharmaceutical industries with 60 facilities in 13 countries. Amcor Limited (ASX: AMC; rated NR/Baa2/BBB by Fitch/Moody’s/S&P) is a global leader in responsible packaging solutions, employing more than 35,000 people worldwide, operating in 43 countries across 300 sites. Amcor Limited supplies a broad range of plastic, fiber, metal, and glass packaging solutions and also provides packaging-related services. In conjunction with the sale-leaseback acquisition, Amcor executed a new 15-year triple net lease guaranteed by Amcor Limited. Amcor has invested approximately $140.0 million into the facility including facility upgrades and capital equipment since taking occupancy in 1998. The property is the east coast headquarters of Amcor and serves 26 production facilities nationwide.
|
|
▪
|
Location. The property is located in the I-81/I-78 Corridor industrial market that contains approximately 202.9 million sq. ft. of warehouse and distribution space across three submarkets supported by the regions’ distribution network, which connects Philadelphia, Pittsburgh and Northern New Jersey. As of 2Q 2013, the Lehigh Valley submarket within the I-81/I-78 Corridor had an overall vacancy of 6.9% and a weighted average net rent of $4.14. The appraiser concluded a market rent of $5.25 and the Amcor property lease has a current in-place rent of $5.20.
|
The depositor has filed a registration statement (including the prospectus) with the SEC (SEC File No. 333-193376) for the offering to which this communication relates. Before you invest, you should read the prospectus in the registration statement and other documents the depositor has filed with the SEC for more complete information about the depositor, the issuing trust and this offering. You may get these documents for free by visiting EDGAR on the SEC website at www.sec.gov. Alternatively, the depositor or Deutsche Bank Securities Inc., any other underwriter, or any dealer participating in this offering will arrange to send you the prospectus if you request it by calling toll-free 1-800-503-4611 or by email to the following address: prospectus.cpdg@db.com. The offered certificates referred to in these materials, and the asset pool backing them, are subject to modification or revision (including the possibility that one or more classes of certificates may be split, combined or eliminated at any time prior to issuance or availability of a final prospectus) and are offered on a “when, as and if issued” basis. You understand that, when you are considering the purchase of these certificates, a contract of sale will come into being no sooner than the date on which the relevant class has been priced and we have verified the allocation of certificates to be made to you; any “indications of interest” expressed by you, and any “soft circles” generated by us, will not create binding contractual obligations for you or us.
111
|
Lexington, KY
Antioch, TN
|
Collateral Asset Summary – Loan No. 17
LA Fitness Portfolio
|
Cut-off Date Balance:
Cut-off Date LTV:
U/W NCF DSCR:
U/W NOI Debt Yield:
|
$16,100,000
60.2%
1.59x
12.3%
|
|
Mortgage Loan Information
|
Property Information
|
|||||
|
Loan Seller:
|
KeyBank
|
Single Asset / Portfolio:
|
Portfolio of three properties
|
|||
|
Loan Purpose:
|
Acquisition
|
Property Type:
|
Single Tenant Retail
|
|||
|
Sponsor:
|
STORE Capital Corporation
|
Collateral:
|
Fee Simple
|
|||
|
Borrower:
|
STORE SPE LA Fitness 2013-7, LLC
|
Lexington, KY
|
||||
|
Original Balance:
|
$16,100,000
|
Location:
|
Antioch, TN
|
|||
|
Cut-off Date Balance:
|
$16,100,000
|
Year Built / Renovated:
|
2002-2005 / NAP
|
|||
|
% by Initial UPB:
|
1.3%
|
Total Sq. Ft.:
|
137,552
|
|||
|
Interest Rate:
|
4.8300%
|
Property Management:
|
Self-managed
|
|||
|
Payment Date:
|
5th of each month
|
Underwritten NOI:
|
$1,972,918
|
|||
|
First Payment Date:
|
April 5, 2014
|
Underwritten NCF:
|
$1,769,968
|
|||
|
Maturity Date:
|
March 5, 2021
|
Appraised Value:
|
$26,750,000
|
|||
|
Amortization:
|
300 months
|
Appraisal Date:
|
December 2013
|
|||
|
Additional Debt:
|
None
|
|||||
|
Call Protection(1):
|
L(24), D(57), O(3)
|
Historical NOI
|
||||
|
Lockbox / Cash Management(2):
|
Soft Springing Hard / In Place
|
Most Recent NOI:
|
NAV
|
|||
|
2012 NOI:
|
NAV
|
|||||
|
Reserves
|
2011 NOI:
|
NAV
|
||||
|
Initial
|
Monthly
|
2010 NOI:
|
NAV
|
|||
|
Taxes:
|
$36,698
|
$13,950
|
||||
|
Insurance(3):
|
$0
|
Springing
|
Historical Occupancy
|
|||
|
TI/LC(4):
|
$0
|
Springing
|
Current Occupancy:
|
100.0% (February 12, 2014)
|
||
|
2012 Occupancy:
|
100.0% (December 31, 2012)
|
|||||
|
Financial Information
|
2011 Occupancy:
|
NAV
|
||||
|
Cut-off Date Balance / Sq. Ft.:
|
$117
|
2010 Occupancy:
|
NAV
|
|||
|
Balloon Balance / Sq. Ft.:
|
$98
|
(1) The loan documents permit the borrower to obtain a release of a property from the lien of the related mortgage after the lockout period, provided, among other things, (i) no event of default has occurred and is continuing, (ii) delivery of the defeasance collateral in an amount equal to the greater of 125.0% of the allocated loan amount or 80.0% of the proceeds from the sale of the applicable property, (iii) the DSCR after release based upon the trailing 12 month period is equal to the greater of (a) the DSCR prior to release and (b) 1.57x, and (iv) the LTV ratio after release is equal to the lesser of (a) the LTV ratio prior to release and (b) 60.2%.
(2) A cash sweep will be triggered (i) during the continuance of a monetary event of default (ii) the occurrence of a material non-monetary event of default (and the passage of 45 days following lender’s notice), (iii) the DSCR based on the trailing three month period is less than 1.30x, (iv) any bankruptcy action of borrower or manager, or (v) any bankruptcy action of or any monetary default or other material default by LA Fitness.
(3) Insurance escrows will be suspended provided, among other things, that: (i) no event of default exists, (ii) LA Fitness is required per the applicable lease to pay insurance expenses directly and provides evidence of payment (iii) the applicable LA Fitness lease is in full force/effect.
(4) In the event any tenant goes dark, vacates, or abandons the property, the borrower will be required to deposit $2.00 times the total rentable square footage covered by the vacated lease.
|
||||
|
Cut-off Date LTV:
|
60.2%
|
|||||
|
Balloon LTV:
|
50.2%
|
|||||
|
Underwritten NOI DSCR:
|
1.78x
|
|||||
|
Underwritten NCF DSCR:
|
1.59x
|
|||||
|
Underwritten NOI Debt Yield:
|
12.3%
|
|||||
|
Underwritten NCF Debt Yield:
|
11.0%
|
|||||
|
TRANSACTION HIGHLIGHTS
|
|
▪
|
Sponsorship. STORE Capital Corporation (“STORE”) is a private REIT formed in May 2011 to invest in NNN leased single tenant properties. As of 09/30/2013, STORE owned 545 properties throughout the United States with an aggregate investment of approximately $1.427 billion.
|
|
▪
|
New Cash Equity. STORE contributed approximately $10.3 million in cash equity to acquire the property for approximately $26.4 million.
|
|
▪
|
Tenancy. The LA Fitness Portfolio is 100.0% leased to Fitness Sports Clubs, LLC (“LA Fitness”), under three separate NNN leases expiring between December 2022 and December 2025, with each lease allowing for one 10-year renewal option. The leases are guaranteed by the parent company, Fitness International, LLC. LA Fitness is a privately-held fitness club chain based out of Irvine, California and as of January 2014 had 615 locations in North America. According to International Health, Racquet & Sportsclub Association, LA Fitness had year-end 2012 revenues of approximately $1.7 billion. The LA Fitness Portfolio properties were part of LA Fitness’ October 2012 acquisition of 36 Urban Active clubs in Ohio, Kentucky, Tennessee, Georgia, Nebraska, North Carolina and Pennsylvania. Urban Active was previously headquartered in Lexington, Kentucky.
|
|
▪
|
Amenities. All properties in the LA Fitness Portfolio feature strength and cardio equipment, racquetball courts, childcare, saunas, group fitness rooms and personal training. Additional amenities offered within the portfolio include juice bars, swimming pools, running tracks, a cinema-cardio room and a basketball court.
|
The depositor has filed a registration statement (including the prospectus) with the SEC (SEC File No. 333-193376) for the offering to which this communication relates. Before you invest, you should read the prospectus in the registration statement and other documents the depositor has filed with the SEC for more complete information about the depositor, the issuing trust and this offering. You may get these documents for free by visiting EDGAR on the SEC website at www.sec.gov. Alternatively, the depositor or Deutsche Bank Securities Inc., any other underwriter, or any dealer participating in this offering will arrange to send you the prospectus if you request it by calling toll-free 1-800-503-4611 or by email to the following address: prospectus.cpdg@db.com. The offered certificates referred to in these materials, and the asset pool backing them, are subject to modification or revision (including the possibility that one or more classes of certificates may be split, combined or eliminated at any time prior to issuance or availability of a final prospectus) and are offered on a “when, as and if issued” basis. You understand that, when you are considering the purchase of these certificates, a contract of sale will come into being no sooner than the date on which the relevant class has been priced and we have verified the allocation of certificates to be made to you; any “indications of interest” expressed by you, and any “soft circles” generated by us, will not create binding contractual obligations for you or us.
112
|
Chicago, IL
|
Collateral Asset Summary – Loan No. 18
Sherman Multifamily Portfolio
|
Cut-off Date Balance:
Cut-off Date LTV:
U/W NCF DSCR:
U/W NOI Debt Yield:
|
$15,500,000
74.3%
1.23x
8.2%
|
|
Mortgage Loan Information
|
Property Information
|
||||||
|
Loan Seller:
|
UBSRES
|
Single Asset / Portfolio:
|
Portfolio of three properties
|
||||
|
Loan Purpose:
|
Refinance
|
Property Type:
|
Mid-Rise Multifamily
|
||||
|
Sponsor:
|
Lyrical-Antheus Realty Partners II, L.P.
|
Collateral:
|
Fee Simple
|
||||
|
Borrower:
|
5326-5336 S. Greenwood Holdings,
|
Location:
|
Chicago, IL
|
||||
|
LLC, 4850 S. Drexel Holdings, LLC,
|
Year Built / Renovated:
|
Various
|
|||||
|
5416 S. Woodlawn Holdings, LLC
|
Total Units:
|
120
|
|||||
|
Original Balance:
|
$15,500,000
|
Property Management:
|
Mac Property Management, L.L.C.
|
||||
|
Cut-off Date Balance:
|
$15,500,000
|
Underwritten NOI:
|
$1,269,395
|
||||
|
% by Initial UPB:
|
1.3%
|
Underwritten NCF:
|
$1,244,669
|
||||
|
Interest Rate:
|
5.1110%
|
Appraised Value:
|
$20,850,000
|
||||
|
Payment Date:
|
6th of each month
|
Appraisal Date:
|
October 21, 2013
|
||||
|
First Payment Date:
|
February 6, 2014
|
||||||
|
Maturity Date:
|
January 6, 2024
|
Historical NOI
|
|||||
|
Interest only for first 36 months; 360
|
Most Recent NOI:
|
$1,097,996 (T-12 October 31, 2013)
|
|||||
|
Amortization:
|
months thereafter
|
2012 NOI
|
$1,175,045 (December 31, 2012)
|
||||
|
Additional Debt:
|
None
|
2011 NOI:
|
$1,109,628 (December 31, 2011)
|
||||
|
Call Protection(1):
|
L(26), D(93), O(1)
|
2010 NOI:
|
$986,845 (December 31, 2010)
|
||||
|
Lockbox / Cash Management(2):
|
Springing Soft / Springing
|
||||||
|
Historical Occupancy
|
|||||||
|
Reserves
|
Most Recent Occupancy:
|
93.3% (November 20, 2013)
|
|||||
|
Initial
|
Monthly
|
2012 Occupancy(4):
|
96.9% (December 31, 2012)
|
||||
|
Taxes:
|
$53,380
|
$7,024
|
2011 Occupancy(4):
|
83.0% (December 31, 2011)
|
|||
|
Insurance:
|
$23,784
|
$2,244
|
2010 Occupancy(4):
|
93.7% (December 31, 2010)
|
|||
|
Replacement:
|
$0
|
$2,061
|
(1) On any date after the lockout period ends, the borrowers may obtain the release of an individual property provided, among other conditions as specified in the loan documents, (i) the borrowers defease an amount of principal equal to the release price for such property, (ii) the debt service coverage ratio for the remaining properties is equal to or greater than the greater of 1.24x or the debt service coverage ratio for all properties immediately prior to the release, and (iii) the LTV for the remaining properties does not exceed the lesser of 74.3%and the LTV for all properties immediately prior to the release.
(2) A soft lockbox with cash management will be triggered (i) during the continuance of an event of default and (ii) by any bankruptcy action of borrower, guarantor, or manager.
(3) Based on a 30-year amortization schedule. Based on the current interest only payments, the Underwritten NOI DSCR and Underwritten NCF DSCR are 1.58x and 1.55x, respectively.
(4) 2012, 2011, and 2010 Occupancy figures reflect two out of the three properties. The omitted property underwent extensive renovations totaling $5.5 million ($130,423 per unit) which were completed in 2013.
|
||||
|
Required Repairs:
|
$5,625
|
NAP
|
|||||
|
Financial Information
|
|||||||
|
Cut-off Date Balance / Unit:
|
$129,167
|
||||||
|
Balloon Balance / Unit:
|
$114,596
|
||||||
|
Cut-off Date LTV:
|
74.3%
|
||||||
|
Balloon LTV:
|
66.0%
|
||||||
|
Underwritten NOI DSCR(3):
|
1.26x
|
||||||
|
Underwritten NCF DSCR(3):
|
1.23x
|
||||||
|
Underwritten NOI Debt Yield:
|
8.2%
|
||||||
|
Underwritten NCF Debt Yield:
|
8.0%
|
||||||
|
TRANSACTION HIGHLIGHTS
|
|
▪
|
Sponsorship. The sponsor of the borrower is Lyrical-Antheus Realty Partners II, L.P. (“LARP II”), a fund raised by Antheus Capital, LLC (“Antheus”). Antheus was formed in 2002 to acquire, redevelop and develop multifamily and commercial real estate and currently owns a portfolio consisting of 6,500 apartments and 200,000 square feet of commercial space in Chicago, Illinois and Kansas City, Missouri. The Sherman Multifamily Portfolio mortgaged properties are located in Hyde Park, Chicago. LARP II and affiliates own 4,481 multifamily units making up 31.0% of the Hyde Park multifamily market. According to financial statements dated December 31, 2012, LARP II reported total assets of $301.4 million and liquidity of $3.0 million.
|
|
▪
|
Market. According to a market research report, the Sherman Multifamily Portfolio mortgaged properties are located in the South Shore submarket. As of Q3 2013, the overall vacancy rate was 4.5%, which represented a decrease of 10 basis points over the previous quarter’s rate of 4.6%, and a decrease of 20 basis points from the year-over-year comparison of 4.7%. The average asking rate for the submarket in Q3 2013 was $1,003 per unit, which represented a $2 per unit increase over the previous quarter’s rate of $1,001 per unit and a $14 per unit or 1.4% year-over-year increase.
|
|
▪
|
Location. The Sherman Multifamily Portfolio mortgaged properties are located within 1.0 mile of each other in the Hyde Park area of Chicago, Illinois, home to the University of Chicago and approximately 6.0 miles south of the central business district of Chicago. The University of Chicago is composed of more than 2,200 full-time and 500 part-time academic staff, 7,891 non-faculty staff, 5,369 undergraduate students and about 10,000 graduate students.
|
The depositor has filed a registration statement (including the prospectus) with the SEC (SEC File No. 333-193376) for the offering to which this communication relates. Before you invest, you should read the prospectus in the registration statement and other documents the depositor has filed with the SEC for more complete information about the depositor, the issuing trust and this offering. You may get these documents for free by visiting EDGAR on the SEC website at www.sec.gov. Alternatively, the depositor or Deutsche Bank Securities Inc., any other underwriter, or any dealer participating in this offering will arrange to send you the prospectus if you request it by calling toll-free 1-800-503-4611 or by email to the following address: prospectus.cpdg@db.com. The offered certificates referred to in these materials, and the asset pool backing them, are subject to modification or revision (including the possibility that one or more classes of certificates may be split, combined or eliminated at any time prior to issuance or availability of a final prospectus) and are offered on a “when, as and if issued” basis. You understand that, when you are considering the purchase of these certificates, a contract of sale will come into being no sooner than the date on which the relevant class has been priced and we have verified the allocation of certificates to be made to you; any “indications of interest” expressed by you, and any “soft circles” generated by us, will not create binding contractual obligations for you or us.
113
|
5300 West Sam Houston Parkway North
Houston, TX 77041
|
Collateral Asset Summary – Loan No. 19
Beltway 8 Corporate Centre I
|
Cut-off Date Balance:
Cut-off Date LTV:
U/W NCF DSCR:
U/W NOI Debt Yield:
|
$15,300,000
70.7%
1.44x
10.4%
|
|
Mortgage Loan Information
|
Property Information
|
|||||
|
Loan Seller:
|
GACC
|
Single Asset / Portfolio:
|
Single Asset
|
|||
|
Loan Purpose:
|
Acquisition
|
Property Type:
|
Suburban Office
|
|||
|
Sponsor(1):
|
Gulf United Investments Corporation
|
Collateral:
|
Fee Simple
|
|||
|
Borrower:
|
5300 BW8, Ltd.
|
Location:
|
Houston, TX
|
|||
|
Original Balance:
|
$15,300,000
|
Year Built / Renovated:
|
2002 / NAP
|
|||
|
Cut-off Date Balance:
|
$15,300,000
|
Total Sq. Ft.:
|
100,719
|
|||
|
% by Initial UPB:
|
1.2%
|
Property Management:
|
Tanglewood Property Management
|
|||
|
Interest Rate:
|
5.0000%
|
Company L.L.C.
|
||||
|
Payment Date:
|
6th of each month
|
Underwritten NOI:
|
$1,596,843
|
|||
|
First Payment Date:
|
March 6, 2014
|
Underwritten NCF:
|
$1,414,990
|
|||
|
Maturity Date:
|
February 6, 2024
|
Appraised Value:
|
$21,650,000
|
|||
|
Amortization:
|
Interest only for the first 36 months;
|
Appraisal Date:
|
January 1, 2014
|
|||
|
360 months thereafter
|
||||||
|
Additional Debt:
|
None
|
Historical NOI(7)
|
||||
|
Call Protection:
|
L(25), D(91), O(4)
|
Most Recent NOI:
|
$1,826,606 (T-12 September 30, 2013)
|
|||
|
Lockbox / Cash Management(2):
|
Hard / Springing
|
2012 NOI:
|
NAV
|
|||
|
2011 NOI:
|
NAV
|
|||||
|
Reserves
|
2010 NOI:
|
NAV
|
||||
|
Initial
|
Monthly
|
|||||
|
Taxes:
|
$38,218
|
$28,102
|
Historical Occupancy(7)
|
|||
|
Insurance:
|
$12,014
|
$6,007
|
Current Occupancy(8):
|
100.0% (January 1, 2014)
|
||
|
Replacement:
|
$0
|
$2,854
|
2012 Occupancy:
|
NAV
|
||
|
TI/LC(3):
|
$0
|
$10,492
|
2011 Occupancy:
|
NAV
|
||
|
Cameron Holdback(4):
|
$516,210
|
$0
|
2010 Occupancy:
|
NAV
|
||
|
Lease Sweep(5):
|
$0
|
Springing
|
(1) Gulf United Investments Corporation is an entity under common control with the borrower, and does not have a direct or indirect interest in the borrower.
(2) Cash management will be triggered (i) during the occurrence of an event of default, (ii) if the DSCR is less than 1.20x on the last day of any calendar quarter, until the DSCR is at least 1.20x for two consecutive calendar quarters or (iii) during a Lease Sweep Period. A “Lease Sweep Period” will commence upon the first to occur of (i) Cameron International Corporation, SAVA Senior Care or any replacement tenant (“each a Lease Sweep Tenant”) (a) terminates its lease, (b) gives notice to terminate its lease, (c) goes dark, (d) defaults under its lease or (e) is party to an insolvency proceeding, (ii) 12 months prior to the expiration of a Lease Sweep Tenant lease, or (iii) the date a Lease Sweep Tenant is required to renew its lease and such lease is not renewed, provided a Lease Sweep Period will terminate if the borrower delivers cash or a letter of credit in the amount of $20.00 PSF based on the Lease Sweep Tenant space.
(3) The TI/LC reserve is subject to a cap of $500,000.
(4) The Cameron Holdback represents the remaining portion of the Cameron International Corporation TI allowance and will be released to the borrower upon satisfaction of certain conditions as set forth in the Cameron lease.
(5) All excess cash will be deposited into the lease sweep reserve during a Lease Sweep Period.
(6) Based on amortizing debt service payments. Based on the current interest only payments, the Underwritten NOI DSCR and Underwritten NCF DSCR are 2.06x and 1.82x, respectively.
(7) As this is an acquisition loan, Historical NOI and Occupancy were not provided.
(8) Cameron International Corporation began its lease term in September 2013 and is anticipated to take occupancy in March 2014.
|
|||
|
Financial Information
|
||||||
|
Cut-off Date Balance / Sq. Ft.:
|
$152
|
|||||
|
Balloon Balance / Sq. Ft.:
|
$134
|
|||||
|
Cut-off Date LTV:
|
70.7%
|
|||||
|
Balloon LTV:
|
62.5%
|
|||||
|
Underwritten NOI DSCR(6):
|
1.62x
|
|||||
|
Underwritten NCF DSCR(6):
|
1.44x
|
|||||
|
Underwritten NOI Debt Yield:
|
10.4%
|
|||||
|
Underwritten NCF Debt Yield:
|
9.2%
|
|||||
|
TRANSACTION HIGHLIGHTS
|
|
§
|
Tenancy. Beltway 8 Corporate Centre I is a 100,719 sq. ft. Class A suburban office building located approximately 13 miles northwest of the Houston central business district. The property is currently 100.0% leased to two tenants, Cameron International Corporation (“Cameron”) and SAVA Senior Care (“SAVA”). Cameron (51.3% of NRA; February 2021 lease expiration)(NYSE: CAM), rated Baa1/BBB+ by Moody’s/S&P, is headquartered in Houston, Texas and is a manufacturer, provider, and servicer of oil and gas equipment worldwide. Cameron is estimated to take occupancy on March 1, 2014 and began paying full unabated rent in January 2014. SAVA (48.7% of NRA; April 2018 lease expiration) is one of the largest providers of short-term and long-term health care services in the United States.
|
|
§
|
Location. The property is located in the Northwest submarket of Houston, Texas. The 2013 population within a 3-mile radius of the property was 65,693 with estimated average household income of $80,977. The 2013 Houston unemployment rate was 6.2%, down from the 2010 rate of 8.5%. The property is located within the Beltway 8 Commerce Centre, a 120-acre master-planned business park that consists of over 600,000 square feet of existing office developments. The business park was planned with strict protective covenants and development guidelines. The appraiser concluded market rent for the property of $19.00 PSF is equal to Cameron’s current rental rate and is higher than SAVA’s current rental rate of $15.66 PSF.
|
The depositor has filed a registration statement (including the prospectus) with the SEC (SEC File No. 333-193376) for the offering to which this communication relates. Before you invest, you should read the prospectus in the registration statement and other documents the depositor has filed with the SEC for more complete information about the depositor, the issuing trust and this offering. You may get these documents for free by visiting EDGAR on the SEC website at www.sec.gov. Alternatively, the depositor or Deutsche Bank Securities Inc., any other underwriter, or any dealer participating in this offering will arrange to send you the prospectus if you request it by calling toll-free 1-800-503-4611 or by email to the following address: prospectus.cpdg@db.com. The offered certificates referred to in these materials, and the asset pool backing them, are subject to modification or revision (including the possibility that one or more classes of certificates may be split, combined or eliminated at any time prior to issuance or availability of a final prospectus) and are offered on a “when, as and if issued” basis. You understand that, when you are considering the purchase of these certificates, a contract of sale will come into being no sooner than the date on which the relevant class has been priced and we have verified the allocation of certificates to be made to you; any “indications of interest” expressed by you, and any “soft circles” generated by us, will not create binding contractual obligations for you or us.
114
|
8700 South Price Road
Tempe, AZ 85284
|
Collateral Asset Summary – Loan No. 20
Avnet Building
|
Cut-off Date Balance:
Cut-off Date LTV:
U/W NCF DSCR:
U/W NOI Debt Yield:
|
$14,800,000
65.5%
1.52x
10.5%
|
|
Mortgage Loan Information
|
Property Information
|
|||||
|
Loan Seller:
|
UBSRES
|
Single Asset / Portfolio:
|
Single Asset
|
|||
|
Loan Purpose:
|
Acquisition
|
Property Type:
|
Suburban Office
|
|||
|
Sponsor(1):
|
Corporate Property Associates 17-
|
Collateral:
|
Leasehold
|
|||
|
Global Incorporated
|
Location:
|
Tempe, AZ
|
||||
|
Borrower:
|
AVASU (AZ) LLC
|
Year Built / Renovated:
|
2000 / NAP
|
|||
|
Original Balance:
|
$14,800,000
|
Total Sq. Ft.:
|
132,070
|
|||
|
Cut-off Date Balance:
|
$14,800,000
|
Property Management:
|
Self-managed
|
|||
|
% by Initial UPB:
|
1.2%
|
Underwritten NOI:
|
$1,556,753
|
|||
|
Interest Rate:
|
5.1345%
|
Underwritten NCF:
|
$1,471,419
|
|||
|
Payment Date:
|
6th of each month
|
Appraised Value:
|
$22,600,000
|
|||
|
First Payment Date:
|
February 6, 2014
|
Appraisal Date:
|
December 13, 2013
|
|||
|
Maturity Date:
|
January 6, 2024
|
|||||
|
Amortization:
|
Interest only for the first 36 months; 360
|
Historical NOI
|
||||
|
months thereafter
|
2012 NOI:
|
$1,528,661 (December 31, 2012)
|
||||
|
Additional Debt:
|
None
|
2011 NOI:
|
$1,537,424 (December 31, 2011)
|
|||
|
Call Protection:
|
L(26), D(87), O(7)
|
2010 NOI:
|
$872,786 (December 31, 2010)
|
|||
|
Lockbox / Cash Management(2):
|
Springing Hard / Springing
|
|||||
|
Historical Occupancy
|
||||||
|
Reserves
|
Most Recent Occupancy:
|
100.0% (March 6, 2014)
|
||||
|
Initial
|
Monthly
|
2012 Occupancy:
|
100.0% (December 31, 2012)
|
|||
|
Taxes(3):
|
$0
|
Springing
|
2011 Occupancy:
|
100.0% (December 31, 2011)
|
||
|
Insurance(3):
|
$0
|
Springing
|
2010 Occupancy:
|
100.0% (December 31, 2010)
|
||
|
Replacement(3):
|
$0
|
Springing
|
(1) The sponsor is also the sponsor under the mortgage loan identified on Annex A-1 as 500 Jefferson, which has a Cut-off Date Balance of $31.2 million.
(2) A hard lockbox with cash management will be triggered upon (i) an event of default, (ii) an event which results in the borrower no longer being controlled by the guarantor or an affiliate of the guarantor, (iii) a Lease Sweep Event (defined in the loan documents), or (iv) a Springing Reserve Event, which will occur upon (i) a monetary or material non-monetary event of default, (ii) a monetary or material non-monetary event of default by Avnet, Inc. or a replacement tenant under its lease, (iii) a surrender, cancellation, or termination of the Avnet, Inc. or replacement tenant lease before its then current expiration date, (iv) any bankruptcy action of Avnet, Inc. or a replacement tenant, or (v) the debt service coverage ratio falling below 1.30x.
(3) Upon the occurrence and continuation of Springing Reserve Event, on a monthly basis the borrower will be required to deposit (a) 1/12 of the estimated annual real estate taxes into a tax reserve account, (b) 1/12 of the estimated annual insurance premiums into an insurance reserve account, (c) $1,651 into a replacement reserve account, (d) $5,460 into a TI/LC reserve account, and (e) an amount equal to the next succeeding monthly ground rent payment into a ground rent reserve account.
(4) The borrower deposited $1,862,187 to cover rent abatements and free rent attributable to Avnet, Inc.
(5) Based on amortizing debt service payments. Based on the current interest only payments Underwritten NOI DSCR and Underwritten NCF DSCR are 2.02x and 1.91x, respectively.
|
|||
|
TI/LC(3):
|
$2,641,400
|
Springing
|
||||
|
Ground Rent Funds(3):
|
$0
|
Springing
|
||||
|
Free Rent Funds(4):
|
$1,862,187
|
$0
|
||||
|
Financial Information
|
||||||
|
Cut-off Date Balance / Sq. Ft.:
|
$112
|
|||||
|
Balloon Balance / Sq. Ft.:
|
$99
|
|||||
|
Cut-off Date LTV:
|
65.5%
|
|||||
|
Balloon LTV:
|
58.1%
|
|||||
|
Underwritten NOI DSCR(5):
|
1.61x
|
|||||
|
Underwritten NCF DSCR(5):
|
1.52x
|
|||||
|
Underwritten NOI Debt Yield:
|
10.5%
|
|||||
|
Underwritten NCF Debt Yield:
|
9.9%
|
|||||
|
TRANSACTION HIGHLIGHTS
|
|
§
|
Tenancy. The Avnet Building property is 100.0% occupied by Avnet, Inc. (NYSE: AVT, rated BBB-/Baa3/BBB- by Fitch/Moody’s/S&P). In addition to its core distribution services of electronic components, computer products and embedded technology, Avnet, Inc. provides service capabilities such as supply-chain and design-chain services, logistics solutions, product assembly, device programming, computer system configuration and integration, and technical seminars. The Avnet Building property was build-to-suit for Avnet, Inc., who has been in occupancy for over fourteen years. Avnet, Inc. extended its lease expiration out to 128 months in 2013. For the fiscal year ending June 29, 2013, Avnet, Inc. reported net income of $450.1 million on revenue of $25.5 billion. Avnet, Inc. held $10.5 billion in total assets, including approximately $1.0 billion in cash and equivalents, and its shareholders’ equity was $4.3 billion.
|
|
§
|
Sponsorship. Corporate Property Associates 17-Global Incorporated is an affiliate of W.P. Carey Inc. (NYSE: WPC), which is a publicly traded real estate investment trust founded in 1973 that provides long-term sale-leaseback and build-to-suit leasing for companies worldwide. Per its 2012 annual report, W.P. Carey Inc. reported EBITDA of $170.6 million and net income of $62.1 million. As of the second quarter 2013, W.P. Carey Inc.’s holdings totaled 423 properties containing 39.5 million square feet with an occupancy of 98.9% and a weighted average remaining lease term of 8.8 years.
|
|
§
|
Location. The Avnet Building is located in the Arizona State University Research Park, which is a 320-acre mixed-use master-planned business park situated along the west side of the Loop 101 freeway in Tempe, Arizona, approximately 17.0 miles southeast of the Phoenix, Arizona central business district. The park features more than 20 buildings, totaling approximately two million square feet. The Arizona State University Research Park is home to approximately 50 companies employing over 4,000 people, including US Foods, Go Daddy, General Motors, Intel, eBay/PayPal, Orbital Sciences, Bank of America, Wells Fargo, Chandler Regional Medical Center, Verizon Wireless, Iridium, Isagenix, Honeywell, Global Crossing, AT&T Corporation, and Alaska Airlines.
|
The depositor has filed a registration statement (including the prospectus) with the SEC (SEC File No. 333-193376) for the offering to which this communication relates. Before you invest, you should read the prospectus in the registration statement and other documents the depositor has filed with the SEC for more complete information about the depositor, the issuing trust and this offering. You may get these documents for free by visiting EDGAR on the SEC website at www.sec.gov. Alternatively, the depositor or Deutsche Bank Securities Inc., any other underwriter, or any dealer participating in this offering will arrange to send you the prospectus if you request it by calling toll-free 1-800-503-4611 or by email to the following address: prospectus.cpdg@db.com. The offered certificates referred to in these materials, and the asset pool backing them, are subject to modification or revision (including the possibility that one or more classes of certificates may be split, combined or eliminated at any time prior to issuance or availability of a final prospectus) and are offered on a “when, as and if issued” basis. You understand that, when you are considering the purchase of these certificates, a contract of sale will come into being no sooner than the date on which the relevant class has been priced and we have verified the allocation of certificates to be made to you; any “indications of interest” expressed by you, and any “soft circles” generated by us, will not create binding contractual obligations for you or us.
115
STATEMENT REGARDING ASSUMPTIONS AS TO
SECURITIES, PRICING ESTIMATES AND OTHER INFORMATION
This material is for your information, and none of Deutsche Bank Securities Inc., UBS Securities LLC, Cantor Fitzgerald & Co., KeyBanc Capital Markets Inc. and Drexel Hamilton, LLC (the “Underwriters”) are soliciting any action based upon it. This material is not to be construed as an offer to sell or the solicitation of any offer to buy any security in any jurisdiction where such an offer or solicitation would be illegal.
Neither this document nor anything contained herein shall form the basis for any contract or commitment whatsoever. The information contained herein is preliminary as of the date hereof. These materials are subject to change, completion or amendment from time to time. The information contained herein will be superseded by similar information delivered to you as part of the offering document relating to the Commercial Mortgage Pass-Through Certificates, Series COMM 2014-UBS2 (the “Offering Document”). The Information supersedes any such information previously delivered. The Information should be reviewed only in conjunction with the entire Offering Document. All of the information contained herein is subject to the same limitations and qualifications contained in the Offering Document. The information contained herein does not contain all relevant information relating to the underlying mortgage loans or mortgaged properties. Such information is described elsewhere in the Offering Document. The information contained herein will be more fully described elsewhere in the Offering Document. The information contained herein should not be viewed as projections, forecasts, predictions or opinions with respect to value. Prior to making any investment decision, prospective investors are strongly urged to read the Offering Document its entirety. Neither the Securities and Exchange Commission nor any state securities commission has approved or disapproved of these securities or determined if this free writing prospectus is truthful or complete. Any representation to the contrary is a criminal offense.
The attached information contains certain tables and other statistical analyses (the “Computational Materials”) which have been prepared in reliance upon information furnished by the Mortgage Loan Sellers. Numerous assumptions were used in preparing the Computational Materials, which may or may not be reflected herein. As such, no assurance can be given as to the Computational Materials’ accuracy, appropriateness or completeness in any particular context; or as to whether the Computational Materials and/or the assumptions upon which they are based reflect present market conditions or future market performance. The Computational Materials should not be construed as either projections or predictions or as legal, tax, financial or accounting advice. You should consult your own counsel, accountant and other advisors as to the legal, tax, business, financial and related aspects of a purchase of these securities. Any weighted average lives, yields and principal payment periods shown in the Computational Materials are based on prepayment and/or loss assumptions, and changes in such prepayment and/or loss assumptions may dramatically affect such weighted average lives, yields and principal payment periods. In addition, it is possible that prepayments or losses on the underlying assets will occur at rates higher or lower than the rates shown in the attached Computational Materials. The specific characteristics of the securities may differ from those shown in the Computational Materials due to differences between the final underlying assets and the preliminary underlying assets used in preparing the Computational Materials. The principal amount and designation of any security described in the Computational Materials are subject to change prior to issuance. None of Underwriters or any of their respective affiliates makes any representation or warranty as to the actual rate or timing of payments or losses on any of the underlying assets or the payments or yield on the securities.
This document contains forward-looking statements. Those statements are subject to certain risks and uncertainties that could cause the success of collections and the actual cash flow generated to differ materially from the information set forth herein. While such information reflects projections prepared in good faith based upon methods and data that are believed to be reasonable and accurate as of the dates thereof, the issuer undertakes no obligation to revise these forward-looking statements to reflect subsequent events or circumstances. Individuals should not place undue reliance on forward-looking statements and are advised to make their own independent analysis and determination with respect to the forecasted periods, which reflect the issuer’s view only as of the date hereof.
IRS CIRCULAR 230 NOTICE: THIS TERM SHEET IS NOT INTENDED OR WRITTEN TO BE USED, AND CANNOT BE USED, FOR THE PURPOSE OF AVOIDING U.S. FEDERAL, STATE OR LOCAL TAX PENALTIES. THIS TERM SHEET IS WRITTEN AND PROVIDED IN CONNECTION WITH THE PROMOTION OR MARKETING BY THE DEPOSITOR AND THE UNDERWRITERS OF THE TRANSACTION OR MATTERS ADDRESSED HEREIN. INVESTORS SHOULD SEEK ADVICE BASED ON THEIR PARTICULAR CIRCUMSTANCES FROM AN INDEPENDENT TAX ADVISOR.
|
IMPORTANT NOTICE RELATING TO AUTOMATICALLY GENERATED EMAIL DISCLAIMERS
|
Any legends, disclaimers or other notices that may appear at the bottom of the email communication to which this free writing prospectus is attached relating to (1) these materials not constituting an offer (or a solicitation of an offer), (2) no representation being made that these materials are accurate or complete and may not be updated or (3) these materials possibly being confidential, are not applicable to these materials and should be disregarded. Such legends, disclaimers or other notices have been automatically generated as a result of these materials having been sent via Bloomberg or another system.