UNITED STATES
SECURITIES AND EXCHANGE COMMISSION
Washington, D.C. 20549
FORM 6-K
REPORT OF FOREIGN ISSUER
PURSUANT TO RULE 13a-16 OR 15b-16 OF
THE SECURITIES EXCHANGE ACT OF 1934
PURSUANT TO RULE 13a-16 OR 15b-16 OF
THE SECURITIES EXCHANGE ACT OF 1934
For the month of February 2019
Commission File Number 001-14370
COMPANIA DE MINAS BUENAVENTURA S.A.A.
(Exact name of registrant as specified in its charter)
BUENAVENTURA MINING COMPANY INC.
(Translation of registrant’s name into English)
(Translation of registrant’s name into English)
Republic of Peru
(Jurisdiction of incorporation or organization)
(Jurisdiction of incorporation or organization)
CARLOS VILLARAN 790
SANTA CATALINA, LIMA 13, PERU
(Address of principal executive offices)
SANTA CATALINA, LIMA 13, PERU
(Address of principal executive offices)
Indicate by check mark whether the registrant files or will file annual reports under cover Form 20-F or Form 40-F.
Form 20-F ____X___ Form 40-F _______
Indicate by check mark if the registrant is submitting the Form 6-K in paper as permitted by Regulation S-T Rule 101(b)(1): [ ]
Indicate by check mark if the registrant is submitting the Form 6-K in paper as permitted by Regulation S-T Rule 101(b)(7): [ ]
Indicate by check mark if the registrant is submitting the Form 6-K in paper as permitted by Regulation S-T Rule 101(b)(7): [ ]
Indicate by check mark whether the registrant by furnishing the information contained in this Form is also thereby furnishing the information to
the Commission pursuant to Rule 12g3-2(b) under the Securities Exchange Act of 1934.
Yes _______ No ___X____
If “Yes” is marked, indicate below the file number assigned to the registrant in connection with Rule 12g3-2(b): Not applicable.
Buenaventura Announces Fourth Quarter
and Full Year 2018 Results
Lima, Peru, February 21, 2019 – Compañia de Minas Buenaventura S.A.A. (“Buenaventura” or “the Company”) (NYSE: BVN; Lima Stock Exchange: BUE.LM), Peru’s largest publicly-traded precious metals mining company, today announced results for the fourth
quarter (4Q18) and twelve-month (FY18) period ended December 31, 2018. All figures have been prepared in accordance with IFRS (International Financial Reporting Standards) on a non-GAAP basis and are stated in U.S. dollars (US$).
Fourth Quarter 2018 Highlights:
|
●
|
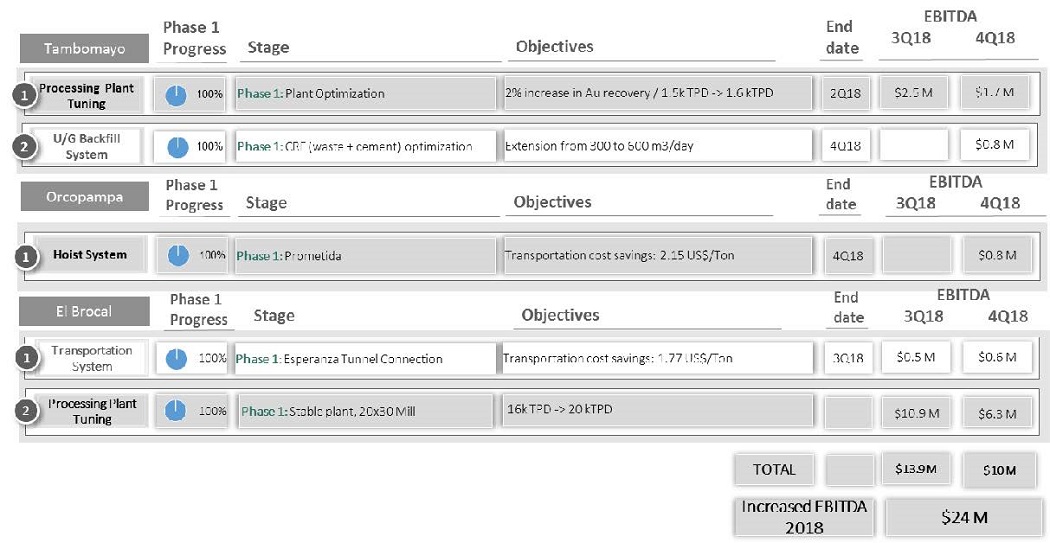
As, a key initiative, the company is implementing its De-Bottlenecking Program (2018-2020) to increase
profitability and strengthen its long term business case. As part of this strategy, Buenaventura has centralized operations, re-focused mining plans on the highest-margin areas and optimized processing facilities. As a consequence, guidance adjustments were made for certain operations. EBITDA generated during 2018 from this program reached US$24 million and during the next
conference call we will explain in more detail the program for 2019 (Please see page 8 for related details).
|
| ● |
Additionally, with the enhanced methodology of maximizing capital allocation, 2018 capital expenditures
were US$ 111.3 million, a significant decrease compared to US$ 259.5 million in 2017.
|
| ● |
4Q18 EBITDA from direct
operations was US$ 68.9 million, compared to US$ 118.9 million reported in 4Q17, primarily due to lower metal prices and a reduction in volume sold at the Company’s Orcopampa and La Zanja mines. 4Q18 Adjusted EBITDA including
associated companies reached US$ 148.6 million, compared to US$ 248.4 million in 4Q17.
|
| ● |
4Q18 Net Loss was US$ 72.9 million, compared to a net income of US$ 8.3 for the same period in 2017. The
loss in 4Q18 was primarily due to Cerro Verde´s recognition of interest and penalties in the amount of $ 406.6 million (100% basis) related to Cerro Verde’s royalty dispute with SUNAT (Please see page 8 for more details).
|
| ● |
The Company was compensated through its Business Interruption Insurance related to problems detected in May
2017 at El Brocal’s 20x30 ball mill. During 4Q18, the Company received US$ 28.8 million related to this claim, totaling US$38.8 million.As of December 31, 2018, Buenaventura’s cash position reached US$ 369.2 million, compared to US$
214.6 million in 2017.
|
| ● |
During 2018 the Company’s Net Debt/EBITDA ratio was reduced from 1.40x to 0.99x.
|
| ● |
A dividend payment of US$ 0.06 per share/ADS was proposed at the Company’s Board Meeting held on February
21st, 2019.
|
Financial
Highlights (in millions of US$, except EPS figures):
|
4Q18
|
4Q17
|
Var%
|
FY18
|
FY17
|
Var%
|
|
|
Total Revenues
|
256.0
|
370.6
|
-31%
|
1,167.4
|
1,274.4
|
-8%
|
|
Operating Profit
|
20.0
|
5.3
|
281%
|
53.8
|
105.5
|
-49%
|
|
EBITDA Direct Operations
|
68.9
|
118.9
|
-42%
|
315.4
|
376.8
|
-16%
|
|
Adjusted EBITDA (Inc Associates)
|
179.5
|
283.0
|
-37%
|
663.8
|
722.0
|
-8%
|
|
Net Income / Net Loss
|
-72.9
|
8.3
|
N.A.
|
-13.4
|
60.8
|
N.A.
|
|
EPS*
|
-0.29
|
0.03
|
N.A.
|
-0.05
|
0.24
|
N.A.
|
(*) as of December 31, 2018 Buenaventura had a weighted average number of shares outstanding of 253,986,867.

|
|
Compañía de Minas Buenaventura S.A.A.
Fourth Quarter 2018 Results
Page 2 of 27
|
|
Operating Revenues
|
|
4Q18 net sales were US$ 250.6 million compared to US$ 365.5 million reported in 4Q17. This was primarily due to a 49% YoY decrease in volumes
sold of gold and a 17% YoY decrease in silver, as well as due to lower prices for all metals sold.
Royalty income increased 6% in the 4Q18; from US$ 5.1 million in 4Q17 to US$ 5.5 million in 4Q18. This was due to a 6% increase in revenues
at Yanacocha.
|
Operating Highlights
|
4Q18
|
4Q17
|
Var%
|
FY18
|
FY17
|
Var%
|
|
Net Sales
(in millions of US$)
|
251
|
365
|
-31%
|
1,147
|
1,254
|
-9%
|
|
Average Realized Gold Price (US$/oz) (1) (2)
|
1,223
|
1,274
|
-4%
|
1,268
|
1,268
|
0%
|
|
Average Realized Gold Price (US$/oz) Inc. Affiliates (2)(3)
|
1,223
|
1,273
|
-4%
|
1,263
|
1,260
|
0%
|
|
Average Realized Silver Price (US$/oz) (1) (2)
|
13.51
|
16.43
|
-18%
|
15.09
|
16.54
|
-9%
|
|
Average Realized Lead Price (US$/MT) (1) (2)
|
1,792
|
2,516
|
-29%
|
2,141
|
2,372
|
-10%
|
|
Average Realized
Zinc Price (US$/MT) (1) (2)
|
2,338
|
3,498
|
-33%
|
2,686
|
3,046
|
-12%
|
|
Average Realized Copper Price (US$/MT) (1) (2)
|
5,801
|
6,914
|
-16%
|
6,277
|
6,280
|
0%
|
|
Volume Sold
|
4Q18
|
4Q17
|
Var%
|
FY18
|
FY17
|
Var%
|
|
Consolidated Gold Oz1
|
61,830
|
122,085
|
-49%
|
324,864
|
403,480
|
-19%
|
|
Gold Oz Inc. Associated Companies 3
|
146,198
|
198,251
|
-26%
|
621,681
|
698,860
|
-11%
|
|
Consolidated Silver Oz 1
|
5,188,983
|
6,228,219
|
-17%
|
24,464,648
|
24,773,278
|
-1%
|
|
Consolidated Lead MT 1
|
11,134
|
10,833
|
3%
|
41,601
|
40,032
|
4%
|
|
Consolidated Zinc MT 1
|
15,047
|
16,036
|
-6%
|
64,793
|
61,724
|
5%
|
|
Consolidated Copper MT 1
|
11,528
|
11,604
|
-1%
|
43,770
|
42,756
|
2%
|
|
(1)
|
Buenaventura Consolidated includes 100% of
Buenaventura’s operating units, 100% of La Zanja and 100% of El Brocal.
|
|
(2)
|
The realized price takes into account the adjustments of quotational periods.
|
|
(3)
|
Considers 100% of Buenaventura’s operating units,
100% of La Zanja, 100% of El Brocal, 40.095% of Coimolache and 43.65% of Yanacocha.
|
|
|
Compañía de Minas Buenaventura S.A.A.
Fourth Quarter 2018 Results
Page 3 of 27
|
|
Production and Operating Costs
|
|
Buenaventura’s 4Q18 equity gold production was 57,627 ounces, compared to 97,639 reported in 4Q17, primarily due a 73% YoY decrease in
production at Orcopampa and a 34% YoY decrease in production at La Zanja. Silver equity production decreased by 11% compared to 4Q17, primarily due to a 21% decrease in production at the Uchucchacua mine and a 11% decrease at the El Brocal mine.
Zinc equity production increased by 5% compared to 4Q17, primarily due to a 36% increase in production at the Uchucchacua mine.
Buenaventura´s FY18 equity gold production was 296,620 ounces, compared to 337,260 reported in FY17. This was primarily due to a 39% YoY
decrease in production at Orcopampa and a 44% YoY decrease in production at La Zanja. FY18 equity lead production increased by 5% as compared to FY17, primarily due to a 14% YoY increase in production at Uchucchacua. Buenaventura´s equity zinc
production increased 15% in the FY18 period compared to FY17, primarily due to a 67% increase in production at Uchucchacua.
|
Equity Production
|
4Q18
|
4Q17
|
Var%
|
FY18
|
FY17
|
Var%
|
|
Gold Oz Direct Operations(1)
|
57,627
|
97,639
|
-41%
|
296,620
|
337,260
|
-12%
|
|
Gold Oz including Associated(2) Companies
|
139,307
|
174,368
|
-18%
|
590,668
|
631,387
|
-5%
|
|
Silver Oz Direct Operations(1)
|
5,507,511
|
6,218,877
|
-11%
|
25,171,298
|
24,912,786
|
1%
|
|
Silver Oz including Associated Companies
|
5,890,492
|
6,626,638
|
-11%
|
26,850,318
|
26,433,729
|
2%
|
|
Lead MT
|
10,441
|
10,205
|
2%
|
38,801
|
37,120
|
5%
|
|
Zinc MT
|
15,013
|
14,299
|
5%
|
62,685
|
54,635
|
15%
|
|
Copper MT Direct Operations(1)
|
7,472
|
7,446
|
0%
|
28,569
|
27,846
|
3%
|
|
Copper MT including Associated Companies
|
31,389
|
30,227
|
4%
|
121,772
|
122,184
|
0%
|
|
Consolidated Production
|
4Q18
|
4Q17
|
Var%
|
FY18
|
FY17
|
Var%
|
|
Gold Oz(3)
|
68,648
|
114,325
|
-40%
|
338,508
|
405,646
|
-17%
|
|
Silver Oz(3)
|
5,893,401
|
6,662,963
|
-12%
|
26,778,190
|
26,624,431
|
1%
|
|
Lead MT(3)
|
12,509
|
12,062
|
4%
|
46,740
|
44,976
|
4%
|
|
Zinc MT(3)
|
18,755
|
18,470
|
2%
|
80,270
|
74,560
|
8%
|
|
Copper MT(3)
|
12,136
|
12,127
|
0%
|
46,400
|
45,289
|
2%
|
|
(1)
|
Buenaventura’s Direct Operations includes 100% of
Buenaventura’s operating units, 53.06% of La Zanja and 61.43% of El Brocal.
|
|
(2)
|
Based on 100% of Buenaventura´s operating units, 53.06% of La Zanja, 61.43% of el Brocal, 40.095% of Coimolache and 43.65% of
Yanacocha.
|
|
(3)
|
Based on 100% of Buenaventura’s operating units,
100% of La Zanja and 100% of El Brocal.
|
|
|
Compañía de Minas Buenaventura S.A.A.
Fourth Quarter 2018 Results
Page 4 of 27
|
Tambomayo (100% owned by Buenaventura)
|
Production
|
|||||||
|
4Q18
|
4Q17
|
Var % |
FY 2018
|
FY 2017
|
Var %
|
||
|
Gold
|
Oz
|
31,026
|
27,605
|
12% |
129,172
|
64,175
|
101%
|
|
Silver
|
Oz
|
873,249
|
814,012
|
7% |
3,929,808
|
1,788,219
|
120%
|
|
Cost Applicable to Sales
|
|||||||
|
4Q18
|
4Q17
|
Var %
|
FY 2018
|
FY 2017
|
Var %
|
||
|
Gold
|
US$/Oz
|
850
|
631
|
35%
|
626
|
671
|
-7%
|
4Q18 year on year gold production at Tambomayo increased due to increased amounts of ore treated and higher ore grade. Cost Applicable to
Sales (CAS) in 4Q18 increased 35%, to 850 US$/Oz, compared to 631 US$/Oz in 4Q17 mainly due to higher exploration expenses and lower volume sold.
Gold production guidance for 2019 is 90k – 110k ounces and silver production guidance is 2.5M – 3.0M ounces.
Orcopampa (100% owned by Buenaventura)
|
Production
|
|||||||
|
4Q18
|
4Q17
|
Var %
|
FY 2018
|
FY 2017
|
Var %
|
||
|
Gold
|
Oz
|
13,372
|
50,056
|
-73%
|
115,887
|
190,976
|
-39%
|
|
Silver
|
Oz
|
10,602
|
104,742
|
-90%
|
312,250
|
528,449
|
-41%
|
|
Cost Applicable to Sales
|
|||||||
|
4Q18
|
4Q17
|
Var %
|
FY 2018
|
FY 2017
|
Var %
|
||
|
Gold
|
US$/Oz
|
1,734
|
738
|
135%
|
1,020
|
743
|
37%
|
The decrease in 4Q18 gold production at Orcopampa was primarily due the decision made by the Company’s management to temporarily cease
production at the mine in order to centralize the operation, prioritizing the De-Bottlenecking Program over ore extraction. Cost Applicable to Sales (CAS) increased to 1,734 US$/Oz in 4Q18, compared to 738 US$/Oz in 4Q17, primarily due to a
decrease in volume sold.
Gold production guidance for 2019 is 75k – 90k ounces.
La Zanja (53.06% owned by Buenaventura)
|
Production
|
|||||||
|
4Q18
|
4Q17
|
Var %
|
FY 2018
|
FY 2017
|
Var %
|
||
|
Gold
|
Oz
|
20,101
|
30,648
|
-34%
|
71,630
|
127,118
|
-44%
|
|
Silver
|
Oz
|
54,108
|
82,970
|
-35%
|
217,174
|
280,908
|
-23%
|
|
Cost Applicable to Sales
|
|||||||
| 4Q18 | 4Q17 |
Var %
|
FY 2018
|
FY 2017
|
Var %
|
||
|
Gold
|
US$/Oz
|
773
|
875
|
-12%
|
891
|
789
|
13%
|
4Q18 gold production decreased by 34% year on year, in line with the Company’s guidance released at the beginning of 2018. 4Q18 Cost
Applicable to Sales (CAS) was 773 US$/Oz; a 12% decrease compared to 875 US$/Oz in 4Q17, mainly due to a reduction in reagent consumption.
Gold production guidance for 2019 is 25k – 35k ounces.
|
|
Compañía de Minas Buenaventura S.A.A.
Fourth Quarter 2018 Results
Page 5 of 27
|
Coimolache (40.10% owned by Buenaventura)
|
Production
|
|||||||
|
4Q18
|
4Q17
|
Var %
|
FY 2018
|
FY 2017
|
Var %
|
||
|
Gold
|
Oz
|
49,708
|
45,164
|
10%
|
173,192
|
151,454
|
14%
|
|
Silver
|
Oz
|
192,678
|
263,355
|
-27%
|
791,181
|
800,942
|
-1%
|
|
Cost Applicable to Sales
|
|||||||
| 4Q18 | 4Q17 |
Var %
|
FY 2018
|
FY 2017
|
Var %
|
||
|
Gold
|
US$/Oz
|
742
|
553
|
34%
|
675
|
517
|
31%
|
4Q18 gold production at Coimolache increased by 10% as compared to the same period last year, in line with the mine production plan. 4Q18
Cost Applicable to Sales (CAS) increased by 34%, compared to 553 US$/Oz in 4Q17, due to an increase in hauling expenses largely associated with the purchase of ore from Goldfields.
Gold production guidance for 2019 is 150k – 170k ounces.
Uchucchacua (100% owned by Buenaventura)
|
Production
|
|||||||
|
4Q18
|
4Q17
|
Var %
|
FY 2018
|
FY 2017
|
Var %
|
||
|
Silver
|
Oz
|
3,256,870
|
4,129,464
|
-21%
|
15,420,102
|
16,583,698
|
-7%
|
|
Zinc
|
MT |
5,867
|
4,318
|
36%
|
21,840
|
13,040
|
67%
|
|
Lead
|
MT |
4,961
|
5,493
|
-10%
|
19,122
|
16,708
|
14%
|
|
Cost Applicable to Sales
|
|||||||
|
4Q18
|
4Q17
|
Var %
|
FY 2018
|
FY 2017
|
Var %
|
||
|
Silver
|
US$/Oz
|
12.08
|
9.84
|
23%
|
10.41
|
10.61
|
-2%
|
4Q18 silver production at Uchucchacua decreased primarily due to a reduction in ore grades. 4Q18 Cost Applicable to Sales (CAS) of 12.08
US$/Oz was 23% higher than 9.84 US$/Oz in 4Q17, primarily due to a 21% YoY decrease in volume sold.
Silver production guidance for 2019 is 14.5 million – 15.5 million ounces.
Mallay (100% owned by Buenaventura)
|
Production
|
|||||||
| 4Q18 | 4Q17 |
Var %
|
FY 2018
|
FY 2017
|
Var %
|
||
|
Silver
|
Oz
|
97,670 | 192,004 |
-49%
|
514,081
|
1,109,382
|
-54%
|
|
Zinc
|
MT | 1,107 | 1,281 |
-14%
|
4,151
|
7,102
|
-42%
|
|
Lead
|
MT |
401
|
602
|
-33%
|
1,768
|
4,061
|
-56%
|
|
Cost Applicable to Sales
|
|||||||
|
4Q18
|
4Q17
|
Var %
|
FY 2018
|
FY 2017
|
Var %
|
||
|
Silver
|
US$/Oz
|
7.76
|
12.92
|
-40%
|
11.50
|
13.27
|
-13%
|
Mallay silver, lead and zinc production decreased in 4Q18, in-line with guidance released at the beginning of 2018. 4Q18 Cost Applicable to
Sales (CAS) of 7.76 US$/Oz was 40% lower than 12.92 US$/Oz in 4Q17, primarily due to lower exploration expenses.
|
|
Compañía de Minas Buenaventura S.A.A.
Fourth Quarter 2018 Results
Page 6 of 27
|
Julcani (100% owned by Buenaventura)
Julcani
|
Production
|
|||||||
|
4Q18
|
4Q17
|
Var %
|
FY 2018
|
FY 2017
|
Var %
|
||
|
Silver
|
Oz
|
666,259
|
292,358
|
128%
|
2,482,907
|
2,249,527
|
10%
|
|
Cost Applicable to Sales
|
|||||||
|
4Q18
|
4Q17
|
Var %
|
FY 2018
|
FY 2017
|
Var %
|
||
|
Silver
|
US$/Oz
|
14.04
|
30.25
|
-54%
|
14.98
|
17.12
|
-13%
|
4Q18 silver production increased 128% YoY primarily due to an increase in amount of ore treated (73% increase YoY) and a 31% YoY increase
in ore grades. 4Q18 Cost Applicable to Sales (CAS) of 14.04 US$/Oz was 54% lower than 30.25 US$/Oz in 4Q17, mainly due to the Company’s success in centralizing the operation.
Silver production guidance for 2019 is 2.2 million – 2.5 million ounces.
El Brocal (61.43% owned by Buenaventura)
|
Production
|
|||||||
|
4Q18
|
4Q17
|
Var %
|
FY 2018
|
FY 2017
|
Var %
|
||
|
Copper
|
MT |
12,093
|
12,103
|
0%
|
46,231
|
45,097
|
3% |
|
Zinc
|
MT |
9,702
|
10,785
|
-10%
|
45,593
|
51,511
|
-11% |
|
Silver
|
Oz
|
934,642
|
1,047,414
|
-11%
|
3,901,868
|
4,084,249
|
-4% |
|
Cost Applicable to Sales
|
|||||||
|
4Q18
|
4Q17
|
Var %
|
FY 2018
|
FY 2017
|
Var %
|
||
|
Copper
|
US$/MT
|
5,842
|
5,468
|
7%
|
5,487
|
5,119
|
7%
|
|
Zinc
|
US$/MT
|
1,696
|
2,059
|
-18%
|
1,569
|
1,915
|
-18% |
4Q18 copper production was in line with 4Q17. Zinc production in 4Q18 decreased 18% compared to 4Q17, mainly due to a lower ore grade (a
13% decrease YoY).
In 4Q18, zinc Cost Applicable to Sales (CAS) decreased by 18% compared to 2,059 US$/MT, primarily explained by a decrease in commercial
deductions. Copper CAS in 4Q18 increased by 7%, reaching 5,842 US$/MT compared to 5,468 US$/MT in 4Q17, mainly due to an increase in volumes of ore treated to offset lower grades.
At El Brocal, the Company was compensated through its Business Interruption Insurance related to problems detected
with the 20x30 mill in May 2017. During 4Q18, the Company received US$ 28.8 million related to this claim. El Brocal received a total of US$ 38.8 million in 2018 related to this issue.
Zinc production guidance for 2019 is 57k – 65k MT, while copper production guidance for 2019 is 47k – 52k MT.
|
General and Administrative Expenses
|
|
4Q18 General and Administrative expenses were US$ 17.1 million; a 25% decrease as compared to the US$ 22.7 million in 4Q17.
|
|
Compañía de Minas Buenaventura S.A.A.
Fourth Quarter 2018 Results
Page 7 of 27
|
|
Exploration in Non-Operating Areas
|
|
4Q18 exploration costs in Non-Operating Areas were US$ 11.5 million compared with US$ 6.0 million in 4Q17. During the period, Buenaventura
primarily focused its exploration efforts on the Yumpaq area (US$ 6.7 million), Marcapunta Norte (US$ 2.6 million) and Emperatriz (US$ 0.6 million).
|
Share in Associated Companies
|
|
During 4Q18, Buenaventura’s share in associated companies was negative US$ 72.3 million, compared to US$ 4.3 million reported in 4Q17,
comprised of:
|
Share in the Result of Associates
(in millions of US$)
|
4Q18
|
4Q17
|
Var %
|
FY18
|
FY17
|
Var %
|
|
Cerro Verde
|
-59.0
|
42.6
|
-238%
|
23.4
|
68.5
|
-66%
|
|
Coimolache
|
2.0
|
7.7
|
-74%
|
11.0
|
21.3
|
-48%
|
|
Yanacocha
|
-15.3
|
-46.0
|
-67%
|
-35.6
|
-76.6
|
-54%
|
|
Total
|
-72.3
|
4.3
|
N.A.
|
-1.1
|
13.21
|
N.A.
|
YANACOCHA
At Yanacocha, which is 43.65% owned by Buenaventura, 4Q18 gold production was 141,465 ounces; 61,749 ounces of which were attributable to
Buenaventura. This represents a 5% decrease as compared to the 134,291 ounces produced in 4Q17; 58,618 ounces of which were attributable to Buenaventura. For FY18, gold production was 514,564; 224,607 ounces of which were attributable to
Buenaventura, a 4% decrease as compared to 534,692 ounces in FY17; 233,393 ounces of which were attributable to Buenaventura.
Gold production guidance at Yanacocha for 2019 is 510k ounces.
In 4Q18, Yanacocha reported a net loss of US$ 35.2 million, compared to a net loss of US$ 105.4 million reported in 4Q17.
CAS in 4Q18 was US$ 722/oz; a 9% decrease as compared to the US$ 797/oz reported in 4Q17 mainly due to more volume sold (increase of 12%
QoQ and due to lower process of deep transitional material.
Capital expenditures at Yanacocha were US$ 37.7 million in 4Q18.
The Quecher Main project, an oxide deposit, is currently in its Execution Phase. First production is expected in early 2019 with commercial
production expected in the fourth quarter of 2019. The Quecher Main project extends the life of the Yanacocha operation until 2027, with average annual gold production of 200,000 ounces per year expected between 2020 and 2025. Cost applicable to
sales (CAS) is expected to be between US$ 750 and US$ 850 per ounce and AISC between US$ 900 and US$ 1,000. Total CAPEX for the project is expected to be between US$ 250 and US$ 300 million with $95 to $105 million allocated in 2019. The project
IRR is expected to be greater than 10 percent.
|
|
Compañía de Minas Buenaventura S.A.A.
Fourth Quarter 2018 Results
Page 8 of 27
|
CERRO VERDE
At Cerro Verde (19.58% owned by Buenaventura), 4Q18 copper production was 122,148 MT; 23,917 MT of which is attributable to Buenaventura, a
5% increase from 116,351 MT produced in 4Q17; 22,782 MT of which was attributable to Buenaventura. FY18 copper production was 476,013 MT; 93,203 MT of which was attributable to Buenaventura. FY18 copper production was in-line with 481,810 MT
reported in FY17; 94,338 MT of which was attributable to Buenaventura.
Cerro Verde reported a 4Q18 net loss of US$ 301.1 million compared to net income of US$ 217.6 million in 4Q17. This decrease was primarily
due to the recognition of interest and penalties of US$ 406.6 million (US$ 79.6 million attributable to Buenaventura) recorded in 4Q18 due to the Royalty Dispute and the decrease in net sales related to a decrease in the average realized copper
price ($2.67 per pound in 4Q18 vs $3.46 per pound in 4Q17).
Capital expenditures at Cerro Verde were US$ 56.0 million in 4Q18.
Royalty Dispute
In December 2018, Cerro Verde elected not to appeal the Peruvian Tax Tribunal's decision denying Cerro Verde's request to waive penalties
and interest related to disputed mining royalty assessments for the period January 2009 through September 2011.
As a result of the decision to not appeal the Tax Tribunal's decision, Cerro Verde recorded pre-tax charges in fourth-quarter 2018 totaling
$406.6 million primarily for penalties and interest for the years 2009 through 2013.
COIMOLACHE (Tantahuatay operation)
At Coimolache (40.10% owned by Buenaventura), 4Q18 attributable contribution to net income was US$ 2.0 million, as compared to US$ 7.7
million in 4Q17.
|
De-Bottlenecking Program – 4Q18 Update
|
|
Buenaventura’s De-Bottlenecking Program continues to progress with positive results.
|
|
Compañía de Minas Buenaventura S.A.A.
Fourth Quarter 2018 Results
Page 9 of 27
|
|
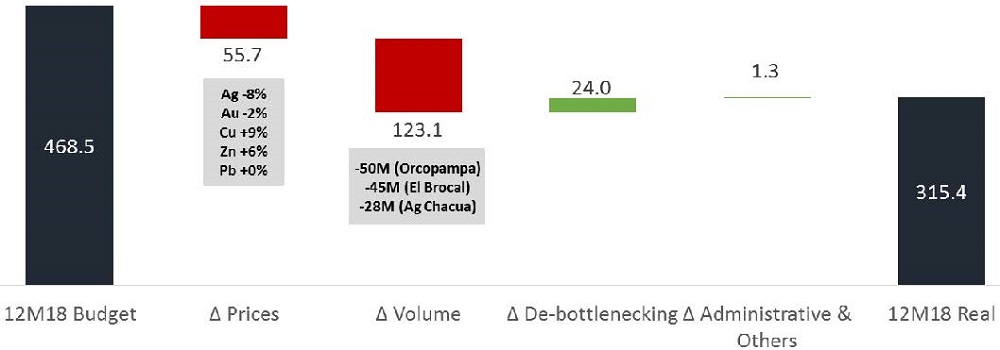
Variations in EBITDA Direct Operations
|
|
The Company’s budgeted EBITDA has been impacted by lower metals prices and lower production coming from Orcopampa, El Brocal and Uchuchacua.
|
Other
|
|
During the February 21, 2019 Board Meeting of Directors, the following resolution was passed:
|
Call for the Annual Shareholders Meeting to be held on March 25, 2019 with the following items proposed for approval:
|
|
a)
|
Approval of the Annual Report as of December 31, 2018.
|
|
b)
|
Approval of the Financial Statements as of December 31, 2018.
|
|
c)
|
Delegation to the Board of Directors to pay Interim Dividends.
|
|
d)
|
Declaration of a cash dividend in the amount of US$ 0.06 per share or ADS.
|
|
e)
|
Approval of the Retribution Policy of the Board Members.
|
|
f)
|
Approval of the Annual Retribution for each the Board Member.
|
|
g)
|
Propose Ernst and Young (Paredes, Burga y Asociados) as External Auditors for fiscal year 2019.
|
|
|
Compañía de Minas Buenaventura S.A.A.
Fourth Quarter 2018 Results
Page 10 of 27
|
***
Company Description
Compañía de Minas Buenaventura S.A.A. is Peru’s largest, publicly traded, precious metals company and a major holder of mining rights in
Peru. The Company is engaged in the mining, processing, development and exploration of gold and silver and other metals via wholly owned mines as well as through its participation in joint exploration projects.
Buenaventura currently operates several mines in Peru (Orcopampa*, Uchucchacua*, Mallay*, Julcani*, El Brocal, La Zanja and Coimolache and
is developing the Tambomayo project.
The Company owns 43.65% of Minera Yanacocha S.R.L (a partnership with Newmont Mining Corporation), an important precious metal producer;
19.58% of Sociedad Minera Cerro Verde, an important Peruvian copper producer.
For a printed version of the Company’s 2017 Form 20-F, please contact the investor relations contacts on page 1 of this report, or download
the PDF format file from the Company’s web site at www.buenaventura.com.
(*) Operations wholly owned by Buenaventura
|
|
Note on Forward-Looking Statements
This press release may contain forward-looking information (as defined in the U.S. Private Securities Litigation Reform Act
of 1995) that involve risks and uncertainties, including those concerning the Company’s, Yanacocha’s and Cerro Verde’s costs and expenses, results of exploration, the continued improving efficiency of operations, prevailing market
prices of gold, silver, copper and other metals mined, the success of joint ventures, estimates of future explorations, development and production, subsidiaries’ plans for capital expenditures, estimates of reserves and Peruvian
political, economic, social and legal developments. These forward-looking statements reflect the Company’s view with respect to the Company’s, Yanacocha’s and Cerro Verde’s future financial performance. Actual results could differ
materially from those projected in the forward-looking statements as a result of a variety of factors discussed elsewhere in this Press Release.
|
|
|
Compañía de Minas Buenaventura S.A.A.
Fourth Quarter 2018 Results
Page 11 of 27
|
**Tables to follow**
APPENDIX 1
|
Equity Participation in
Subsidiaries and Associates (as of December 31, 2018)
|
|||
|
BVN
|
Operating
|
||
|
Equity %
|
Mines / Business
|
||
|
El Molle Verde S.A.C*
|
100.00
|
Trapiche Project
|
|
|
Minera La Zanja S.A*
|
53.06
|
La Zanja
|
|
|
Sociedad Minera El Brocal S.A.A*
|
61.43
|
Colquijirca and Marcapunta
|
|
|
Compañía Minera Coimolache S.A. **
|
40.10
|
Tantahuatay
|
|
|
Minera Yanacocha S.R.L. **
|
43.65
|
Yanacocha
|
|
|
Sociedad Minera Cerro Verde S.A.A **
|
19.58
|
Cerro Verde
|
|
|
Processadora Industrial Rio Seco S.A*
|
100.00
|
Rio Seco chemical plant
|
|
|
Consorcio Energético de Huancavelica S.A*
|
100.00
|
Energy – Huanza Hydroelectrical plant
|
|
(*)Consolidated
(**) Equity Accounting
|
|
Compañía de Minas Buenaventura S.A.A.
Fourth Quarter 2018 Results
Page 12 of 27
|
APPENDIX 2
|
Gold Production
|
16
|
19
|
||||||
|
Mining Unit
|
Operating Results
|
Unit
|
4Q18
|
4Q17
|
△%
|
FY18
|
FY17
|
△ %
|
|
Underground
|
||||||||
|
Tambomayo
|
Ore Milled
|
DMT
|
141,584
|
132,702
|
7%
|
557,364
|
332,193
|
68%
|
|
Ore Grade
|
Oz/MT
|
0.24
|
0.22
|
7%
|
0.25
|
0.22
|
11%
|
|
|
Recovery Rate
|
%
|
88.44
|
88.83
|
0%
|
91.15
|
83.59
|
9%
|
|
|
Ounces Produced*
|
Oz
|
31,026
|
27,605
|
12%
|
129,172
|
64,175
|
101%
|
|
|
Orcopampa
|
Ore Milled
|
DMT
|
43,846
|
128,894
|
-66%
|
353,891
|
500,580
|
-29%
|
|
Ore Grade
|
Oz/MT
|
0.26
|
0.38
|
-32%
|
0.32
|
0.38
|
-16%
|
|
|
Recovery Rate
|
%
|
95.30
|
97.42
|
-2%
|
97.10
|
97.14
|
0%
|
|
|
Ounces Produced*
|
Oz
|
13,372
|
50,056
|
-73%
|
115,887
|
190,976
|
-39%
|
|
|
Open Pit
|
||||||||
|
La Zanja
|
Ounces Produced
|
Oz
|
20,101
|
30,648
|
-34%
|
71,630
|
127,118
|
-44%
|
|
Tantahuatay
|
Ounces Produced
|
Oz
|
49,708
|
45,164
|
10%
|
173,192
|
151,454
|
14%
|
|
(*) Includes ounces from retreatment of tailing dams
|
||||||||
|
Silver Production
|
||||||||
|
Mining Unit
|
Operating Results
|
Unit
|
4Q18
|
4Q17
|
△%
|
FY18
|
FY17
|
△ %
|
|
Underground
|
||||||||
|
Tambomayo
|
Ore Milled
|
DMT
|
141,584
|
132,702
|
7%
|
557,364
|
332,193
|
68%
|
|
Ore Grade
|
Oz/MT
|
6.78
|
8.00
|
-15%
|
8.11
|
8.50
|
-5%
|
|
|
Recovery Rate
|
%
|
85.34
|
73.52
|
16%
|
85.11
|
62.12
|
37%
|
|
|
Ounces Produced
|
Oz
|
873,249
|
814,012
|
7%
|
3,929,808
|
1,788,219
|
120%
|
|
|
Uchucchacua
|
Ore Milled
|
DMT
|
355,348
|
325,312
|
9%
|
1,387,775
|
1,364,478
|
2%
|
|
Ore Grade
|
Oz/MT
|
10.13
|
15.23
|
-33%
|
12.48
|
14.73
|
-15%
|
|
|
Recovery Rate
|
%
|
90.44
|
83.37
|
8%
|
87.43
|
82.50
|
6%
|
|
|
Ounces Produced
|
Oz
|
3,256,870
|
4,129,464
|
-21%
|
15,420,102
|
16,583,698
|
-7%
|
|
|
Julcani
|
Ore Milled
|
DMT
|
28,886
|
16,729
|
73%
|
109,025
|
130,854
|
-17%
|
|
Ore Grade
|
Oz/MT
|
23.62
|
18.06
|
31%
|
23.35
|
17.77
|
31%
|
|
|
Recovery Rate
|
%
|
97.65
|
96.76
|
1%
|
97.41
|
96.77
|
1%
|
|
|
Ounces Produced
|
Oz
|
666,259
|
292,358
|
128%
|
2,482,907
|
2,249,527
|
10%
|
|
|
Mallay
|
Ore Milled
|
DMT
|
21,877
|
31,296
|
-30%
|
92,450
|
170,519
|
-46%
|
|
Ore Grade
|
Oz/MT
|
5.01
|
6.77
|
-26%
|
6.33
|
7.19
|
-12%
|
|
|
Recovery Rate
|
%
|
89.07
|
90.56
|
-2%
|
87.72
|
90.51
|
-3%
|
|
|
Ounces Produced
|
Oz
|
97,670
|
192,004
|
-49%
|
514,081
|
1,109,382
|
-54%
|
|
|
Marcapunta
|
Ore Milled
|
DMT
|
907,596
|
687,612
|
32%
|
3,204,261
|
2,517,673
|
27%
|
|
Ore Grade
|
Oz/MT
|
0.65
|
0.75
|
-13%
|
0.71
|
0.66
|
7%
|
|
|
Recovery Rate
|
%
|
59.68
|
63.04
|
-5%
|
60.95
|
63.12
|
-3%
|
|
|
Ounces Produced
|
Oz
|
354,669
|
326,142
|
9%
|
1,383,536
|
1,052,453
|
31%
|
|
|
Open Pit
|
||||||||
|
Tajo Norte
|
Ore Milled
|
DMT
|
824,071
|
779,082
|
6%
|
3,429,618
|
3,169,908
|
8%
|
|
Ore Grade
|
Oz/MT
|
1.09
|
1.25
|
-13%
|
1.13
|
1.32
|
-15%
|
|
|
Recovery Rate
|
%
|
64.28
|
73.96
|
-13%
|
65.25
|
72.30
|
-10%
|
|
|
Ounces Produced
|
Oz
|
579,974
|
721,272
|
-20%
|
2,518,332
|
3,031,796
|
-17%
|
|
|
Zinc Production
|
||||||||
|
Mining Unit
|
Operating Results
|
Unit
|
4Q18
|
4Q17
|
△%
|
FY18
|
FY17
|
△ %
|
|
Underground
|
||||||||
|
Tambomayo
|
Ore Milled
|
DMT
|
141,584
|
132,702
|
7%
|
557,364
|
332,193
|
68%
|
|
Ore Grade
|
%
|
2.06
|
2.34
|
-12%
|
2.16
|
2.35
|
-8%
|
|
|
Recovery Rate
|
%
|
71.31
|
67.20
|
6%
|
71.36
|
37.22
|
92%
|
|
|
MT Produced
|
MT
|
2,080
|
2,086
|
0%
|
8,685
|
2,906
|
199%
|
|
|
Uchucchacua
|
Ore Milled
|
DMT
|
355,348
|
325,312
|
9%
|
1,387,775
|
1,364,478
|
2%
|
|
Ore Grade
|
%
|
2.23
|
2.41
|
-7%
|
2.23
|
1.80
|
24%
|
|
|
Recovery Rate
|
%
|
73.99
|
55.11
|
34%
|
70.34
|
53.01
|
33%
|
|
|
MT Produced
|
MT
|
5,867
|
4,318
|
36%
|
21,840
|
13,040
|
67%
|
|
|
Mallay
|
Ore Milled
|
DMT
|
21,877
|
31,296
|
-30%
|
92,450
|
170,519
|
-46%
|
|
Ore Grade
|
Oz/MT
|
6.00
|
4.73
|
27%
|
5.30
|
4.73
|
12%
|
|
|
Recovery Rate
|
%
|
59.61
|
83.93
|
-29%
|
64.77
|
85.20
|
-24%
|
|
|
MT Produced
|
MT
|
1,107
|
1,281
|
-14%
|
4,151
|
7,102
|
-42%
|
|
|
Open Pit
|
||||||||
|
Tajo Norte
|
Ore Milled
|
DMT
|
824,071
|
779,082
|
6%
|
3,429,618
|
3,169,908
|
8%
|
|
Ore Grade
|
%
|
2.14
|
2.54
|
-16%
|
2.30
|
2.74
|
-16%
|
|
|
Recovery Rate
|
%
|
55.01
|
54.43
|
1%
|
57.78
|
59.33
|
-3%
|
|
|
MT Produced
|
MT
|
9,702
|
10,785
|
-10%
|
45,593
|
51,511
|
-11%
|
|
|
Copper Production
|
||||||||
|
Mining Unit
|
Operating Results
|
Unit
|
4Q18
|
4Q17
|
△%
|
FY18
|
FY17
|
△ %
|
|
Underground
|
||||||||
|
Marcapunta
|
Ore Milled
|
DMT
|
907,596
|
687,612
|
32%
|
3,204,261
|
2,517,673
|
27%
|
|
Ore Grade
|
%
|
1.49
|
1.90
|
-21%
|
1.59
|
1.91
|
-17%
|
|
|
Recovery Rate
|
%
|
89.48
|
92.82
|
-4%
|
90.63
|
93.56
|
-3%
|
|
|
MT Produced
|
MT
|
12,093
|
12,103
|
0%
|
46,231
|
45,097
|
3%
|
|
|
|
Compañía de Minas Buenaventura S.A.A.
Fourth Quarter 2018 Results
Page 13 of 27
|
APPENDIX 3: Adjusted EBITDA Reconciliation (in thousand US$)
|
|
||||
|
|
4Q18
|
4Q17
|
FY 2018
|
FY 2017
|
|
Net Income
|
-67,332
|
-959
|
-11,654
|
64,435
|
|
Add / Substract:
|
136,202
|
119,848
|
327,070
|
312,376
|
|
Depreciation and Amortization
|
63,033
|
74,123
|
241,286
|
213,722
|
|
Interest expense
|
10,140
|
8,785
|
38,456
|
34,623
|
|
Provision for income tax, net
|
3,513
|
-9,062
|
26,926
|
18,012
|
|
Long Term Compensation provision
|
5,075
|
1,561
|
17,757
|
1,744
|
|
Impairment of Inventories
|
4,295
|
2,260
|
11,560
|
4,562
|
|
Loss from discontinued operations
|
5,916
|
12,243
|
7,203
|
10,098
|
|
Write-off of talings dam
|
0
|
0
|
1,134
|
0
|
|
Loss of assets due to failed investment
|
2,690
|
0
|
2,690
|
0
|
|
Workers´ participation provision
|
1,037
|
-49
|
1,903
|
2,195
|
|
Loss on currency exchange difference
|
1,345
|
-585
|
1,366
|
-2,928
|
|
Write-off development costs
|
970
|
0
|
2,263
|
0
|
|
Share in associated companies by the equity method, net
|
72,317
|
-4,306
|
1,144
|
-13,207
|
|
Provision for contingencies
|
-22,531
|
551
|
-11,239
|
13,879
|
|
Interest income
|
-5,905
|
-866
|
-9,686
|
-5,517
|
|
Impairment of Long-Lived Assets
|
-5,693
|
21,620
|
-5,693
|
21,620
|
|
Adjustment of component of stripping cost
|
0
|
13,573
|
0
|
13,573
|
|
EBITDA Buenaventura Direct Operations
|
68,870
|
118,889
|
315,416
|
376,811
|
|
EBITDA Yanacocha (43.65%)
|
22,085
|
19,168
|
64,396
|
18,717
|
|
EBITDA Cerro Verde (19.58%)
|
47,318
|
95,320
|
242,761
|
276,940
|
|
EBITDA Coimolache (40.01%)
|
41,201
|
49,573
|
41,201
|
49,573
|
|
Adjusted EBITDA (including Associated companies)
|
179,475
|
282,950
|
663,775
|
722,041
|
Note:
EBITDA (Buenaventura Direct Operations) consists of earnings before net interest, taxes, depreciation and amortization, share in associated
companies, net, loss on currency exchange difference, other, net, provision for workers’ profit sharing and provision for long-term officers’ compensation.
EBITDA (including associated companies) consists of EBITDA (Buenaventura Direct Operations), plus (1) Buenaventura’s equity share of EBITDA
(Yanacocha) (2) Buenaventura’s equity share of EBITDA (Cerro Verde), plus (3) Buenaventura’s equity share of EBITDA (Coimolache). All EBITDA mentioned were similarly calculated using financial information provided to Buenaventura by the
associated companies.
Buenaventura presents EBITDA (Buenaventura Direct Operations) and EBITDA (including affiliates) to provide further information with respect
to its operating performance and the operating performance of its equity investees, the affiliates. EBITDA (Buenaventura Direct Operations) and EBITDA (including affiliates) are not a measure of financial performance under IFRS, and may not be
comparable to similarly titled measures of other companies. You should not consider EBITDA (Buenaventura Direct Operations) and EBITDA (including affiliates) as alternatives to operating income or net income determined in accordance with IFRS, as
an indicator of Buenaventura’s, affiliates operating performance, or as an alternative to cash flows from operating activities, determined in accordance with IFRS, as an indicator of cash flows or as a measure of liquidity.
|
|
Compañía de Minas Buenaventura S.A.A.
Fourth Quarter 2018 Results
Page 14 of 27
|
APPENDIX 4: Preliminary Proven and Probable Reserves as of Dec. 2018
|
GOLD
|
||||||||||||||||||||
|
% Ownership
|
MT (000)
|
Grade Oz/TMS
|
Oz (000)
|
Attributable (000)
|
||||||||||||||||
|
Orcopampa
|
100.00
|
922
|
0.331
|
306
|
306
|
|||||||||||||||
|
Julcani
|
100.00
|
251
|
0.006
|
1
|
1
|
|||||||||||||||
|
Mallay
|
100.00
|
134
|
0.007
|
1
|
1
|
|||||||||||||||
|
Tambomayo
|
100.00
|
3,391
|
0.120
|
408
|
408
|
|||||||||||||||
|
La Zanja
|
53.06
|
3,120
|
0.012
|
37
|
19
|
|||||||||||||||
|
La Zanja (on Pads and Plant)
|
53.06
|
11
|
6
|
|||||||||||||||||
|
Tantahuatay (Oxides)
|
40.10
|
57,715
|
0.012
|
666
|
267
|
|||||||||||||||
|
Tantahuatay PAD
|
40.10
|
4
|
2
|
|||||||||||||||||
|
El Brocal Marcapunta (Sulphides)
|
61.43
|
19,804
|
0.013
|
249
|
153
|
|||||||||||||||
|
Yanacocha
|
43.65
|
7,423
|
3,240
|
|||||||||||||||||
|
Total
|
9,105
|
4,403
|
||||||||||||||||||
|
SILVER
|
||||||||||||||||||||
|
% Ownership
|
MT (000)
|
Grade Oz/TMS
|
Oz (000)
|
Attributable (000)
|
||||||||||||||||
|
Uchucchacua (Silver - Zinc - Lead)
|
100.00
|
11,941
|
7.69
|
91,844
|
91,844
|
|||||||||||||||
|
Julcani
|
100.00
|
251
|
21.37
|
5,368
|
5,368
|
|||||||||||||||
|
Mallay
|
100.00
|
134
|
6.56
|
878
|
878
|
|||||||||||||||
|
Orcopampa
|
100.00
|
922
|
1.01
|
932
|
932
|
|||||||||||||||
|
Tambomayo
|
100.00
|
3,391
|
4.17
|
14,133
|
14,133
|
|||||||||||||||
|
La Zanja
|
53.06
|
3,120
|
0.23
|
709
|
376
|
|||||||||||||||
|
La Zanja (on Pads and Plant)
|
53.06
|
210
|
111
|
|||||||||||||||||
|
Tantahuatay Oxides
|
40.10
|
57,715
|
0.31
|
17,910
|
7,181
|
|||||||||||||||
|
Tantahuatay PAD
|
40.10
|
57
|
23
|
|||||||||||||||||
|
El Brocal (Tajo Norte - Smelter)
|
61.43
|
58,982
|
1.13
|
66,396
|
40,787
|
|||||||||||||||
|
El Brocal Marcapunta (Sulphides)
|
61.43
|
19,804
|
0.70
|
13,956
|
8,573
|
|||||||||||||||
|
Yanacocha
|
43.65
|
104,571
|
45,645
|
|||||||||||||||||
|
Cerro Verde (Sulphides)
|
19.58
|
4,191,353
|
0.06
|
254,493
|
49,830
|
|||||||||||||||
|
Total
|
571,455
|
265,680
|
||||||||||||||||||
|
ZINC
|
||||||||||||||||||||
|
% Ownership
|
MT (000)
|
% Zn
|
MT (000)
|
Attributable (000)
|
||||||||||||||||
|
Uchucchacua (Silver - Zinc - Lead)
|
100.00
|
11,941
|
1.79
|
214
|
214
|
|||||||||||||||
|
Mallay
|
100.00
|
134
|
6.74
|
9
|
9
|
|||||||||||||||
|
Tambomayo
|
100.00
|
3,391
|
1.06
|
36
|
36
|
|||||||||||||||
|
El Brocal (Tajo Norte)
|
61.43
|
21,038
|
2.38
|
502
|
308
|
|||||||||||||||
|
Total
|
761
|
567
|
||||||||||||||||||
|
LEAD
|
||||||||||||||||||||
|
% Ownership
|
MT (000)
|
% Pb
|
MT (000)
|
Attributable (000)
|
||||||||||||||||
|
Uchucchacua (Silver - Zinc - Lead)
|
100.00
|
11,941
|
1.12
|
134
|
134
|
|||||||||||||||
|
Julcani
|
100.00
|
251
|
2.04
|
5
|
5
|
|||||||||||||||
|
Mallay
|
100.00
|
134
|
3.67
|
5
|
5
|
|||||||||||||||
|
Tambomayo
|
100.00
|
3,391
|
0.73
|
25
|
25
|
|||||||||||||||
|
El Brocal (Tajo Norte)
|
61.43
|
21,083
|
1.09
|
230
|
141
|
|||||||||||||||
|
Total
|
398
|
310
|
||||||||||||||||||
|
COPPER
|
||||||||||||||||||||
|
% Ownership
|
MT (000)
|
% Cu
|
MT (000)
|
Attributable (000)
|
||||||||||||||||
|
Julcani
|
100.00
|
251
|
0.47
|
1
|
1
|
|||||||||||||||
|
El Brocal Marcapunta Norte
|
61.43
|
19,804
|
1.35
|
266
|
164
|
|||||||||||||||
|
El Brocal (Tajo Norte - Smelter)
|
61.43
|
37,899
|
1.66
|
630
|
387
|
|||||||||||||||
|
Cerro Verde (Sulphides)*
|
19.58
|
4,191,353
|
0.36
|
13,943
|
2,730
|
|||||||||||||||
|
Cerro Verde (Oxides) *
|
19.58
|
133,107
|
0.26
|
992
|
194
|
|||||||||||||||
|
Yanacocha
|
43.65
|
660
|
288
|
|||||||||||||||||
|
Total
|
16,493
|
3,764
|
||||||||||||||||||
|
MOLYBDENUM
|
||||||||||||||||||||
|
% Ownership
|
MT (000)
|
% Mo
|
MT (000)
|
Attributable (000)
|
||||||||||||||||
|
Cerro Verde (Sulphides) *
|
19.58
|
4,191,353
|
0.01
|
587
|
115
|
|||||||||||||||
|
Total
|
587
|
115
|
||||||||||||||||||
|
Prices used for Buenaventura´s Reserves calculation:
|
|||||
|
Gold 1,300 US$/Oz - Silver 17 US$/Oz - Zinc 2,500 US$/MT - Lead 2,100US$/MT - Copper 7,000 US$/MT
|
|||||
|
|
Compañía de Minas Buenaventura S.A.A.
Fourth Quarter 2018 Results
Page 15 of 27
|
APPENDIX 5: COST APPLICABLE TO SALES RECONCILIATION
Reconciliation of Costs Applicable to Sales and Cost Applicable to Sales per Unit Sold
Cost applicable to sales consists of cost of sales, excluding depreciation and amortization, plus selling expenses. Cost applicable to
sales per unit sold for each mine consists of cost applicable to sales for a particular metal produced at a given mine divided by the volume of such metal produced at such mine in the specified period. We note that cost applicable to sales is not
directly comparable to the cash operating cost figures disclosed in previously furnished earnings releases.
Cost applicable to sales and Cost applicable to sales per unit of mineral sold are not measures of financial performance under IFRS, and
may not be comparable to similarly titled measures of other companies. We consider Cost applicable to sales and Cost applicable to sales per unit of mineral sold to be key measures in managing and evaluating our operating performance. These
measures are widely reported in the precious metals industry as a benchmark for performance, but do not have standardized meanings. You should not consider Cost applicable to sales or Cost applicable to sales per unit of mineral sold as
alternatives to cost of sales determined in accordance with IFRS, as indicators of our operating performance. Cost applicable to sales and Cost applicable to sales per unit of mineral sold are calculated without adjusting for by-product revenue
amounts.
The tables below set forth (i) a reconciliation of consolidated Cost of sales, excluding depreciation and amortization to consolidated Cost
applicable to sales, (ii) reconciliations of the components of Cost applicable to sales (by mine and mineral) to the corresponding consolidated line items set forth on our consolidated statements of profit or loss for the three and nine months
ended September 30, 2015 and 2016, and (iii) reconciliations of Cost of sales, excluding depreciation and amortization to Cost applicable to sales for each of our mining units. The amounts set forth in Cost applicable to sales and Cost
applicable to sales per unit sold for each mine and mineral indicated in the tables below can be reconciled to the amounts set forth on our consolidated statements of profit or loss for the three and nine months ended September 30, 2015 and 2016
by reference to the reconciliations of Cost of sales, excluding depreciation and amortization (by mine and mineral), Selling Expenses (by mine and metal) expenses and Exploration in units in operations (by mine and mineral) to consolidated Cost
of sales, excluding depreciation and amortization, consolidated Selling Expenses and consolidated Exploration in units in operations expenses, respectively, set forth below.
|
|
Compañía de Minas Buenaventura S.A.A.
Fourth Quarter 2018 Results
Page 16 of 27
|
|
Set forth below is a reconciliation of consolidated Cost of sales, excluding depreciation and amortization,
|
||||||||||||||||
|
to consolidated Cost applicable to sales:
|
||||||||||||||||
|
For the 3 months ended December 31
|
For the 12 months ended December 21
|
|||||||||||||||
|
2018
|
2017
|
2018
|
2017
|
|||||||||||||
|
(in thousands of US$)
|
||||||||||||||||
|
Consolidated Cost of sales excluding depreciation and amortization
|
160,249
|
181,783
|
629,802
|
640,387
|
||||||||||||
|
Add:
|
||||||||||||||||
|
Consolidated Exploration in units in operation
|
20,710
|
26,135
|
90,343
|
94,928
|
||||||||||||
|
Consolidated Commercial deductions
|
50,315
|
65,414
|
195,865
|
253,923
|
||||||||||||
|
Consolidated Selling expenses
|
7,156
|
8,014
|
27,522
|
24,088
|
||||||||||||
|
Consolidated Cost applicable to sales
|
238,430
|
281,345
|
943,532
|
1,013,326
|
||||||||||||
|
Set forth below is a reconciliation of Cost of sales, excluding depreciation and amortization
|
||||||||||||||||
|
(by mine and mineral) to consolidated Cost of sales:
|
||||||||||||||||
|
|
For the 3 months ended December 31
|
For the 12 months ended December 21
|
||||||||||||||
|
|
2018
|
2017
|
2018
|
2017
|
||||||||||||
|
Cost of sales by mine and mineral
|
(in thousands of US$)
|
|||||||||||||||
|
Julcani, Gold
|
0
|
0
|
19
|
0
|
||||||||||||
|
Julcani, Silver
|
6,218
|
6,674
|
23,608
|
26,413
|
||||||||||||
|
Julcani, Lead
|
298
|
995
|
1,335
|
3,048
|
||||||||||||
|
Julcani, Copper
|
18
|
18
|
86
|
126
|
||||||||||||
|
Mallay, Gold
|
7
|
0
|
28
|
225
|
||||||||||||
|
Mallay, Silver
|
627
|
1,901
|
3,968
|
8,204
|
||||||||||||
|
Mallay, Lead
|
319
|
932
|
1,974
|
4,470
|
||||||||||||
|
Mallay, Zinc
|
1,144
|
2,167
|
5,285
|
8,696
|
||||||||||||
|
Orcopampa, Gold
|
18,635
|
29,988
|
88,942
|
105,848
|
||||||||||||
|
Orcopampa, Silver
|
153
|
906
|
3,127
|
4,097
|
||||||||||||
|
Orcopampa, Copper
|
0
|
104
|
0
|
255
|
||||||||||||
|
Uchucchacua, Gold
|
0
|
42
|
5
|
139
|
||||||||||||
|
Uchucchacua, Silver
|
24,531
|
22,484
|
99,500
|
103,014
|
||||||||||||
|
Uchucchacua, Lead
|
4,955
|
4,143
|
16,554
|
12,942
|
||||||||||||
|
Uchucchacua, Zinc
|
6,415
|
4,667
|
20,646
|
12,769
|
||||||||||||
|
Tambomayo, Gold
|
15,944
|
15,627
|
58,475
|
34,907
|
||||||||||||
|
Tambomayo, Silver
|
4,644
|
5,729
|
20,969
|
11,791
|
||||||||||||
|
Tambomayo, Zinc
|
583
|
912
|
2,597
|
2,046
|
||||||||||||
|
Tambomayo, Lead
|
1,987
|
2,486
|
7,050
|
3,419
|
||||||||||||
|
La Zanja, Gold
|
15,410
|
26,088
|
65,128
|
99,304
|
||||||||||||
|
La Zanja, Silver
|
518
|
875
|
2,499
|
2,922
|
||||||||||||
|
El Brocal, Gold
|
1,573
|
1,985
|
7,770
|
7,129
|
||||||||||||
|
El Brocal, Silver
|
5,669
|
4,773
|
19,388
|
19,185
|
||||||||||||
|
El Brocal, Lead
|
5,061
|
3,935
|
17,106
|
15,563
|
||||||||||||
|
El Brocal, Zinc
|
9,618
|
11,792
|
42,651
|
45,929
|
||||||||||||
|
El Brocal, Copper
|
34,488
|
28,724
|
115,752
|
94,021
|
||||||||||||
|
Non Mining Units
|
1,434
|
3,837
|
5,343
|
13,927
|
||||||||||||
|
Consolidated Cost of sales, excluding depreciation and amortization
|
160,249
|
181,783
|
629,802
|
640,387
|
||||||||||||
|
|
||||||||||||||||
|
Set forth below is a reconciliation of Exploration expenses in units in operation (by mine and mineral) to consolidated Exploration
expenses in mining units:
|
||||||||||||||||
|
|
||||||||||||||||
|
|
For the 3 months ended December 31
|
For the 12 months ended December 21
|
||||||||||||||
|
|
2018
|
2017
|
2018
|
2017
|
||||||||||||
|
Exploration expenses in units in
operation by mine and mineral
|
(in thousands of US$)
|
|||||||||||||||
|
Julcani, Gold
|
0
|
0
|
6
|
0
|
||||||||||||
|
Julcani, Silver
|
1,785
|
2,603
|
8,149
|
11,613
|
||||||||||||
|
Julcani, Lead
|
86
|
388
|
461
|
1,340
|
||||||||||||
|
Julcani, Copper
|
5
|
7
|
30
|
55
|
||||||||||||
|
Mallay, Gold
|
0
|
0
|
2
|
58
|
||||||||||||
|
Mallay, Silver
|
15
|
206
|
216
|
2,134
|
||||||||||||
|
Mallay, Lead
|
8
|
101
|
107
|
1,163
|
||||||||||||
|
Mallay, Zinc
|
27
|
235
|
288
|
2,262
|
||||||||||||
|
Orcopampa, Gold
|
4,409
|
10,717
|
28,559
|
37,286
|
||||||||||||
|
Orcopampa, Silver
|
36
|
324
|
1,004
|
1,443
|
||||||||||||
|
Orcopampa, Copper
|
0
|
37
|
0
|
90
|
||||||||||||
|
Uchucchacua, Gold
|
0
|
8
|
1
|
29
|
||||||||||||
|
Uchucchacua, Silver
|
3,533
|
4,209
|
15,210
|
21,639
|
||||||||||||
|
Uchucchacua, Lead
|
714
|
776
|
2,531
|
2,719
|
||||||||||||
|
Uchucchacua, Zinc
|
924
|
874
|
3,156
|
2,682
|
||||||||||||
|
Tambomayo, Gold
|
4,792
|
3,556
|
13,490
|
6,386
|
||||||||||||
|
Tambomayo, Silver
|
1,396
|
1,304
|
4,838
|
2,157
|
||||||||||||
|
Tambomayo, Lead
|
175
|
208
|
599
|
374
|
||||||||||||
|
Tambomayo, Zinc
|
597
|
566
|
1,626
|
626
|
||||||||||||
|
La Zanja, Gold
|
2
|
16
|
71
|
847
|
||||||||||||
|
La Zanja, Silver
|
0
|
1
|
3
|
25
|
||||||||||||
|
El Brocal, Gold
|
62
|
0
|
383
|
0
|
||||||||||||
|
El Brocal, Silver
|
222
|
0
|
956
|
0
|
||||||||||||
|
El Brocal, Lead
|
198
|
0
|
844
|
0
|
||||||||||||
|
El Brocal, Zinc
|
376
|
0
|
2,104
|
0
|
||||||||||||
|
El Brocal, Copper
|
1,349
|
0
|
5,709
|
0
|
||||||||||||
|
Non Mining Units
|
0
|
0
|
0
|
0
|
||||||||||||
|
Consolidated Exploration expenses in units in operation
|
20,710
|
26,135
|
90,343
|
94,928
|
||||||||||||
|
|
Compañía de Minas Buenaventura S.A.A.
Fourth Quarter 2018 Results
Page 17 of 27
|
|
Set forth below is a reconciliation of Commercial Deductions in units in operation (by mine and mineral)
|
||||||||||||||||
|
to consolidated Commercial deductions:
|
||||||||||||||||
|
|
||||||||||||||||
|
|
For the 3 months ended December 31
|
For the 12 months ended December 21
|
||||||||||||||
|
|
2018
|
2017
|
2018
|
2017
|
||||||||||||
|
Commercial Deductions in units in
operation by mine and mineral
|
(in thousands of US$)
|
|||||||||||||||
|
Julcani, Gold
|
0
|
0
|
3
|
0
|
||||||||||||
|
Julcani, Silver
|
806
|
586
|
3,390
|
3,676
|
||||||||||||
|
Julcani, Lead
|
38
|
89
|
191
|
422
|
||||||||||||
|
Julcani, Copper
|
3
|
1
|
12
|
19
|
||||||||||||
|
Mallay, Gold
|
0
|
1 | 5 | 70 | ||||||||||||
|
Mallay, Silver
|
68
|
546
|
888
|
2,441
|
||||||||||||
|
Mallay, Lead
|
29
|
268
|
435
|
1,336
|
||||||||||||
|
Mallay, Zinc
|
653
|
660
|
1,853
|
2,940
|
||||||||||||
|
Orcopampa, Gold
|
69
|
238
|
778
|
918
|
||||||||||||
|
Orcopampa, Silver
|
-3
|
44
|
107
|
181
|
||||||||||||
|
Orcopampa, Copper
|
-8
|
18
|
-11 | 46 | ||||||||||||
|
Uchucchacua, Gold
|
-7
|
12
|
0 | 41 | ||||||||||||
|
Uchucchacua, Silver
|
6,318
|
8,380
|
29,986
|
35,851
|
||||||||||||
|
Uchucchacua, Lead
|
598
|
1,489
|
3,092
|
4,350
|
||||||||||||
|
Uchucchacua, Zinc
|
2,626
|
5,173
|
8,367
|
14,286
|
||||||||||||
|
Tambomayo, Gold
|
316
|
35
|
644
|
110
|
||||||||||||
|
Tambomayo, Silver
|
362
|
229
|
1,211
|
1,029
|
||||||||||||
|
Tambomayo, Lead
|
41
|
134
|
590
|
419
|
||||||||||||
|
Tambomayo, Zinc
|
865
|
397
|
2,164
|
797
|
||||||||||||
|
La Zanja, Gold
|
52
|
59
|
319
|
258
|
||||||||||||
|
La Zanja, Silver
|
2
|
1
|
21
|
5
|
||||||||||||
|
El Brocal, Gold
|
1,400
|
2,326
|
7,369
|
9,280
|
||||||||||||
|
El Brocal, Silver
|
2,540
|
3,409
|
9,125
|
14,362
|
||||||||||||
|
El Brocal, Lead
|
744
|
1,860
|
2,446
|
8,592
|
||||||||||||
|
El Brocal, Zinc
|
3,107
|
6,636
|
11,459
|
33,905
|
||||||||||||
|
El Brocal, Copper
|
29,697
|
32,824
|
111,419
|
118,590
|
||||||||||||
|
Non Mining Units
|
0
|
0
|
0
|
0
|
||||||||||||
|
Consolidated Commercial deductions in units in operation
|
50,315
|
65,414
|
195,865
|
253,923
|
||||||||||||
|
|
||||||||||||||||
|
Set forth below is a reconciliation of Selling expenses (by mine and mineral) to consolidated
|
||||||||||||||||
|
Selling expenses:
|
||||||||||||||||
|
|
||||||||||||||||
|
|
For the 3 months ended December 31
|
For the 12 months ended December 31
|
||||||||||||||
|
|
2018
|
2017
|
2018
|
2017
|
||||||||||||
|
Selling expenses by mine and
mineral
|
(in thousands of US$)
|
|||||||||||||||
|
Julcani, Gold
|
0
|
0
|
0
|
0
|
||||||||||||
|
Julcani, Silver
|
114
|
129
|
336
|
540
|
||||||||||||
|
Julcani, Lead
|
5
|
19
|
19
|
62
|
||||||||||||
|
Julcani, Copper
|
0
|
0
|
1
|
3
|
||||||||||||
|
Mallay, Gold
|
0
|
0
|
1
|
11
|
||||||||||||
|
Mallay, Silver
|
43
|
81
|
202
|
397
|
||||||||||||
|
Mallay, Lead
|
22
|
40
|
101
|
216
|
||||||||||||
|
Mallay, Zinc
|
78
|
93
|
270
|
421
|
||||||||||||
|
Orcopampa, Gold
|
138
|
245
|
749
|
976
|
||||||||||||
|
Orcopampa, Silver
|
1
|
7
|
26
|
38
|
||||||||||||
|
Orcopampa, Copper
|
0
|
1
|
0
|
2 | ||||||||||||
|
Uchucchacua, Gold
|
0
|
3
|
0
|
6 | ||||||||||||
|
Uchucchacua, Silver
|
1,234
|
1,794
|
5,596
|
4,824
|
||||||||||||
|
Uchucchacua, Lead
|
249
|
331
|
931
|
606
|
||||||||||||
|
Uchucchacua, Zinc
|
323
|
372
|
1,161
|
598
|
||||||||||||
|
Tambomayo, Gold
|
784
|
641
|
1,999
|
927
|
||||||||||||
|
Tambomayo, Silver
|
228
|
235
|
717
|
313
|
||||||||||||
|
Tambomayo, Lead
|
29
|
37
|
89
|
54
|
||||||||||||
|
Tambomayo, Zinc
|
98
|
102
|
241
|
91
|
||||||||||||
|
La Zanja, Gold
|
181
|
351
|
755
|
1,018
|
||||||||||||
|
La Zanja, Silver
|
6
|
12
|
29
|
30
|
||||||||||||
|
El Brocal, Gold
|
81
|
117
|
468
|
428
|
||||||||||||
|
El Brocal, Silver
|
293
|
281
|
1,167
|
1,152
|
||||||||||||
|
El Brocal, Lead
|
262
|
232
|
1,030
|
934
|
||||||||||||
|
El Brocal, Zinc
|
498
|
694
|
2,568
|
2,757
|
||||||||||||
|
El Brocal, Copper
|
1,785
|
1,690
|
6,969
|
5,644
|
||||||||||||
|
Non Mining Units
|
702
|
506
|
2,097
|
2,039
|
||||||||||||
|
Consolidated Selling expenses
|
7,156
|
8,014
|
27,522
|
24,088
|
||||||||||||
|
|
||||||||||||||||
|
|
Compañía de Minas Buenaventura S.A.A.
Fourth Quarter 2018 Results
Page 18 of 27
|
|
|
JULCANI
|
|||||||||||
|
|
4Q 2018
|
4Q 2017
|
||||||||||
|
|
GOLD (OZ)
|
SILVER (OZ)
|
LEAD (MT)
|
ZINC (MT)
|
COPPER (MT)
|
TOTAL
|
GOLD (OZ)
|
SILVER (OZ)
|
LEAD (MT)
|
ZINC (MT)
|
COPPER (MT)
|
TOTAL
|
|
Cost of Sales (without D&A) (US$000)
|
-
|
6,218
|
298
|
-
|
18
|
6,533
|
-
|
6,674
|
995
|
-
|
18
|
7,687
|
|
Add:
|
||||||||||||
|
Exploration Expenses (US$000)
|
-
|
1,785
|
86
|
-
|
5
|
1,876
|
-
|
2,603
|
388
|
-
|
7
|
2,998
|
|
Commercial Deductions (US$000)
|
-0
|
806
|
38
|
-
|
3
|
846
|
0
|
586
|
89
|
-
|
1
|
676
|
|
Selling Expenses (US$000)
|
-
|
114
|
5
|
-
|
0
|
120
|
-
|
129.37
|
19.29
|
-
|
0.34
|
149
|
|
Cost Applicable to Sales (US$000)
|
-0
|
8,923
|
427
|
-
|
26
|
9,375
|
0
|
9,992
|
1,491
|
-
|
26
|
11,510
|
|
Divide:
|
||||||||||||
|
Volume Sold
|
-
|
635,338
|
237
|
-
|
4
|
Not Applicable
|
-
|
330,359
|
312
|
-
|
4
|
Not Applicable
|
| CAS |
-
|
14.04
|
1,803
|
-
|
6,047
|
Not Applicable
|
-
|
30.25
|
4,782
|
-
|
6,417
|
Not Applicable
|
|
|
||||||||||||
|
|
MALLAY
|
|||||||||||
|
|
4Q 2018
|
4Q 2017
|
||||||||||
|
|
GOLD (OZ)
|
SILVER (OZ)
|
LEAD (MT)
|
ZINC (MT)
|
COPPER (MT)
|
TOTAL
|
GOLD (OZ)
|
SILVER (OZ)
|
LEAD (MT)
|
ZINC (MT)
|
COPPER (MT)
|
TOTAL
|
|
Cost of Sales (without D&A) (US$000)
|
6.71
|
627
|
319
|
1,144
|
-
|
2,097
|
-
|
1,901
|
932
|
2,167
|
-
|
5,000
|
|
Add:
|
||||||||||||
|
Exploration Expenses (US$000)
|
0
|
15
|
8
|
27
|
-
|
50
|
-
|
206
|
101
|
235
|
-
|
543
|
|
Commercial Deductions (US$000)
|
0
|
68
|
29
|
653
|
-
|
750
|
1
|
546
|
268
|
660
|
-
|
1,475
|
|
Selling Expenses (US$000)
|
0
|
43
|
22
|
78
|
-
|
143
|
-
|
81
|
40
|
93
|
-
|
214
|
|
Cost Applicable to Sales (US$000)
|
8
|
753
|
377
|
1,902
|
-
|
3,040
|
1
|
2,735
|
1,341
|
3,155
|
-
|
7,232
|
|
Divide:
|
||||||||||||
|
Volume Sold
|
9
|
97,106
|
387
|
931
|
-
|
Not Applicable
|
-
|
211,609
|
693
|
1,153
|
-
|
Not Applicable
|
| CAS |
849
|
7.76
|
974
|
2,044
|
-
|
Not Applicable
|
-
|
12.92
|
1,936
|
2,737
|
-
|
Not Applicable
|
|
|
- 0.40
|
|||||||||||
|
|
ORCOPAMPA
|
|||||||||||
|
|
4Q 2018
|
4Q 2017
|
||||||||||
|
|
GOLD (OZ)
|
SILVER (OZ)
|
LEAD (MT)
|
ZINC (MT)
|
COPPER (MT)
|
TOTAL
|
GOLD (OZ)
|
SILVER (OZ)
|
LEAD (MT)
|
ZINC (MT)
|
COPPER (MT)
|
TOTAL
|
|
Cost of Sales (without D&A) (US$000)
|
18,635
|
153
|
-
|
-
|
-
|
18,788
|
29,988
|
906
|
-
|
-
|
104
|
30,998
|
|
Add:
|
-
|
|||||||||||
|
Exploration Expenses (US$000)
|
4,409
|
36
|
-
|
-
|
-
|
4,445
|
10,717
|
324
|
-
|
-
|
37
|
11,078
|
|
Commercial Deductions (US$000)
|
69
|
-3
|
-
|
-
|
-8
|
58
|
238
|
44
|
-
|
-
|
18
|
300
|
|
Selling Expenses (US$000)
|
138
|
1
|
-
|
-
|
-
|
139
|
245
|
7
|
-
|
-
|
1
|
253
|
|
Cost Applicable to Sales (US$000)
|
23,250
|
188
|
-
|
-
|
-8
|
23,430
|
41,188
|
1,281
|
-
|
-
|
159
|
42,628
|
|
Divide:
|
||||||||||||
|
Volume Sold
|
13,405
|
12,129
|
-
|
-
|
-
|
Not Applicable
|
55,812
|
130,932
|
-
|
-
|
34
|
Not Applicable
|
| CAS |
1,734
|
15.52
|
-
|
-
|
-
|
Not Applicable
|
738
|
9.79
|
-
|
-
|
4,707
|
Not Applicable
|
|
|
||||||||||||
|
|
UCHUCCHACUA
|
|||||||||||
|
|
4Q 2018
|
4Q 2017
|
||||||||||
|
|
GOLD (OZ)
|
SILVER (OZ)
|
LEAD (MT)
|
ZINC (MT)
|
COPPER (MT)
|
TOTAL
|
GOLD (OZ)
|
SILVER (OZ)
|
LEAD (MT)
|
ZINC (MT)
|
COPPER (MT)
|
TOTAL
|
|
Cost of Sales (without D&A) (US$000)
|
-
|
24,531
|
4,955
|
6,415
|
-
|
35,901
|
42
|
22,484
|
4,143
|
4,667
|
-
|
31,336
|
|
Add:
|
||||||||||||
|
Exploration Expenses (US$000)
|
-
|
3,533
|
714
|
924
|
-
|
5,171
|
8
|
4,209
|
776
|
874
|
-
|
5,866
|
|
Commercial Deductions (US$000)
|
-7
|
6,318
|
598
|
2,626
|
-
|
9,535
|
12
|
8,380
|
1,489
|
5,173
|
-
|
15,053
|
|
Selling Expenses (US$000)
|
-
|
1,234
|
249
|
323
|
-
|
1,806
|
3
|
1,794
|
331
|
372
|
-
|
2,500
|
|
Cost Applicable to Sales (US$000)
|
-7
|
35,616
|
6,517
|
10,287
|
-
|
52,413
|
65
|
36,867
|
6,737
|
11,086
|
-
|
54,755
|
|
Divide:
|
||||||||||||
|
Volume Sold
|
9
|
2,949,234
|
4,553
|
4,328
|
-
|
Not Applicable
|
68
|
3,747,035
|
4,365
|
3,692
|
-
|
Not Applicable
|
| CAS |
-
|
12.08
|
1,431
|
2,377
|
-
|
No Applicable
|
955
|
9.84
|
1,544
|
3,003
|
-
|
No Applicable
|
|
|
||||||||||||
|
|
TAMBOMAYO
|
|||||||||||
|
|
4Q 2018
|
4Q 2017
|
||||||||||
|
|
GOLD (OZ)
|
SILVER (OZ)
|
LEAD (MT)
|
ZINC (MT)
|
COPPER (MT)
|
TOTAL
|
GOLD (OZ)
|
SILVER (OZ)
|
LEAD (MT)
|
ZINC (MT)
|
COPPER (MT)
|
TOTAL
|
|
Cost of Sales (without D&A) (US$000)
|
15,944
|
4,644
|
583
|
1,987
|
-
|
23,159
|
15,627
|
5,729
|
912
|
2,485.66
|
-
|
24,754
|
|
Add:
|
||||||||||||
|
Exploration Expenses (US$000)
|
4,792
|
1,396
|
175
|
597
|
-
|
6,960
|
3,556
|
1,304
|
208
|
566
|
-
|
5,633
|
|
Commercial Deductions (US$000)
|
316
|
362
|
41
|
865
|
-
|
1,584
|
35
|
229
|
134
|
397
|
-
|
796
|
|
Selling Expenses (US$000)
|
784
|
228
|
29
|
98
|
-
|
1,139
|
641
|
235
|
37
|
102
|
-
|
1,016
|
|
Cost Applicable to Sales (US$000)
|
21,836
|
6,630
|
828
|
3,548
|
-
|
32,842
|
19,859
|
7,498
|
1,291
|
3,551
|
-
|
32,199
|
|
Divide:
|
||||||||||||
|
Volume Sold
|
25,691
|
662,978
|
709
|
1,769
|
-
|
Not Applicable
|
31,491
|
884,088
|
885
|
1,906
|
-
|
Not Applicable
|
| CAS |
850
|
10.00
|
1,168
|
2,005
|
-
|
No Applicable
|
631
|
8.48
|
1,459
|
1,863
|
-
|
No Applicable
|
|
|
JULCANI
|
|||||||||||
|
|
FY 2018
|
FY 2017
|
||||||||||
|
|
GOLD (OZ)
|
SILVER (OZ)
|
LEAD (MT)
|
ZINC (MT)
|
COPPER (MT)
|
TOTAL
|
GOLD (OZ)
|
SILVER (OZ)
|
LEAD (MT)
|
ZINC (MT)
|
COPPER (MT)
|
TOTAL
|
|
Cost of Sales (without D&A) (US$000)
|
19
|
23,608
|
1,335
|
-
|
86
|
25,047
|
0
|
26,413
|
3,048
|
-
|
126
|
29,587
|
|
Add:
|
||||||||||||
|
Exploration Expenses (US$000)
|
6
|
8,149
|
461
|
-
|
30
|
8,646
|
0
|
11,613
|
1,340
|
-
|
55
|
13,009
|
|
Commercial Deductions (US$000)
|
3
|
3,390
|
191
|
-
|
12
|
3,596
|
-0
|
3,676
|
422
|
-
|
19
|
4,117
|
|
Selling Expenses (US$000)
|
0
|
336
|
19
|
-
|
1
|
356
|
0
|
540
|
62
|
-
|
3
|
605
|
|
Cost Applicable to Sales (US$000)
|
28
|
35,483
|
2,006
|
-
|
128
|
37,645
|
-0
|
42,242
|
4,872
|
-
|
202
|
47,317
|
|
Divide:
|
||||||||||||
|
Volume Sold
|
11
|
2,368,497
|
915
|
-
|
17
|
Not Applicable
|
21
|
2,466,846
|
1,916
|
-
|
32
|
No Aplicable
|
| CAS |
2,507
|
14.98
|
2,191
|
-
|
7,392
|
No Applicable
|
-
|
17.12
|
2,543
|
-
|
6,318
|
No Applicable
|
|
|
||||||||||||
|
|
MALLAY
|
|||||||||||
|
|
FY 2018
|
FY 2017
|
||||||||||
|
|
GOLD (OZ)
|
SILVER (OZ)
|
LEAD (MT)
|
ZINC (MT)
|
COPPER (MT)
|
TOTAL
|
GOLD (OZ)
|
SILVER (OZ)
|
LEAD (MT)
|
ZINC (MT)
|
COPPER (MT)
|
TOTAL
|
|
Cost of Sales (without D&A) (US$000)
|
28
|
3,968
|
1,974
|
5,285
|
-
|
11,255
|
225
|
8,204
|
4,470
|
8,696
|
-
|
21,594
|
|
Add:
|
||||||||||||
|
Exploration Expenses (US$000)
|
2
|
216
|
107
|
288
|
-
|
613
|
58
|
2,134
|
1,163
|
2,262
|
-
|
5,617
|
|
Commercial Deductions (US$000)
|
5
|
888
|
435
|
1,853
|
-
|
3,182
|
70
|
2,441
|
1,336
|
2,940
|
-
|
6,787
|
|
Selling Expenses (US$000)
|
1
|
202
|
101
|
270
|
-
|
574
|
11
|
397
|
216
|
421
|
-
|
1,045
|
|
Cost Applicable to Sales (US$000)
|
36
|
5,275
|
2,617
|
7,695
|
-
|
15,624
|
364
|
13,176
|
7,185
|
14,318
|
-
|
35,042
|
|
Divide:
|
||||||||||||
|
Volume Sold
|
40
|
458,671
|
1,633
|
3,369
|
-
|
Not Applicable
|
346
|
993,040
|
3,804
|
5,926
|
-
|
Not Applicable
|
| CAS |
924
|
11.50
|
1,603
|
2,284
|
-
|
No Applicable
|
1,052
|
13.27
|
1,889
|
2,416
|
-
|
No Applicable
|
|
|
||||||||||||
|
|
ORCOPAMPA
|
|||||||||||
|
|
FY 2018
|
FY 2017
|
||||||||||
|
|
GOLD (OZ)
|
SILVER (OZ)
|
LEAD (MT)
|
ZINC (MT)
|
COPPER (MT)
|
TOTAL
|
GOLD (OZ)
|
SILVER (OZ)
|
LEAD (MT)
|
ZINC (MT)
|
COPPER (MT)
|
TOTAL
|
|
Cost of Sales (without D&A) (US$000)
|
88,942
|
3,127
|
-
|
-
|
-
|
92,069
|
105,848
|
4,097
|
-
|
-
|
255
|
110,200
|
|
Add:
|
||||||||||||
|
Exploration Expenses (US$000)
|
28,559
|
1,004
|
-
|
-
|
-
|
29,563
|
37,286
|
1,443
|
-
|
-
|
90
|
38,819
|
|
Commercial Deductions (US$000)
|
778
|
107
|
-
|
-
|
-11
|
874
|
918
|
181
|
-
|
-
|
46
|
1,144
|
|
Selling Expenses (US$000)
|
749
|
26
|
-
|
-
|
-
|
775
|
976
|
38
|
-
|
-
|
2
|
1,016
|
|
Cost Applicable to Sales (US$000)
|
119,028
|
4,264
|
-
|
-
|
-11
|
123,281
|
145,028
|
5,759
|
-
|
-
|
393
|
151,180
|
|
Divide:
|
||||||||||||
|
Volume Sold
|
116,719
|
335,761
|
-
|
-
|
42
|
Not Applicable
|
195,278
|
574,591
|
-
|
-
|
91
|
Not Applicable
|
| CAS |
1,020
|
12.70
|
-
|
-
|
-
|
No Applicable
|
743
|
10.02
|
-
|
-
|
4,307
|
No Applicable
|
|
|
||||||||||||
|
|
UCHUCCHACUA
|
|||||||||||
|
|
FY 2018
|
FY 2017
|
||||||||||
|
|
GOLD (OZ)
|
SILVER (OZ)
|
LEAD (MT)
|
ZINC (MT)
|
COPPER (MT)
|
TOTAL
|
GOLD (OZ)
|
SILVER (OZ)
|
LEAD (MT)
|
ZINC (MT)
|
COPPER (MT)
|
TOTAL
|
|
Cost of Sales (without D&A) (US$000)
|
5
|
99,500
|
16,554
|
20,646
|
-
|
136,705
|
139
|
103,014
|
12,942
|
12,769
|
-
|
128,864
|
|
Add:
|
||||||||||||
|
Exploration Expenses (US$000)
|
1
|
15,210
|
2,531
|
3,156
|
-
|
20,898
|
29
|
21,639
|
2,719
|
2,682
|
-
|
27,069
|
|
Commercial Deductions (US$000)
|
0
|
29,986
|
3,092
|
8,367
|
-
|
41,446
|
41
|
35,851
|
4,350
|
14,286
|
-
|
54,529
|
|
Selling Expenses (US$000)
|
0
|
5,596
|
931
|
1,161
|
-
|
7,689
|
6
|
4,824
|
606
|
598
|
-
|
6,035
|
|
Cost Applicable to Sales (US$000)
|
6
|
150,293
|
23,108
|
33,330
|
-
|
206,738
|
215
|
165,329
|
20,617
|
30,336
|
-
|
216,496
|
|
Divide:
|
||||||||||||
|
Volume Sold
|
216
|
14,443,456
|
17,071
|
16,811
|
-
|
Not Applicable
|
201
|
15,583,553
|
13,127
|
10,281
|
-
|
Not Applicable
|
| CAS |
27
|
10.41
|
1,354
|
1,983
|
-
|
No Applicable
|
1,069
|
10.61
|
1,571
|
2,951
|
-
|
No Applicable
|
|
|
||||||||||||
|
|
TAMBOMAYO
|
|||||||||||
|
|
FY 2018
|
FY 2017
|
||||||||||
|
|
GOLD (OZ)
|
SILVER (OZ)
|
LEAD (MT)
|
ZINC (MT)
|
COPPER (MT)
|
TOTAL
|
GOLD (OZ)
|
SILVER (OZ)
|
LEAD (MT)
|
ZINC (MT)
|
COPPER (MT)
|
TOTAL
|
|
Cost of Sales (without D&A) (US$000)
|
58,475
|
20,969
|
2,597
|
7,050
|
-
|
89,090
|
34,907
|
11,791
|
2,046
|
3,419
|
-
|
52,163
|
|
Add:
|
||||||||||||
|
Exploration Expenses (US$000)
|
13,490
|
4,838
|
599
|
1,626
|
-
|
20,553
|
6,386
|
2,157
|
374
|
626
|
-
|
9,543
|
|
Commercial Deductions (US$000)
|
644
|
1,211
|
590
|
2,164
|
-
|
4,609
|
110
|
1,029
|
419
|
797
|
-
|
2,354
|
|
Selling Expenses (US$000)
|
1,999
|
717
|
89
|
241
|
-
|
3,046
|
927
|
313
|
54
|
91
|
-
|
1,386
|
|
Cost Applicable to Sales (US$000)
|
74,608
|
27,734
|
3,875
|
11,080
|
-
|
117,298
|
42,330
|
15,290
|
2,893
|
4,932
|
-
|
65,446
|
|
Divide:
|
||||||||||||
|
Volume Sold
|
119,211
|
3,570,382
|
3,268
|
7,143
|
-
|
Not Applicable
|
63,130
|
1,621,611
|
1,769
|
2,398
|
-
|
Not Applicable
|
| CAS |
626
|
7.77
|
1,186
|
1,551
|
-
|
No Applicable
|
671
|
9.43
|
1,635
|
2,057
|
-
|
Not Applicable
|
|
|
Compañía de Minas Buenaventura S.A.A.
Fourth Quarter 2018 Results
Page 19 of 27
|
|
|
BROCAL
|
|||||||||||
|
|
4Q 2018
|
4Q 2017
|
||||||||||
|
|
GOLD (OZ)
|
SILVER (OZ)
|
LEAD (MT)
|
ZINC (MT)
|
COPPER (MT)
|
TOTAL
|
GOLD (OZ)
|
SILVER (OZ)
|
LEAD (MT)
|
ZINC (MT)
|
COPPER (MT)
|
TOTAL
|
|
Cost of Sales (without D&A) (US$000)
|
1,573
|
5,669
|
5,061
|
9,618
|
34,488
|
56,409
|
1,985
|
4,773
|
3,935
|
11,792
|
28,724
|
51,208
|
|
Add:
|
||||||||||||
|
Exploration Expenses (US$000)
|
62
|
222
|
198
|
376
|
1,349
|
2,206
|
-
|
-
|
-
|
-
|
-
|
-
|
|
Commercial Deductions (US$000)
|
1,400
|
2,540
|
744
|
3,107
|
29,697
|
37,487
|
2,326
|
3,409
|
1,860
|
6,636
|
32,824
|
47,055
|
|
Selling Expenses (US$000)
|
81
|
293
|
262
|
498
|
1,785
|
2,920
|
117
|
281
|
232
|
694
|
1,690
|
3,013
|
|
Cost Applicable to Sales (US$000)
|
3,116
|
8,723
|
6,265
|
13,599
|
67,319
|
99,022
|
4,427
|
8,463
|
6,026
|
19,121
|
63,239
|
101,276
|
|
Divide:
|
||||||||||||
|
Volume Sold
|
2,482
|
773,051
|
5,248
|
8,020
|
11,523
|
Not Applicable
|
4,429
|
846,928
|
4,578
|
9,285
|
11,566
|
Not Applicable
|
| CAS |
1,256
|
11.28
|
1,194
|
1,696
|
5,842
|
Not Applicable
|
1,000
|
9.99
|
1,316
|
2,059
|
5,468
|
Not Applicable
|
|
|
||||||||||||
|
|
NON MINING COMPANIE
|
|||||||||||
|
|
4Q 2018
|
4Q 2017
|
||||||||||
|
|
GOLD (OZ)
|
SILVER (OZ)
|
LEAD (MT)
|
ZINC (MT)
|
COPPER (MT)
|
TOTAL
|
GOLD (OZ)
|
SILVER (OZ)
|
LEAD (MT)
|
ZINC (MT)
|
COPPER (MT)
|
TOTAL
|
|
Cost of Sales (without D&A) (US$000)
|
-
|
-
|
-
|
-
|
-
|
1,434
|
-
|
-
|
-
|
-
|
-
|
3,837
|
|
Add:
|
-
|
-
|
||||||||||
|
Selling Expenses (US$000)
|
-
|
-
|
-
|
-
|
-
|
702
|
-
|
-
|
-
|
-
|
-
|
506
|
|
Total (US$000)
|
-
|
-
|
-
|
-
|
-
|
2,136
|
-
|
-
|
-
|
-
|
-
|
4,343
|
|
|
||||||||||||
|
|
BUENAVENTURA CONSOLIDATED
|
|||||||||||
|
|
4Q 2018
|
4Q 2017
|
||||||||||
|
|
GOLD (OZ)
|
SILVER (OZ)
|
LEAD (MT)
|
ZINC (MT)
|
COPPER (MT)
|
TOTAL
|
GOLD (OZ)
|
SILVER (OZ)
|
LEAD (MT)
|
ZINC (MT)
|
COPPER (MT)
|
TOTAL
|
|
Cost of Sales (without D&A) (US$000)
|
51,569
|
42,360
|
11,216
|
19,164
|
34,506
|
160,249
|
73,729
|
43,343
|
10,916
|
21,112
|
28,845
|
181,783
|
|
Add:
|
||||||||||||
|
Exploration Expenses (US$000)
|
9,264
|
6,988
|
1,180
|
1,925
|
1,354
|
20,710
|
14,297
|
8,647
|
1,472
|
1,674
|
44
|
26,135
|
|
Commercial Deductions (US$000)
|
1,831
|
10,091
|
1,450
|
7,252
|
29,691
|
50,315
|
2,670
|
13,195
|
3,839
|
12,867
|
32,843
|
65,414
|
|
Selling Expenses (US$000)
|
1,185
|
1,920
|
567
|
996
|
1,786
|
7,156
|
1,357
|
2,540
|
659
|
1,261
|
1,691
|
8,014
|
|
Cost Applicable to Sales (US$000)
|
63,849
|
61,359
|
14,413
|
29,336
|
67,336
|
238,430
|
92,054
|
67,724
|
16,887
|
36,914
|
63,424
|
281,345
|
|
Divide:
|
||||||||||||
|
Volume Sold
|
61,830
|
5,188,983
|
11,134
|
15,047
|
11,528
|
Not Applicable
|
122,085
|
6,228,219
|
10,833
|
16,036
|
11,604
|
Not Applicable
|
| CAS |
1,033
|
11.82
|
1,295
|
1,950
|
5,841
|
Not Applicable
|
754
|
10.87
|
1,559
|
2,302
|
5,466
|
Not Applicable
|
|
|
||||||||||||
|
|
COIMOLACHE
|
|||||||||||
|
|
4Q 2018
|
4Q 2017
|
||||||||||
|
|
GOLD (OZ)
|
SILVER (OZ)
|
LEAD (MT)
|
ZINC (MT)
|
COPPER (MT)
|
TOTAL
|
GOLD (OZ)
|
SILVER (OZ)
|
LEAD (MT)
|
ZINC (MT)
|
COPPER (MT)
|
TOTAL
|
|
Cost of Sales (without D&A) (US$000)
|
30,137
|
1,401
|
-
|
-
|
-
|
31,538
|
20,502
|
1,615
|
-
|
-
|
-
|
22,117
|
|
Add:
|
||||||||||||
|
Exploration Expenses (US$000)
|
7,493
|
348
|
-
|
-
|
-
|
7,841
|
5,340
|
421
|
-
|
-
|
-
|
5,761
|
|
Commercial Deductions (US$000)
|
172
|
9
|
-
|
-
|
-
|
181
|
161
|
8
|
-
|
-
|
-
|
169
|
|
Selling Expenses (US$000)
|
322
|
15
|
-
|
-
|
-
|
337
|
323
|
25
|
-
|
-
|
-
|
348
|
|
Cost Applicable to Sales (US$000)
|
38,124
|
1,773
|
-
|
-
|
-
|
39,897
|
26,326
|
2,069
|
-
|
-
|
-
|
28,395
|
|
Divide:
|
||||||||||||
|
Volume Sold
|
51,355
|
202,333
|
-
|
-
|
-
|
Not Applicable
|
47,580
|
288,356
|
-
|
-
|
-
|
Not Applicable
|
| CAS |
742
|
8.76
|
-
|
-
|
-
|
Not Applicable
|
553
|
7.17
|
-
|
-
|
-
|
Not Applicable
|
|
|
BROCAL
|
|||||||||||
|
|
FY 2018
|
FY 2017
|
||||||||||
|
|
GOLD (OZ)
|
SILVER (OZ)
|
LEAD (MT)
|
ZINC (MT)
|
COPPER (MT)
|
TOTAL
|
GOLD (OZ)
|
SILVER (OZ)
|
LEAD (MT)
|
ZINC (MT)
|
COPPER (MT)
|
TOTAL
|
|
Cost of Sales (without D&A) (US$000)
|
7,770
|
19,388
|
17,106
|
42,651
|
115,752
|
202,666
|
7,129
|
19,185
|
15,563
|
45,929
|
94,021
|
181,828
|
|
Add:
|
||||||||||||
|
Exploration Expenses (US$000)
|
383
|
956
|
844
|
2,104
|
5,709
|
9,996
|
-
|
-
|
-
|
-
|
-
|
-
|
|
Commercial Deductions (US$000)
|
7,369
|
9,125
|
2,446
|
11,459
|
111,419
|
141,818
|
9,280
|
14,362
|
8,592
|
33,905
|
118,590
|
184,728
|
|
Selling Expenses (US$000)
|
468
|
1,167
|
1,030
|
2,568
|
6,969
|
12,201
|
428
|
1,152
|
934
|
2,757
|
5,644
|
10,914
|
|
Cost Applicable to Sales (US$000)
|
15,990
|
30,637
|
21,425
|
58,781
|
239,849
|
366,681
|
16,836
|
34,699
|
25,090
|
82,591
|
218,254
|
377,470
|
|
Divide:
|
||||||||||||
|
Volume Sold
|
14,297
|
3,058,987
|
18,713
|
37,470
|
43,710
|
Not Applicable
|
15,881
|
3,253,899
|
19,415
|
43,120
|
42,633
|
Not Applicable
|
| CAS |
1,118
|
10.02
|
1,145
|
1,569
|
5,487
|
No Applicable
|
1,060
|
10.66
|
1,292
|
1,915
|
5,119
|
Not Applicable
|
|
|
||||||||||||
|
|
NON MINING COMPANIES
|
|||||||||||
|
|
FY 2018
|
FY 2017
|
||||||||||
|
|
GOLD (OZ)
|
SILVER (OZ)
|
LEAD (MT)
|
ZINC (MT)
|
COPPER (MT)
|
TOTAL
|
GOLD (OZ)
|
SILVER (OZ)
|
LEAD (MT)
|
ZINC (MT)
|
COPPER (MT)
|
TOTAL
|
|
Cost of Sales (without D&A) (US$000)
|
-
|
-
|
-
|
-
|
-
|
5,343
|
-
|
-
|
-
|
-
|
-
|
13,927
|
|
Add:
|
-
|
-
|
||||||||||
|
Selling Expenses (US$000)
|
-
|
-
|
-
|
-
|
-
|
2,097
|
-
|
-
|
-
|
-
|
-
|
2,039
|
|
Total (US$000)
|
-
|
-
|
-
|
-
|
-
|
7,440
|
-
|
-
|
-
|
-
|
-
|
15,966
|
|
|
||||||||||||
|
|
BUENAVENTURA CONSOLIDATE
|
|||||||||||
|
|
FY 2018
|
FY 2017
|
||||||||||
|
|
GOLD (OZ)
|
SILVER (OZ)
|
LEAD (MT)
|
ZINC (MT)
|
COPPER (MT)
|
TOTAL
|
GOLD (OZ)
|
SILVER (OZ)
|
LEAD (MT)
|
ZINC (MT)
|
COPPER (MT)
|
TOTAL
|
|
Cost of Sales (without D&A) (US$000)
|
220,366
|
173,059
|
39,565
|
75,631
|
115,837
|
629,802
|
247,551
|
175,626
|
38,068
|
70,813
|
94,402
|
640,387
|
|
Add:
|
||||||||||||
|
Exploration Expenses (US$000)
|
42,512
|
30,376
|
4,542
|
7,174
|
5,739
|
90,343
|
44,607
|
39,011
|
5,595
|
5,569
|
145
|
94,928
|
|
Commercial Deductions (US$000)
|
9,118
|
44,729
|
6,755
|
23,843
|
111,420
|
195,865
|
10,676
|
57,545
|
15,119
|
51,928
|
118,655
|
253,923
|
|
Selling Expenses (US$000)
|
3,973
|
8,074
|
2,169
|
4,239
|
6,970
|
27,522
|
3,367
|
7,294
|
1,873
|
3,867
|
5,648
|
24,088
|
|
Cost Applicable to Sales (US$000)
|
275,970
|
256,238
|
53,031
|
110,887
|
239,966
|
943,532
|
306,200
|
279,477
|
60,656
|
132,177
|
218,850
|
1,013,326
|
|
Divide:
|
||||||||||||
|
Volume Sold
|
324,864
|
24,464,648
|
41,601
|
64,793
|
43,770
|
Not Applicable
|
403,480
|
24,773,278
|
40,032
|
61,724
|
42,756
|
Not Applicable
|
| CAS |
849
|
10.47
|
1,275
|
1,711
|
5,482
|
Not Applicable
|
759
|
11.28
|
1,515
|
2,141
|
5,119
|
Not Applicable
|
|
|
||||||||||||
|
|
COIMOLACHE
|
|||||||||||
|
|
FY 2018
|
FY 2017
|
||||||||||
|
|
GOLD (OZ)
|
SILVER (OZ)
|
LEAD (MT)
|
ZINC (MT)
|
COPPER (MT)
|
TOTAL
|
GOLD (OZ)
|
SILVER (OZ)
|
LEAD (MT)
|
ZINC (MT)
|
COPPER (MT)
|
TOTAL
|
|
Cost of Sales (without D&A) (US$000)
|
95,581
|
5,468
|
-
|
-
|
-
|
101,049
|
65,010
|
4,679
|
-
|
-
|
-
|
69,689
|
|
Add:
|
||||||||||||
|
Exploration Expenses (US$000)
|
18,759
|
1,073
|
-
|
-
|
-
|
19,832
|
12,039
|
866
|
-
|
-
|
-
|
12,905
|
|
Commercial Deductions (US$000)
|
579
|
36
|
-
|
-
|
-
|
615
|
539
|
45
|
-
|
-
|
-
|
584
|
|
Selling Expenses (US$000)
|
1,074
|
61
|
-
|
-
|
-
|
1,135
|
883
|
64
|
-
|
-
|
-
|
947
|
|
Cost Applicable to Sales (US$000)
|
115,993
|
6,639
|
-
|
-
|
-
|
122,631
|
78,471
|
5,654
|
-
|
-
|
-
|
84,125
|
|
Divide:
|
||||||||||||
|
Volume Sold
|
171,770
|
791,404
|
-
|
-
|
-
|
Not Applicable
|
151,797
|
809,683
|
-
|
-
|
-
|
Not Applicable
|
| CAS |
675
|
8.39
|
-
|
-
|
-
|
No Applicable
|
517
|
6.98
|
-
|
-
|
-
|
Not Applicable
|
|
|
Compañía de Minas Buenaventura S.A.A.
Fourth Quarter 2018 Results
Page 20 of 27
|
|
Buenaventura
|
||||||||||||||||||||||||||||||||
|
All-in Sustaining Cost for 4Q18
|
||||||||||||||||||||||||||||||||
| Buenaventura1 | La Zanja | Tantahuatay | Attributable 2 | |||||||||||||||||||||||||||||
| 4Q18 | 4Q18 | 4Q18 |
4Q18 |
|||||||||||||||||||||||||||||
|
Au Ounces Sold BVN
|
39,114
|
|||||||||||||||||||||||||||||||
|
Au Ounces bought from La Zanja
|
||||||||||||||||||||||||||||||||
|
Au Ounces Sold Net
|
39,114
|
20,234
|
51,355
|
70,441
|
||||||||||||||||||||||||||||
| 4Q18
|
4Q18 | 4Q18
|
4Q18 | |||||||||||||||||||||||||||||
|
Income Statement & Cash Flow
|
US$ 000'
|
US$/Oz Au
|
US$ 000'
|
US$/Oz Au
|
US$ 000'
|
US$/Oz Au
|
US$ 000'
|
US$/Oz Au
|
||||||||||||||||||||||||
|
Cost of Sales3
|
93,295
|
2,385
|
16,323
|
807
|
31,537
|
614
|
114,601
|
1,627
|
||||||||||||||||||||||||
|
Exploration in Operating Units
|
18,502
|
473
|
2
|
0
|
7,841
|
153
|
21,647
|
307
|
||||||||||||||||||||||||
|
Royalties
|
1,179
|
30
|
0
|
0
|
1,179
|
17
|
||||||||||||||||||||||||||
|
Comercial Deductions4
|
12,774
|
327
|
54
|
3
|
181
|
4
|
12,875
|
183
|
||||||||||||||||||||||||
|
Selling Expenses
|
3,478
|
89
|
187
|
9
|
337
|
7
|
3,712
|
53
|
||||||||||||||||||||||||
|
Administrative Expenses
|
11,528
|
295
|
847
|
42
|
1,588
|
31
|
12,614
|
179
|
||||||||||||||||||||||||
|
Other, net
|
3,599
|
92
|
645
|
32
|
614
|
12
|
4,187
|
59
|
||||||||||||||||||||||||
|
Sustaining Capex5
|
11,934
|
305
|
792
|
39
|
19,659
|
383
|
20,237
|
287
|
||||||||||||||||||||||||
|
By-product Credit
|
-84,837
|
-2,169
|
-844
|
-42
|
-2,871
|
-56
|
-1,599
|
-23
|
||||||||||||||||||||||||
|
All-in Sustaining Cost
|
71,452
|
1,827
|
18,006
|
890
|
58,886
|
1,147
|
104,616
|
1,485
|
||||||||||||||||||||||||
|
*All-in Sustaining Cost does not include: Depreciation and Amortization, Stoppage of mining units, Exploration in
non-operating areas.
|
||||||||||||||||||||||||||||||||
Notes:
1. Non-consolidated financial statements for Compañia De Minas Buenaventura S.A.A.
2. Considers 100% from Compañia De Minas Buenaventura S.A.A., 53.06% from La Zanja and 40.095% from Tantahuatay.
3. For Buenaventura does not consider purchase of concentrate from La Zanja.
4. For all metals produced.
5. Sustaining Capex + Growth Capex equals Acquisitions of mining concessions, development costs, property, plant and equipment.
|
|
Compañía de Minas Buenaventura S.A.A.
Fourth Quarter 2018 Results
Page 21 of 27
|
|
Buenaventura
|
||||||||||||||||||||||||||||||||
|
All-in Sustaining Cost for 4Q17
|
||||||||||||||||||||||||||||||||
|
Buenaventura1
|
La Zanja
|
Tantahuatay
|
Attributable 2
|
|||||||||||||||||||||||||||||
| 4Q17 | 4Q17 | 4Q17 |
4Q17 |
|||||||||||||||||||||||||||||
|
Au Ounces Sold BVN
|
87,421
|
|||||||||||||||||||||||||||||||
|
Au Ounces bought from La Zanja
|
0
|
|||||||||||||||||||||||||||||||
|
Au Ounces Sold Net
|
87,421
|
30,608
|
47,580
|
122,739
|
||||||||||||||||||||||||||||
| 4Q17 | 4Q17 | 4Q17 | 4Q17 | |||||||||||||||||||||||||||||
|
Income Statement & Cash Flow
|
US$ 000'
|
US$/Oz Au
|
US$ 000'
|
US$/Oz Au
|
US$ 000'
|
US$/Oz Au
|
US$ 000'
|
US$/Oz Au
|
||||||||||||||||||||||||
|
Cost of Sales3
|
106,437
|
1,218
|
27,195
|
889
|
22,117
|
465
|
129,734
|
1,057
|
||||||||||||||||||||||||
|
Exploration in Operating Units
|
26,119
|
299
|
17
|
1
|
5,761
|
121
|
28,438
|
232
|
||||||||||||||||||||||||
|
Royalties
|
5,493
|
63
|
0
|
0
|
0
|
0
|
5,493
|
45
|
||||||||||||||||||||||||
|
Comercial Deductions4
|
18,299
|
209
|
60
|
2
|
169
|
4
|
18,399
|
150
|
||||||||||||||||||||||||
|
Selling Expenses
|
4,176
|
48
|
363
|
12
|
347
|
7
|
4,508
|
37
|
||||||||||||||||||||||||
|
Administrative Expenses
|
13,009
|
149
|
1,127
|
37
|
1,111
|
23
|
14,052
|
114
|
||||||||||||||||||||||||
|
Other, net
|
1,139
|
13
|
1,767
|
58
|
950
|
20
|
2,457
|
20
|
||||||||||||||||||||||||
|
Sustaining Capex5
|
22,403
|
256
|
7,704
|
252
|
20,193
|
424
|
34,588
|
282
|
||||||||||||||||||||||||
|
By-product Credit
|
-127,593
|
-1,460
|
-1,294
|
-42
|
-4,749
|
-100
|
-2,591
|
-21
|
||||||||||||||||||||||||
|
All-in Sustaining Cost
|
69,483
|
795
|
36,939
|
1,207
|
45,898
|
965
|
107,486
|
876
|
||||||||||||||||||||||||
|
*All-in Sustaining Cost does not include: Depreciation and Amortization, Stoppage of mining units, Exploration in
non-operating areas.
|
||||||||||||||||||||||||||||||||
|
Notes:
|
||||||||||||||||||||||||||||||||
|
1. Non-consolidated financial statements for Compañia De Minas Buenaventura S.A.A.
|
||||||||||||||||||||||||||||||||
|
2. Considers 100% from Compañia De Minas Buenaventura S.A.A., 53.06% from La Zanja and 40.095% from Tantahuatay.
|
||||||||||||||||||||||||||||||||
|
3. For Buenaventura does not consider purchase of concentrate from La Zanja.
|
||||||||||||||||||||||||||||||||
|
4. For all metals produced.
|
||||||||||||||||||||||||||||||||
|
5. Sustaining Capex + Growth Capex equals Acquisitions of mining concessions, development costs, property, plant and
equipment.
|
||||||||||||||||||||||||||||||||
|
|
Compañía de Minas Buenaventura S.A.A.
Fourth Quarter 2018 Results
Page 22 of 27
|
|
Buenaventura
|
||||||||||||||||||||||||||||||||
|
All-in Sustaining Cost for FY18
|
||||||||||||||||||||||||||||||||
|
Buenaventura1
|
La Zanja
|
Tantahuatay
|
Attributable 2
|
|||||||||||||||||||||||||||||
|
FY18
|
FY18
|
FY18
|
FY18
|
|||||||||||||||||||||||||||||
|
Au Ounces Sold BVN
|
236,197
|
|||||||||||||||||||||||||||||||
|
Au Ounces bought from La Zanja
|
||||||||||||||||||||||||||||||||
|
Au Ounces Sold Net
|
236,197
|
74,370
|
171,770
|
344,529
|
||||||||||||||||||||||||||||
|
FY18
|
FY18
|
FY18
|
FY18
|
|||||||||||||||||||||||||||||
|
Income Statement & Cash Flow
|
US$ 000'
|
US$/Oz Au
|
US$ 000'
|
US$/Oz Au
|
US$ 000'
|
US$/Oz Au
|
US$ 000'
|
US$/Oz Au
|
||||||||||||||||||||||||
|
Cost of Sales3
|
380,313
|
1,610
|
68,993
|
928
|
101,049
|
588
|
457,436
|
1,328
|
||||||||||||||||||||||||
|
Exploration in Operating Units
|
80,273
|
340
|
74
|
1
|
19,831
|
115
|
88,264
|
256
|
||||||||||||||||||||||||
|
Royalties
|
12,123
|
51
|
0
|
0
|
12,123
|
35
|
||||||||||||||||||||||||||
|
Comercial Deductions4
|
53,706
|
227
|
340
|
5
|
615
|
4
|
54,133
|
157
|
||||||||||||||||||||||||
|
Selling Expenses
|
12,964
|
55
|
784
|
11
|
1,135
|
7
|
13,835
|
40
|
||||||||||||||||||||||||
|
Administrative Expenses
|
60,081
|
254
|
3,435
|
46
|
5,644
|
33
|
64,167
|
186
|
||||||||||||||||||||||||
|
Other, net
|
22,056
|
93
|
669
|
9
|
343
|
2
|
22,548
|
65
|
||||||||||||||||||||||||
|
Sustaining Capex5
|
41,705
|
177
|
8,073
|
109
|
44,848
|
261
|
63,970
|
186
|
||||||||||||||||||||||||
|
By-product Credit
|
-440,668
|
-1,866
|
-3,582
|
-48
|
-12,217
|
-71
|
-6,799
|
-20
|
||||||||||||||||||||||||
|
All-in Sustaining Cost
|
222,552
|
942
|
78,786
|
1,059
|
161,248
|
939
|
329,008
|
955
|
||||||||||||||||||||||||
|
*All-in Sustaining Cost does not include: Depreciation and Amortization, Stoppage of mining units, Exploration in
non-operating areas.
|
||||||||||||||||||||||||||||||||
|
Notes:
|
||||||||||||||||||||||||||||||||
|
1. Non-consolidated financial statements for Compañia De Minas Buenaventura S.A.A.
|
||||||||||||||||||||||||||||||||
|
2. Considers 100% from Compañia De Minas Buenaventura S.A.A., 53.06% from La Zanja and 40.095% from Tantahuatay.
|
||||||||||||||||||||||||||||||||
|
3. For Buenaventura does not consider purchase of concentrate from La Zanja.
|
||||||||||||||||||||||||||||||||
|
4. For all metals produced.
|
||||||||||||||||||||||||||||||||
|
5. Sustaining Capex + Growth Capex equals Acquisitions of mining concessions, development costs, property, plant and
equipment.
|
||||||||||||||||||||||||||||||||
|
|
Compañía de Minas Buenaventura S.A.A.
Fourth Quarter 2018 Results
Page 23 of 27
|
|
Buenaventura
|
||||||||||||||||||||||||||||||||
|
All-in Sustaining Cost for FY17
|
||||||||||||||||||||||||||||||||
|
Buenaventura1
|
La Zanja
|
Tantahuatay
|
Attributable 2
|
|||||||||||||||||||||||||||||
|
FY17
|
FY17
|
FY17
|
FY17
|
|||||||||||||||||||||||||||||
|
Au Ounces Sold BVN
|
286,254
|
|||||||||||||||||||||||||||||||
|
Au Ounces bought from La Zanja
|
-27,278 |
|||||||||||||||||||||||||||||||
|
Au Ounces Sold Net
|
258,976
|
128,623
|
151,797
|
388,086
|
||||||||||||||||||||||||||||
|
FY17
|
FY17
|
FY17
|
FY17
|
|||||||||||||||||||||||||||||
|
Income Statement & Cash Flow
|
US$ 000'
|
US$/Oz Au
|
US$ 000'
|
US$/Oz Au
|
US$ 000'
|
US$/Oz Au
|
US$ 000'
|
US$/Oz Au
|
||||||||||||||||||||||||
|
Cost of Sales3
|
367,641
|
1,420
|
102,474
|
797
|
69,689
|
459
|
449,956
|
1,159
|
||||||||||||||||||||||||
|
Exploration in Operating Units
|
94,057
|
363
|
872
|
7
|
12,905
|
85
|
99,694
|
257
|
||||||||||||||||||||||||
|
Royalties
|
20,165
|
78
|
0
|
0
|
20,165
|
52
|
||||||||||||||||||||||||||
|
Comercial Deductions4
|
68,931
|
266
|
928
|
7
|
584
|
4
|
69,657
|
179
|
||||||||||||||||||||||||
|
Selling Expenses
|
10,298
|
40
|
881
|
7
|
946
|
6
|
11,145
|
29
|
||||||||||||||||||||||||
|
Administrative Expenses
|
53,003
|
205
|
2,814
|
22
|
3,829
|
25
|
56,031
|
144
|
||||||||||||||||||||||||
|
Other, net
|
6,445
|
25
|
2,339
|
18
|
587
|
4
|
7,921
|
20
|
||||||||||||||||||||||||
|
Sustaining Capex5
|
59,345
|
229
|
17,369
|
135
|
40,156
|
265
|
84,661
|
218
|
||||||||||||||||||||||||
|
By-product Credit
|
-459,049
|
-1,773
|
-4,434
|
-34
|
-13,642
|
-90
|
-7,822
|
-20
|
||||||||||||||||||||||||
|
All-in Sustaining Cost
|
220,835
|
853
|
123,243
|
958
|
115,055
|
758
|
332,359
|
856
|
||||||||||||||||||||||||
|
*All-in Sustaining Cost does not include: Depreciation and Amortization, Stoppage of mining units, Exploration in
non-operating areas.
|
||||||||||||||||||||||||||||||||
|
Notes:
|
||||||||||||||||||||||||||||||||
|
1. Non-consolidated financial statements for Compañia De Minas Buenaventura S.A.A.
|
||||||||||||||||||||||||||||||||
|
2. Considers 100% from Compañia De Minas Buenaventura S.A.A., 53.06% from La Zanja and 40.095% from Tantahuatay.
|
||||||||||||||||||||||||||||||||
|
3. For Buenaventura does not consider purchase of concentrate from La Zanja.
|
||||||||||||||||||||||||||||||||
|
4. For all metals produced.
|
||||||||||||||||||||||||||||||||
|
5. Sustaining Capex + Growth Capex equals Acquisitions of mining concessions, development costs, property, plant
and equipment.
|
||||||||||||||||||||||||||||||||
|
|
Compañía de Minas Buenaventura S.A.A.
Fourth Quarter 2018 Results
Page 24 of 27
|
|
Compañía de Minas Buenaventura S.A.A. and Subsidiaries
|
||||||||
|
Consolidated Statement of Financial Position
|
||||||||
|
As of December 31, 2018 and 2017
|
||||||||
|
2018
|
2017
|
|||||||
|
Assets
|
US$(000)
|
US$(000)
|
||||||
|
Current assets
|
||||||||
|
Cash and cash equivalents
|
369,200
|
214,551
|
||||||
|
Trade and other accounts receivable, net
|
211,715
|
314,308
|
||||||
|
Inventory, net
|
135,919
|
132,287
|
||||||
|
Income tax credit
|
24,396
|
23,165
|
||||||
|
Prepaid expenses
|
17,145
|
17,551
|
||||||
|
Hedge derivative financial instruments
|
2,759
|
-
|
||||||
|
761,134
|
701,862
|
|||||||
|
Non-current assets
|
||||||||
|
Trade and other receivables, net
|
40,593
|
44,191
|
||||||
|
Long-term inventory
|
3,812
|
3,238
|
||||||
|
Long-term income tax credit
|
319
|
3,413
|
||||||
|
Investment in associates
|
1,473,382
|
1,536,887
|
||||||
|
Mining concessions, development costs, property, plant and equipment, net
|
1,847,615
|
1,949,555
|
||||||
|
Investment properties, net
|
222
|
222
|
||||||
|
Deferred income tax asset, net
|
38,305
|
43,129
|
||||||
|
Prepaid expenses
|
26,578
|
27,555
|
||||||
|
Other assets
|
25,261
|
22,761
|
||||||
|
3,456,087
|
3,630,951
|
|||||||
|
Total assets
|
4,217,221
|
4,332,813
|
||||||
|
Liabilities and shareholders’ equity, net
|
||||||||
|
Current liabilities
|
||||||||
|
Bank loans
|
95,000
|
96,215
|
||||||
|
Trade and other payables
|
188,084
|
233,355
|
||||||
|
Provisions
|
68,172
|
76,847
|
||||||
|
Income tax payable
|
1,760
|
2,081
|
||||||
|
Financial obligations
|
46,166
|
83,991
|
||||||
|
Hedge derivative financial instruments
|
-
|
28,705
|
||||||
|
399,182
|
521,194
|
|||||||
|
Non-current liabilities
|
||||||||
|
Trade and other payables
|
639
|
663
|
||||||
|
Provisions
|
199,762
|
164,877
|
||||||
|
Financial obligations
|
540,896
|
549,092
|
||||||
|
Contingent consideration liability
|
15,755
|
17,570
|
||||||
|
Deferred income tax liability, net
|
31,422
|
15,790
|
||||||
|
788,474
|
747,992
|
|||||||
|
Total liabilities
|
1,187,656
|
1,269,186
|
||||||
|
Shareholders’ equity, net
|
||||||||
|
Capital stock
|
750,497
|
750,497
|
||||||
|
Investment shares
|
791
|
791
|
||||||
|
Additional paid-in capital
|
218,450
|
218,450
|
||||||
|
Legal reserve
|
163,115
|
163,071
|
||||||
|
Other reserves
|
269
|
269
|
||||||
|
Retained earnings
|
1,675,909
|
1,728,847
|
||||||
|
Other reserves of equity
|
(703
|
)
|
(13,888
|
)
|
||||
|
Shareholders’ equity, net attributable to owners of the parent
|
2,808,328
|
2,848,037
|
||||||
|
Non-controlling interest
|
221,237
|
215,590
|
||||||
|
Total shareholders’ equity, net
|
3,029,565
|
3,063,627
|
||||||
|
Total liabilities and shareholders’ equity, net
|
4,217,221
|
4,332,813
|
||||||
|
|
Compañía de Minas Buenaventura S.A.A.
Fourth Quarter 2018 Results
Page 25 of 27
|
|
Compañía de Minas Buenaventura S.A.A. and Subsidiaries
|
||||||||||||||||
|
Consolidated Statement of Income
|
||||||||||||||||
|
For the three and twelve month periods ended December 31, 2018 and 2017
|
||||||||||||||||
|
For the three month period ended December, 31
|
For the twelve month period ended December, 31
|
|||||||||||||||
|
2018
|
2017
|
2018
|
2017
|
|||||||||||||
|
Continuing operations
|
US$(000)
|
US$(000)
|
US$(000)
|
US$(000)
|
||||||||||||
|
Operating income
|
||||||||||||||||
|
Net sales of goods
|
239,846
|
356,503
|
1,122,995
|
1,223,942
|
||||||||||||
|
Net sales of services
|
10,718
|
8,983
|
24,001
|
29,697
|
||||||||||||
|
Royalty income
|
5,460
|
5,144
|
20,385
|
20,739
|
||||||||||||
|
Total operating income
|
256,024
|
370,630
|
1,167,381
|
1,274,378
|
||||||||||||
|
Operating costs
|
||||||||||||||||
|
Cost of sales, without considering depreciation and amortization
|
(159,152
|
)
|
(178,453
|
)
|
(625,484
|
)
|
(627,433
|
)
|
||||||||
|
Cost of services, without considering depreciation and amortization
|
(1,097
|
)
|
(3,330
|
)
|
(4,318
|
)
|
(12,954
|
)
|
||||||||
|
Depreciation and amortization
|
(63,033
|
)
|
(74,123
|
)
|
(241,286
|
)
|
(213,722
|
)
|
||||||||
|
Exploration in operating units
|
(20,710
|
)
|
(26,135
|
)
|
(90,343
|
)
|
(94,928
|
)
|
||||||||
|
Mining royalties
|
(3,351
|
)
|
(8,662
|
)
|
(21,526
|
)
|
(31,217
|
)
|
||||||||
|
Total operating costs
|
(247,343
|
)
|
(290,703
|
)
|
(982,957
|
)
|
(980,254
|
)
|
||||||||
|
Gross profit
|
8,681
|
79,927
|
184,424
|
294,124
|
||||||||||||
|
Operating expenses, net
|
||||||||||||||||
|
Administrative expenses
|
(17,105
|
)
|
(22,657
|
)
|
(78,760
|
)
|
(83,597
|
)
|
||||||||
|
Exploration in non-operating areas
|
(11,461
|
)
|
(6,046
|
)
|
(36,307
|
)
|
(18,262
|
)
|
||||||||
|
Selling expenses
|
(7,156
|
)
|
(8,014
|
)
|
(27,522
|
)
|
(24,088
|
)
|
||||||||
|
Reversal (provision) for impairment of long-lived assets
|
5,693
|
(21,620
|
)
|
5,693
|
(21,620
|
)
|
||||||||||
|
Adjustment of component of stripping cost
|
-
|
(13,573
|
)
|
-
|
(13,573
|
)
|
||||||||||
|
Provision for contingencies and others
|
22,531
|
(551
|
)
|
11,239
|
(13,879
|
)
|
||||||||||
|
Other, net
|
18,811
|
(2,216
|
)
|
(5,012
|
)
|
(13,589
|
)
|
|||||||||
|
Total operating expenses, net
|
11,313
|
(74,677
|
)
|
(130,669
|
)
|
(188,608
|
)
|
|||||||||
|
Operating profit
|
19,994
|
5,250
|
53,755
|
105,516
|
||||||||||||
|
Other income (expense), net
|
||||||||||||||||
|
Share in the results of associates
|
(72,317
|
)
|
4,306
|
(1,144
|
)
|
13,207
|
||||||||||
|
Financial income
|
5,905
|
866
|
9,686
|
5,517
|
||||||||||||
|
Net gain (loss) from currency exchange difference
|
(1,345
|
)
|
585
|
(1,366
|
)
|
2,928
|
||||||||||
|
Financial costs
|
(10,140
|
)
|
(8,785
|
)
|
(38,456
|
)
|
(34,623
|
)
|
||||||||
|
Total other income, net
|
(77,897
|
)
|
(3,028
|
)
|
(31,280
|
)
|
(12,971
|
)
|
||||||||
|
Profit (loss) before income tax
|
(57,903
|
)
|
2,222
|
22,475
|
92,545
|
|||||||||||
|
Current income tax
|
(5,551
|
)
|
(4,991
|
)
|
(16,928
|
)
|
(23,837
|
)
|
||||||||
|
Deferred income tax
|
2,038
|
14,053
|
(9,998
|
)
|
5,825
|
|||||||||||
|
Profit (loss) from continuing operations
|
(61,416
|
)
|
11,284
|
(4,451
|
)
|
74,533
|
||||||||||
|
Discontinued operations
|
||||||||||||||||
|
Loss from discontinued operations
|
(5,916
|
)
|
(12,243
|
)
|
(7,203
|
)
|
(10,098
|
)
|
||||||||
|
Net profit (loss)
|
(67,332
|
)
|
(959
|
)
|
(11,654
|
)
|
64,435
|
|||||||||
|
Attributable to:
|
||||||||||||||||
|
Owners of the parent
|
(72,854
|
)
|
8,310
|
(13,445
|
)
|
60,823
|
||||||||||
|
Non-controlling interest
|
5,522
|
(9,269
|
)
|
1,791
|
3,612
|
|||||||||||
|
(67,332
|
)
|
(959
|
)
|
(11,654
|
)
|
64,435
|
||||||||||
|
Basic and diluted profit (loss) per share attributable to
|
||||||||||||||||
|
equity holders of the parent, stated in U.S. dollars
|
(0.29
|
)
|
0.03
|
(0.05
|
)
|
0.24
|
||||||||||
|
|
Compañía de Minas Buenaventura S.A.A.
Fourth Quarter 2018 Results
Page 26 of 27
|
|
Compañía de Minas Buenaventura S.A.A. and Subsidiaries
|
||||||||||||||||
|
Consolidated Statement of Cash Flows
|
||||||||||||||||
|
For the three and twelve month periods ended December 31, 2018 and 2017
|
||||||||||||||||
|
For the three month period ended December, 31
|
For the twelve month period ended December, 31
|
|||||||||||||||
|
2018
|
2017
|
2018
|
2017
|
|||||||||||||
|
US$(000)
|
US$(000)
|
US$(000)
|
US$(000)
|
|||||||||||||
|
Operating activities
|
||||||||||||||||
|
Proceeds from sales
|
264,364
|
348,643
|
1,216,294
|
1,197,523
|
||||||||||||
|
Value Added Tax recovered
|
35,346
|
12,175
|
106,656
|
102,548
|
||||||||||||
|
Proceeds from dividends
|
2,229
|
2,791
|
46,792
|
9,823
|
||||||||||||
|
Proceeds from insurance claim
|
38,793
|
-
|
38,793
|
-
|
||||||||||||
|
Royalty received
|
5,833
|
5,545
|
20,013
|
21,565
|
||||||||||||
|
Interest received
|
1,481
|
19
|
2,383
|
3,169
|
||||||||||||
|
Payments to suppliers and third-parties
|
(224,214
|
)
|
(224,502
|
)
|
(861,282
|
)
|
(872,467
|
)
|
||||||||
|
Payments to employees
|
(25,036
|
)
|
(37,339
|
)
|
(151,602
|
)
|
(160,891
|
)
|
||||||||
|
Payment of income taxes
|
(2,553
|
)
|
(18,337
|
)
|
(30,898
|
)
|
(38,121
|
)
|
||||||||
|
Payments of interest
|
(5,042
|
)
|
(9,047
|
)
|
(27,699
|
)
|
(30,402
|
)
|
||||||||
|
Payments of mining royalties
|
(2,246
|
)
|
(5,493
|
)
|
(13,190
|
)
|
(20,165
|
)
|
||||||||
|
Net cash and cash equivalents provided by operating activities
|
88,955
|
74,455
|
346,260
|
212,582
|
||||||||||||
|
Investing activities
|
||||||||||||||||
|
Proceeds from sales of mining concessions, property, plant and equipment
|
1,866
|
258
|
2,240
|
1,962
|
||||||||||||
|
Acquisitions of mining concessions, development costs, property, plant and equipment
|
(41,173
|
)
|
(62,666
|
)
|
(111,270
|
)
|
(259,507
|
)
|
||||||||
|
Payments to other assets
|
(5,537
|
)
|
(5,405
|
)
|
(8,529
|
)
|
(5,405
|
)
|
||||||||
|
Proceeds from loans
|
-
|
-
|
-
|
124,800
|
||||||||||||
|
Net cash and cash equivalents provided by (used in) investing activities
|
(44,844
|
)
|
(67,813
|
)
|
(117,559
|
)
|
(138,150
|
)
|
||||||||
|
Financing activities
|
||||||||||||||||
|
Proceeds of bank loans
|
15,000
|
96,215
|
95,000
|
341,215
|
||||||||||||
|
Payments of bank loans
|
(15,000
|
)
|
(135,000
|
)
|
(95,000
|
)
|
(300,000
|
)
|
||||||||
|
Proceeds of financial obligations
|
32,603
|
102,746
|
-
|
80,000
|
||||||||||||
|
Payments of financial obligations
|
(45,222
|
)
|
(32,599
|
)
|
(45,222
|
)
|
(32,599
|
)
|
||||||||
|
Dividends paid to controlling interest
|
(15,306
|
)
|
(7,620
|
)
|
(22,860
|
)
|
(22,099
|
)
|
||||||||
|
Dividends paid to non-controlling interest
|
(1,600
|
)
|
(1,520
|
)
|
(5,560
|
)
|
(6,036
|
)
|
||||||||
|
Increase of restricted bank accounts
|
(331
|
)
|
821
|
(410
|
)
|
(285
|
)
|
|||||||||
|
Acquisition of non-controlling interest
|
-
|
(621
|
)
|
-
|
(621
|
)
|
||||||||||
|
Net cash and cash equivalents provided by (used in) financing activities
|
(29,856
|
)
|
22,422
|
(74,052
|
)
|
59,575
|
||||||||||
|
Net increase in cash and cash equivalents during the period
|
14,255
|
29,064
|
154,649
|
134,007
|
||||||||||||
|
Cash and cash equivalents at the beginning of the period
|
354,945
|
185,487
|
214,551
|
80,544
|
||||||||||||
|
Cash and cash equivalents at period-end
|
369,200
|
214,551
|
369,200
|
214,551
|
||||||||||||
|
|
Compañía de Minas Buenaventura S.A.A.
Fourth Quarter 2018 Results
Page 27 of 27
|
|
|
For the three month period ended December, 31
|
For the twelve month period ended December, 31
|
||||||||||||||
|
|
2018
|
2017
|
2018
|
2017
|
||||||||||||
|
|
US$(000)
|
US$(000)
|
US$(000)
|
US$(000)
|
||||||||||||
|
|
||||||||||||||||
|
Reconciliation of net profit to cash and cash equivalents provided
|
||||||||||||||||
|
by operating activities
|
||||||||||||||||
|
|
||||||||||||||||
|
Net income (loss)
|
(72,854
|
)
|
8,310
|
(13,445
|
)
|
60,823
|
||||||||||
|
|
||||||||||||||||
|
Plus (less):
|
||||||||||||||||
|
Depreciation and amortization
|
63,033
|
74,123
|
241,286
|
213,722
|
||||||||||||
|
Recovery (expense) for provision for contingencies
|
(22,531
|
)
|
551
|
(11,239
|
)
|
13,879
|
||||||||||
|
Loss attributable to non-controlling interest
|
5,522
|
(9,269
|
)
|
1,791
|
3,612
|
|||||||||||
|
Hedge derivative instruments
|
(9,919
|
)
|
3,288
|
1,398
|
10,921
|
|||||||||||
|
Accretion expense of provision for closure of mining units and exploration projects
|
4,220
|
2,274
|
4,982
|
4,382
|
||||||||||||
|
Fair Value of provision for contingences liabilities
|
(1,815
|
)
|
-
|
(1,815
|
)
|
(1,773
|
)
|
|||||||||
|
Reversal (provision) for impairment loss of inventories
|
4,295
|
915
|
11,560
|
4,562
|
||||||||||||
|
Net share in results of associates
|
72,317
|
(4,306
|
)
|
1,144
|
(13,207
|
)
|
||||||||||
|
Net loss (gain) from currency exchange difference
|
1,345
|
(585
|
)
|
1,366
|
(2,928
|
)
|
||||||||||
|
Provision for estimated fair value of embedded derivatives related to concentrate
|
||||||||||||||||
|
sales and adjustments on open liquidations
|
(10,517
|
)
|
(7,434
|
)
|
5,358
|
(9,705
|
)
|
|||||||||
|
Deferred income tax expense (income)
|
(2,038
|
)
|
(14,053
|
)
|
9,998
|
(5,825
|
)
|
|||||||||
|
Adjustment of component of stripping cost
|
-
|
13,573
|
-
|
13,573
|
||||||||||||
|
Provision for impairment of long-lived assets
|
(5,693
|
)
|
21,620
|
(5,693
|
)
|
21,620
|
||||||||||
|
Bonus provision - executives & employes
|
7,743
|
17,757
|
1,744
|
|||||||||||||
|
Write-off of assets
|
3,660
|
-
|
6,087
|
-
|
||||||||||||
|
Other net
|
(6,975
|
)
|
(1,546
|
)
|
(1,436
|
)
|
(6,993
|
)
|
||||||||
|
|
||||||||||||||||
|
Net changes in operating assets and liabilities:
|
||||||||||||||||
|
Decrease (increase) in operating assets -
|
||||||||||||||||
|
Trade and other accounts receivable
|
31,433
|
(22,824
|
)
|
98,185
|
(41,875
|
)
|
||||||||||
|
Inventories
|
(5,955
|
)
|
10,572
|
(4,206
|
)
|
(551
|
)
|
|||||||||
|
Income tax credit
|
(8
|
)
|
(4,497
|
)
|
1,863
|
(2,962
|
)
|
|||||||||
|
Prepaid expenses
|
(7,018
|
)
|
(8,658
|
)
|
1,383
|
(3,283
|
)
|
|||||||||
|
Increase (decrease) in operating liabilities -
|
||||||||||||||||
|
Trade and other accounts payable
|
23,494
|
(628
|
)
|
(45,295
|
)
|
(55,404
|
)
|
|||||||||
|
Provisions
|
14,931
|
9,737
|
(21,240
|
)
|
5,032
|
|||||||||||
|
Income tax payable
|
56
|
501
|
(321
|
)
|
(6,605
|
)
|
||||||||||
|
|
||||||||||||||||
|
Proceeds from dividends
|
2,229
|
2,791
|
46,792
|
9,823
|
||||||||||||
|
|
||||||||||||||||
|
Net cash and cash equivalents provided by operating activities
|
88,955
|
74,455
|
346,260
|
212,582
|
||||||||||||
|
|
-
|
-
|
-
|
-
|
||||||||||||
|
|
||||||||||||||||
Signature
Pursuant to the requirements of the Securities Exchange Act of 1934, the registrant has duly caused this report to be signed on its behalf by
the undersigned, thereunto duly authorized.
COMPAÑÍA DE MINAS BUENAVENTURA S.A.A.
By: /s/ LEANDRO GARCÍA RAGGIO
Name: Leandro García Raggio
Title: Chief Financial Officer
Date: February 21, 2019