UNITED STATES
SECURITIES AND EXCHANGE COMMISSION
Washington, D.C. 20549
FORM 6-K
REPORT OF FOREIGN ISSUER
PURSUANT TO RULE 13a-16 OR 15b-16 OF
THE SECURITIES EXCHANGE ACT OF 1934
PURSUANT TO RULE 13a-16 OR 15b-16 OF
THE SECURITIES EXCHANGE ACT OF 1934
For the month of October 2018
Commission File Number 001-14370
COMPANIA DE MINAS BUENAVENTURA S.A.A.
(Exact name of registrant as specified in its charter)
BUENAVENTURA MINING COMPANY INC.
(Translation of registrant’s name into English)
(Translation of registrant’s name into English)
Republic of Peru
(Jurisdiction of incorporation or organization)
(Jurisdiction of incorporation or organization)
CARLOS VILLARAN 790
SANTA CATALINA, LIMA 13, PERU
(Address of principal executive offices)
SANTA CATALINA, LIMA 13, PERU
(Address of principal executive offices)
Indicate by check mark whether the registrant files or will file annual reports under cover Form 20-F or Form 40-F.
Form 20-F ____X___ Form 40-F _______
Indicate by check mark if the registrant is submitting the Form 6-K in paper as permitted by Regulation S-T Rule 101(b)(1): [ ]
Indicate by check mark if the registrant is submitting the Form 6-K in paper as permitted by Regulation S-T Rule 101(b)(7): [ ]
Indicate by check mark if the registrant is submitting the Form 6-K in paper as permitted by Regulation S-T Rule 101(b)(7): [ ]
Indicate by check mark whether the registrant by furnishing the information contained in this Form is also thereby furnishing the information to the Commission pursuant to Rule 12g3-2(b) under the Securities Exchange Act of 1934.
Yes _______ No ___X____
If “Yes” is marked, indicate below the file number assigned to the registrant in connection with Rule 12g3-2(b): Not applicable.
Signature
Pursuant to the requirements of the Securities Exchange Act of 1934, the registrant has duly caused this report to be signed on its behalf by the undersigned, thereunto duly authorized.
COMPAÑÍA DE MINAS BUENAVENTURA S.A.A.
By: /s/ LEANDRO GARCÍA RAGGIO
Name: Leandro García Raggio
Title: Chief Financial Officer
Date: October 25, 2018
Buenaventura Announces Third Quarter
and Nine Month 2018 Results
Lima, Peru, October 25, 2018 – Compañia de Minas Buenaventura S.A.A. (“Buenaventura” or “the Company”) (NYSE: BVN; Lima Stock Exchange: BUE.LM), Peru’s largest publicly-traded precious metals mining company, today announced results for the third quarter (3Q18) and nine-month (9M18) period ended September 30, 2018. All figures have been prepared in accordance with IFRS (International Financial Reporting Standards) on a non-GAAP basis and are stated in U.S. dollars (US$).
Third Quarter 2018 Highlights:
| · |
3Q18 EBITDA from direct operations was US$ 53.1 million compared to US$ 118.4 million reported in 3Q17, primarily due to by lower metal prices and lower volume sold (Orcopampa and La Zanja). 3Q18 Adjusted EBITDA (including associated companies) reached US$ 143.1 million, compared to US$ 186.7 million in 3Q17.
|
| · |
3Q18 Net Loss was US$ 10.3 million, compared to a net loss of US$ 12.0 for the same period in 2017.
|
| · |
The Company’s De-Bottlenecking Program is proceeding well, with better than expected results. Estimated EBITDA for 2018 has increased from US$ $15-25 million to US$ $28-35 million (Please see page 8 for more details).
|
| · |
Buenaventura has successfully maintained its disciplined approach to capital allocation thereby generating FCF despite a lower EBITDA than previously budgeted (Please see pages 9 and 10 for more details).
|
| · |
A dividend payment of US$ 0.06 per share/ADS was approved by Buenaventura’s Board.
|
| · |
During the quarter, the Company benefited from its Business Interruption Insurance related to problems detected with the 20x30 mill at El Brocal in May 2017. During 3Q18, the Company received US$ 10 million from a US$ 55 million total possible claim.
|
Financial Highlights (in millions of US$, except EPS figures):
|
3Q18
|
3Q17
|
Var%
|
9M18
|
9M17
|
Var%
|
|
|
Total Revenues
|
271.9
|
368.8
|
-26%
|
911.4
|
903.7
|
1%
|
|
Operating Profit
|
-27.1
|
57.4
|
N.A.
|
33.8
|
100.3
|
-66%
|
|
EBITDA Direct Operations
|
53.1
|
118.4
|
-55%
|
239.3
|
255.6
|
-6%
|
|
Adjusted EBITDA (Inc Associates)
|
143.1
|
186.7
|
-23%
|
507.9
|
463.6
|
10%
|
|
Net Income / Net Loss
|
-10.3
|
-12.0
|
14%
|
59.4
|
52.5
|
13%
|
|
EPS*
|
-0.04
|
-0.05
|
14%
|
0.23
|
0.21
|
13%
|
(*) as of September 30, 2018 Buenaventura had a weighted average number of shares outstanding of 253,986,867.
Compañía de Minas Buenaventura S.A.A.
Third Quarter 2017 Results
Page 2 of 27
|
Operating Revenues
|
|
|
3Q18 net sales were US$ 266.1 million compared to US$ 363.3 million reported in 3Q17. This result was primarily due to a decrease in volumes sold of gold (32% decrease QoQ), silver (12% decrease QoQ), as well as to lower prices of all metals sold.
Royalty income increased 5%; from US$ 5.5 million in 3Q17 to US$ 5.8 million in 3Q18 due to a 6% increase in revenues at Yanacocha.
|
Operating Highlights
|
3Q18
|
3Q17
|
Var%
|
9M18
|
9M17
|
Var%
|
|
Net Sales
(in millions of US$)
|
266.1
|
363.3
|
-27%
|
896.4
|
888.2
|
1%
|
|
Average Realized Gold Price (US$/oz) (1) (2)
|
1,186
|
1,286
|
-8%
|
1,279
|
1,265
|
1%
|
|
Average Realized Gold Price (US$/oz) Inc. Affiliates (3)
|
1,196
|
1,282
|
-7%
|
1,275
|
1,254
|
2%
|
|
Average Realized Silver Price (US$/oz) (1) (2)
|
13.91
|
16.39
|
-15%
|
15.52
|
16.58
|
-6%
|
|
Average Realized Lead Price (US$/MT) (1) (2)
|
1,929
|
2,458
|
-21%
|
2,268
|
2,319
|
-2%
|
|
Average Realized
Zinc Price (US$/MT) (1) (2)
|
1,773
|
3,115
|
-43%
|
2,792
|
2,888
|
-3%
|
|
Average Realized Copper Price (US$/MT) (1) (2)
|
5,914
|
6,618
|
-11%
|
6,448
|
6,045
|
7%
|
|
Volume Sold
|
3Q18
|
3Q17
|
Var%
|
9M18
|
9M17
|
Var%
|
|
Consolidated Gold Oz1
|
81,427
|
120,475
|
-32%
|
263,034
|
281,395
|
-7%
|
|
Gold Oz Inc. Associated Companies 3
|
171,139
|
197,464
|
-13%
|
475,381
|
500,522
|
-5%
|
|
Consolidated Silver Oz 1
|
6,300,897
|
7,154,665
|
-12%
|
19,275,666
|
18,545,059
|
4%
|
|
Consolidated Lead MT 1
|
11,945
|
10,079
|
19%
|
30,467
|
29,199
|
4%
|
|
Consolidated Zinc MT 1
|
15,161
|
14,798
|
2%
|
49,745
|
45,688
|
9%
|
|
Consolidated Copper MT 1
|
11,825
|
11,273
|
5%
|
32,242
|
31,152
|
4%
|
|
(1)
|
Buenaventura’s Direct Operations includes 100% of Buenaventura’s operating units, 100% of La Zanja and 100% of El Brocal.
|
|
(2)
|
The realized price considers the adjustments of quotational periods.
|
|
(3)
|
Considers 100% of Buenaventura’s operating units, 100% of La Zanja, 100% of El Brocal, 40.095% of Coimolache and 43.65% of Yanacocha.
|
Compañía de Minas Buenaventura S.A.A.
Third Quarter 2017 Results
Page 3 of 27
|
Production and Operating Costs
|
|
|
In 3Q18, Buenaventura’s equity gold production was 72,518 ounces compared to 97,197 reported in 3Q17 mainly due a decrease in production at Orcopampa (48% decrease QoQ) and La Zanja (46% decrease QoQ). Lead equity production increased by 18% compared to 3Q17 primarily due to a 18% increase in production at the Uchucchacua mine and a 55% increase at the El Brocal mine. Zinc equity production increased by 17% compared to 3Q17 primarily due to a 69% increase in production at the Uchucchacua mine. Copper equity production increased by 8% compared to 3Q17, mainly due to an 8% increase in production at the El Brocal mine.
Buenaventura´s 9M18 equity gold production was 238,993; in line with the production reported in 9M17 of 239,621. 9M18 equity silver production increased by 5% as compared to 9M17, primarily due to an increase in production at Tambomayo. Buenaventura´s equity zinc production increased 18% in the 9M18 period compared to 9M17, primarily due to an 83% increase in production at Uchucchacua.
|
Equity Production
|
3Q18
|
3Q17
|
Var%
|
9M18
|
9M17
|
Var%
|
|
Gold Oz Direct Operations(1)
|
72,518
|
97,198
|
-25%
|
238,993
|
239,621
|
0%
|
|
Gold Oz including Associated(2) Companies
|
164,717
|
176,516
|
-7%
|
459,942
|
457,013
|
1%
|
|
Silver Oz Direct Operations(1)
|
6,370,003
|
6,478,420
|
-2%
|
19,664,298
|
18,693,908
|
5%
|
|
Silver Oz including Associated Companies
|
6,720,995
|
6,875,783
|
-2%
|
20,982,583
|
19,807,104
|
6%
|
|
Lead MT
|
11,094
|
9,418
|
18%
|
28,360
|
26,915
|
5%
|
|
Zinc MT
|
15,491
|
13,203
|
17%
|
47,672
|
40,336
|
18%
|
|
Copper MT Direct Operations(1)
|
7,715
|
7,124
|
8%
|
21,097
|
20,400
|
3%
|
|
Copper MT including Associated Companies
|
32,170
|
32,312
|
0%
|
90,384
|
91,957
|
-2%
|
|
Consolidated Production
|
3Q18
|
3Q17
|
Var%
|
9M18
|
9M17
|
Var%
|
|
Gold Oz(3)
|
82,719
|
115,154
|
-28%
|
269,860
|
291,322
|
-7%
|
|
Silver Oz(3)
|
6,879,477
|
6,902,597
|
0%
|
20,885,301
|
19,961,468
|
5%
|
|
Lead MT(3)
|
13,711
|
11,113
|
23%
|
34,231
|
32,915
|
4%
|
|
Zinc MT(3)
|
19,248
|
17,712
|
9%
|
61,515
|
56,089
|
10%
|
|
Copper MT(3)
|
12,529
|
11,584
|
8%
|
34,264
|
33,162
|
3%
|
|
(1)
|
Buenaventura’s Direct Operations includes 100% of Buenaventura’s operating units, 53.06% of La Zanja and 61.43% of El Brocal.
|
|
(2)
|
Based on 100% of Buenaventura´s operating units, 53.06% of La Zanja, 61.43% of el Brocal, 40.095% of Coimolache and 43.65% of Yanacocha.
|
|
(3)
|
Based on 100% of Buenaventura’s operating units, 100% of La Zanja and 100% of El Brocal.
|
Compañía de Minas Buenaventura S.A.A.
Third Quarter 2017 Results
Page 4 of 27
Tambomayo (100% owned by Buenaventura)
|
Production
|
|||||||||||||
|
|
|
3Q18
|
3Q17
|
Var %
|
9M18
|
9M17
|
Var %
|
||||||
|
Gold
|
Oz
|
33,279
|
24,115
|
38%
|
98,145
|
36,570
|
168%
|
||||||
|
Silver
|
Oz
|
929,949
|
678,828
|
37%
|
3,056,558
|
974,207
|
214%
|
||||||
|
Cost Applicable to Sales
|
|||||||||||||
|
|
|
3Q18
|
3Q17
|
Var %
|
9M18
|
9M17
|
Var %
|
||||||
|
Gold
|
US$/Oz
|
642
|
714
|
-10%
|
568
|
715
|
-21%
|
||||||
3Q18 year on year gold production at Tambomayo increased due to the fact that during 3Q17 the plant was completing the ramp-up phase. Cost Applicable to Sales (CAS) in 3Q18 decreased 10%, to 642 US$/Oz, compared to 714 US$/Oz in 3Q17.
Gold production guidance for 2018 is 125k – 135k ounces and silver production guidance is 3.5M – 4.5M ounces.
Orcopampa (100% owned by Buenaventura)
|
Production
|
|||||||||||||
|
|
|
3Q18
|
3Q17
|
Var %
|
9M18
|
9M17
|
Var %
|
||||||
|
Gold
|
Oz
|
26,835
|
51,672
|
-48%
|
102,516
|
140,920
|
-27%
|
||||||
|
Silver
|
Oz
|
76,242
|
160,465
|
-52%
|
301,647
|
423,706
|
-29%
|
||||||
|
Cost Applicable to Sales
|
|||||||||||||
|
|
|
3Q18
|
3Q17
|
Var %
|
9M18
|
9M17
|
Var %
|
||||||
|
Gold
|
US$/Oz
|
1,052
|
699
|
51%
|
931
|
745
|
25%
|
||||||
The decrease in 3Q18 gold production at Orcopampa was primarily due to a 46% QoQ decrease in ore treated. Cost Applicable to Sales (CAS) increased 51% in 3Q18 to 1,052 US$/Oz, compared to 699 US$/Oz in 3Q17, primarily due to a decrease in volume sold.
As previously discussed in the Company’s most recent Operating Report released on October 9, 2018, the plan to centralize Orcopampa’s operations have successfully continued. The strategy is to prioritize its De-Bottlenecking Program over ore mineral extraction.
Gold production guidance for 2018 is 120k – 140k ounces.
La Zanja (53.06% owned by Buenaventura)
|
Production
|
|||||||
|
|
|
3Q18
|
3Q17
|
Var %
|
9M18
|
9M17
|
Var %
|
|
Gold
|
Oz
|
18,147
|
33,569
|
-46%
|
51,529
|
96,470
|
-47%
|
|
Silver
|
Oz
|
50,038
|
67,129
|
-25%
|
163,067
|
197,938
|
-18%
|
|
Cost Applicable to Sales
|
|||||||
|
|
|
3Q18
|
3Q17
|
Var %
|
9M18
|
9M17
|
Var %
|
|
Gold
|
US$/Oz
|
849
|
761
|
12%
|
935
|
762
|
23%
|
Gold production in 3Q18 decreased by 46% year on year, in line with the Company’s guidance released at the beginning of 2018. 3Q18 Cost Applicable to Sales (CAS) was 849 US$/Oz; a 12% increase compared to 761 US$/Oz in 3Q17, mainly due to a 47% QoQ decrease in volume sold.
Compañía de Minas Buenaventura S.A.A.
Third Quarter 2017 Results
Page 5 of 27
Gold production guidance for 2018 is 70k – 80k ounces.
Coimolache (40.10% owned by Buenaventura)
|
Production
|
|||||||
|
|
|
3Q18
|
3Q17
|
Var %
|
9M18
|
9M17
|
Var %
|
|
Gold
|
Oz
|
54,011
|
43,320
|
25%
|
123,484
|
106,290
|
16%
|
|
Silver
|
Oz
|
235,866
|
231,370
|
2%
|
598,503
|
537,587
|
11%
|
|
Cost Applicable to Sales
|
|||||||
|
|
|
3Q18
|
3Q17
|
Var %
|
9M18
|
9M17
|
Var %
|
|
Gold
|
US$/Oz
|
593
|
485
|
22%
|
647
|
500
|
29%
|
3Q18 gold production at Coimolache increased by 25% as compared to the same period last year, in line with the mine production plan. 3Q18 Cost Applicable to Sales (CAS) increased by 22%, compared to 485 US$/Oz in 3Q17, due to a higher stripping ratio: 0.79 in 3Q18 vs. 0.28 in 2Q17, and a 92% QoQ increase in hauling expenses, mainly due to the purchase of ore from Goldfields.
Gold production guidance for 2018 is 160k – 180k ounces.
Uchucchacua (100% owned by Buenaventura)
|
Production
|
|||||||
|
|
|
3Q18
|
3Q17
|
Var %
|
9M18
|
9M17
|
Var %
|
|
Silver
|
Oz
|
3,744,036
|
4,121,319
|
-9%
|
12,163,232
|
12,454,235
|
-2%
|
|
Zinc
|
MT
|
6,556
|
3,891
|
69%
|
15,974
|
8,722
|
83%
|
|
Lead
|
MT
|
5,214
|
4,421
|
18%
|
14,161
|
11,215
|
26%
|
|
Cost Applicable to Sales
|
|||||||
|
|
|
3Q18
|
3Q17
|
Var %
|
9M18
|
9M17
|
Var %
|
|
Silver
|
US$/Oz
|
9.91
|
11.00
|
-10%
|
9.92
|
10.89
|
-9%
|
3Q18 silver production at Uchucchacua decreased primarily due to a 20% QoQ reduction in ore grades. 3Q18 Cost Applicable to Sales (CAS) of 9.91 US$/Oz was 10% lower than 11.00 US$/Oz in 3Q17, primarily due to increased by-product contribution (lead and zinc) and a 51% QoQ reduction in exploration expenses.
Silver production guidance for 2018 is 15.0 million – 17.0 million ounces.
Mallay (100% owned by Buenaventura)
|
Production
|
|||||||||
|
|
|
3Q18
|
3Q17
|
Var %
|
9M18
|
9M17
|
Var %
|
||
|
Silver
|
Oz
|
126,476
|
216,637
|
-42%
|
416,411
|
917,378
|
-55%
|
||
|
Zinc
|
MT
|
905
|
1,403
|
-35%
|
3,044
|
5,821
|
-48%
|
||
|
Lead
|
MT
|
416
|
763
|
-46%
|
1,367
|
3,459
|
-60%
|
||
|
Cost Applicable to Sales
|
|||||||||
|
|
|
3Q18
|
3Q17
|
Var %
|
9M18
|
9M17
|
Var %
|
||
|
Silver
|
US$/Oz
|
13.10
|
12.29
|
7%
|
12.60
|
13.37
|
-6%
|
||
Compañía de Minas Buenaventura S.A.A.
Third Quarter 2017 Results
Page 6 of 27
Mallay silver, lead and zinc production decreased in 3Q18, in-line with guidance released at the beginning of 2018. 3Q18 Cost Applicable to Sales (CAS) of 13.10 US$/Oz was 7% higher than 12.29 US$/Oz in 3Q17, primarily due to a decrease in volume sold.
Silver production guidance for 2018 from Mallay´s mining operation is 0.4 million – 0.5 million ounces.
Julcani (100% owned by Buenaventura)
|
Production
|
||||||||||
|
|
|
3Q18
|
3Q17
|
Var %
|
9M18
|
9M17
|
Var %
|
|||
|
Silver
|
Oz
|
692,728
|
643,051
|
8%
|
1,817,159
|
1,957,169
|
-7%
|
|||
|
Cost Applicable to Sales
|
||||||||||
|
|
|
3Q18
|
3Q17
|
Var %
|
9M18
|
9M17
|
Var %
|
|||
|
Silver
|
US$/Oz
|
14.63
|
15.39
|
-5%
|
15.33
|
15.04
|
2%
|
|||
3Q18 silver production increased 8% QoQ primarily due to a 37% QoQ increase in ore grades despite a 22% QoQ decrease in ore treated. 3Q18 Cost Applicable to Sales (CAS) of 14.63 US$/Oz was 5% lower than 15.39 US$/Oz in 3Q17 despite a lower volume sold primarily due to the Company’s success in centralizing the operation.
Silver production guidance for 2018 is 2.3 million – 2.5 million ounces.
El Brocal (61.43% owned by Buenaventura)
|
Production
|
|||||||
|
|
|
3Q18
|
3Q17
|
Var %
|
9M18
|
9M17
|
Var %
|
|
Copper
|
MT
|
12,483
|
11,531
|
8%
|
34,139
|
32,994
|
3%
|
|
Zinc
|
MT
|
9,741
|
11,658
|
-16%
|
35,892
|
40,727
|
-12%
|
|
Silver
|
Oz
|
1,260,009
|
1,015,170
|
24%
|
2,967,226
|
3,036,835
|
-2%
|
|
Lead
|
MT
|
6,784
|
4,383
|
55%
|
15,222
|
15,512
|
-2%
|
|
Cost Applicable to Sales
|
|||||||
|
|
|
3Q18
|
3Q17
|
Var %
|
9M18
|
9M17
|
Var %
|
|
Copper
|
US$/MT
|
5,741
|
5,201
|
10%
|
5,377
|
4,992
|
8%
|
|
Zinc
|
US$/MT
|
813
|
1,789
|
-55%
|
1,516
|
1,875
|
-19%
|
3Q18 copper production increased 8% compared to 3Q17, mainly due to a 35% QoQ increase in the amount of ore treated. Zinc production in 3Q18 decreased 16% compared to 3Q17, mainly due to a lower ore grade (a 16% decrease QoQ).
In 3Q18, zinc Cost Applicable to Sales (CAS) decreased by 55% compared to 1,789 US$/MT, primarily explained by a decrease in commercial deductions. Copper CAS in 3Q18 increased by 10%, compared to 5,201 US$/MT in 3Q17, mainly due to an increase in exploration expenses.
Zinc production guidance for 2018 is 45k – 55k MT, while copper production guidance for 2018 is 45k – 55k MT.
At El Brocal, the Company benefited from its Business Interruption Insurance related to problems detected with the 20x30 mill in May 2017. During 3Q18, the Company received US$ 10 million from a possible total claim of US$ 55 million.
Compañía de Minas Buenaventura S.A.A.
Third Quarter 2017 Results
Page 7 of 27
|
General and Administrative Expenses
|
|
|
3Q18 General and Administrative expenses were US$ 15.9 million; a 21% decrease as compared to the US$ 20.2 million in 3Q17.
|
Exploration in Non-Operating Areas
|
|
|
3Q18 Exploration costs in Non-Operating Areas were US$ 9.8 million compared with US$ 4.4 million in 3Q17. During the period, Buenaventura primarily focused its exploration efforts on the Yumpaq area (US$ 4.30 million), Marcapunta Norte (US$ 2.66 million) and Emperatriz (US$ 1.12 million).
|
Share in Associated Companies
|
|
|
During 3Q18, Buenaventura’s share in associated companies was US$ 22.2 million, compared to negative US$ 32.9 million reported in 3Q17, comprised of:
|
Share in the Result of Associates
(in millions of US$)
|
3Q18
|
3Q17
|
Var %
|
9M18
|
9M17
|
Var %
|
|
Cerro Verde
|
18.3
|
-30.5
|
N.A.
|
82.4
|
25.9
|
218%
|
|
Coimolache
|
4.7
|
5.6
|
-16%
|
9.0
|
13.6
|
-34%
|
|
Yanacocha
|
-0.9
|
-8.0
|
-89%
|
-20.2
|
-30.6
|
34%
|
|
Total
|
22.2
|
-32.9
|
N.A.
|
71.2
|
8.9
|
700%
|
YANACOCHA
At Yanacocha, which is 43.65% owned by Buenaventura, 3Q18 gold production was 153,523 ounces; 67,013 ounces of which were attributable to Buenaventura. This represents an 8% decrease as compared to the 141,923 ounces produced in 3Q17; 61,949 ounces of which were attributable to Buenaventura. For 9M18, gold production was 373,099; 162,858 ounces of which were attributable to Buenaventura, a 7% decrease as compared to 400,401 ounces in 9M17; 174,775 ounces of which were attributable to Buenaventura.
Gold production guidance at Yanacocha for 2018 is 470k – 545k ounces.
In 3Q18, Yanacocha reported a net loss of US$ 1.9 million, compared to a net loss of US$ 18.3 million reported in 3Q17.
CAS in 3Q18 was US$ 756/oz; a 31% decrease as compared to the US$ 1,098/oz reported in 3Q17 mainly due to more volume sold (increase of 13% QoQ), lower stripping ratio (0.99 in 3Q18 vs. 2.69 in 3Q17) and improved metallurgical results from “transitional ore”.
Capital expenditures at Yanacocha were US$ 40.48 million in 3Q18.
The Quecher Main project, an oxide deposit, is currently in its Execution Phase. First production is expected in early 2019 with commercial production expected in the fourth quarter of 2019. The Quecher Main project extends the life of the Yanacocha operation until 2027, with average annual gold production of 200,000 ounces per year expected between 2020 and 2025. Cost applicable to sales (CAS) is expected to be between US$ 750 and US$ 850 per ounce and AISC between US$ 900 and US$ 1,000. Total CAPEX for the project is expected to be between US$ 250 and US$ 300 million; US$ 80 – US$ 90 million of which will be deployed in 2018.
Compañía de Minas Buenaventura S.A.A.
Third Quarter 2017 Results
Page 8 of 27
CERRO VERDE
At Cerro Verde (19.58% owned by Buenaventura), 3Q18 copper production was 124,902 MT; 24,456 MT of which is attributable to Buenaventura, in-line with the figure reported in 3Q17 of 128,644 MT; 25,189 MT of which was attributable to Buenaventura. 9M18 copper production was 353,865 MT; 69,287 MT of which was attributable to Buenaventura. In-line with 365,459 MT reported in 9M17; 71,557 MT of which was attributable to Buenaventura.
During 3Q18, Cerro Verde reported net income of US$ 93.6 million compared to net loss of US$ 155.8 million in 3Q17. This increase was primarily due to the pre-tax charges of US$ 376.6 million recorded in 3Q17 due to of the Royalty Dispute. Additionally, the increased income reflects a US$ 69 million one-time charge associated with the negotiation of new 3-year labor agreement.
Capital expenditures at Cerro Verde were US$ 63.97 million in 3Q18.
Copper production guidance at Cerro Verde for 2018 is 460k MT – 500k MT.
COIMOLACHE (Tantahuatay operation)
At Coimolache (40.10% owned by Buenaventura), 3Q18 attributable contribution to net income was US$ 4.7 million, as compared to US$ 5.6 million in 3Q17.
|
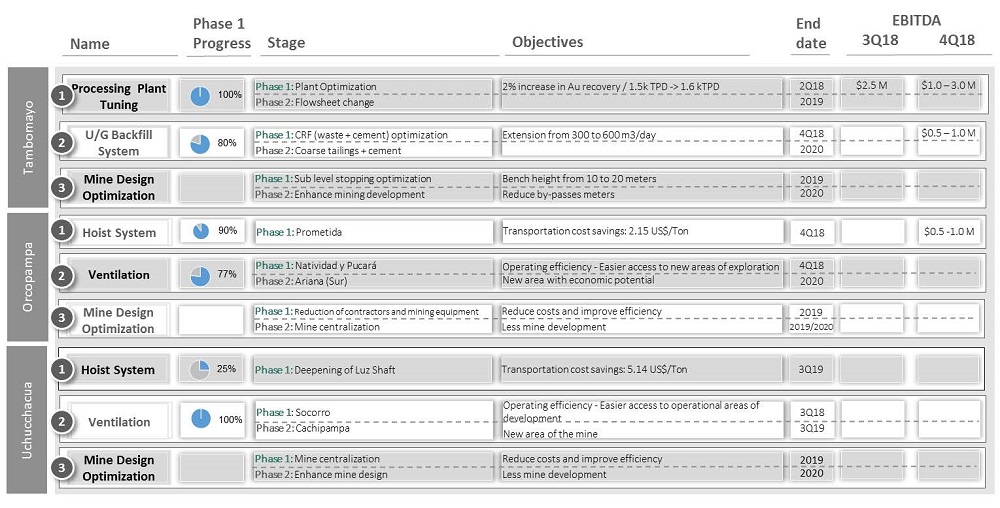
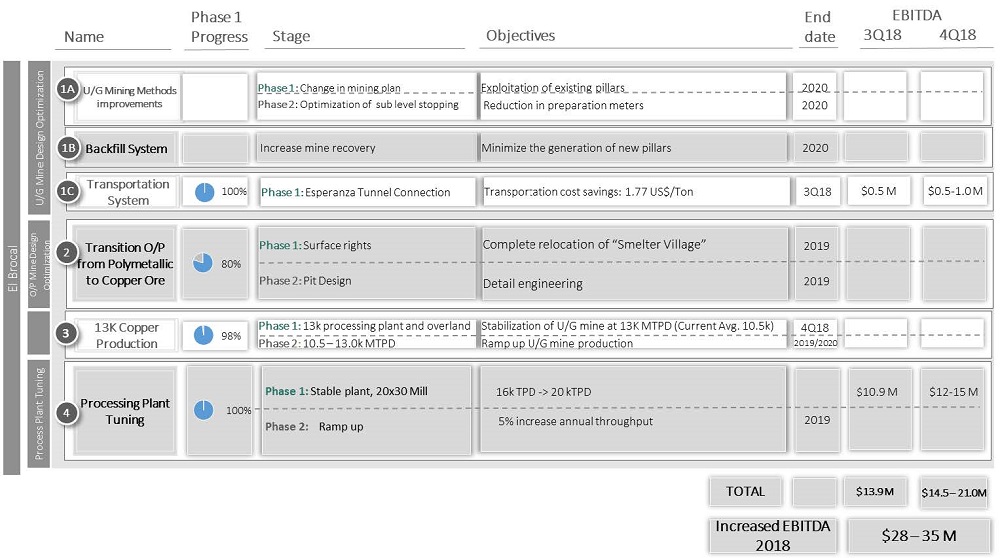
De-Bottlenecking Program – 3Q18 Update
|
|
|
Buenaventura’s De-Bottlenecking Program continues to make progress with significant positive results.
Compañía de Minas Buenaventura S.A.A.
Third Quarter 2017 Results
Page 9 of 27
|
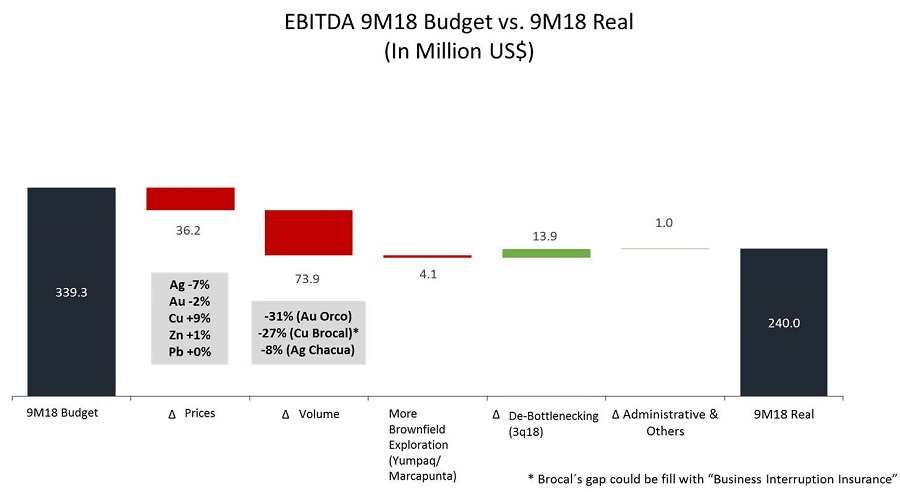
Variations in EBITDA and CAPEX
|
|
|
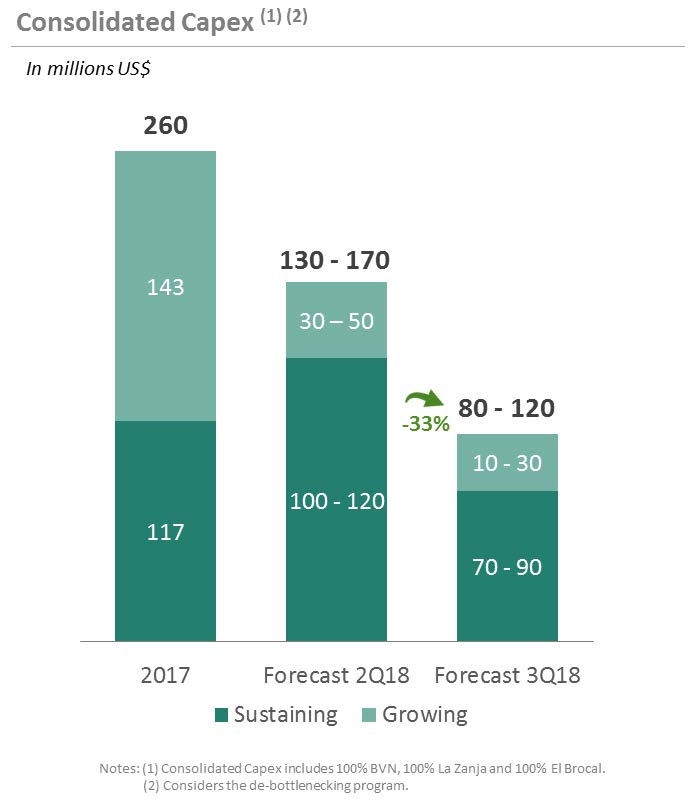
The Company’s budgeted EBITDA has been impacted by lower metals prices and lower production coming from Orcopampa, El Brocal and Uchuchacua.
Compañía de Minas Buenaventura S.A.A.
Third Quarter 2017 Results
Page 10 of 27
In order to maximize the Company’s Cash Flow generation, the full year estimated CAPEX has been reduced from US$ 130 – 170 million to US$ 80 – 120 million.
|
Other
|
|
|
During the October 25, 2018 Board Meeting of Directors the following resolution was passed:
Declaration of a cash dividend in the amount of US$ 0.06 per share or ADS. The record date is November 16, 2018 to be paid to shareholders on November 30, 2018.
***
Compañía de Minas Buenaventura S.A.A.
Third Quarter 2017 Results
Page 11 of 27
Company Description
Compañía de Minas Buenaventura S.A.A. is Peru’s largest, publicly traded, precious metals company and a major holder of mining rights in Peru. The Company is engaged in the mining, processing, development and exploration of gold and silver and other metals via wholly owned mines as well as through its participation in joint exploration projects.
Buenaventura currently operates several mines in Peru (Orcopampa*, Uchucchacua*, Mallay*, Julcani*, El Brocal, La Zanja and Coimolache and is developing the Tambomayo project.
The Company owns 43.65% of Minera Yanacocha S.R.L (a partnership with Newmont Mining Corporation), an important precious metal producer; 19.58% of Sociedad Minera Cerro Verde, an important Peruvian copper producer.
For a printed version of the Company’s 2017 Form 20-F, please contact the investor relations contacts on page 1 of this report, or download the PDF format file from the Company’s web site at www.buenaventura.com.
(*) Operations wholly owned by Buenaventura
|
|
Note on Forward-Looking Statements
This press release may contain forward-looking information (as defined in the U.S. Private Securities Litigation Reform Act of 1995) that involve risks and uncertainties, including those concerning the Company’s, Yanacocha’s and Cerro Verde’s costs and expenses, results of exploration, the continued improving efficiency of operations, prevailing market prices of gold, silver, copper and other metals mined, the success of joint ventures, estimates of future explorations, development and production, subsidiaries’ plans for capital expenditures, estimates of reserves and Peruvian political, economic, social and legal developments. These forward-looking statements reflect the Company’s view with respect to the Company’s, Yanacocha’s and Cerro Verde’s future financial performance. Actual results could differ materially from those projected in the forward-looking statements as a result of a variety of factors discussed elsewhere in this Press Release.
|
|
Compañía de Minas Buenaventura S.A.A.
Third Quarter 2017 Results
Page 12 of 27
**Tables to follow**
APPENDIX 1
|
Equity Participation in
Subsidiaries and Associates (as of September 30, 2018)
|
|||
|
BVN
|
Operating
|
||
|
Equity %
|
Mines / Business
|
||
|
El Molle Verde S.A.C*
|
100.00
|
Trapiche Project
|
|
|
Minera La Zanja S.A*
|
53.06
|
La Zanja
|
|
|
Sociedad Minera El Brocal S.A.A*
|
61.43
|
Colquijirca and Marcapunta
|
|
|
Compañía Minera Coimolache S.A. **
|
40.10
|
Tantahuatay
|
|
|
Minera Yanacocha S.R.L. **
|
43.65
|
Yanacocha
|
|
|
Sociedad Minera Cerro Verde S.A.A **
|
19.58
|
Cerro Verde
|
|
|
Processadora Industrial Rio Seco S.A*
|
100.00
|
Rio Seco chemical plant
|
|
|
Consorcio Energético de Huancavelica S.A*
|
100.00
|
Energy – Huanza Hydroelectrical plant
|
|
(*)Consolidated
(**) Equity Accounting
Compañía de Minas Buenaventura S.A.A.
Third Quarter 2017 Results
Page 13 of 27
APPENDIX 2
|
Mining Unit
|
Operating Results
|
Unit
|
3Q18
|
3Q17
|
△%
|
9M18
|
9M17
|
△ %
|
|
Underground
|
||||||||
|
Tambomayo
|
Ore Milled
|
DMT
|
143,601
|
105,105
|
37%
|
415,780
|
199,491
|
108%
|
|
Ore Grade
|
Oz/MT
|
0.25
|
0.27
|
-6%
|
0.25
|
0.23
|
11%
|
|
|
Recovery Rate
|
%
|
92.01
|
85.51
|
8%
|
92.01
|
80.21
|
15%
|
|
|
Ounces Produced*
|
Oz
|
33,279
|
24,115
|
38%
|
98,145
|
36,570
|
168%
|
|
|
Orcopampa
|
Ore Milled
|
DMT
|
72,418
|
135,217
|
-46%
|
310,046
|
371,686
|
-17%
|
|
Ore Grade
|
Oz/MT
|
0.37
|
0.38
|
-4%
|
0.33
|
0.38
|
-14%
|
|
|
Recovery Rate
|
%
|
97.35
|
97.29
|
0%
|
97.30
|
97.04
|
0%
|
|
|
Ounces Produced*
|
Oz
|
26,835
|
51,672
|
-48%
|
102,516
|
140,920
|
-27%
|
|
|
Open Pit
|
||||||||
|
La Zanja
|
Ounces Produced
|
Oz
|
18,147
|
33,569
|
-46%
|
51,529
|
96,470
|
-47%
|
|
Tantahuatay
|
Ounces Produced
|
Oz
|
54,011
|
43,320
|
25%
|
123,484
|
106,290
|
16%
|
|
(*) Includes ounces from retreatment of tailing dams
|
||||||||
|
Silver Production
|
||||||||
|
Mining Unit
|
Operating Results
|
Unit
|
3Q18
|
3Q17
|
△%
|
9M18
|
9M17
|
△ %
|
|
Underground
|
||||||||
|
Tambomayo
|
Ore Milled
|
DMT
|
143,601
|
105,105
|
37%
|
415,780
|
199,491
|
108%
|
|
Ore Grade
|
Oz/MT
|
7.46
|
10.28
|
-27%
|
8.56
|
8.83
|
-3%
|
|
|
Recovery Rate
|
%
|
86.75
|
62.85
|
38%
|
85.05
|
55.25
|
54%
|
|
|
Ounces Produced
|
Oz
|
929,949
|
678,828
|
37%
|
3,056,558
|
974,207
|
214%
|
|
|
Uchucchacua
|
Ore Milled
|
DMT
|
359,652
|
353,053
|
2%
|
1,032,426
|
1,039,166
|
-1%
|
|
Ore Grade
|
Oz/MT
|
11.56
|
14.52
|
-20%
|
13.31
|
14.58
|
-9%
|
|
|
Recovery Rate
|
%
|
89.95
|
80.37
|
12%
|
86.66
|
82.22
|
5%
|
|
|
Ounces Produced
|
Oz
|
3,744,036
|
4,121,319
|
-9%
|
12,163,232
|
12,454,235
|
-2%
|
|
|
Julcani
|
Ore Milled
|
DMT
|
29,055
|
37,197
|
-22%
|
80,140
|
114,125
|
-30%
|
|
Ore Grade
|
Oz/MT
|
24.45
|
17.85
|
37%
|
23.26
|
17.72
|
31%
|
|
|
Recovery Rate
|
%
|
97.54
|
96.84
|
1%
|
97.32
|
96.77
|
1%
|
|
|
Ounces Produced
|
Oz
|
692,728
|
643,051
|
8%
|
1,817,159
|
1,957,169
|
-7%
|
|
|
Mallay
|
Ore Milled
|
DMT
|
25,093
|
35,263
|
-29%
|
70,573
|
139,223
|
-49%
|
|
Ore Grade
|
Oz/MT
|
5.88
|
6.75
|
-13%
|
6.73
|
7.28
|
-8%
|
|
|
Recovery Rate
|
%
|
44.64
|
90.97
|
-51%
|
74.64
|
90.50
|
-18%
|
|
|
Ounces Produced
|
Oz
|
126,476
|
216,637
|
-42%
|
416,411
|
917,378
|
-55%
|
|
|
Marcapunta
|
Ore Milled
|
DMT
|
892,731
|
660,664
|
35%
|
2,296,665
|
1,830,062
|
25%
|
|
Ore Grade
|
Oz/MT
|
0.72
|
0.62
|
17%
|
0.73
|
0.63
|
16%
|
|
|
Recovery Rate
|
%
|
58.90
|
66.78
|
-12%
|
61.39
|
63.15
|
-3%
|
|
|
Ounces Produced
|
Oz
|
381,209
|
272,874
|
40%
|
1,028,868
|
726,311
|
42%
|
|
|
Open Pit
|
||||||||
|
Tajo Norte
|
Ore Milled
|
DMT
|
863,855
|
827,669
|
4%
|
2,605,547
|
2,390,826
|
9%
|
|
Ore Grade
|
Oz/MT
|
1.48
|
1.27
|
17%
|
1.14
|
1.35
|
-16%
|
|
|
Recovery Rate
|
%
|
68.71
|
70.74
|
-3%
|
65.54
|
71.80
|
-9%
|
|
|
Ounces Produced
|
Oz
|
878,800
|
742,295
|
18%
|
1,938,358
|
2,310,524
|
-16%
|
|
|
Zinc Production
|
||||||||
|
Mining Unit
|
Operating Results
|
Unit
|
3Q18
|
3Q17
|
△%
|
9M18
|
9M17
|
△ %
|
|
Underground
|
||||||||
|
Tambomayo
|
Ore Milled
|
DMT
|
143,601
|
105,105
|
37%
|
415,780
|
199,491
|
108%
|
|
Ore Grade
|
%
|
2.16
|
2.57
|
-16%
|
2.20
|
2.36
|
-7%
|
|
|
Recovery Rate
|
%
|
65.85
|
28.22
|
133%
|
71.37
|
17.43
|
309%
|
|
|
MT Produced
|
MT
|
2,046
|
761
|
169%
|
6,606
|
820
|
706%
|
|
|
dwa
|
Ore Milled
|
DMT
|
359,652
|
353,053
|
2%
|
1,032,426
|
1,039,166
|
-1%
|
|
Ore Grade
|
%
|
2.44
|
1.87
|
30%
|
2.23
|
1.61
|
38%
|
|
|
Recovery Rate
|
%
|
74.33
|
58.78
|
26%
|
69.08
|
52.03
|
33%
|
|
|
MT Produced
|
MT
|
6,556
|
3,891
|
69%
|
15,974
|
8,722
|
83%
|
|
|
Mallay
|
Ore Milled
|
DMT
|
25,093
|
35,263
|
-29%
|
70,573
|
139,223
|
-49%
|
|
Ore Grade
|
Oz/MT
|
4.35
|
4.48
|
-3%
|
5.08
|
4.74
|
7%
|
|
|
Recovery Rate
|
%
|
38.22
|
84.80
|
-55%
|
66.66
|
85.49
|
-22%
|
|
|
MT Produced
|
MT
|
905
|
1,403
|
-35%
|
3,044
|
5,821
|
-48%
|
|
|
Open Pit
|
||||||||
|
Tajo Norte
|
Ore Milled
|
DMT
|
863,855
|
827,669
|
4%
|
2,605,547
|
2,390,826
|
9%
|
|
Ore Grade
|
%
|
2.05
|
2.44
|
-16%
|
2.35
|
2.80
|
-16%
|
|
|
Recovery Rate
|
%
|
54.96
|
57.79
|
-5%
|
58.58
|
60.78
|
-4%
|
|
|
MT Produced
|
MT
|
9,741
|
11,658
|
-16%
|
35,892
|
40,727
|
-12%
|
|
|
Copper Production
|
||||||||
|
Mining Unit
|
Operating Results
|
Unit
|
3Q18
|
3Q17
|
△%
|
9M18
|
9M17
|
△ %
|
|
Underground
|
||||||||
|
Marcapunta
|
Ore Milled
|
DMT
|
892,731
|
660,664
|
35%
|
2,296,665
|
1,830,062
|
25%
|
|
Ore Grade
|
%
|
1.56
|
1.87
|
-17%
|
1.63
|
1.92
|
-15%
|
|
|
Recovery Rate
|
%
|
89.82
|
93.39
|
-4%
|
91.05
|
93.84
|
-3%
|
|
|
MT Produced
|
MT
|
12,483
|
11,531
|
8%
|
34,139
|
32,994
|
3%
|
|
Compañía de Minas Buenaventura S.A.A.
Third Quarter 2017 Results
Page 14 of 27
APPENDIX 3: EBITDA Reconciliation (in thousand US$)
|
EBITDA RECONCILIATION (in thousand US$)
|
||||
|
3Q18
|
3Q17
|
9M18
|
9M17
|
|
|
Net Income
|
-14,185
|
-5,117
|
55,678
|
65,394
|
|
Add / Substract:
|
67,312
|
123,469
|
183,603
|
190,226
|
|
Provision for income tax, net
|
-136
|
18,041
|
23,413
|
27,074
|
|
Share in associated companies by the equity method, net
|
-22,151
|
32,908
|
-71,173
|
-8,901
|
|
Provision for contingencies
|
11,611
|
1,512
|
11,292
|
13,328
|
|
Interest income
|
-1,604
|
-2,178
|
-3,781
|
-4,651
|
|
Interest expense
|
9,991
|
10,369
|
28,316
|
25,838
|
|
Loss on currency exchange difference
|
473
|
1,872
|
21
|
-2,343
|
|
Long Term Compensation provision
|
875
|
187
|
4,034
|
183
|
|
Depreciation and Amortization
|
63,414
|
58,464
|
178,253
|
139,599
|
|
Workers´ participation provision
|
-1,204
|
800
|
866
|
2,244
|
|
Bonus provision - executives & employees
|
3,080
|
0
|
8,648
|
0
|
|
Loss from discontinued operations
|
536
|
1,494
|
1,287
|
-2,145
|
|
Write-off of development cost
|
1,293
|
0
|
1,293
|
0
|
|
Write-off of talings dam
|
1,134
|
0
|
1,134
|
0
|
|
EBITDA Buenaventura Direct Operations
|
53,127
|
118,352
|
239,281
|
255,620
|
|
EBITDA Yanacocha (43.65%)
|
24,963
|
3,840
|
42,311
|
-8,160
|
|
EBITDA Cerro Verde (19.58%)
|
51,591
|
49,523
|
195,443
|
181,620
|
|
EBITDA Coimolache (40.095%)
|
13,427
|
14,951
|
30,863
|
34,566
|
|
EBITDA Buenaventura + All Associates
|
143,109
|
186,667
|
507,898
|
463,645
|
Note:
EBITDA (Buenaventura Direct Operations) consists of earnings before net interest, taxes, depreciation and amortization, share in associated companies, net, loss on currency exchange difference, other, net, provision for workers’ profit sharing and provision for long-term officers’ compensation.
EBITDA (including associated companies) consists of EBITDA (Buenaventura Direct Operations), plus (1) Buenaventura’s equity share of EBITDA (Yanacocha) (2) Buenaventura’s equity share of EBITDA (Cerro Verde), plus (3) Buenaventura’s equity share of EBITDA (Coimolache). All EBITDA mentioned were similarly calculated using financial information provided to Buenaventura by the associated companies.
Buenaventura presents EBITDA (Buenaventura Direct Operations) and EBITDA (including affiliates) to provide further information with respect to its operating performance and the operating performance of its equity investees, the affiliates. EBITDA (Buenaventura Direct Operations) and EBITDA (including affiliates) are not a measure of financial performance under IFRS, and may not be comparable to similarly titled measures of other companies. You should not consider EBITDA (Buenaventura Direct Operations) and EBITDA (including affiliates) as alternatives to operating income or net income determined in accordance with IFRS, as an indicator of Buenaventura’s, affiliates operating performance, or as an alternative to cash flows from operating activities, determined in accordance with IFRS, as an indicator of cash flows or as a measure of liquidity.
Compañía de Minas Buenaventura S.A.A.
Third Quarter 2017 Results
Page 15 of 27
APPENDIX 4: COST APPLICABLE TO SALES RECONCILIATION
Reconciliation of Costs Applicable to Sales and Cost Applicable to Sales per Unit Sold
Cost applicable to sales consists of cost of sales, excluding depreciation and amortization, plus selling expenses. Cost applicable to sales per unit sold for each mine consists of cost applicable to sales for a particular metal produced at a given mine divided by the volume of such metal produced at such mine in the specified period. We note that cost applicable to sales is not directly comparable to the cash operating cost figures disclosed in previously furnished earnings releases.
Cost applicable to sales and Cost applicable to sales per unit of mineral sold are not measures of financial performance under IFRS, and may not be comparable to similarly titled measures of other companies. We consider Cost applicable to sales and Cost applicable to sales per unit of mineral sold to be key measures in managing and evaluating our operating performance. These measures are widely reported in the precious metals industry as a benchmark for performance, but do not have standardized meanings. You should not consider Cost applicable to sales or Cost applicable to sales per unit of mineral sold as alternatives to cost of sales determined in accordance with IFRS, as indicators of our operating performance. Cost applicable to sales and Cost applicable to sales per unit of mineral sold are calculated without adjusting for by-product revenue amounts.
The tables below set forth (i) a reconciliation of consolidated Cost of sales, excluding depreciation and amortization to consolidated Cost applicable to sales, (ii) reconciliations of the components of Cost applicable to sales (by mine and mineral) to the corresponding consolidated line items set forth on our consolidated statements of profit or loss for the three and nine months ended September 30, 2015 and 2016, and (iii) reconciliations of Cost of sales, excluding depreciation and amortization to Cost applicable to sales for each of our mining units. The amounts set forth in Cost applicable to sales and Cost applicable to sales per unit sold for each mine and mineral indicated in the tables below can be reconciled to the amounts set forth on our consolidated statements of profit or loss for the three and nine months ended September 30, 2015 and 2016 by reference to the reconciliations of Cost of sales, excluding depreciation and amortization (by mine and mineral), Selling Expenses (by mine and metal) expenses and Exploration in units in operations (by mine and mineral) to consolidated Cost of sales, excluding depreciation and amortization, consolidated Selling Expenses and consolidated Exploration in units in operations expenses, respectively, set forth below.
Compañía de Minas Buenaventura S.A.A.
Third Quarter 2017 Results
Page 16 of 27
|
Set forth below is a reconciliation of consolidated Cost of sales, excluding depreciation and amortization,
|
||||||||||||||||
|
to consolidated Cost applicable to sales:
|
||||||||||||||||
|
For the 3 months ended September 30
|
For the 9 months ended September 30
|
|||||||||||||||
|
2018
|
2017
|
2018
|
2017
|
|||||||||||||
|
(in thousands of US$)
|
||||||||||||||||
|
Consolidated Cost of sales excluding depreciation and amortization
|
156,394
|
180,870
|
469,553
|
458,604
|
||||||||||||
|
Add:
|
||||||||||||||||
|
Consolidated Exploration in units in operation
|
22,188
|
27,591
|
69,633
|
68,793
|
||||||||||||
|
Consolidated Commercial deductions
|
47,357
|
65,710
|
145,550
|
188,509
|
||||||||||||
|
Consolidated Selling expenses
|
7,597
|
5,907
|
20,366
|
16,074
|
||||||||||||
|
Consolidated Cost applicable to sales
|
233,536
|
280,078
|
705,102
|
731,980
|
||||||||||||
|
Set forth below is a reconciliation of Cost of sales, excluding depreciation and amortization
|
||||||||||||||||
|
(by mine and mineral) to consolidated Cost of sales:
|
||||||||||||||||
|
|
For the 3 months ended September 30
|
For the 9 months ended September 30
|
||||||||||||||
|
|
2018
|
2017
|
2018
|
2017
|
||||||||||||
|
Cost of sales by mine and mineral
|
(in thousands of US$)
|
|||||||||||||||
|
Julcani, Gold
|
0
|
12
|
19
|
-3
|
||||||||||||
|
Julcani, Silver
|
6,225
|
7,963
|
17,396
|
19,645
|
||||||||||||
|
Julcani, Lead
|
306
|
1,039
|
1,032
|
2,157
|
||||||||||||
|
Julcani, Copper
|
38
|
15
|
67
|
100
|
||||||||||||
|
Mallay, Gold
|
23
|
24
|
21
|
218
|
||||||||||||
|
Mallay, Silver
|
1,025
|
1,286
|
3,369
|
6,305
|
||||||||||||
|
Mallay, Lead
|
519
|
719
|
1,667
|
3,529
|
||||||||||||
|
Mallay, Zinc
|
972
|
1,675
|
4,101
|
6,541
|
||||||||||||
|
Orcopampa, Gold
|
22,078
|
27,995
|
70,638
|
75,856
|
||||||||||||
|
Orcopampa, Silver
|
936
|
986
|
2,720
|
3,196
|
||||||||||||
|
Orcopampa, Copper
|
-193
|
70
|
-77
|
151
|
||||||||||||
|
Uchucchacua, Gold
|
-4
|
44
|
41
|
96
|
||||||||||||
|
Uchucchacua, Silver
|
22,938
|
30,301
|
74,413
|
80,871
|
||||||||||||
|
Uchucchacua, Lead
|
4,281
|
3,673
|
11,796
|
8,668
|
||||||||||||
|
Uchucchacua, Zinc
|
5,000
|
4,138
|
14,555
|
7,893
|
||||||||||||
|
Tambomayo, Gold
|
16,397
|
16,386
|
42,764
|
19,499
|
||||||||||||
|
Tambomayo, Silver
|
5,087
|
5,299
|
16,071
|
6,029
|
||||||||||||
|
Tambomayo, Zinc
|
726
|
1,134
|
1,986
|
1,148
|
||||||||||||
|
Tambomayo, Lead
|
1,236
|
724
|
5,110
|
733
|
||||||||||||
|
La Zanja, Gold
|
15,360
|
26,045
|
49,704
|
73,203
|
||||||||||||
|
La Zanja, Silver
|
499
|
715
|
1,995
|
2,059
|
||||||||||||
|
El Brocal, Gold
|
1,514
|
2,003
|
6,057
|
5,143
|
||||||||||||
|
El Brocal, Silver
|
6,668
|
4,824
|
13,786
|
14,391
|
||||||||||||
|
El Brocal, Lead
|
5,184
|
3,579
|
12,115
|
11,615
|
||||||||||||
|
El Brocal, Zinc
|
5,608
|
10,731
|
32,500
|
34,103
|
||||||||||||
|
El Brocal, Copper
|
32,967
|
25,525
|
81,799
|
65,367
|
||||||||||||
|
Non Mining Units
|
1,003
|
3,963
|
3,909
|
10,090
|
||||||||||||
|
Consolidated Cost of sales, excluding depreciation and amortization
|
156,394
|
180,870
|
469,553
|
458,604
|
||||||||||||
|
|
||||||||||||||||
|
Set forth below is a reconciliation of Exploration expenses in units in operation (by mine and mineral) to consolidated Exploration expenses in mining units:
|
||||||||||||||||
|
|
For the 3 months ended September 30
|
For the 9 months ended September 30
|
||||||||||||||
|
|
2018
|
2017
|
2018
|
2017
|
||||||||||||
|
Exploration expenses in units in operation by mine and mineral
|
(in thousands of US$)
|
|||||||||||||||
|
Julcani, Gold
|
0
|
5
|
7
|
-1
|
||||||||||||
|
Julcani, Silver
|
2,094
|
3,460
|
6,361
|
8,980
|
||||||||||||
|
Julcani, Lead
|
103
|
452
|
377
|
986
|
||||||||||||
|
Julcani, Copper
|
13
|
7
|
25
|
46
|
||||||||||||
|
Mallay, Gold
|
1
|
5
|
1
|
67
|
||||||||||||
|
Mallay, Silver
|
31
|
294
|
207
|
1,928
|
||||||||||||
|
Mallay, Lead
|
16
|
165
|
102
|
1,079
|
||||||||||||
|
Mallay, Zinc
|
29
|
384
|
252
|
2,000
|
||||||||||||
|
Orcopampa, Gold
|
7,232
|
9,503
|
24,212
|
26,569
|
||||||||||||
|
Orcopampa, Silver
|
307
|
335
|
932
|
1,119
|
||||||||||||
|
Orcopampa, Copper
|
-63
|
24
|
-26
|
53
|
||||||||||||
|
Uchucchacua, Gold
|
-1
|
11
|
6
|
21
|
||||||||||||
|
Uchucchacua, Silver
|
3,300
|
7,440
|
11,610
|
17,581
|
||||||||||||
|
Uchucchacua, Lead
|
616
|
902
|
1,840
|
1,884
|
||||||||||||
|
Uchucchacua, Zinc
|
719
|
1,016
|
2,271
|
1,716
|
||||||||||||
|
Tambomayo, Gold
|
3,568
|
2,437
|
8,817
|
2,782
|
||||||||||||
|
Tambomayo, Silver
|
1,107
|
788
|
3,313
|
860
|
||||||||||||
|
Tambomayo, Lead
|
158
|
169
|
409
|
164
|
||||||||||||
|
Tambomayo, Zinc
|
269
|
108
|
1,054
|
105
|
||||||||||||
|
La Zanja, Gold
|
5
|
86
|
69
|
832
|
||||||||||||
|
La Zanja, Silver
|
0
|
2
|
3
|
23
|
||||||||||||
|
El Brocal, Gold
|
78
|
0
|
323
|
0
|
||||||||||||
|
El Brocal, Silver
|
345
|
0
|
734
|
0
|
||||||||||||
|
El Brocal, Lead
|
268
|
0
|
645
|
0
|
||||||||||||
|
El Brocal, Zinc
|
290
|
0
|
1,731
|
0
|
||||||||||||
|
El Brocal, Copper
|
1,704
|
0
|
4,357
|
0
|
||||||||||||
|
Non Mining Units
|
0
|
0
|
0
|
0
|
||||||||||||
|
Consolidated Exploration expenses in units in operation
|
22,188
|
27,591
|
69,633
|
68,793
|
||||||||||||
Compañía de Minas Buenaventura S.A.A.
Third Quarter 2017 Results
Page 17 of 27
|
Set forth below is a reconciliation of Commercial Deductions in units in operation (by mine and mineral)
|
||||||||||||||||
|
For the 3 months ended September 30
|
For the 9 months ended September 30
|
|||||||||||||||
|
2018
|
2017
|
2018
|
2017
|
|||||||||||||
|
Commercial Deductions in units in operation by mine and mineral
|
(in thousands of US$)
|
|||||||||||||||
|
0
|
1
|
3
|
-1
|
|||||||||||||
|
923
|
1,174
|
2,584
|
3,090
|
|||||||||||||
|
48
|
149
|
153
|
334
|
|||||||||||||
|
5
|
3
|
9
|
18
|
|||||||||||||
|
5
|
5
|
5
|
69
|
|||||||||||||
|
204
|
327
|
820
|
1,896
|
|||||||||||||
|
100
|
182
|
407
|
1,068
|
|||||||||||||
|
362
|
398
|
1,200
|
2,280
|
|||||||||||||
|
109
|
313
|
709
|
680
|
|||||||||||||
|
19
|
42
|
110
|
137
|
|||||||||||||
|
-18
|
14
|
-3
|
28
|
|||||||||||||
|
-2
|
12
|
7
|
29
|
|||||||||||||
|
6,878
|
10,001
|
23,669
|
27,471
|
|||||||||||||
|
643
|
1,164
|
2,494
|
2,862
|
|||||||||||||
|
1,114
|
5,117
|
5,741
|
9,113
|
|||||||||||||
|
89
|
73
|
328
|
75
|
|||||||||||||
|
258
|
799
|
849
|
799
|
|||||||||||||
|
300
|
284
|
549
|
284
|
|||||||||||||
|
337
|
399
|
1,298
|
399
|
|||||||||||||
|
65
|
85
|
267
|
200
|
|||||||||||||
|
8
|
2
|
20
|
4
|
|||||||||||||
|
1,480
|
2,497
|
5,969
|
6,954
|
|||||||||||||
|
2,643
|
3,239
|
6,586
|
10,953
|
|||||||||||||
|
598
|
1,600
|
1,702
|
6,732
|
|||||||||||||
|
28
|
6,339
|
8,352
|
27,269
|
|||||||||||||
|
31,161
|
31,492
|
81,723
|
85,766
|
|||||||||||||
|
0
|
0
|
0
|
0
|
|||||||||||||
|
Consolidated Commercial deductions in units in operation
|
47,357
|
65,710
|
145,550
|
188,509
|
||||||||||||
|
Set forth below is a reconciliation of Selling expenses (by mine and mineral) to consolidated
|
||||||||||||||||
|
For the 3 months ended September 30
|
For the 9 months ended September 30
|
|||||||||||||||
|
2018
|
2017
|
2018
|
2017
|
|||||||||||||
|
(in thousands of US$)
|
||||||||||||||||
|
0
|
0
|
0
|
0
|
|||||||||||||
|
112
|
175
|
222
|
409
|
|||||||||||||
|
5
|
23
|
13
|
45
|
|||||||||||||
|
1
|
0
|
1
|
2
|
|||||||||||||
|
1
|
1
|
1
|
11
|
|||||||||||||
|
65
|
63
|
159
|
316
|
|||||||||||||
|
33
|
35
|
78
|
177
|
|||||||||||||
|
61
|
82
|
193
|
328
|
|||||||||||||
|
176
|
293
|
613
|
731
|
|||||||||||||
|
7
|
10
|
24
|
31
|
|||||||||||||
|
-2
|
1
|
-1
|
1
|
|||||||||||||
|
0
|
2
|
2
|
3
|
|||||||||||||
|
1,742
|
1,252
|
4,343
|
2,931
|
|||||||||||||
|
325
|
152
|
688
|
314
|
|||||||||||||
|
380
|
171
|
849
|
286
|
|||||||||||||
|
544
|
244
|
1,237
|
263
|
|||||||||||||
|
169
|
79
|
465
|
81
|
|||||||||||||
|
24
|
17
|
57
|
15
|
|||||||||||||
|
41
|
11
|
148
|
10
|
|||||||||||||
|
210
|
162
|
574
|
666
|
|||||||||||||
|
7
|
4
|
23
|
19
|
|||||||||||||
|
92
|
114
|
384
|
311
|
|||||||||||||
|
405
|
274
|
875
|
870
|
|||||||||||||
|
315
|
204
|
769
|
703
|
|||||||||||||
|
341
|
610
|
2,062
|
2,063
|
|||||||||||||
|
2,003
|
1,452
|
5,191
|
3,954
|
|||||||||||||
|
540
|
476
|
1,395
|
1,533
|
|||||||||||||
|
7,597
|
5,907
|
20,366
|
16,074
|
|||||||||||||
Compañía de Minas Buenaventura S.A.A.
Third Quarter 2017 Results
Page 18 of 27
|
|
JULCANI
|
JULCANI
|
||||||||||||||||||||||
|
|
3Q 2018
|
3Q 2017
|
9M 2018
|
9M 2017
|
||||||||||||||||||||
|
|
GOLD (OZ)
|
SILVER (OZ)
|
LEAD (MT)
|
ZINC (MT)
|
COPPER (MT)
|
TOTAL
|
GOLD (OZ)
|
SILVER (OZ)
|
LEAD (MT)
|
ZINC (MT)
|
COPPER (MT)
|
TOTAL
|
GOLD (OZ)
|
SILVER (OZ)
|
LEAD (MT)
|
ZINC (MT)
|
COPPER (MT)
|
TOTAL
|
GOLD (OZ)
|
SILVER (OZ)
|
LEAD (MT)
|
ZINC (MT)
|
COPPER (MT)
|
TOTAL
|
|
Cost of Sales (without D&A) (US$000)
|
-
|
6,225
|
306
|
-
|
38
|
6,569
|
12
|
7,963
|
1,039
|
-
|
15
|
9,030
|
19
|
17,396
|
1,032
|
-
|
67
|
18,514
|
-3
|
19,645
|
2,157
|
-
|
100
|
21,900
|
|
Add:
|
|
|
|
|
|
|
|
|
|
|
|
|
|
|
|
|
|
|
|
|
|
|
|
|
|
Exploration Expenses (US$000)
|
-
|
2,094
|
103
|
-
|
13
|
2,210
|
5
|
3,460
|
452
|
-
|
7
|
3,923
|
7
|
6,361
|
377
|
-
|
25
|
6,770
|
-1
|
8,980
|
986
|
-
|
46
|
10,011
|
|
Commercial Deductions (US$000)
|
0
|
923
|
48
|
-
|
5
|
976
|
1
|
1,174
|
149
|
-
|
3
|
1,327
|
3
|
2,584
|
153
|
-
|
9
|
2,749
|
-1
|
3,090
|
334
|
-
|
18
|
3,441
|
|
Selling Expenses (US$000)
|
-
|
112
|
5
|
-
|
1
|
118
|
0.26
|
174.62
|
22.79
|
-
|
0.33
|
198
|
0
|
222
|
13
|
-
|
1
|
236
|
-0
|
409
|
45
|
-
|
2
|
456
|
|
Cost Applicable to Sales (US$000)
|
0
|
9,354
|
462
|
-
|
56
|
9,873
|
19
|
12,771
|
1,663
|
-
|
25
|
14,478
|
28
|
26,563
|
1,576
|
-
|
102
|
28,269
|
-5
|
32,125
|
3,522
|
-
|
166
|
35,808
|
|
Divide:
|
|
|
|
|
|
|
|
|
|
|
|
|
|
|
|
|
|
|
|
|
|
|
|
|
|
Volume Sold
|
-
|
639,454
|
235
|
-
|
7
|
Not Applicable
|
13
|
829,755
|
722
|
-
|
3
|
Not Applicable
|
11
|
1,733,159
|
678
|
-
|
13
|
Not Applicable
|
21
|
2,136,488
|
1,604
|
-
|
28
|
No Aplicable
|
|
CAS
|
-
|
14.63
|
1,968
|
-
|
8,616
|
Not Applicable
|
1,442
|
15.39
|
2,304
|
-
|
7,653
|
Not Applicable
|
2,518
|
15.33
|
2,323
|
-
|
7,807
|
No Applicable
|
-
|
15.04
|
2,195
|
-
|
5,928
|
No Applicable
|
|
|
|
|
|
|
|
|
|
|
|
|
|
|
|
|
|
|
|
|
|
|
|
|
|
|
|
|
MALLAY
|
MALLAY
|
||||||||||||||||||||||
|
|
3Q 2018
|
3Q 2017
|
9M 2018
|
9M 2017
|
||||||||||||||||||||
|
|
GOLD (OZ)
|
SILVER (OZ)
|
LEAD (MT)
|
ZINC (MT)
|
COPPER (MT)
|
TOTAL
|
GOLD (OZ)
|
SILVER (OZ)
|
LEAD (MT)
|
ZINC (MT)
|
COPPER (MT)
|
TOTAL
|
GOLD (OZ)
|
SILVER (OZ)
|
LEAD (MT)
|
ZINC (MT)
|
COPPER (MT)
|
TOTAL
|
GOLD (OZ)
|
SILVER (OZ)
|
LEAD (MT)
|
ZINC (MT)
|
COPPER (MT)
|
TOTAL
|
|
Cost of Sales (without D&A) (US$000)
|
23.42
|
1,025
|
519
|
972
|
-
|
2,539
|
24
|
1,286
|
719
|
1,675
|
-
|
3,704
|
21
|
3,369
|
1,667
|
4,101
|
-
|
9,158
|
218
|
6,305
|
3,529
|
6,541
|
-
|
16,593
|
|
Add:
|
|
|
|
|
|
|
|
|
|
|
|
|
|
|
|
|
|
|
|
|
|
|
|
|
|
Exploration Expenses (US$000)
|
1
|
31
|
16
|
29
|
-
|
76
|
5
|
294
|
165
|
384
|
-
|
848
|
1
|
207
|
102
|
252
|
-
|
563
|
67
|
1,928
|
1,079
|
2,000
|
-
|
5,074
|
|
Commercial Deductions (US$000)
|
5
|
204
|
100
|
362
|
-
|
671
|
5
|
327
|
182
|
398
|
-
|
912
|
5
|
820
|
407
|
1,200
|
-
|
2,432
|
69
|
1,896
|
1,068
|
2,280
|
-
|
5,313
|
|
Selling Expenses (US$000)
|
1
|
65
|
33
|
61
|
-
|
160
|
1
|
63
|
35
|
82
|
-
|
182
|
1
|
159
|
78
|
193
|
-
|
431
|
11
|
316
|
177
|
328
|
-
|
831
|
|
Cost Applicable to Sales (US$000)
|
30
|
1,325
|
667
|
1,424
|
-
|
3,446
|
36
|
1,970
|
1,101
|
2,539
|
-
|
5,646
|
29
|
4,555
|
2,254
|
5,747
|
-
|
12,584
|
365
|
10,444
|
5,853
|
11,148
|
-
|
27,811
|
|
Divide:
|
|
|
|
|
|
|
|
|
|
|
|
|
|
|
|
|
|
|
|
|
|
|
|
|
|
Volume Sold
|
27
|
101,118
|
371
|
720
|
-
|
Not Applicable
|
1
|
160,298
|
600
|
1,132
|
-
|
Not Applicable
|
31
|
361,565
|
1,245
|
2,438
|
-
|
Not Applicable
|
346
|
781,431
|
3,111
|
4,773
|
-
|
Not Applicable
|
|
CAS
|
1,111
|
13.10
|
1,796
|
1,979
|
-
|
Not Applicable
|
30,452
|
12.29
|
1,837
|
2,243
|
-
|
Not Applicable
|
932
|
12.60
|
1,810
|
2,357
|
-
|
No Applicable
|
1,056
|
13.37
|
1,881
|
2,336
|
-
|
No Applicable
|
|
|
|
|
|
|
|
|
|
|
|
|
|
|
|
|
|
|
|
|
|
|
|
|
|
|
|
|
ORCOPAMPA
|
ORCOPAMPA
|
||||||||||||||||||||||
|
|
3Q 2018
|
3Q 2017
|
9M 2018
|
9M 2017
|
||||||||||||||||||||
|
|
GOLD (OZ)
|
SILVER (OZ)
|
LEAD (MT)
|
ZINC (MT)
|
COPPER (MT)
|
TOTAL
|
GOLD (OZ)
|
SILVER (OZ)
|
LEAD (MT)
|
ZINC (MT)
|
COPPER (MT)
|
TOTAL
|
GOLD (OZ)
|
SILVER (OZ)
|
LEAD (MT)
|
ZINC (MT)
|
COPPER (MT)
|
TOTAL
|
GOLD (OZ)
|
SILVER (OZ)
|
LEAD (MT)
|
ZINC (MT)
|
COPPER (MT)
|
TOTAL
|
|
Cost of Sales (without D&A) (US$000)
|
22,078
|
936
|
-
|
-
|
-193
|
22,821
|
27,995
|
986
|
-
|
-
|
70
|
29,052
|
70,638
|
2,720
|
-
|
-
|
-77
|
73,281
|
75,856
|
3,196
|
-
|
-
|
151
|
79,202
|
|
Add:
|
|
|
|
|
-
|
|
|
|
|
|
|
|
|
|
|
|
|
|
|
|
|
|
|
|
|
Exploration Expenses (US$000)
|
7,232
|
307
|
-
|
-
|
-63
|
7,475
|
9,503
|
335
|
-
|
-
|
24
|
9,862
|
24,212
|
932
|
-
|
-
|
-26
|
25,118
|
26,569
|
1,119
|
-
|
-
|
53
|
27,741
|
|
Commercial Deductions (US$000)
|
109
|
19
|
-
|
-
|
-18
|
110
|
313
|
42
|
-
|
-
|
14
|
369
|
709
|
110
|
-
|
-
|
-3
|
816
|
680
|
137
|
-
|
-
|
28
|
845
|
|
Selling Expenses (US$000)
|
176
|
7
|
-
|
-
|
-2
|
182
|
293
|
10
|
-
|
-
|
1
|
304
|
613
|
24
|
-
|
-
|
-1
|
636
|
731
|
31
|
-
|
-
|
1
|
763
|
|
Cost Applicable to Sales (US$000)
|
29,595
|
1,269
|
-
|
-
|
276
|
30,588
|
38,104
|
1,373
|
-
|
-
|
109
|
39,587
|
96,172
|
3,786
|
-
|
-
|
-107
|
99,851
|
103,835
|
4,483
|
-
|
-
|
233
|
108,551
|
|
Divide:
|
|
|
|
|
|
|
|
|
|
|
|
|
|
|
|
|
|
|
|
|
|
|
|
|
|
Volume Sold
|
28,144
|
97,010
|
-
|
-
|
2
|
Not Applicable
|
54,544
|
150,956
|
-
|
-
|
27
|
Not Applicable
|
103,314
|
323,631
|
-
|
-
|
42
|
Not Applicable
|
139,466
|
443,660
|
-
|
-
|
57
|
Not Applicable
|
|
CAS
|
1,052
|
13.08
|
-
|
-
|
-
|
Not Applicable
|
699
|
9.10
|
-
|
-
|
-
|
Not Applicable
|
931
|
11.70
|
-
|
-
|
-
|
No Applicable
|
745
|
10.11
|
-
|
-
|
4,059
|
No Applicable
|
|
|
|
|
|
|
|
|
|
|
|
|
|
|
|
|
|
|
|
|
|
|
|
|
|
|
|
|
UCHUCCHACUA
|
UCHUCCHACUA
|
||||||||||||||||||||||
|
|
3Q 2018
|
3Q 2017
|
9M 2018
|
9M 2017
|
||||||||||||||||||||
|
|
GOLD (OZ)
|
SILVER (OZ)
|
LEAD (MT)
|
ZINC (MT)
|
COPPER (MT)
|
TOTAL
|
GOLD (OZ)
|
SILVER (OZ)
|
LEAD (MT)
|
ZINC (MT)
|
COPPER (MT)
|
TOTAL
|
GOLD (OZ)
|
SILVER (OZ)
|
LEAD (MT)
|
ZINC (MT)
|
COPPER (MT)
|
TOTAL
|
GOLD (OZ)
|
SILVER (OZ)
|
LEAD (MT)
|
ZINC (MT)
|
COPPER (MT)
|
TOTAL
|
|
Cost of Sales (without D&A) (US$000)
|
-4
|
22,938
|
4,281
|
5,000
|
-
|
32,215
|
44
|
30,301
|
3,673
|
4,138
|
-
|
38,156
|
41
|
74,413
|
11,796
|
14,555
|
-
|
100,804
|
96
|
80,871
|
8,668
|
7,893
|
-
|
97,528
|
|
Add:
|
|
|
|
|
|
|
|
|
|
|
|
|
|
|
|
|
|
|
|
|
|
|
|
|
|
Exploration Expenses (US$000)
|
-1
|
3,300
|
616
|
719
|
-
|
4,635
|
11
|
7,440
|
902
|
1,016
|
-
|
9,369
|
6
|
11,610
|
1,840
|
2,271
|
-
|
15,727
|
21
|
17,581
|
1,884
|
1,716
|
-
|
21,202
|
|
Commercial Deductions (US$000)
|
-2
|
6,878
|
643
|
1,114
|
-
|
8,632
|
12
|
10,001
|
1,164
|
5,117
|
-
|
16,294
|
7
|
23,669
|
2,494
|
5,741
|
-
|
31,910
|
29
|
27,471
|
2,862
|
9,113
|
-
|
39,475
|
|
Selling Expenses (US$000)
|
-0
|
1,742
|
325
|
380
|
-
|
2,446
|
2
|
1,252
|
152
|
171
|
-
|
1,577
|
2
|
4,343
|
688
|
849
|
-
|
5,883
|
3
|
2,931
|
314
|
286
|
-
|
3,535
|
|
Cost Applicable to Sales (US$000)
|
-7
|
34,858
|
5,866
|
7,213
|
-
|
47,928
|
68
|
48,994
|
5,890
|
10,442
|
-
|
65,395
|
56
|
114,034
|
16,818
|
23,416
|
-
|
154,324
|
149
|
128,855
|
13,728
|
19,008
|
-
|
161,740
|
|
Divide:
|
|
|
|
|
|
|
|
|
|
|
|
|
|
|
|
|
|
|
|
|
|
|
|
|
|
Volume Sold
|
50
|
3,515,670
|
4,697
|
4,898
|
-
|
Not Applicable
|
55
|
4,452,812
|
3,584
|
3,291
|
-
|
Not Applicable
|
207
|
11,494,222
|
12,518
|
12,483
|
-
|
Not Applicable
|
133
|
11,836,518
|
8,762
|
6,589
|
-
|
Not Applicable
|
|
CAS
|
-
|
9.91
|
1,249
|
1,473
|
-
|
No Applicable
|
1,243
|
11.00
|
1,644
|
3,173
|
-
|
No Applicable
|
272
|
9.92
|
1,344
|
1,876
|
-
|
No Applicable
|
1,119
|
10.89
|
1,567
|
2,885
|
-
|
No Applicable
|
|
|
|
|
|
|
|
|
|
|
|
|
|
|
|
|
|
|
|
|
|
|
|
|
|
|
|
|
TAMBOMAYO
|
TAMBOMAYO
|
||||||||||||||||||||||
|
|
3Q 2018
|
3Q 2017
|
9M 2018
|
9M 2017
|
||||||||||||||||||||
|
|
GOLD (OZ)
|
SILVER (OZ)
|
LEAD (MT)
|
ZINC (MT)
|
COPPER (MT)
|
TOTAL
|
GOLD (OZ)
|
SILVER (OZ)
|
LEAD (MT)
|
ZINC (MT)
|
COPPER (MT)
|
TOTAL
|
GOLD (OZ)
|
SILVER (OZ)
|
LEAD (MT)
|
ZINC (MT)
|
COPPER (MT)
|
TOTAL
|
GOLD (OZ)
|
SILVER (OZ)
|
LEAD (MT)
|
ZINC (MT)
|
COPPER (MT)
|
TOTAL
|
|
Cost of Sales (without D&A) (US$000)
|
16,397
|
5,087
|
726
|
1,236
|
-
|
23,446
|
16,386
|
5,299
|
1,134
|
724.46
|
-
|
23,544
|
42,764
|
16,071
|
1,986
|
5,110
|
-
|
65,931
|
19,499
|
6,029
|
1,148
|
733
|
-
|
27,409
|
|
Add:
|
|
|
|
|
|
|
|
|
|
|
|
|
|
|
|
|
|
|
|
|
|
|
|
|
|
Exploration Expenses (US$000)
|
3,568
|
1,107
|
158
|
269
|
-
|
5,102
|
2,437
|
788
|
169
|
108
|
-
|
3,501
|
8,817
|
3,313
|
409
|
1,054
|
-
|
13,593
|
2,782
|
860
|
164
|
105
|
-
|
3,910
|
|
Commercial Deductions (US$000)
|
89
|
258
|
300
|
337
|
-
|
984
|
73
|
799
|
284
|
399
|
-
|
1,555
|
328
|
849
|
549
|
1,298
|
-
|
3,025
|
75
|
799
|
284
|
399
|
-
|
1,558
|
|
Selling Expenses (US$000)
|
544
|
169
|
24
|
41
|
-
|
778
|
244
|
79
|
17
|
11
|
-
|
350
|
1,237
|
465
|
57
|
148
|
-
|
1,907
|
263
|
81
|
15
|
10
|
-
|
370
|
|
Cost Applicable to Sales (US$000)
|
20,599
|
6,621
|
1,207
|
1,883
|
-
|
30,310
|
19,139
|
6,965
|
1,604
|
1,242
|
-
|
28,950
|
53,146
|
20,698
|
3,002
|
7,610
|
-
|
84,456
|
22,620
|
7,769
|
1,611
|
1,247
|
-
|
33,247
|
|
Divide:
|
|
|
|
|
|
|
|
|
|
|
|
|
|
|
|
|
|
|
|
|
|
|
|
|
|
Volume Sold
|
32,101
|
926,741
|
1,006
|
1,830
|
-
|
Not Applicable
|
26,799
|
656,070
|
884
|
491
|
-
|
Not Applicable
|
93,520
|
2,907,404
|
2,560
|
5,374
|
-
|
Not Applicable
|
31,639
|
737,524
|
884
|
491
|
-
|
Not Applicable
|
|
CAS
|
642
|
7.14
|
1,200
|
1,029
|
-
|
No Applicable
|
714
|
10.62
|
1,814
|
2,529
|
-
|
No Applicable
|
568
|
7.12
|
1,173
|
1,416
|
-
|
No Applicable
|
715
|
10.53
|
1,822
|
2,539
|
-
|
Not Applicable
|
Compañía de Minas Buenaventura S.A.A.
Third Quarter 2017 Results
Page 19 of 27
|
|
LA ZANJA
|
LA ZANJA
|
||||||||||||||||||||||
|
|
3Q 2018
|
3Q 2017
|
9M 2018
|
9M 2017
|
||||||||||||||||||||
|
|
GOLD (OZ)
|
SILVER (OZ)
|
LEAD (MT)
|
ZINC (MT)
|
COPPER (MT)
|
TOTAL
|
GOLD (OZ)
|
SILVER (OZ)
|
LEAD (MT)
|
ZINC (MT)
|
COPPER (MT)
|
TOTAL
|
GOLD (OZ)
|
SILVER (OZ)
|
LEAD (MT)
|
ZINC (MT)
|
COPPER (MT)
|
TOTAL
|
GOLD (OZ)
|
SILVER (OZ)
|
LEAD (MT)
|
ZINC (MT)
|
COPPER (MT)
|
TOTAL
|
|
Cost of Sales (without D&A) (US$000)
|
15,360
|
499
|
-
|
-
|
-
|
15,859
|
26,045
|
715
|
-
|
-
|
-
|
26,760
|
49,704
|
1,995
|
-
|
-
|
-
|
51,699
|
73,203
|
2,059
|
-
|
-
|
-
|
75,263
|
|
Add:
|
|
|
|
|
|
|
|
|
|
|
|
|
|
|
|
|
|
|
|
|
|
|
|
|
|
Exploration Expenses (US$000)
|
5
|
0
|
-
|
-
|
-
|
5
|
86
|
2
|
-
|
-
|
-
|
88
|
69
|
3
|
-
|
-
|
-
|
72
|
832
|
23
|
-
|
-
|
-
|
855
|
|
Commercial Deductions (US$000)
|
65
|
8
|
-
|
-
|
-
|
73
|
85
|
2
|
-
|
-
|
-
|
87
|
267
|
20
|
-
|
-
|
-
|
287
|
200
|
4
|
-
|
-
|
-
|
204
|
|
Selling Expenses (US$000)
|
210
|
7
|
-
|
-
|
-
|
217
|
162
|
4
|
-
|
-
|
-
|
166
|
574
|
23
|
-
|
-
|
-
|
597
|
666
|
19
|
-
|
-
|
-
|
685
|
|
Cost Applicable to Sales (US$000)
|
15,639
|
515
|
-
|
-
|
-
|
16,154
|
26,378
|
724
|
-
|
-
|
-
|
27,101
|
50,614
|
2,041
|
-
|
-
|
-
|
52,655
|
74,901
|
2,105
|
-
|
-
|
-
|
77,007
|
|
Divide:
|
|
|
|
|
|
|
|
|
|
|
|
|
|
|
|
|
|
|
|
|
|
|
|
|
|
Volume Sold
|
18,419
|
46,130
|
-
|
-
|
-
|
Not Applicable
|
34,662
|
73,619
|
-
|
-
|
-
|
Not Applicable
|
54,136
|
169,748
|
-
|
-
|
-
|
Not Applicable
|
98,338
|
202,468
|
-
|
-
|
-
|
Not Applicable
|
|
CAS
|
849
|
11.16
|
-
|
-
|
-
|
Not Applicable
|
761
|
9.83
|
-
|
-
|
-
|
Not Applicable
|
935
|
12.02
|
-
|
-
|
-
|
No Applicable
|
762
|
10.40
|
-
|
-
|
-
|
Not Applicable
|
|
|
|
|
|
|
|
|
|
|
|
|
|
|
|
|
|
|
|
|
|
|
|
|
|
|
|
|
BROCAL
|
BROCAL
|
||||||||||||||||||||||
|
|
3Q 2018
|
3Q 2017
|
9M 2018
|
9M 2017
|
||||||||||||||||||||
|
|
GOLD (OZ)
|
SILVER (OZ)
|
LEAD (MT)
|
ZINC (MT)
|
COPPER (MT)
|
TOTAL
|
GOLD (OZ)
|
SILVER (OZ)
|
LEAD (MT)
|
ZINC (MT)
|
COPPER (MT)
|
TOTAL
|
GOLD (OZ)
|
SILVER (OZ)
|
LEAD (MT)
|
ZINC (MT)
|
COPPER (MT)
|
TOTAL
|
GOLD (OZ)
|
SILVER (OZ)
|
LEAD (MT)
|
ZINC (MT)
|
COPPER (MT)
|
TOTAL
|
|
Cost of Sales (without D&A) (US$000)
|
1,514
|
6,668
|
5,184
|
5,608
|
32,967
|
51,942
|
2,003
|
4,824
|
3,579
|
10,731
|
25,525
|
46,662
|
6,057
|
13,786
|
12,115
|
32,500
|
81,799
|
146,257
|
5,143
|
14,391
|
11,615
|
34,103
|
65,367
|
130,619
|
|
Add:
|
|
|
|
|
|
|
|
|
|
|
|
|
|
|
|
|
|
|
|
|
|
|
|
|
|
Exploration Expenses (US$000)
|
78
|
345
|
268
|
290
|
1,704
|
2,685
|
-
|
-
|
-
|
-
|
-
|
-
|
323
|
734
|
645
|
1,731
|
4,357
|
7,790
|
-
|
-
|
-
|
-
|
-
|
-
|
|
Commercial Deductions (US$000)
|
1,480
|
2,643
|
598
|
28
|
31,161
|
35,911
|
2,497
|
3,239
|
1,600
|
6,339
|
31,492
|
45,166
|
5,969
|
6,586
|
1,702
|
8,352
|
81,723
|
104,331
|
6,954
|
10,953
|
6,732
|
27,269
|
85,766
|
137,674
|
|
Selling Expenses (US$000)
|
92
|
405
|
315
|
341
|
2,003
|
3,156
|
114
|
274
|
204
|
610
|
1,452
|
2,654
|
384
|
875
|
769
|
2,062
|
5,191
|
9,281
|
311
|
870
|
703
|
2,063
|
3,954
|
7,901
|
|
Cost Applicable to Sales (US$000)
|
3,165
|
10,061
|
6,365
|
6,267
|
67,836
|
93,694
|
4,614
|
8,337
|
5,382
|
17,681
|
58,469
|
94,482
|
12,733
|
21,981
|
15,231
|
44,644
|
173,069
|
267,659
|
12,408
|
26,215
|
19,050
|
63,435
|
155,086
|
276,194
|
|
Divide:
|
|
|
|
|
|
|
|
|
|
|
|
|
|
|
|
|
|
|
|
|
|
|
|
|
|
Volume Sold
|
2,685
|
974,775
|
5,636
|
7,712
|
11,816
|
Not Applicable
|
4,401
|
831,154
|
4,290
|
9,884
|
11,243
|
Not Applicable
|
11,815
|
2,285,936
|
13,465
|
29,450
|
32,187
|
Not Applicable
|
11,452
|
2,406,971
|
14,837
|
33,835
|
31,066
|
Not Applicable
|
|
CAS
|
1,179
|
10.32
|
1,129
|
813
|
5,741
|
Not Applicable
|
1,048
|
10.03
|
1,255
|
1,789
|
5,201
|
Not Applicable
|
1,078
|
9.62
|
1,131
|
1,516
|
5,377
|
No Applicable
|
1,084
|
10.89
|
1,284
|
1,875
|
4,992
|
Not Applicable
|
|
|
|
|
|
|
|
|
|
|
|
|
|
|
|
|
|
|
|
|
|
|
|
|
|
|
|
|
NON MINING COMPANIES
|
NON MINING COMPANIES
|
||||||||||||||||||||||
|
|
3Q 2018
|
3Q 2017
|
9M 2018
|
9M 2017
|
||||||||||||||||||||
|
|
GOLD (OZ)
|
SILVER (OZ)
|
LEAD (MT)
|
ZINC (MT)
|
COPPER (MT)
|
TOTAL
|
GOLD (OZ)
|
SILVER (OZ)
|
LEAD (MT)
|
ZINC (MT)
|
COPPER (MT)
|
TOTAL
|
GOLD (OZ)
|
SILVER (OZ)
|
LEAD (MT)
|
ZINC (MT)
|
COPPER (MT)
|
TOTAL
|
GOLD (OZ)
|
SILVER (OZ)
|
LEAD (MT)
|
ZINC (MT)
|
COPPER (MT)
|
TOTAL
|
|
Cost of Sales (without D&A) (US$000)
|
-
|
-
|
-
|
-
|
-
|
1,003
|
-
|
-
|
-
|
-
|
-
|
3,963
|
-
|
-
|
-
|
-
|
-
|
3,909
|
-
|
-
|
-
|
-
|
-
|
10,090
|
|
Add:
|
|
|
|
|
|
-
|
|
|
|
|
|
-
|
|
|
|
|
|
-
|
|
|
|
|
|
-
|
|
Selling Expenses (US$000)
|
-
|
-
|
-
|
-
|
-
|
540
|
-
|
-
|
-
|
-
|
-
|
476
|
-
|
-
|
-
|
-
|
-
|
1,395
|
-
|
-
|
-
|
-
|
-
|
1,533
|
|
Total (US$000)
|
-
|
-
|
-
|
-
|
-
|
1,543
|
-
|
-
|
-
|
-
|
-
|
4,439
|
-
|
-
|
-
|
-
|
-
|
5,304
|
-
|
-
|
-
|
-
|
-
|
11,623
|
|
|
|
|
|
|
|
|
|
|
|
|
|
|
|
|
|
|
|
|
|
|
|
|
|
|
|
|
BUENAVENTURA CONSOLIDATED
|
BUENAVENTURA CONSOLIDATED
|
||||||||||||||||||||||
|
|
3Q 2018
|
3Q 2017
|
9M 2018
|
9M 2017
|
||||||||||||||||||||
|
|
GOLD (OZ)
|
SILVER (OZ)
|
LEAD (MT)
|
ZINC (MT)
|
COPPER (MT)
|
TOTAL
|
GOLD (OZ)
|
SILVER (OZ)
|
LEAD (MT)
|
ZINC (MT)
|
COPPER (MT)
|
TOTAL
|
GOLD (OZ)
|
SILVER (OZ)
|
LEAD (MT)
|
ZINC (MT)
|
COPPER (MT)
|
TOTAL
|
GOLD (OZ)
|
SILVER (OZ)
|
LEAD (MT)
|
ZINC (MT)
|
COPPER (MT)
|
TOTAL
|
|
Cost of Sales (without D&A) (US$000)
|
55,368
|
43,378
|
11,016
|
12,816
|
32,812
|
156,394
|
72,509
|
51,374
|
10,144
|
17,269
|
25,611
|
180,870
|
169,243
|
129,750
|
28,595
|
56,266
|
81,789
|
469,553
|
174,013
|
132,497
|
27,117
|
49,270
|
65,618
|
458,604
|
|
Add:
|
|
|
|
|
|
|
|
|
|
|
|
|
|
|
|
|
|
|
|
|
|
|
|
|
|
Exploration Expenses (US$000)
|
10,883
|
7,184
|
1,160
|
1,307
|
1,654
|
22,188
|
12,047
|
12,319
|
1,687
|
1,507
|
31
|
27,591
|
33,435
|
23,161
|
3,375
|
5,308
|
4,355
|
69,633
|
30,268
|
30,492
|
4,113
|
3,821
|
99
|
68,793
|
|
Commercial Deductions (US$000)
|
1,747
|
10,934
|
1,688
|
1,841
|
31,148
|
47,357
|
2,986
|
15,583
|
3,379
|
12,253
|
31,509
|
65,710
|
7,287
|
34,638
|
5,305
|
16,591
|
81,729
|
145,550
|
8,006
|
44,351
|
11,280
|
39,061
|
85,811
|
188,509
|
|
Selling Expenses (US$000)
|
1,023
|
2,506
|
702
|
823
|
2,002
|
7,597
|
815
|
1,858
|
430
|
874
|
1,453
|
5,907
|
2,812
|
6,109
|
1,606
|
3,253
|
5,191
|
20,366
|
1,986
|
4,657
|
1,254
|
2,686
|
3,958
|
16,074
|
|
Cost Applicable to Sales (US$000)
|
69,021
|
64,002
|
14,567
|
16,787
|
67,616
|
233,536
|
88,357
|
81,135
|
15,640
|
31,904
|
58,604
|
280,078
|
212,777
|
193,657
|
38,881
|
81,417
|
173,065
|
705,102
|
214,273
|
211,997
|
43,765
|
94,838
|
155,486
|
731,980
|
|
Divide:
|
|
|
|
|
|
|
|
|
|
|
|
|
|
|
|
|
|
|
|
|
|
|
|
|
|
Volume Sold
|
81,427
|
6,300,897
|
11,945
|
15,161
|
11,825
|
Not Applicable
|
120,475
|
7,154,665
|
10,079
|
14,798
|
11,273
|
Not Applicable
|
263,034
|
19,275,666
|
30,467
|
49,745
|
32,242
|
Not Applicable
|
281,395
|
18,545,059
|
29,199
|
45,688
|
31,152
|
Not Applicable
|
|
CAS
|
848
|
10.16
|
1,220
|
1,107
|
5,718
|
Not Applicable
|
733
|
11.34
|
1,552
|
2,156
|
5,199
|
Not Applicable
|
809
|
10.05
|
1,276
|
1,637
|
5,368
|
Not Applicable
|
761
|
11.43
|
1,499
|
2,076
|
4,991
|
Not Applicable
|
|
|
|
|
|
|
|
|
|
|
|
|
|
|
|
|
|
|
|
|
|
|
|
|
|
|
|
|
COIMOLACHE
|
COIMOLACHE
|
||||||||||||||||||||||
|
|
3Q 2018
|
3Q 2017
|
9M 2018
|
9M 2017
|
||||||||||||||||||||
|
|
GOLD (OZ)
|
SILVER (OZ)
|
LEAD (MT)
|
ZINC (MT)
|
COPPER (MT)
|
TOTAL
|
GOLD (OZ)
|
SILVER (OZ)
|
LEAD (MT)
|
ZINC (MT)
|
COPPER (MT)
|
TOTAL
|
GOLD (OZ)
|
SILVER (OZ)
|
LEAD (MT)
|
ZINC (MT)
|
COPPER (MT)
|
TOTAL
|
GOLD (OZ)
|
SILVER (OZ)
|
LEAD (MT)
|
ZINC (MT)
|
COPPER (MT)
|
TOTAL
|
|
Cost of Sales (without D&A) (US$000)
|
27,408
|
1,489
|
-
|
-
|
-
|
28,897
|
16,409
|
1,106
|
-
|
-
|
-
|
17,515
|
65,479
|
4,032
|
-
|
-
|
-
|
69,511
|
44,509
|
3,063
|
-
|
-
|
-
|
47,572
|
|
Add:
|
|
|
|
|
|
|
|
|
|
|
|
|
|
|
|
|
|
|
|
|
|
|
|
|
|
Exploration Expenses (US$000)
|
4,059
|
221
|
-
|
-
|
-
|
4,280
|
3,375
|
227
|
-
|
-
|
-
|
3,602
|
11,296
|
695
|
-
|
-
|
-
|
11,991
|
6,684
|
460
|
-
|
-
|
-
|
7,144
|
|
Commercial Deductions (US$000)
|
176
|
10
|
-
|
-
|
-
|
187
|
153
|
11
|
-
|
-
|
-
|
163
|
407
|
27
|
-
|
-
|
-
|
434
|
378
|
37
|
-
|
-
|
-
|
415
|
|
Selling Expenses (US$000)
|
286
|
16
|
-
|
-
|
-
|
302
|
233
|
16
|
-
|
-
|
-
|
249
|
752
|
46
|
-
|
-
|
-
|
798
|
560
|
39
|
-
|
-
|
-
|
599
|
|
Cost Applicable to Sales (US$000)
|
31,930
|
1,736
|
-
|
-
|
-
|
33,666
|
20,170
|
1,359
|
-
|
-
|
-
|
21,529
|
77,933
|
4,801
|
-
|
-
|
-
|
82,734
|
52,132
|
3,599
|
-
|
-
|
-
|
55,730
|
|
Divide:
|
|
|
|
|
|
|
|
|
|
|
|
|
|
|
|
|
|
|
|
|
|
|
|
|
|
Volume Sold
|
53,859
|
234,844
|
-
|
-
|
-
|
Not Applicable
|
41,621
|
212,808
|
-
|
-
|
-
|
Not Applicable
|
120,415
|
589,071
|
-
|
-
|
-
|
Not Applicable
|
104,217
|
521,327
|
-
|
-
|
-
|
Not Applicable
|
|
CAS
|
593
|
7.39
|
-
|
-
|
-
|
Not Applicable
|
485
|
6.39
|
-
|
-
|
-
|
Not Applicable
|
647
|
8.15
|
-
|
-
|
-
|
No Applicable
|
500
|
6.90
|
-
|
-
|
-
|
Not Applicable
|
Compañía de Minas Buenaventura S.A.A.
Third Quarter 2017 Results
Page 20 of 27
APPENDIX 5: ALL-IN SUSTAINING COST
|
Buenaventura
|
||||||||||||||||||||||||||||||||
|
All-in Sustaining Cost for 3Q18
|
||||||||||||||||||||||||||||||||
|
Buenaventura1
|
La Zanja
|
Tantahuatay
|
Attributable 2
|
|||||||||||||||||||||||||||||
|
3Q18
|
3Q18
|
3Q18
|
3Q18
|
|||||||||||||||||||||||||||||
|
Au Ounces Sold BVN
|
60,322
|
|||||||||||||||||||||||||||||||
|
Au Ounces bought from La Zanja
|
||||||||||||||||||||||||||||||||
|
Au Ounces Sold Net
|
60,322
|
18,419
|
53,859
|
91,691
|
||||||||||||||||||||||||||||
|
3Q18
|
3Q18
|
3Q18
|
3Q18
|
|||||||||||||||||||||||||||||
|
Income Statement & Cash Flow
|
US$ 000'
|
US$/Oz Au
|
US$ 000'
|
US$/Oz Au
|
US$ 000'
|
US$/Oz Au
|
US$ 000'
|
US$/Oz Au
|
||||||||||||||||||||||||
|
Cost of Sales3
|
94,133
|
1,560
|
16,210
|
880
|
28,898
|
537
|
114,321
|
1,247
|
||||||||||||||||||||||||
|
Exploration in Operating Units
|
19,498
|
323
|
5
|
0
|
4,279
|
79
|
21,216
|
231
|
||||||||||||||||||||||||
|
Royalties
|
4,266
|
71
|
0
|
0
|
0
|
4,266
|
47
|
|||||||||||||||||||||||||
|
Comercial Deductions4
|
11,373
|
189
|
73
|
4
|
187
|
3
|
11,487
|
125
|
||||||||||||||||||||||||
|
Selling Expenses
|
3,815
|
63
|
217
|
12
|
303
|
6
|
4,052
|
44
|
||||||||||||||||||||||||
|
Administrative Expenses
|
11,978
|
199
|
1,463
|
79
|
2,129
|
40
|
13,608
|
148
|
||||||||||||||||||||||||
|
Other, net
|
9,046
|
150
|
-1,155
|
-63
|
-388
|
-7
|
8,278
|
90
|
||||||||||||||||||||||||
|
Sustaining Capex5
|
11,142
|
185
|
397
|
22
|
15,523
|
288
|
17,576
|
192
|
||||||||||||||||||||||||
|
By-product Credit
|
-99,506
|
-1,650
|
-689
|
-37
|
-3,467
|
-64
|
-1,756
|
-19
|
||||||||||||||||||||||||
|
All-in Sustaining Cost
|
65,745
|
1,090
|
16,522
|
897
|
47,464
|
881
|
93,542
|
1,020
|
||||||||||||||||||||||||
|
*All-in Sustaining Cost does not include: Depreciation and Amortization, Stoppage of mining units, Exploration in non-operating areas.
|
||||||||||||||||||||||||||||||||
|
Notes:
|
||||||||||||||||||||||||||||||||
|
1. Non-consolidated financial statements for Compañia De Minas Buenaventura S.A.A.
|
||||||||||||||||||||||||||||||||
|
2. Considers 100% from Compañia De Minas Buenaventura S.A.A., 53.06% from La Zanja and 40.095% from Tantahuatay.
|
||||||||||||||||||||||||||||||||
|
3. For Buenaventura does not consider purchase of concentrate from La Zanja.
|
||||||||||||||||||||||||||||||||
|
4. For all metals produced.
|
||||||||||||||||||||||||||||||||
|
5. Sustaining Capex + Growth Capex equals Acquisitions of mining concessions, development costs, property, plant and equipment.
|
||||||||||||||||||||||||||||||||
Compañía de Minas Buenaventura S.A.A.
Third Quarter 2017 Results
Page 21 of 27
|
Buenaventura
|
||||||||||||||||||||||||||||||||
|
All-in Sustaining Cost for 3Q17
|
||||||||||||||||||||||||||||||||
|
Buenaventura1
|
La Zanja
|
Tantahuatay
|
Attributable 2
|
|||||||||||||||||||||||||||||
|
3Q17
|
3Q17
|
3Q17
|
3Q17
|
|||||||||||||||||||||||||||||
|
Au Ounces Sold BVN
|
81,412
|
|||||||||||||||||||||||||||||||
|
Au Ounces bought from La Zanja
|
||||||||||||||||||||||||||||||||
|
Au Ounces Sold Net
|
81,412
|
34,662
|
41,621
|
116,492
|
||||||||||||||||||||||||||||
|
3Q17
|
3Q17
|
3Q17
|
3Q17
|
|||||||||||||||||||||||||||||
|
Income Statement & Cash Flow
|
US$ 000'
|
US$/Oz Au
|
US$ 000'
|
US$/Oz Au
|
US$ 000'
|
US$/Oz Au
|
US$ 000'
|
US$/Oz Au
|
||||||||||||||||||||||||
|
Cost of Sales3
|
107,950
|
1,326
|
27,067
|
781
|
16,978
|
408
|
129,119
|
1,108
|
||||||||||||||||||||||||
|
Exploration in Operating Units
|
27,503
|
338
|
88
|
3
|
4,140
|
99
|
29,210
|
251
|
||||||||||||||||||||||||
|
Royalties
|
5,867
|
72
|
0
|
0
|
5,867
|
50
|
||||||||||||||||||||||||||
|
Comercial Deductions4
|
20,457
|
251
|
87
|
3
|
163
|
4
|
20,569
|
177
|
||||||||||||||||||||||||
|
Selling Expenses
|
2,646
|
33
|
131
|
4
|
249
|
6
|
2,815
|
24
|
||||||||||||||||||||||||
|
Administrative Expenses
|
12,608
|
155
|
602
|
17
|
1,019
|
24
|
13,336
|
114
|
||||||||||||||||||||||||
|
Other, net
|
1,646
|
20
|
409
|
12
|
-183
|
-4
|
1,790
|
15
|
||||||||||||||||||||||||
|
Sustaining Capex5
|
23,084
|
284
|
6,989
|
202
|
15,636
|
376
|
33,062
|
284
|
||||||||||||||||||||||||
|
By-product Credit
|
-131,312
|
-1,613
|
-1,220
|
-35
|
-3,571
|
-86
|
-2,079
|
-18
|
||||||||||||||||||||||||
|
All-in Sustaining Cost
|
70,449
|
865
|
34,153
|
985
|
34,431
|
827
|
102,376
|
879
|
||||||||||||||||||||||||
|
*All-in Sustaining Cost does not include: Depreciation and Amortization, Stoppage of mining units, Exploration in non-operating areas.
|
||||||||||||||||||||||||||||||||
|
Notes:
|
||||||||||||||||||||||||||||||||
|
1. Non-consolidated financial statements for Compañia De Minas Buenaventura S.A.A.
|
||||||||||||||||||||||||||||||||
|
2. Considers 100% from Compañia De Minas Buenaventura S.A.A., 53.06% from La Zanja and 40.095% from Tantahuatay.
|
||||||||||||||||||||||||||||||||
|
3. For Buenaventura does not consider purchase of concentrate from La Zanja.
|
||||||||||||||||||||||||||||||||
|
4. For all metals produced.
|
||||||||||||||||||||||||||||||||
|
5. Sustaining Capex + Growth Capex equals Acquisitions of mining concessions, development costs, property, plant and equipment.
|
||||||||||||||||||||||||||||||||
Compañía de Minas Buenaventura S.A.A.
Third Quarter 2017 Results
Page 22 of 27
|
Buenaventura
|
||||||||||||||||||||||||||||||||
|
All-in Sustaining Cost for 9M18
|
||||||||||||||||||||||||||||||||
|
Buenaventura1
|
La Zanja
|
Tantahuatay
|
Attributable 2
|
|||||||||||||||||||||||||||||
|
9M18
|
9M18
|
9M18
|
9M18
|
|||||||||||||||||||||||||||||
|
Au Ounces Sold BVN
|
197,083
|
|||||||||||||||||||||||||||||||
|
Au Ounces bought from La Zanja
|
||||||||||||||||||||||||||||||||
|
Au Ounces Sold Net
|
197,083
|
54,136
|
120,415
|
274,088
|
||||||||||||||||||||||||||||
|
9M18
|
9M18
|
9M18
|
9M18
|
|||||||||||||||||||||||||||||
|
Income Statement & Cash Flow
|
US$ 000'
|
US$/Oz Au
|
US$ 000'
|
US$/Oz Au
|
US$ 000'
|
US$/Oz Au
|
US$ 000'
|
US$/Oz Au
|
||||||||||||||||||||||||
|
Cost of Sales3
|
287,018
|
1,456
|
52,670
|
973
|
69,512
|
577
|
342,836
|
1,251
|
||||||||||||||||||||||||
|
Exploration in Operating Units
|
61,771
|
313
|
72
|
1
|
11,990
|
100
|
66,617
|
243
|
||||||||||||||||||||||||
|
Royalties
|
15,851
|
80
|
0
|
0
|
15,851
|
58
|
||||||||||||||||||||||||||
|
Comercial Deductions4
|
40,932
|
208
|
287
|
5
|
434
|
4
|
41,258
|
151
|
||||||||||||||||||||||||
|
Selling Expenses
|
9,486
|
48
|
597
|
11
|
798
|
7
|
10,123
|
37
|
||||||||||||||||||||||||
|
Administrative Expenses
|
48,553
|
246
|
2,588
|
48
|
4,056
|
34
|
51,552
|
188
|
||||||||||||||||||||||||
|
Other, net
|
18,457
|
94
|
24
|
0
|
-271
|
-2
|
18,361
|
67
|
||||||||||||||||||||||||
|
Sustaining Capex5
|
29,771
|
151
|
7,281
|
134
|
25,189
|
209
|
43,733
|
160
|
||||||||||||||||||||||||
|
By-product Credit
|
-355,831
|
-1,805
|
-2,738
|
-51
|
-9,346
|
-78
|
-5,200
|
-19
|
||||||||||||||||||||||||
|
All-in Sustaining Cost
|
156,007
|
792
|
60,781
|
1,123
|
102,362
|
850
|
229,300
|
837
|
||||||||||||||||||||||||
|
*All-in Sustaining Cost does not include: Depreciation and Amortization, Stoppage of mining units, Exploration in non-operating areas.
|
||||||||||||||||||||||||||||||||
|
Notes:
|
||||||||||||||||||||||||||||||||
|
1. Non-consolidated financial statements for Compañia De Minas Buenaventura S.A.A.
|
||||||||||||||||||||||||||||||||
|
2. Considers 100% from Compañia De Minas Buenaventura S.A.A., 53.06% from La Zanja and 40.095% from Tantahuatay.
|
||||||||||||||||||||||||||||||||
|
3. For Buenaventura does not consider purchase of concentrate from La Zanja.
|
||||||||||||||||||||||||||||||||
|
4. For all metals produced.
|
||||||||||||||||||||||||||||||||
|
5. Sustaining Capex + Growth Capex equals Acquisitions of mining concessions, development costs, property, plant and equipment.
|
||||||||||||||||||||||||||||||||
Compañía de Minas Buenaventura S.A.A.
Third Quarter 2017 Results
Page 23 of 27
|
Buenaventura
|
||||||||||||||||||||||||||||||||
|
All-in Sustaining Cost for 9M17
|
||||||||||||||||||||||||||||||||
|
Buenaventura1
|
La Zanja
|
Tantahuatay
|
Attributable 2
|
|||||||||||||||||||||||||||||
|
9M17
|
9M17
|
9M17
|
9M17
|
|||||||||||||||||||||||||||||
|
Au Ounces Sold BVN
|
198,883
|
|||||||||||||||||||||||||||||||
|
Au Ounces bought from La Zanja
|
-27,278
|
|||||||||||||||||||||||||||||||
|
Au Ounces Sold Net
|
171,605
|
98,015
|
104,217
|
265,398
|
||||||||||||||||||||||||||||
|
9M17
|
9M17
|
9M17
|
9M17
|
|||||||||||||||||||||||||||||
|
Income Statement & Cash Flow
|
US$ 000'
|
US$/Oz Au
|
US$ 000'
|
US$/Oz Au
|
US$ 000'
|
US$/Oz Au
|
US$ 000'
|
US$/Oz Au
|
||||||||||||||||||||||||
|
Cost of Sales3
|
261,204
|
1,522
|
75,279
|
768
|
47,572
|
456
|
320,221
|
1,207
|
||||||||||||||||||||||||
|
Exploration in Operating Units
|
67,938
|
396
|
855
|
9
|
7,144
|
69
|
71,256
|
268
|
||||||||||||||||||||||||
|
Royalties
|
14,672
|
85
|
0
|
0
|
14,672
|
55
|
||||||||||||||||||||||||||
|
Comercial Deductions4
|
50,632
|
295
|
868
|
9
|
415
|
4
|
51,259
|
193
|
||||||||||||||||||||||||
|
Selling Expenses
|
6,122
|
36
|
518
|
5
|
599
|
6
|
6,637
|
25
|
||||||||||||||||||||||||
|
Administrative Expenses
|
39,994
|
233
|
1,687
|
17
|
2,718
|
26
|
41,979
|
158
|
||||||||||||||||||||||||
|
Other, net
|
5,306
|
31
|
572
|
6
|
-363
|
-3
|
5,464
|
21
|
||||||||||||||||||||||||
|
Sustaining Capex5
|
36,941
|
215
|
9,665
|
99
|
19,963
|
192
|
50,074
|
189
|
||||||||||||||||||||||||
|
By-product Credit
|
-331,457
|
-1,932
|
-3,140
|
-32
|
-8,892
|
-85
|
-5,231
|
-20
|
||||||||||||||||||||||||
|
All-in Sustaining Cost
|
151,352
|
882
|
86,304
|
881
|
69,156
|
664
|
224,873
|
847
|
||||||||||||||||||||||||
|
*All-in Sustaining Cost does not include: Depreciation and Amortization, Stoppage of mining units, Exploration in non-operating areas.
|
||||||||||||||||||||||||||||||||
|
Notes:
|
||||||||||||||||||||||||||||||||
|
1. Non-consolidated financial statements for Compañia De Minas Buenaventura S.A.A.
|
||||||||||||||||||||||||||||||||
|
2. Considers 100% from Compañia De Minas Buenaventura S.A.A., 53.06% from La Zanja and 40.095% from Tantahuatay.
|
||||||||||||||||||||||||||||||||
|
3. For Buenaventura does not consider purchase of concentrate from La Zanja.
|
||||||||||||||||||||||||||||||||
|
4. For all metals produced.
|
||||||||||||||||||||||||||||||||
|
5. Sustaining Capex + Growth Capex equals Acquisitions of mining concessions, development costs, property, plant and equipment.
|
||||||||||||||||||||||||||||||||
Compañía de Minas Buenaventura S.A.A.
Third Quarter 2017 Results
Page 24 of 27
APPENDIX 6
|
Compañía de Minas Buenaventura S.A.A. and Subsidiaries
|
||||||||
|
Consolidated Statement of Financial Position
|
||||||||
|
As of September 30, 2018 and December 31, 2017
|
||||||||
|
2018
|
2017
|
|||||||
|
Assets
|
US$(000)
|
US$(000)
|
||||||
|
Current assets
|
||||||||
|
Cash and cash equivalents
|
354,945
|
214,551
|
||||||
|
Trade and other accounts receivable, net
|
235,996
|
314,308
|
||||||
|
Inventory, net
|
129,202
|
132,287
|
||||||
|
Income tax credit
|
24,478
|
23,165
|
||||||
|
Prepaid expenses
|
9,906
|
17,551
|
||||||
|
Hedge derivative financial instruments
|
11,167
|
-
|
||||||
|
765,694
|
701,862
|
|||||||
|
Non-current assets
|
||||||||
|
Trade and other receivables, net
|
39,780
|
44,191
|
||||||
|
Long-term inventory
|
4,574
|
3,238
|
||||||
|
Investment in associates
|
1,548,156
|
1,536,887
|
||||||
|
Mining concessions, development costs, property, plant and equipment, net
|
1,875,455
|
1,949,555
|
||||||
|
Investment properties, net
|
253
|
222
|
||||||
|
Deferred income tax asset, net
|
29,631
|
43,129
|
||||||
|
Prepaid expenses
|
26,799
|
27,555
|
||||||
|
Long-term income tax credit
|
229
|
3,413
|
||||||
|
Other assets
|
22,050
|
22,761
|
||||||
|
3,546,927
|
3,630,951
|
|||||||
|
Total assets
|
4,312,621
|
4,332,813
|
||||||
|
Liabilities and shareholders’ equity, net
|
||||||||
|
Current liabilities
|
||||||||
|
Bank loans
|
95,000
|
96,215
|
||||||
|
Trade and other payables
|
164,569
|
233,355
|
||||||
|
Provisions
|
100,364
|
76,847
|
||||||
|
Income tax payable
|
1,704
|
2,081
|
||||||
|
Financial obligations
|
46,278
|
83,991
|
||||||
|
Hedge derivative financial instruments
|
-
|
28,705
|
||||||
|
407,915
|
521,194
|
|||||||
|
Non-current liabilities
|
||||||||
|
Trade and other payables
|
660
|
663
|
||||||
|
Provisions
|
186,922
|
164,877
|
||||||
|
Financial obligations
|
553,064
|
549,092
|
||||||
|
Contingent consideration liability
|
17,570
|
17,570
|
||||||
|
Deferred income tax liability, net
|
27,267
|
15,790
|
||||||
|
785,483
|
747,992
|
|||||||
|
Total liabilities
|
1,193,398
|
1,269,186
|
||||||
|
Shareholders’ equity, net
|
||||||||
|
Capital stock
|
750,497
|
750,497
|
||||||
|
Investment shares
|
791
|
791
|
||||||
|
Additional paid-in capital
|
218,450
|
218,450
|
||||||
|
Legal reserve
|
163,115
|
163,071
|
||||||
|
Other reserves
|
269
|
269
|
||||||
|
Retained earnings
|
1,763,315
|
1,728,847
|
||||||
|
Other reserves of equity
|
3,089
|
(13,888
|
)
|
|||||
|
Shareholders’ equity, net attributable to owners of the parent
|
2,899,526
|
2,848,037
|
||||||
|
Non-controlling interest
|
219,697
|
215,590
|
||||||
|
Total shareholders’ equity, net
|
3,119,223
|
3,063,627
|
||||||
|
Total liabilities and shareholders’ equity, net
|
4,312,621
|
4,332,813
|
||||||
Compañía de Minas Buenaventura S.A.A.
Third Quarter 2017 Results
Page 25 of 27
|
Compañía de Minas Buenaventura S.A.A. and Subsidiaries
|
||||||||||||||||
|
Consolidated Statement of Income
|
||||||||||||||||
|
For the three and nine-month periods ended September 30, 2018 and 2017
|
||||||||||||||||
|
For the three-month period
ended September 30,
|
For the nine-month period ended
September 30,
|
|||||||||||||||
|
2018
|
2017
|
2018
|
2017
|
|||||||||||||
|
Continuing operations
|
US$(000)
|
US$(000)
|
US$(000)
|
US$(000)
|
||||||||||||
|
Operating income
|
||||||||||||||||
|
Net sales of goods
|
262,342
|
355,085
|
883,149
|
867,439
|
||||||||||||
|
Net sales of services
|
3,736
|
8,186
|
13,283
|
20,714
|
||||||||||||
|
Royalty income
|
5,775
|
5,485
|
14,925
|
15,595
|
||||||||||||
|
Total operating income
|
271,853
|
368,756
|
911,357
|
903,748
|
||||||||||||
|
Operating costs
|
||||||||||||||||
|
Cost of sales, without considering depreciation and amortization
|
(155,661
|
)
|
(176,962
|
)
|
(466,332
|
)
|
(448,980
|
)
|
||||||||
|
Cost of services, without considering depreciation and amortization
|
(733
|
)
|
(3,908
|
)
|
(3,221
|
)
|
(9,624
|
)
|
||||||||
|
Depreciation and amortization
|
(63,414
|
)
|
(58,464
|
)
|
(178,253
|
)
|
(139,599
|
)
|
||||||||
|
Exploration in operating units
|
(22,188
|
)
|
(27,591
|
)
|
(69,633
|
)
|
(68,793
|
)
|
||||||||
|
Mining royalties
|
(5,229
|
)
|
(8,907
|
)
|
(18,175
|
)
|
(22,555
|
)
|
||||||||
|
Total operating costs
|
(247,225
|
)
|
(275,832
|
)
|
(735,614
|
)
|
(689,551
|
)
|
||||||||
|
Gross profit
|
24,628
|
92,924
|
175,743
|
214,197
|
||||||||||||
|
Operating expenses, net
|
||||||||||||||||
|
Administrative expenses
|
(15,880
|
)
|
(20,226
|
)
|
(61,655
|
)
|
(60,940
|
)
|
||||||||
|
Exploration in non-operating areas
|
(9,758
|
)
|
(4,388
|
)
|
(24,846
|
)
|
(12,216
|
)
|
||||||||
|
Selling expenses
|
(7,597
|
)
|
(5,907
|
)
|
(20,366
|
)
|
(16,074
|
)
|
||||||||
|
Provision for contingencies and others
|
(11,611
|
)
|
(1,512
|
)
|
(11,292
|
)
|
(13,328
|
)
|
||||||||
|
Other, net
|
(6,858
|
)
|
(3,502
|
)
|
(23,823
|
)
|
(11,373
|
)
|
||||||||
|
Total operating expenses, net
|
(51,704
|
)
|
(35,535
|
)
|
(141,982
|
)
|
(113,931
|
)
|
||||||||
|
Operating profit
|
(27,076
|
)
|
57,389
|
33,761
|
100,266
|
|||||||||||
|
Other income (expense), net
|
||||||||||||||||
|
Share in the results of associates
|
22,151
|
(32,908
|
)
|
71,173
|
8,901
|
|||||||||||
|
Financial income
|
1,604
|
2,178
|
3,781
|
4,651
|
||||||||||||
|
Financial costs
|
(9,991
|
)
|
(10,369
|
)
|
(28,316
|
)
|
(25,838
|
)
|
||||||||
|
Net gain (loss) from currency exchange difference
|
(473
|
)
|
(1,872
|
)
|
(21
|
)
|
2,343
|
|||||||||
|
Total other income, net
|
13,291
|
(42,971
|
)
|
46,617
|
(9,943
|
)
|
||||||||||
|
Profit (loss) before income tax
|
(13,785
|
)
|
14,418
|
80,378
|
90,323
|
|||||||||||
|
Current income tax
|
2,354
|
(8,188
|
)
|
(11,377
|
)
|
(18,846
|
)
|
|||||||||
|
Deferred income tax
|
(2,218
|
)
|
(9,853
|
)
|
(12,036
|
)
|
(8,228
|
)
|
||||||||
|
Profit (loss) from continuing operations
|
(13,649
|
)
|
(3,623
|
)
|
56,965
|
63,249
|
||||||||||
|
Discontinued operations
|
||||||||||||||||
|
Profit (loss) from discontinued operations
|
(536
|
)
|
(1,494
|
)
|
(1,287
|
)
|
2,145
|
|||||||||
|
Net profit (loss)
|
(14,185
|
)
|
(5,117
|
)
|
55,678
|
65,394
|
||||||||||
|
Attributable to:
|
||||||||||||||||
|
Owners of the parent
|
(10,287
|
)
|
(12,023
|
)
|
59,409
|
52,513
|
||||||||||
|
Non-controlling interest
|
(3,898
|
)
|
6,906
|
(3,731
|
)
|
12,881
|
||||||||||
|
(14,185
|
)
|
(5,117
|
)
|
55,678
|
65,394
|
|||||||||||
|
Basic and diluted profit (loss) per share attributable to
|
||||||||||||||||
|
equity holders of the parent, stated in U.S. dollars
|
(0.04
|
)
|
(0.05
|
)
|
0.23
|
0.21
|
||||||||||
|
Weighted average number of shares outstanding
|
||||||||||||||||
|
(common and investment), in units
|
253,986,867
|
253,986,867
|
253,986,867
|
253,986,867
|
||||||||||||
Compañía de Minas Buenaventura S.A.A.
Third Quarter 2017 Results
Page 26 of 27
|
Compañía de Minas Buenaventura S.A.A. and Subsidiaries
|
||||||||||||||||
|
Consolidated Statement of Cash Flows
|
||||||||||||||||
|
For the three and nine-month periods ended September 30, 2018 and 2017
|
||||||||||||||||
|
For the three-month period
ended September 30,
|
For the nine-month period
ended September 30,
|
|||||||||||||||
|
2018
|
2017
|
2018
|
2017
|
|||||||||||||
|
US$(000)
|
US$(000)
|
US$(000)
|
US$(000)
|
|||||||||||||
|
Operating activities
|
||||||||||||||||
|
Proceeds from sales
|
251,382
|
316,646
|
951,930
|
848,880
|
||||||||||||
|
Value Added Tax recovered
|
20,490
|
28,376
|
71,310
|
90,373
|
||||||||||||
|
Proceeds from dividends
|
758
|
1,857
|
44,563
|
7,032
|
||||||||||||
|
Royalty received
|
4,542
|
4,511
|
14,180
|
16,020
|
||||||||||||
|
Interest received
|
747
|
33
|
902
|
3,150
|
||||||||||||
|
Payments to suppliers and third-parties
|
(191,731
|
)
|
(209,375
|
)
|
(637,068
|
)
|
(647,965
|
)
|
||||||||
|
Payments to employees
|
(38,520
|
)
|
(36,553
|
)
|
(126,566
|
)
|
(123,552
|
)
|
||||||||
|
Payment of income taxes
|
(7,915
|
)
|
(3,245
|
)
|
(28,345
|
)
|
(19,784
|
)
|
||||||||
|
Payments of interest
|
(8,999
|
)
|
(7,184
|
)
|
(22,657
|
)
|
(21,355
|
)
|
||||||||
|
Payments of mining royalties
|
(2,663
|
)
|
(5,867
|
)
|
(10,944
|
)
|
(14,672
|
)
|
||||||||
|
Net cash and cash equivalents provided by operating activities
|
28,091
|
89,199
|
257,305
|
138,127
|
||||||||||||
|
Investing activities
|
||||||||||||||||
|
Proceeds from sales of mining concessions, property, plant and equipment
|
314
|
266
|
374
|
1,704
|
||||||||||||
|
Proceeds from loans
|
-
|
-
|
-
|
124,800
|
||||||||||||
|
Acquisitions of mining concessions, development costs, property, plant and equipment
|
(18,504
|
)
|
(47,933
|
)
|
(70,097
|
)
|
(196,841
|
)
|
||||||||
|
Payments to other assets
|
(1,526
|
)
|
-
|
(2,992
|
)
|
-
|
||||||||||
|
Net cash and cash equivalents (provided by) used in investing activities
|
(19,716
|
)
|
(47,667
|
)
|
(72,715
|
)
|
(70,337
|
)
|
||||||||
|
Financing activities
|
||||||||||||||||
|
Proceeds of bank loans
|
-
|
-
|
80,000
|
245,000
|
||||||||||||
|
Payments of bank loans
|
-
|
-
|
(80,000
|
)
|
(165,000
|
)
|
||||||||||
|
Payments of financial obligations
|
(10,075
|
)
|
(7,010
|
)
|
(32,603
|
)
|
(22,746
|
)
|
||||||||
|
Dividends paid to controlling interest
|
-
|
-
|
(7,554
|
)
|
(14,479
|
)
|
||||||||||
|
Dividends paid to non-controlling interest
|
(2,213
|
)
|
(1,320
|
)
|
(3,960
|
)
|
(4,516
|
)
|
||||||||
|
Increase of restricted bank accounts
|
(83
|
)
|
1,635
|
(79
|
)
|
(1,106
|
)
|
|||||||||
|
Net cash and cash equivalents provided by (used in) financing activities
|
(12,371
|
)
|
(6,695
|
)
|
(44,196
|
)
|
37,153
|
|||||||||
|
Net increase in cash and cash equivalents during the period
|
(3,996
|
)
|
34,837
|
140,394
|
104,943
|
|||||||||||
|
Cash and cash equivalents at the beginning of the period
|
358,941
|
150,650
|
214,551
|
80,544
|
||||||||||||
|
Cash and cash equivalents at period-end
|
354,945
|
185,487
|
354,945
|
185,487
|
||||||||||||
Compañía de Minas Buenaventura S.A.A.
Third Quarter 2017 Results
Page 27 of 27
|
For the three-month period
ended September 30,
|
For the nine-month period
ended September 30,
|
|||||||||||||||
|
2018
|
2017
|
2018
|
2017
|
|||||||||||||
|
US$(000)
|
US$(000)
|
US$(000)
|
US$(000)
|
|||||||||||||
|
Reconciliation of net profit to cash and cash equivalents provided
|
||||||||||||||||
|
by operating activities
|
||||||||||||||||
|
Net loss
|
(14,185
|
)
|
(5,117
|
)
|
55,678
|
65,394
|
||||||||||
|
Plus (less):
|
||||||||||||||||
|
Depreciation and amortization
|
63,414
|
58,464
|
178,253
|
139,599
|
||||||||||||
|
Hedge derivative instruments
|
(4,426
|
)
|
1,904
|
11,317
|
7,633
|
|||||||||||
|
Deferred income tax expense (income)
|
2,218
|
9,853
|
12,036
|
8,228
|
||||||||||||
|
Provision for estimated fair value of embedded derivatives related to concentrate
|
||||||||||||||||
|
sales and adjustments on open liquidations
|
498
|
(3,583
|
)
|
15,875
|
(7,389
|
)
|
||||||||||
|
Income attributable to non-controlling interest
|
3,898
|
(6,906
|
)
|
3,731
|
(12,881
|
)
|
||||||||||
|
Accretion expense of provision for closure of mining units and exploration projects
|
(1,498
|
)
|
600
|
762
|
2,108
|
|||||||||||
|
Net share in results of associates
|
(22,151
|
)
|
32,908
|
(71,173
|
)
|
(8,901
|
)
|
|||||||||
|
Recovery (expense) for provision for contingencies
|
11,611
|
1,512
|
11,292
|
13,328
|
||||||||||||
|
Net loss (gain) from currency exchange difference
|
473
|
1,872
|
21
|
(2,343
|
)
|
|||||||||||
|
Reversal (provision) for impairment loss of inventories
|
7,649
|
1,494
|
7,265
|
2,302
|
||||||||||||
|
Bonus provision - executives & employes
|
10,014
|
-
|
10,014
|
-
|
||||||||||||
|
Other net
|
10,980
|
(7,900
|
)
|
4,235
|
(6,765
|
)
|
||||||||||
|
Net changes in operating assets and liabilities:
|
||||||||||||||||
|
Decrease (increase) in operating assets -
|
||||||||||||||||
|
Trade and other accounts receivable
|
(5,845
|
)
|
4,648
|
66,752
|
19,051
|
|||||||||||
|
Inventories
|
7,878
|
12,951
|
1,749
|
(11,123
|
)
|
|||||||||||
|
Income tax credit
|
(7,841
|
)
|
(167
|
)
|
1,871
|
1,535
|
||||||||||
|
Prepaid expenses
|
5,536
|
1,860
|
8,401
|
5,375
|
||||||||||||
|
Increase (decrease) in operating liabilities -
|
||||||||||||||||
|
Trade and other accounts payable
|
(2,888
|
)
|
(9,723
|
)
|
(68,789
|
)
|
(54,776
|
)
|
||||||||
|
Provisions
|
(38,292
|
)
|
(7,571
|
)
|
(36,171
|
)
|
(22,174
|
)
|
||||||||
|
Income tax payable
|
290
|
243
|
(377
|
)
|
(7,106
|
)
|
||||||||||
|
Proceeds from dividends
|
758
|
1,857
|
44,563
|
7,032
|
||||||||||||
|
Net cash and cash equivalents provided by operating activities
|
28,091
|
89,199
|
257,305
|
138,127
|
||||||||||||