KBW Insurance Conference Investor Presentation Randy Ramlo, President and Chief Executive Officer Mike Wilkins, Executive Vice President Dianne Lyons, Vice President and Chief Financial Officer September 5-6, 2012 Exhibit 99.1
Forward-Looking Statements This presentation may contain forward-looking statements about our operations, anticipated performance and other similar matters. The Private Securities Litigation Reform Act of 1995 provides a safe harbor under the Securities Act of 1933 and the Securities Exchange Act of 1934 for forward-looking statements. The forward-looking statements are not historical facts and involve risks and uncertainties that could cause actual results to differ materially from those expected and/or projected. Such forward-looking statements are based on current expectations, estimates, forecasts and projections about our company, the industry in which we operate, and beliefs and assumptions made by management. Words such as “expect(s),” “anticipate(s),” “intend(s),” “plan(s),” “believe(s),” “continue(s),” “seek(s),” “estimate(s),” “goal(s),” “target(s),” “forecast(s),” “project(s),” “predict(s),” “should,” “could,” “may,” “will continue,” “might,” “hope,” “can” and other words and terms of similar meaning or expression in connection with a discussion of future operating, financial performance or financial condition, are intended to identify forward-looking statements. These statements are not guarantees of future performance and involve risks, uncertainties and assumptions that are difficult to predict. Therefore, actual outcomes and results may differ materially from what is expressed in such forward-looking statements. Information concerning factors that could cause actual results to differ materially from those in the forward-looking statements is contained in Part I Item 1A “Risk Factors” of our annual report on Form 10-K for the year ended December 31, 2011, filed with the SEC on March 15, 2012, and in our report on Form 10-Q for the quarter ended June 30, 2012, filed with the SEC on August 8, 2012. The risks identified on Form 10-K are representative of the risks, uncertainties, and assumptions that could cause actual outcomes and results to differ materially from what is expressed in forward-looking statements. Readers are cautioned not to place undue reliance on these forward- looking statements, which speak only as of the date of this release or as of the date they are made. Except as required under the federal securities laws and the rules and regulations of the Securities and Exchange Commission, we do not have any intention or obligation to update publicly any forward-looking statements, whether as a result of new information, future events or otherwise. Reconciliations of non-GAAP measures are on Page 32 of this presentation and also available in our quarterly news release, which are available on the Investors Relations page of our website www.UnitedFireGroup.com. 2
Company Overview • Regional provider of a complete line of insurance products, including traditional commercial and personal property/casualty insurance, niche specialty programs (e.g., contractors, retail business, auto service and repair, manufacturing and religious institutions) and life insurance – Based in Cedar Rapids, Iowa – Founded in 1946, holding company formed in 2012 – $735 million in shareholders’ equity – Six regional offices with approximately 900 employees • Property/casualty book of business complemented by Surety Branch and Life Insurance Company, which contribute to earnings stability 3 United Fire Group (NASDAQ:UFCS)
Company Overview P/C Cos. Rated “A” by A.M. Best • $627 million in annual net written premiums • 2012 combined ratio of 95.1% • 90% commercial lines/10% personal lines • Represented by more than 1,200 independent agencies • Licensed in 43 states and Washington DC, active in 33 United Life Ins. Co. Rated “A-” by A.M. Best • $4 billion of life insurance in force • 65% annuities/35% traditional life insurance products • Represented by more than 940 independent agencies • Licensed in 36 states, active in 28 4

Historical Financial Performance $- $5.00 $10.00 $15.00 $20.00 $25.00 $30.00 1996 1997 1998 1999 2000 2001 2002 2003 2004 2005 2006 2007 2008 2009 2010 2011 6/30/12 5 Book Value Per Share Operating ROE averaged 7.7% between 2000 and 2011
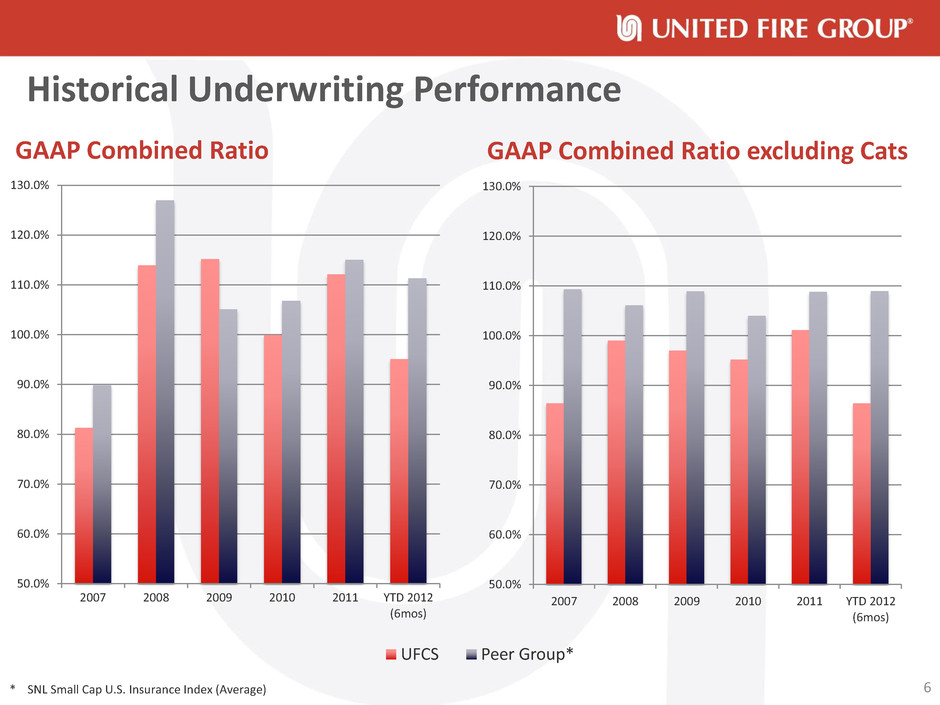
Historical Underwriting Performance GAAP Combined Ratio 50.0% 60.0% 70.0% 80.0% 90.0% 100.0% 110.0% 120.0% 130.0% 2007 2008 2009 2010 2011 YTD 2012 (6mos) 50.0% 60.0% 70.0% 80.0% 90.0% 100.0% 110.0% 120.0% 130.0% 2007 2008 2009 2010 2011 YTD 2012 (6mos) UFCS Peer Group* 6 GAAP Combined Ratio excluding Cats * SNL Small Cap U.S. Insurance Index (Average)

Recent Results • Double-digit top-line growth: – Low- to mid-single digit rate increases – Solid commercial lines retention business – New business contribution reflected diligent account-based underwriting practices • Sub-100% combined ratio: – Benefits of improving pricing environment – Continued favorable prior-year reserve development – Significantly lower catastrophe losses • Offset by 2 percentage point increase in expense ratio due to DAC accounting change – Expect full-year impact on net income in range of $14-17 million • Life insurance net written premiums increased more than 22% • Net investment income rises – Invested assets growth more than offset decline in yield 2012 Interim Results ($ in millions) 2Q 2012 % Chng 1H 2012 % Chng Net written premiums $196.4 14.1% $375.8 27.2% Net investment income 28.7 3.6 57.9 5.6 Realized gains or losses 0.6 (49.8) 3.4 (11.1) Net income 14.7 182.1 33.9 NM Operating income 14.3 177.0 31.7 NM Net income per share $0.58 184.1 $1.33 NM Operating income per share $0.56 178.9 $1.24 NM Book value per share n/a $28.91 6.2 Second-Quarter Highlights 7
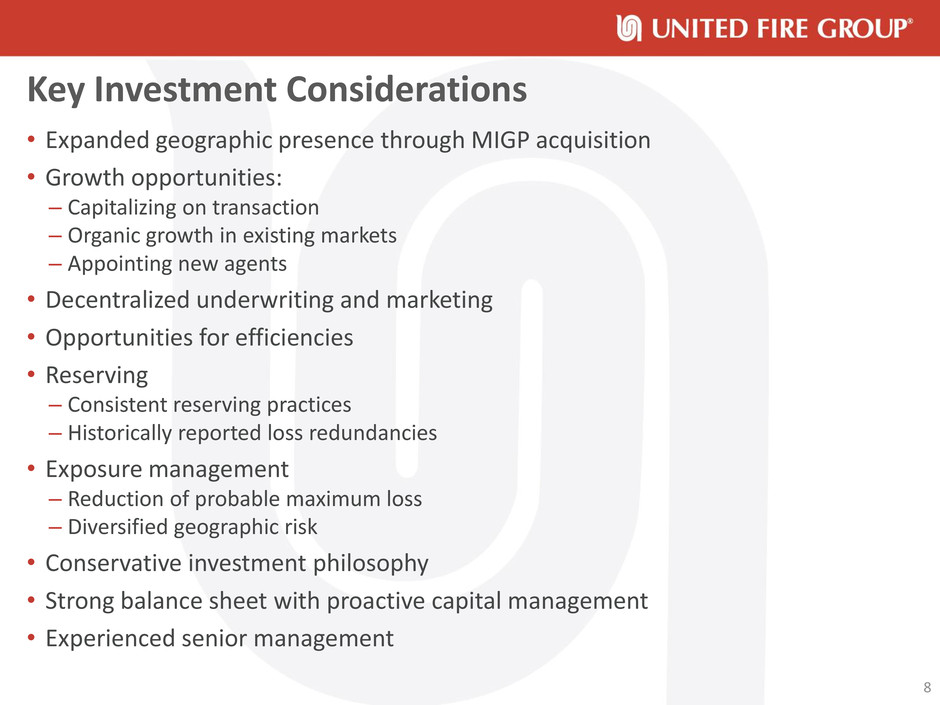
Key Investment Considerations • Expanded geographic presence through MIGP acquisition • Growth opportunities: – Capitalizing on transaction – Organic growth in existing markets – Appointing new agents • Decentralized underwriting and marketing • Opportunities for efficiencies • Reserving – Consistent reserving practices – Historically reported loss redundancies • Exposure management – Reduction of probable maximum loss – Diversified geographic risk • Conservative investment philosophy • Strong balance sheet with proactive capital management • Experienced senior management 8

P& C WV WA GA SC NC IL ID MT UT NM OK TN KY OH MI VA MD DE NY VT NH MA RI ME WY KS NE SD ND MN IA MO AR LA MS AL IN WI TX FL CO CT DC OR CA NV PA AZ NJ V Expanded Geographic Presence Through Acquisition • All-cash transaction valued at approximately $191 million • Common business approach that diversified geographic risk • Since closing: – Generating savings through administrative and support consolidating and elimination of duplicate public company expenses and management salaries – Consolidated reinsurance programs – Transition to UFCS IT underway (imaging, claims, policy processing), substantial cost savings anticipated – Retained MIGP agent force, saw 4.2% production increase in 2Q12 vs. 2Q11 Expanded Scope in 2011 with MIGP Acquisition Now Licensed in 43 States and Washington DC, Active in 33 9 United Fire states MIGP states
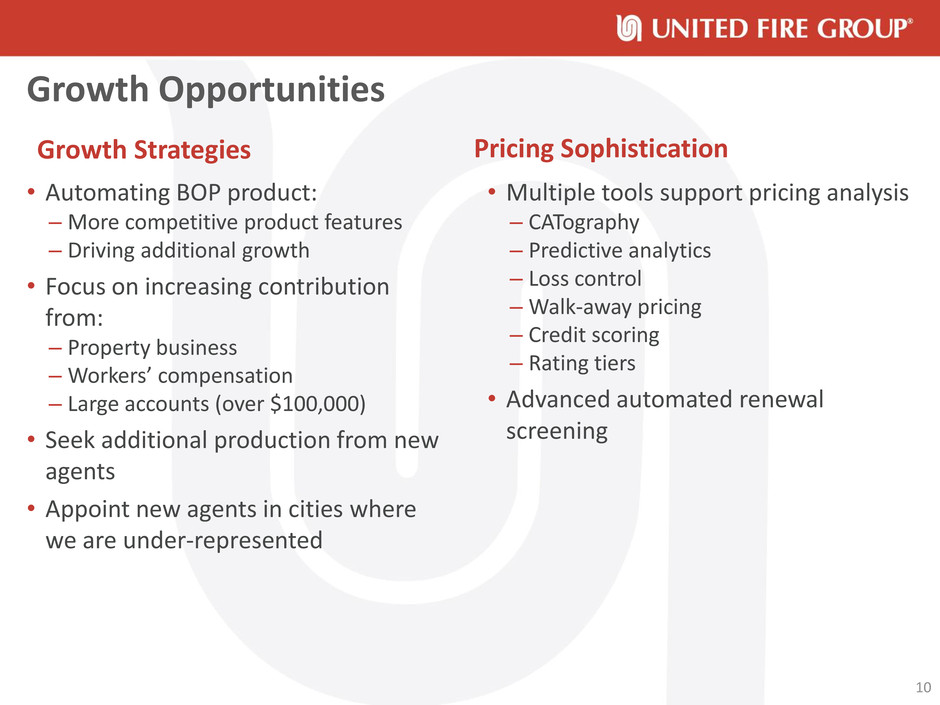
Growth Opportunities • Automating BOP product: – More competitive product features – Driving additional growth • Focus on increasing contribution from: – Property business –Workers’ compensation – Large accounts (over $100,000) • Seek additional production from new agents • Appoint new agents in cities where we are under-represented • Multiple tools support pricing analysis – CATography – Predictive analytics – Loss control –Walk-away pricing – Credit scoring – Rating tiers • Advanced automated renewal screening 10 Pricing Sophistication Growth Strategies

Growth Opportunities -16.00% -12.00% -8.00% -4.00% 0.00% 4.00% 8.00% UFG MarketScout CIAB CLIPS • MarketScout is the nation's largest on-line insurance exchange with a distribution system to over 50,000 retail insurance agencies. The composite average includes all commercial lines and sizes of accounts. Website: marketscout.com • Council of Insurance Agents & Brokers (CIAB) asks its members each quarter to provide up-to-date information on pricing trends, underwriting practices and availability of all commercial property/casualty lines for its Commercial Insurance Market Index. Website: ciab.com • CLIPS is Towers Watson’s U.S. commercial lines pricing and profitability survey. Quarterly information comes directly from carriers. Website: towerswatson.com 11 Rate Change Comparison Notes on Rate Change Data

Expertise with “Main Street” Businesses Net Written Premiums by Product Line Property/Casualty Percent of total NPW Fire & Allied Lines 37% Automobile 25 Other Liability 22 Workers’ Compensation 10 Surety 3 Reinsurance Assumed 2 Miscellaneous 1 Top 15 Classes Show Main Street Focus Property/Casualty Percent of total DPW Concrete construction 8% Carpentry – residential 7 Excavation 7 Lessors’ risk 6 Carpentry – commercial 4 Land grading/earth moving 4 Automobile repair or service shops 4 Electrical work 4 Metal goods manufacturing/machine shops 4 Plumbing – commercial 3 Plumbing – residential 3 Roofing – commercial 3 Landscape gardening 3 Heating and air conditioning 2 Restaurants 2 Total of top 15 classes 65 12

Decentralized Underwriting and Marketing Property/Casualty Percent of total DPW Iowa 13% Texas 12 California 11 New Jersey 7 Missouri 7 All Other 49 • Local market knowledge • Strong agency relationships • Disciplined underwriting • Service center • Exceptional customer service • Superior loss control services • Fair and ethical claims handling • Efficient and effective technology 13 Direct Written Premiums by State Competitive Advantages

Decentralized Underwriting and Marketing Agency Philosophy • Continually monitor agencies for compatibility • Criteria: loss ratio, volume, relationship • Seek “top three” position (as measured by direct premiums written) • Competitive performance-based compensation Agency Force (as of December 31, 2011) • More than 1,200 independent agencies • Average agency size: over $500,000 • Size of largest agency: $7.5 million • Premium from top 20: $90.1 million • Premium from top 100: $219.4 million of $627 million 14
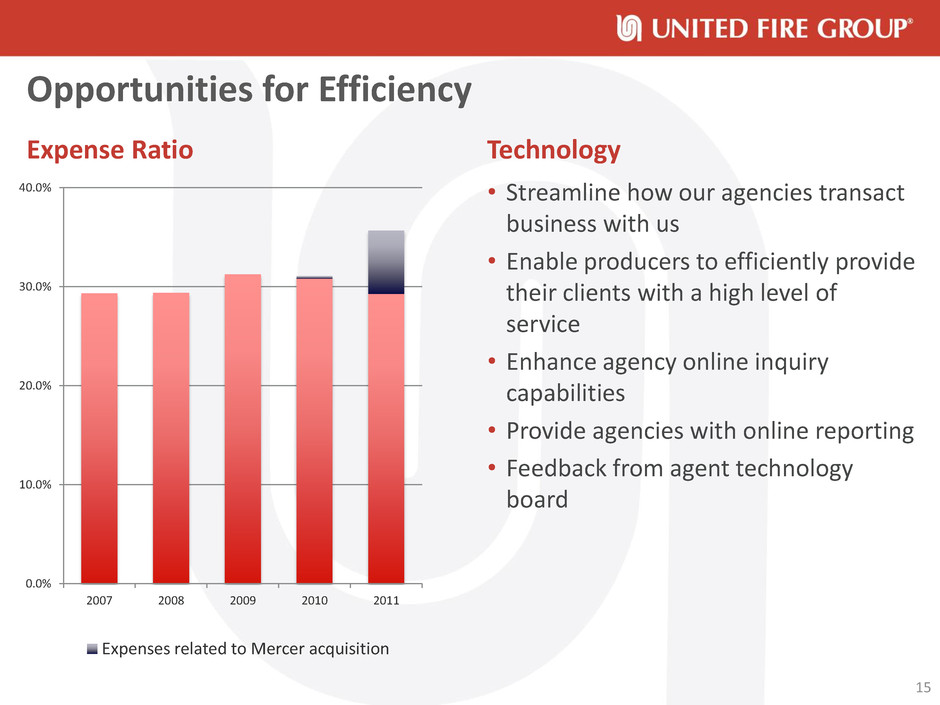
Opportunities for Efficiency 0.0% 10.0% 20.0% 30.0% 40.0% 2007 2008 2009 2010 2011 Expenses related to Mercer acquisition • Streamline how our agencies transact business with us • Enable producers to efficiently provide their clients with a high level of service • Enhance agency online inquiry capabilities • Provide agencies with online reporting • Feedback from agent technology board 15 Expense Ratio Technology
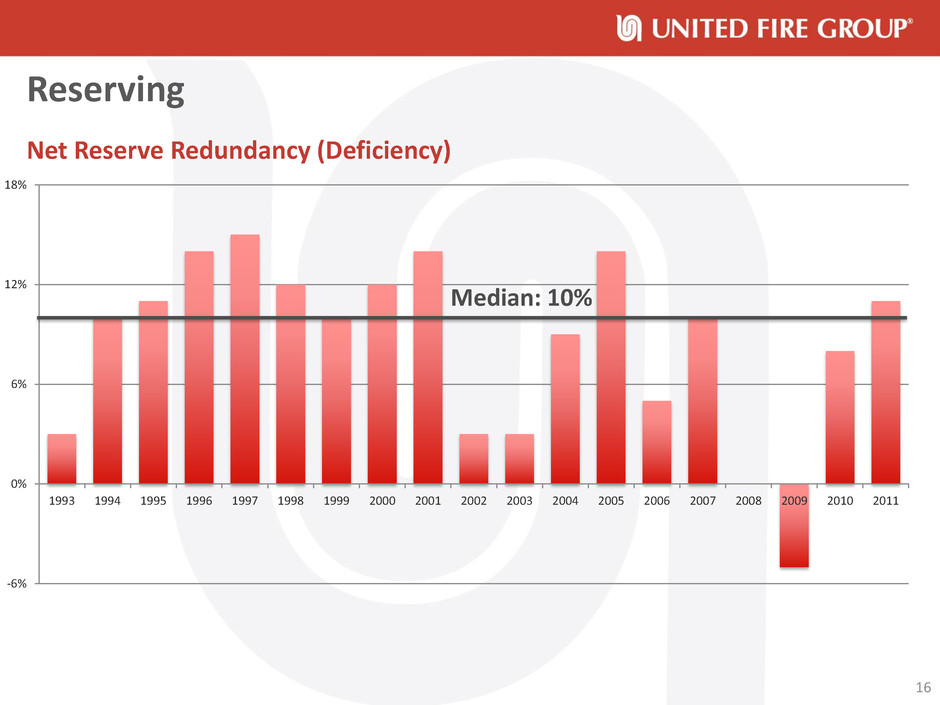
Reserving Net Reserve Redundancy (Deficiency) -6% 0% 6% 12% 18% 1993 1994 1995 1996 1997 1998 1999 2000 2001 2002 2003 2004 2005 2006 2007 2008 2009 2010 2011 16 Median: 10%
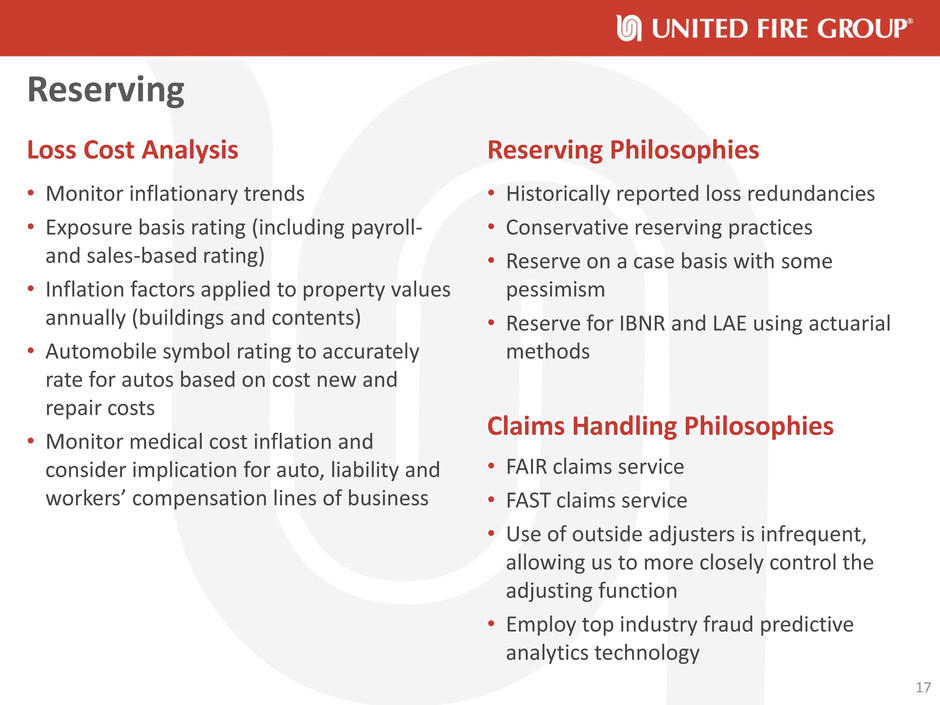
Reserving Loss Cost Analysis • Monitor inflationary trends • Exposure basis rating (including payroll- and sales-based rating) • Inflation factors applied to property values annually (buildings and contents) • Automobile symbol rating to accurately rate for autos based on cost new and repair costs • Monitor medical cost inflation and consider implication for auto, liability and workers’ compensation lines of business Reserving Philosophies • Historically reported loss redundancies • Conservative reserving practices • Reserve on a case basis with some pessimism • Reserve for IBNR and LAE using actuarial methods Claims Handling Philosophies • FAIR claims service • FAST claims service • Use of outside adjusters is infrequent, allowing us to more closely control the adjusting function • Employ top industry fraud predictive analytics technology 17
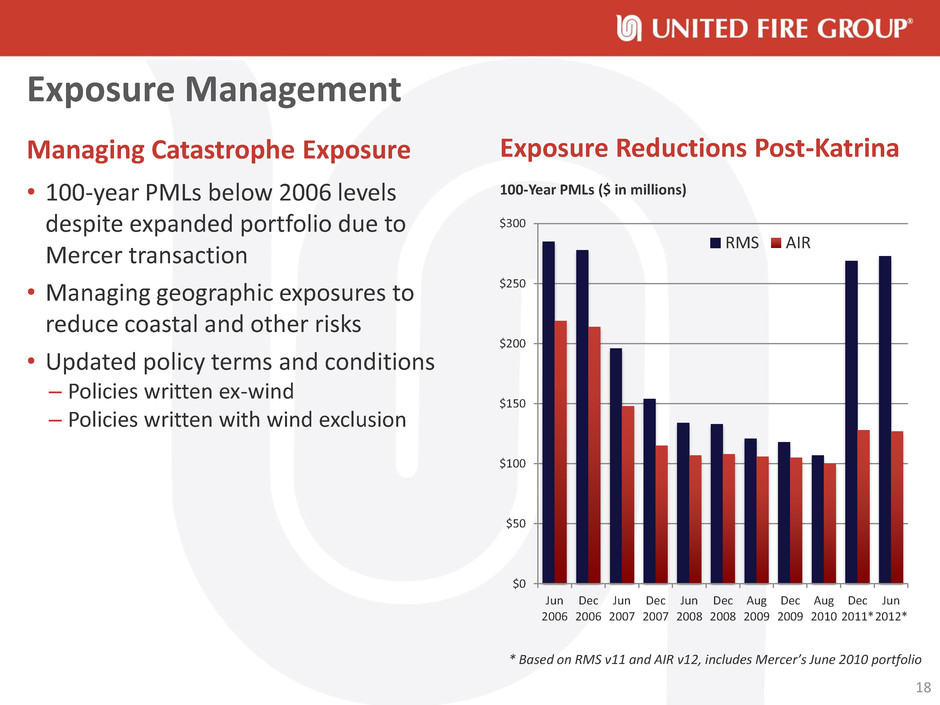
Exposure Management • 100-year PMLs below 2006 levels despite expanded portfolio due to Mercer transaction • Managing geographic exposures to reduce coastal and other risks • Updated policy terms and conditions – Policies written ex-wind – Policies written with wind exclusion 18 Managing Catastrophe Exposure $0 $50 $100 $150 $200 $250 $300 Jun 2006 Dec 2006 Jun 2007 Dec 2007 Jun 2008 Dec 2008 Aug 2009 Dec 2009 Aug 2010 Dec 2011* Jun 2012* 100-Year PMLs ($ in millions) RMS AIR Exposure Reductions Post-Katrina * Based on RMS v11 and AIR v12, includes Mercer’s June 2010 portfolio
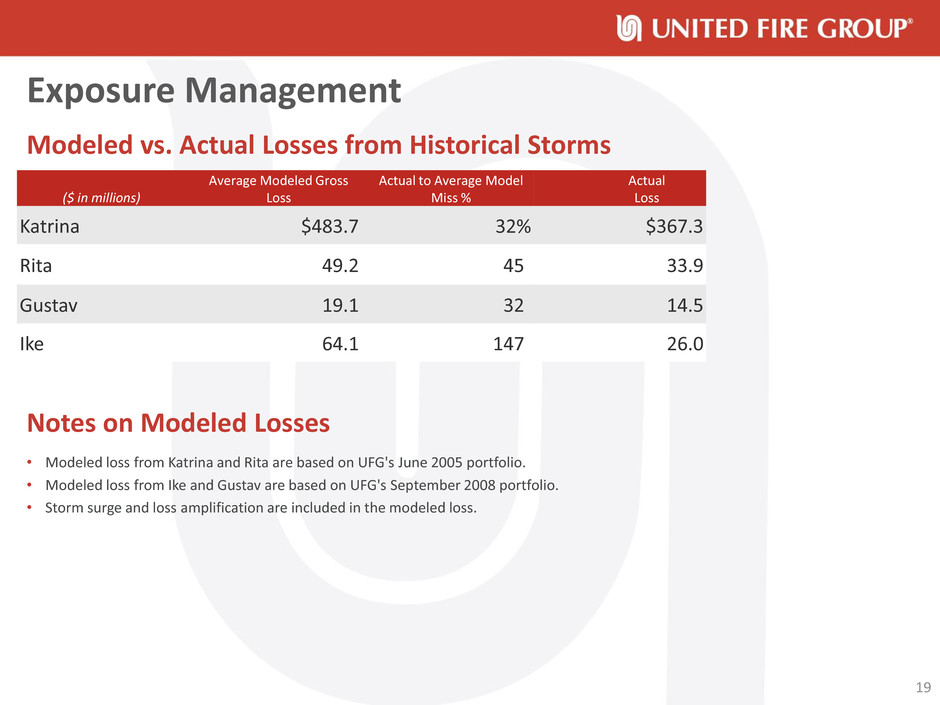
Exposure Management ($ in millions) Average Modeled Gross Loss Actual to Average Model Miss % Actual Loss Katrina $483.7 32% $367.3 Rita 49.2 45 33.9 Gustav 19.1 32 14.5 Ike 64.1 147 26.0 Notes on Modeled Losses • Modeled loss from Katrina and Rita are based on UFG's June 2005 portfolio. • Modeled loss from Ike and Gustav are based on UFG's September 2008 portfolio. • Storm surge and loss amplification are included in the modeled loss. Modeled vs. Actual Losses from Historical Storms 19

Exposure Management 20 Catastrophe Loss Contribution $0 $50 $100 $150 $200 $250 $300 $350 $400 $450 2007 2008 2009 2010 2011 YTD 22012 (6mos) Non-cat losses Cat losses Net of reinsurance 2012 Reinsurance Programs • Catastrophe program – $180 million excess of $20 million retention – 5% co-participation on losses between $20 million and $200 million • Core program – $2 million retention – $13 million per risk property coverage – $38 million per occurrence casualty coverage

Conservative Investment Portfolio (at June 30, 2012) $3.0 Billion Investment Portfolio ($ in millions) US Gov't $84 3% Other* $52 2% Municipals $762 25% Mortgage Backed $176 6% Equity Securities $174 6% Foreign $235 8% Utilities $257 8% Financial $308 10% Industrial $983 32% Corporate Bonds $1,783 58% 21 * Other includes trading securities, mortgage loans, policy loans and other long-term investments.

Conservative Investment Portfolio (at June 30, 2012) Portfolio Management • Manage our own portfolios – Maintain a fixed-to-equity ratio of 90/10 • Addressing low interest rate environment by: – Continuing to purchase quality investments rated investment grade or better – More closely matching duration of our investment portfolio to liabilities • Portfolio yield of 4.34% and duration of 4 years at June 30, 2012 • International corporate bond holdings account for 8% of portfolio Highly Rated Fixed Income Portfolio $ (in millions) % AAA $397 14% AA 640 23 A 684 24 Baa/BBB 1,010 36 Other/Not Rated 88 3 Total $2,819 100 22

Financially Strong • Strong economic capital position • Prudent reinsurance programs • Outstanding debt paid off in July 2012 • History of consistently conservative reserves • Use of capital – acquisition of Mercer Insurance Company Share Repurchase Ave. Price Per Share Number of Shares Repurchased Total Price ($ in millions) Six Months Ended 6/30/2012 $20.94 101,901 $2.1 12 Months Ended 12/31/2011 17.69 702,947 12.4 Enterprise Risk Management • ERM management committee meets quarterly • Board of Directors risk management committee oversees ERM effort – Management reviews risk metrics with risk management committee • Risk appetite statement developed • Economic capital modeling used to assess risk Capital Management Philosophy 23

Key Investment Considerations • Expanded geographic presence through MIGP acquisition • Growth opportunities: – Capitalizing on transaction – Organic growth in existing markets – Appointing new agents • Decentralized underwriting and marketing • Opportunities for efficiencies • Reserving – Consistent reserving practices – Historically reported loss redundancies • Exposure management – Reduction of probable maximum loss – Diversified geographic risk • Conservative investment philosophy • Strong balance sheet with proactive capital management • Experienced senior management 24
Investor Presentation Questions
Appendix

2011 Product Niches • Religious Institutions – Churches • Auto Service and Repair Garages • Garbage Refuse haulers • Condominiums • Small Artisan Service and Repair Contractors • Retail Small business (Business Owners Program) • Land Improvement Contractors (Excavation, Land Grading) • Commercial Output Program (Manufacturing) • Contractors E & O • Mechanical Contractors • Plumbing & Heating Contractors • Metal Goods Fabricators • Machine Shops • Restaurants • Golf Courses • Winery Program • Aggregate Truckers (Sand and Gravel Haulers) • Peripheral Oil Field Contractors • Inland Marine • Micro Brewers • Water Well Drillers • Agriculture Service Contractors • Program Business • Commercial Roofers • Hardware Stores 27

Foreign Investment Exposure International Holdings by Country Country Market ($ in millions) Pct of Mkt United Kingdom $64.9 40.1% Switzerland 26.7 16.5 Netherlands 22.9 14.2 Australia 11.9 7.4 Germany 5.7 3.5 India 4.9 3.0 Luxembourg 5.4 3.3 Ireland 4.3 2.7 Israel 4.2 2.6 Hong Kong 3.2 2.0 Qatar 3.2 2.0 Spain 2.0 1.3 South Korea 1.7 1.0 Norway 0 .8 0.5 Foreign, Non-Canada 161.8 100.0 International Holdings by Sector Sector Market ($ in millions) Pct of Mkt Pct Total Portfolio Oil & Gas $45.2 27.9% 1.57% Industrials 22.5 13.9 0.78 Banks 21.4 13.2 0.74 Healthcare 15.5 9.6 0.54 Financials 15.0 9.3 0.52 Electric Utility 13.1 8.1 0.45 Basic Resources 12.9 7.9 0.45 Telecommunications 9.9 6.1 0.35 Insurance 3.2 2.0 0.11 Media 3.1 1.9 0.11 Foreign, Non-Canada 161.8 100.0 5.63 Notes • Fixed Income portfolio only; “Country” indicates headquarter domicile • No direct Sovereign exposure; 68.2% of Foreign holdings are Non-Canadian • No local currency or foreign exchange risk – all coupon and principal amounts are US$ denominated • Investment Grade Corporates only; no structured products, private placements or alternative investments • Bank exposure is limited to the northern peripheral countries (e.g., Germany, the U.K.); No “PIIGS” • Well diversified, liquid names – no single position is greater than $5 million (i.e., 32 basis points) • Foreign exposure (Canadian and non-Canadian) is 8.2% of the total Fixed Income portfolio 28
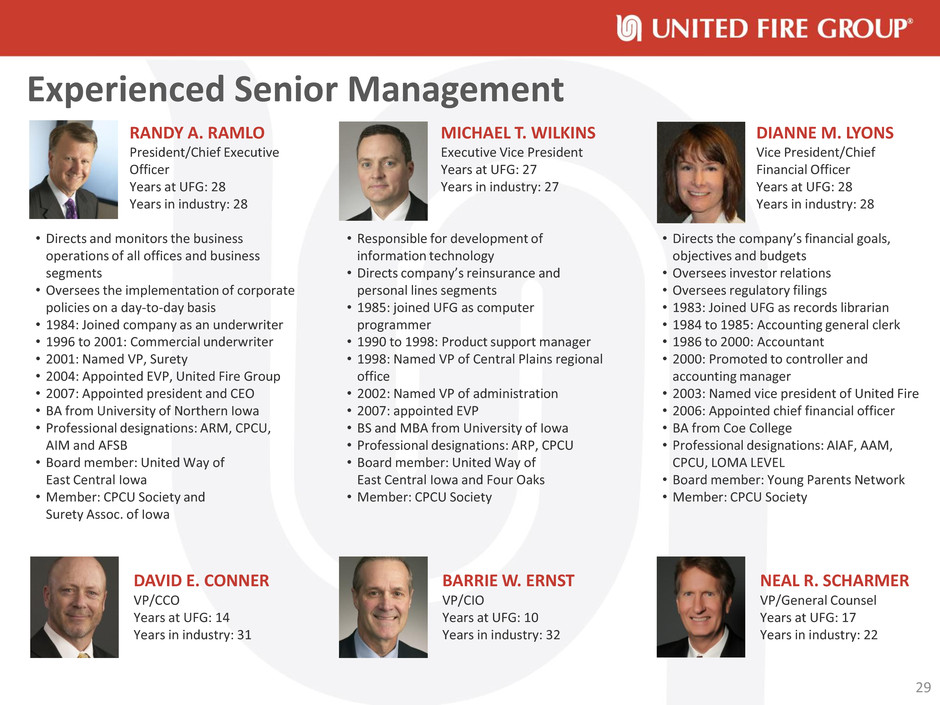
DAVID E. CONNER VP/CCO Years at UFG: 14 Years in industry: 31 BARRIE W. ERNST VP/CIO Years at UFG: 10 Years in industry: 32 NEAL R. SCHARMER VP/General Counsel Years at UFG: 17 Years in industry: 22 DIANNE M. LYONS Vice President/Chief Financial Officer Years at UFG: 28 Years in industry: 28 • Directs the company’s financial goals, objectives and budgets • Oversees investor relations • Oversees regulatory filings • 1983: Joined UFG as records librarian • 1984 to 1985: Accounting general clerk • 1986 to 2000: Accountant • 2000: Promoted to controller and accounting manager • 2003: Named vice president of United Fire • 2006: Appointed chief financial officer • BA from Coe College • Professional designations: AIAF, AAM, CPCU, LOMA LEVEL • Board member: Young Parents Network • Member: CPCU Society RANDY A. RAMLO President/Chief Executive Officer Years at UFG: 28 Years in industry: 28 • Directs and monitors the business operations of all offices and business segments • Oversees the implementation of corporate policies on a day-to-day basis • 1984: Joined company as an underwriter • 1996 to 2001: Commercial underwriter • 2001: Named VP, Surety • 2004: Appointed EVP, United Fire Group • 2007: Appointed president and CEO • BA from University of Northern Iowa • Professional designations: ARM, CPCU, AIM and AFSB • Board member: United Way of East Central Iowa • Member: CPCU Society and Surety Assoc. of Iowa MICHAEL T. WILKINS Executive Vice President Years at UFG: 27 Years in industry: 27 • Responsible for development of information technology • Directs company’s reinsurance and personal lines segments • 1985: joined UFG as computer programmer • 1990 to 1998: Product support manager • 1998: Named VP of Central Plains regional office • 2002: Named VP of administration • 2007: appointed EVP • BS and MBA from University of Iowa • Professional designations: ARP, CPCU • Board member: United Way of East Central Iowa and Four Oaks • Member: CPCU Society Experienced Senior Management 29
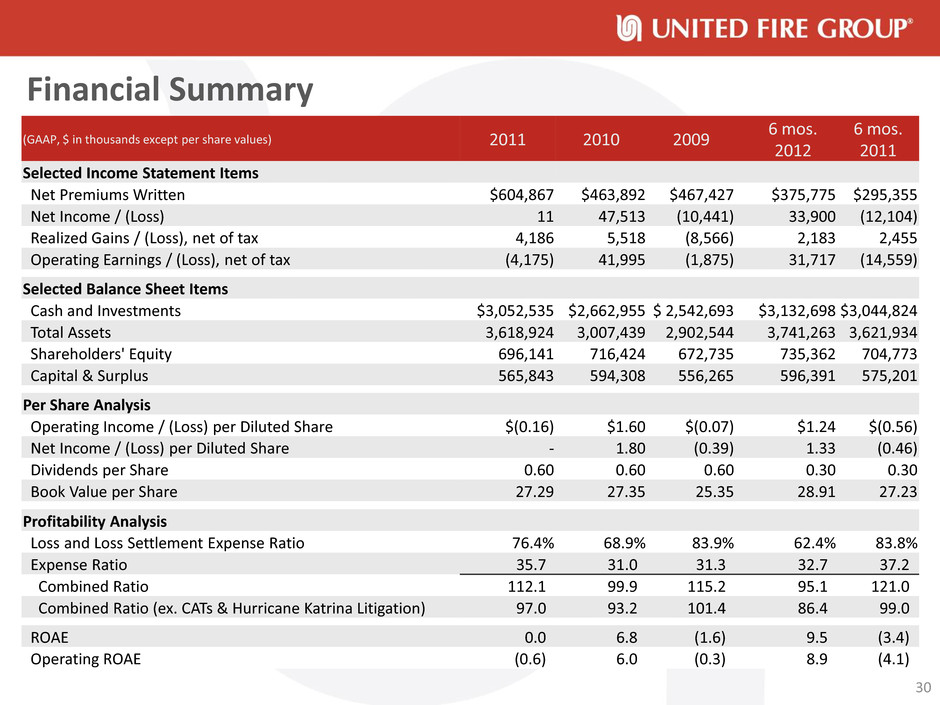
Financial Summary (GAAP, $ in thousands except per share values) 2011 2010 2009 6 mos. 2012 6 mos. 2011 Selected Income Statement Items Net Premiums Written $604,867 $463,892 $467,427 $375,775 $295,355 Net Income / (Loss) 11 47,513 (10,441) 33,900 (12,104) Realized Gains / (Loss), net of tax 4,186 5,518 (8,566) 2,183 2,455 Operating Earnings / (Loss), net of tax (4,175) 41,995 (1,875) 31,717 (14,559) Selected Balance Sheet Items Cash and Investments $3,052,535 $2,662,955 $ 2,542,693 $3,132,698 $3,044,824 Total Assets 3,618,924 3,007,439 2,902,544 3,741,263 3,621,934 Shareholders' Equity 696,141 716,424 672,735 735,362 704,773 Capital & Surplus 565,843 594,308 556,265 596,391 575,201 Per Share Analysis Operating Income / (Loss) per Diluted Share $(0.16) $1.60 $(0.07) $1.24 $(0.56) Net Income / (Loss) per Diluted Share - 1.80 (0.39) 1.33 (0.46) Dividends per Share 0.60 0.60 0.60 0.30 0.30 Book Value per Share 27.29 27.35 25.35 28.91 27.23 Profitability Analysis Loss and Loss Settlement Expense Ratio 76.4% 68.9% 83.9% 62.4% 83.8% Expense Ratio 35.7 31.0 31.3 32.7 37.2 Combined Ratio 112.1 99.9 115.2 95.1 121.0 Combined Ratio (ex. CATs & Hurricane Katrina Litigation) 97.0 93.2 101.4 86.4 99.0 ROAE 0.0 6.8 (1.6) 9.5 (3.4) Operating ROAE (0.6) 6.0 (0.3) 8.9 (4.1) 30

Property/Casualty Operating Segment Financial Highlights (GAAP, $ in thousands except per share values) 2011 2010 2009 6 mos. 2012 6 mos. 2011 Commercial Net Premiums Written $481,519 $363,806 $380,727 $308,465 $239,548 Net Premiums Earned 464,942 370,479 394,000 264,560 211,114 Loss and Loss Settlement Expenses 331,320 271,184 338,094 163,769 161,805 Loss and Loss Settlement Expense Ratio 71.3% 73.2% 85.8% 61.9% 76.6% Personal Net Premiums Written 57,134 40,807 38,208 31,201 25,589 Net Premiums Earned 55,568 39,731 35,735 30,873 25,043 Loss and Loss Settlement Expenses 51,725 25,576 23,641 18,428 25,582 Loss and Loss Settlement Expense Ratio 93.1% 64.4% 66.2% 59.7% 102.2% Assumed Net Premiums Written 13,270 10,295 5,892 5,204 4,616 Net Premiums Earned 13,261 10,163 5,942 5,237 4,616 Loss and Loss Settlement Expenses 24,786 (7,323) 3,986 5,333 14,402 Loss and Loss Settlement Expense Ratio 186.9% -72.1% 67.1% 101.8% NM Total Net Premiums Written 551,923 414,908 424,827 344,870 269,753 Net Premiums Earned 533,771 420,373 435,677 300,670 240,773 Loss and Loss Settlement Expenses 407,831 289,437 365,721 187,530 201,789 Loss and Loss Settlement Expense Ratio 76.4% 68.9% 83.9% 62.4% 83.8% Segment Net Income / (Loss) (7,639) 34,726 (17,677) 29,991 (16,224) 31
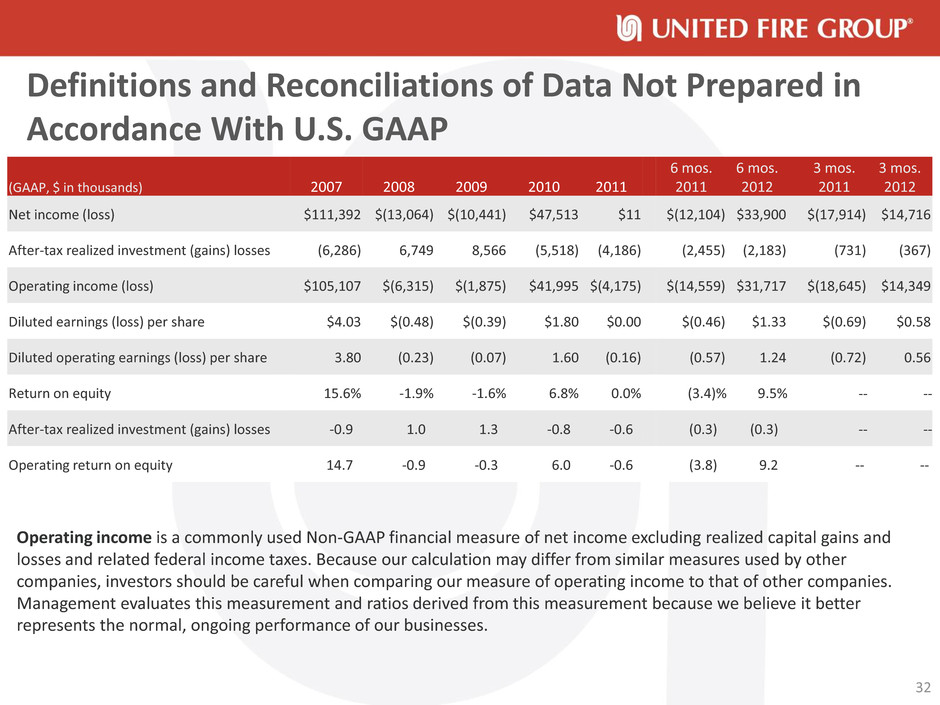
Definitions and Reconciliations of Data Not Prepared in Accordance With U.S. GAAP (GAAP, $ in thousands) 2007 2008 2009 2010 2011 6 mos. 2011 6 mos. 2012 3 mos. 2011 3 mos. 2012 Net income (loss) $111,392 $(13,064) $(10,441) $47,513 $11 $(12,104) $33,900 $(17,914) $14,716 After-tax realized investment (gains) losses (6,286) 6,749 8,566 (5,518) (4,186) (2,455) (2,183) (731) (367) Operating income (loss) $105,107 $(6,315) $(1,875) $41,995 $(4,175) $(14,559) $31,717 $(18,645) $14,349 Diluted earnings (loss) per share $4.03 $(0.48) $(0.39) $1.80 $0.00 $(0.46) $1.33 $(0.69) $0.58 Diluted operating earnings (loss) per share 3.80 (0.23) (0.07) 1.60 (0.16) (0.57) 1.24 (0.72) 0.56 Return on equity 15.6% -1.9% -1.6% 6.8% 0.0% (3.4)% 9.5% -- -- After-tax realized investment (gains) losses -0.9 1.0 1.3 -0.8 -0.6 (0.3) (0.3) -- -- Operating return on equity 14.7 -0.9 -0.3 6.0 -0.6 (3.8) 9.2 -- -- 32 Operating income is a commonly used Non-GAAP financial measure of net income excluding realized capital gains and losses and related federal income taxes. Because our calculation may differ from similar measures used by other companies, investors should be careful when comparing our measure of operating income to that of other companies. Management evaluates this measurement and ratios derived from this measurement because we believe it better represents the normal, ongoing performance of our businesses.
Investor Presentation
