Exhibit 99.1
|
|
1235 Water Street East Greenville, PA 18041 Tel 215 679-7991 Press Release |
|
Knoll Reports Strong Fourth Quarter Results
Announces program of strategic investments and initiatives to achieve longer term objectives
EAST GREENVILLE, PA, February 5, 2013 -- Knoll, Inc. (NYSE: KNL) today announced results for the fourth quarter and year ended December 31, 2012. Net sales were $250.0 million for the quarter, an increase of 12.1% from fourth quarter 2011. Operating profit was $28.1 million, or 11.2% of net sales, an increase of 1.1% from the fourth quarter of 2011. Operating profit during the fourth quarter of 2011 includes a $5.4 million curtailment benefit associated with the modification of the Company’s post-retirement medical benefits. Excluding this benefit, operating profit during the fourth quarter of 2012 increased $5.7 million or 25.4% when compared with the same period in the prior year. Net income was $17.5 million during the fourth quarter of 2012 compared to $17.4 million in the fourth quarter of 2011. Diluted earnings per share was $0.37 during the fourth quarter of 2012 compared to $0.37 for 2011. Excluding the curtailment benefit noted above, diluted earnings per share would have been $0.30 per share during the fourth quarter of 2011.
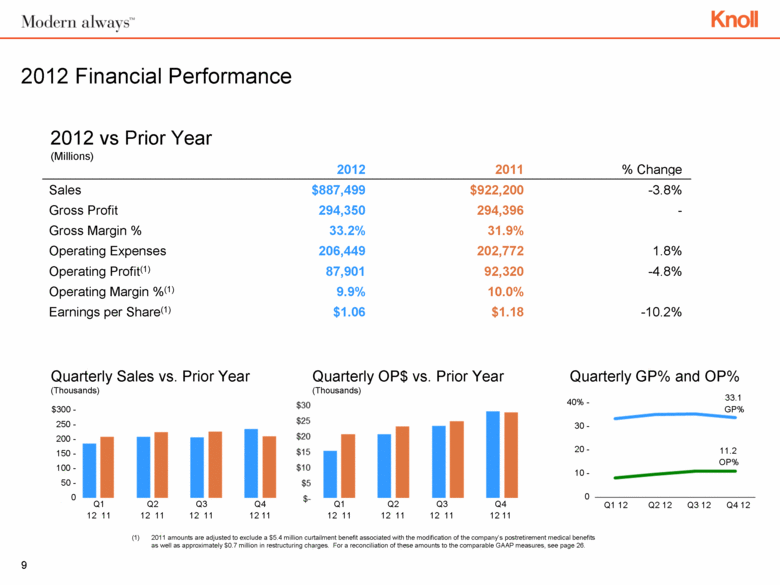
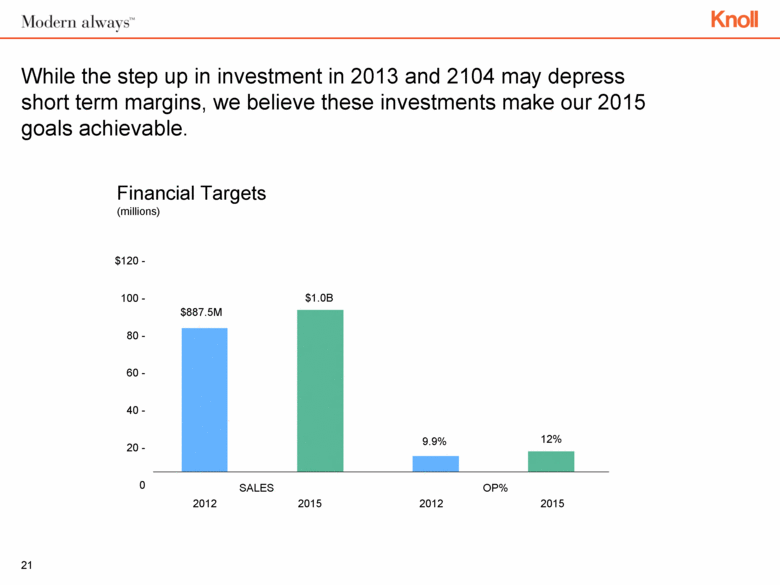
For the full year, net sales were $887.5 million, a decrease of 3.8% when compared to 2011. Operating profit was $87.9 million, or 9.9% of net sales, a decrease of 9.5% when compared to 2011. Excluding the curtailment benefit noted above and $0.7 million of restructuring charges in 2011, operating profit during 2012 decreased 4.8% when compared with the same period in the prior year. Net income was $50.0 million for 2012, a decrease of 13.8% when compared to 2011. Diluted earnings per share was $1.06 for the year compared to $1.24 per share in the prior year. Excluding the curtailment benefit and restructuring charges noted above, diluted earnings per share would have been $1.18 per share during 2011.
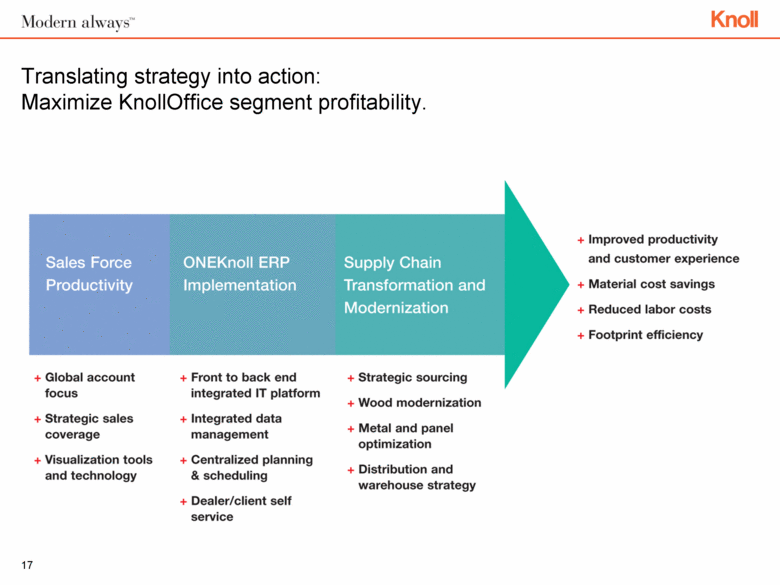
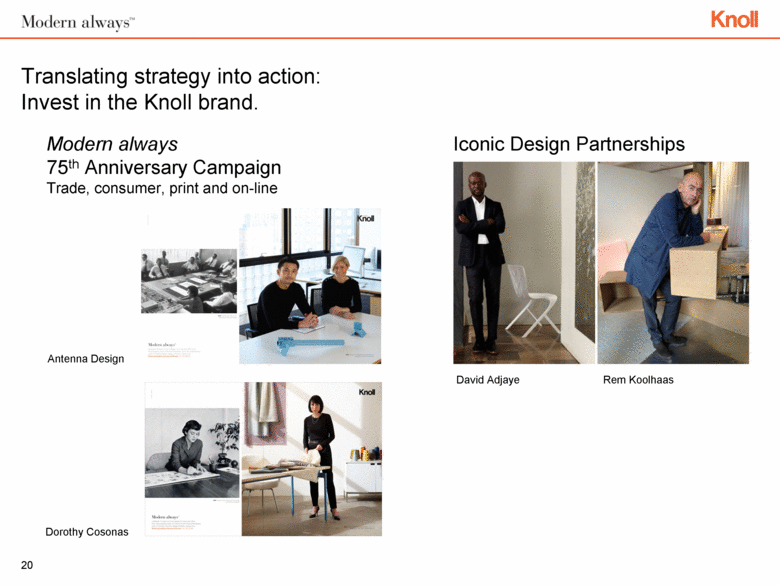
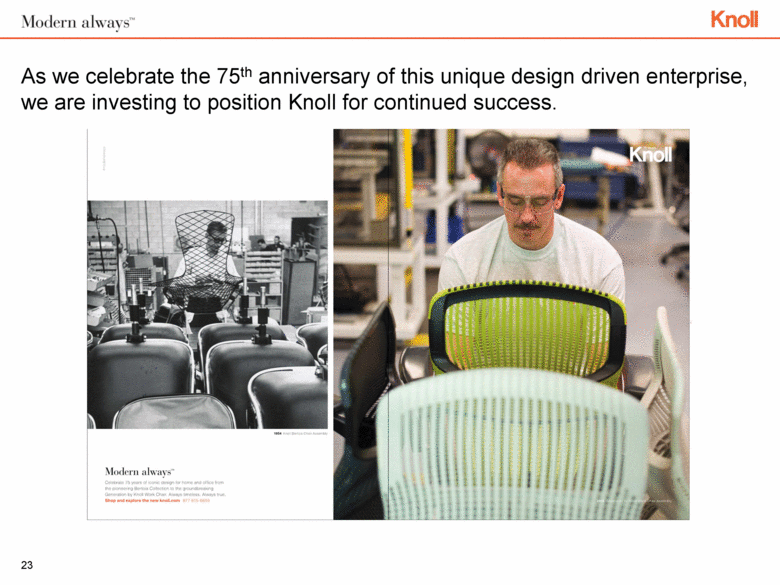
“We are pleased with the top and bottom line growth we reported in the fourth quarter as sales increased in all our segments,” commented Andrew Cogan, CEO. “We ended the year with a strong balance sheet that gives us the ability to step up our strategic investments in the front and back ends of our business to achieve our longer term revenue and margin objectives. While we expect the combination of these incremental investments and a flattish overall demand environment to depress earnings in the short term, we are confident that they will make our longer term aspirations more achievable. As we celebrate the 75th anniversary of our founding, our commitment to the principles of modern design and its benefits for our clients, associates and shareholders is as strong as ever.”
Fourth Quarter Results
Fourth quarter 2012 financial results highlights follow:
|
Dollars in Millions Except Per Share Data |
|
Three Months Ended |
|
Percent |
| ||||
|
|
|
12/31/12 |
|
12/31/11 |
|
Change |
| ||
|
|
|
|
|
|
|
|
| ||
|
Net Sales |
|
$ |
250.0 |
|
$ |
223.1 |
|
12.1 |
% |
|
Gross Profit |
|
82.7 |
|
70.7 |
|
17.0 |
% | ||
|
Gross Profit % |
|
33.1 |
% |
31.7 |
% |
4.4 |
% | ||
|
Operating Expenses |
|
54.5 |
|
48.3 |
|
12.8 |
% | ||
|
Operating Profit |
|
28.1 |
|
27.8 |
|
1.1 |
% | ||
|
Operating Profit % |
|
11.2 |
% |
12.5 |
% |
(10.4) |
% | ||
|
Adjusted Operating Profit |
|
28.1 |
|
22.4 |
|
25.4 |
% | ||
|
Adjusted Operating Profit % |
|
11.2 |
% |
10.0 |
% |
12.0 |
% | ||
|
Net Income |
|
17.5 |
|
17.4 |
|
0.6 |
% | ||
|
Earnings Per Share – Diluted |
|
.37 |
|
.37 |
|
— |
% | ||
|
Adjusted Earnings Per Share - Diluted |
|
.37 |
|
.30 |
|
23.3 |
% | ||
Adjusted earnings per share and adjusted operating profit are non-GAAP financial measures and are calculated by excluding from earnings per share and operating profit items we believe to be infrequent or not indicative of our operating performance. For a reconciliation of adjusted earnings per share and adjusted operating profit to earnings per share and operating profit, respectively, see “Reconciliation of Non-GAAP Financial Measures” below.
Net sales for the quarter were $250.0 million, an increase of $26.9 million, or 12.1%, when compared with the fourth quarter of 2011. Net sales for the Office segment were $181.1 million in the fourth quarter of 2012, an increase of $23.8 million, or 15.1% when compared with the fourth quarter of 2011. The increase in sales in the Office segment during the fourth quarter of 2012 was mainly attributable to double digit growth in sales of our office systems and seating products. Net sales for the Studio segment were $42.1 million, an increase of $2.0 million, or 5.0%, when compared with the fourth quarter of 2011. Net sales in the Studio segment in North America increased 16.8% while sales in Europe declined 6.1%. Net sales for the Coverings segment were $26.8 million, an increase of $1.1 million, or 4.3%, when compared with the fourth quarter of 2011.
Gross profit for the fourth quarter of 2012 was $82.7 million, an increase of $12.0 million, or 17.0%, from the same period in 2011. Gross margin increased from 31.7% in the fourth quarter of 2011 to 33.1% in the fourth quarter of 2012. The increase in gross margin from the fourth quarter of 2011 was largely the result of a more profitable mix in our business as we saw government shipments, which are generally contracted at higher discount rates, make up a smaller portion of our overall sales. Continuous improvement projects in our factories, better absorption of our fixed costs in conjunction with the higher sales volumes, and lower transportation costs also positively impacted our gross margin during the fourth quarter of 2012.
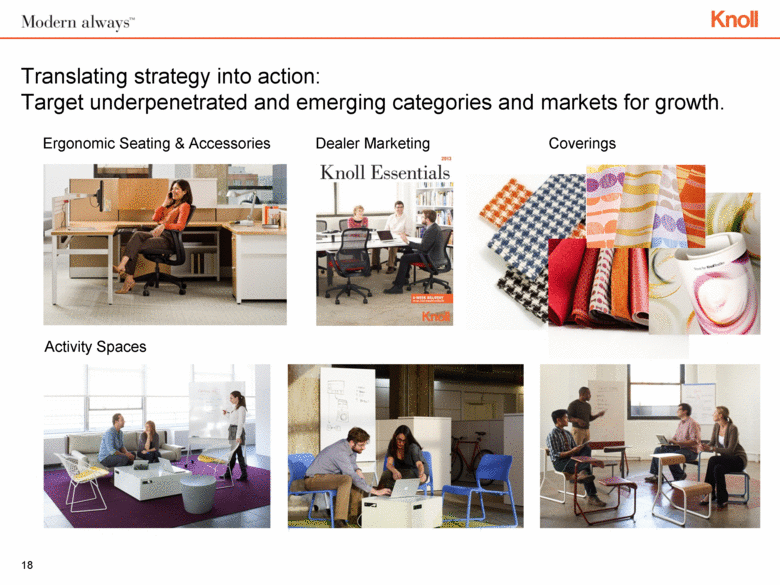
Operating expenses for the quarter were $54.5 million, or 21.8% of net sales, compared to $48.3 million, or 21.6% of net sales, for fourth quarter of 2011. Excluding the curtailment benefit noted above operating expenses were $53.7 million during the fourth quarter of 2011. The increase in operating expenses during the fourth quarter of 2012 was in large part due to continued spending on new products and growth initiatives in our Studio and Coverings segments.
Operating profit as a percent of net sales was 11.2% during the fourth quarter of 2012 compared to 12.5% during the fourth quarter of 2011. Operating profit for the fourth quarter of 2011 includes a curtailment benefit of $5.4 million. Excluding the curtailment benefit, operating profit would have been $22.4 million, or 10.0% of net sales, during the fourth quarter of 2011. For a reconciliation of adjusted operating profit to GAAP operating profit, see “Reconciliation of Non-GAAP Financial Measures” below. Operating profit for the Office segment was $20.0 million in the fourth quarter of 2012, an increase of $9.3 million, or 86.9%, when compared with the fourth quarter of 2011. Operating profit for the Studio segment was $6.2 million, an increase of $0.2 million, or 3.3%, when compared with the fourth quarter of 2011. Operating profit for the Coverings segment was $1.9 million, a decrease of $3.8 million, or 66.7% when compared to the fourth quarter of 2011. During the fourth quarter of 2012, one of our leather subsidiaries incurred a $2.9 million one-time charge for inventory costs that were not being properly transferred to cost of goods sold due to a computer programming change.
During the fourth quarter of 2012, other (income) expense consisted of income of $0.6 million related to foreign exchange gains offset by $0.1 million of miscellaneous expense. During the fourth quarter of 2011, other (income) expense consisted primarily of income of $0.6 million related to foreign exchange gains offset by expense of $0.6 million related to a negative judicial ruling.
The effective tax rate was 35.4% for the fourth quarter of 2012, as compared to 34.7% for the same period last year. The increase in the effective tax rate is largely due to the mix of pretax income between the countries in which we operate.
Net income for the fourth quarter of 2012 was $17.5 million compared to $17.4 million during the fourth quarter of 2011.
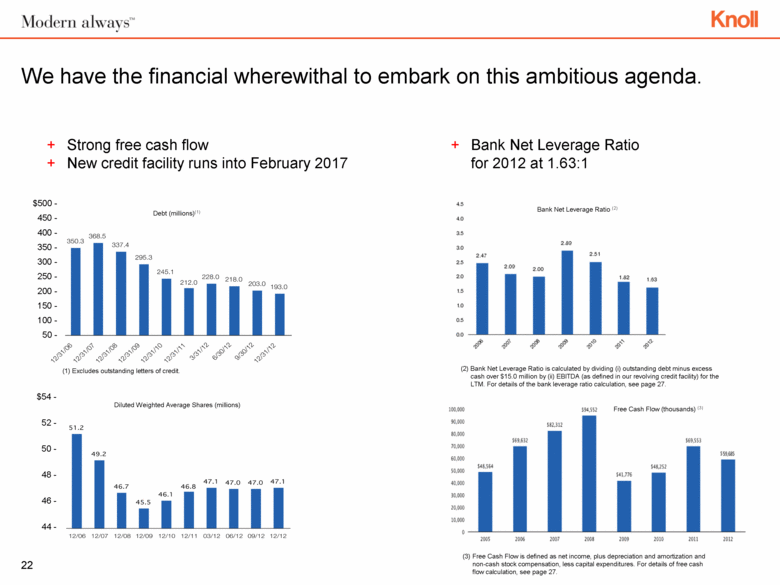
Cash generated from operations during the fourth quarter 2012 was $41.5 million, compared to $35.8 million in the same period of 2011. Capital expenditures for the fourth quarter 2012 totaled $6.5 million compared to $5.7 million for 2011. We repaid $10.0 million of debt during the fourth quarter of 2012 compared to $5.0 million during the fourth quarter of 2011. At the end 2012 the Company’s net leverage ratio was 1.63:1. For more detailed information on the calculation of net leverage ratio, see Reconciliation of Non-GAAP financial measures below. The Company also paid dividends of $5.6 million, or $0.12 per share during the fourth quarter of 2012 compared to $4.6 million, $0.10 per share during the fourth quarter of 2011.
Full Year Results
2012 financial results highlights follow:
|
Dollars in Millions Except Per Share Data |
|
Twelve Months Ended |
|
Percent |
| ||||
|
|
|
12/31/12 |
|
12/31/11 |
|
Change |
| ||
|
|
|
|
|
|
|
|
| ||
|
Net Sales |
|
$ |
887.5 |
|
$ |
922.2 |
|
(3.8) |
% |
|
Gross Profit |
|
294.4 |
|
294.4 |
|
— |
% | ||
|
Gross Profit % |
|
33.2 |
% |
31.9 |
% |
4.1 |
% | ||
|
Operating Expenses |
|
206.4 |
|
202.1 |
|
2.1 |
% | ||
|
Operating Profit |
|
87.9 |
|
97.1 |
|
(9.5) |
% | ||
|
Operating Profit % |
|
9.9 |
% |
10.5 |
% |
(5.7) |
% | ||
|
Adjusted Operating Profit |
|
87.9 |
|
92.3 |
|
(4.8) |
% | ||
|
Adjusted Operating Profit % |
|
9.9 |
% |
10.0 |
% |
(1.0) |
% | ||
|
Net Income |
|
50.0 |
|
58.0 |
|
(13.8) |
% | ||
|
Earnings Per Share – Diluted |
|
1.06 |
|
1.24 |
|
(14.5) |
% | ||
|
Adjusted Earnings Per Share Diluted |
|
1.06 |
|
1.18 |
|
(10.2) |
% | ||
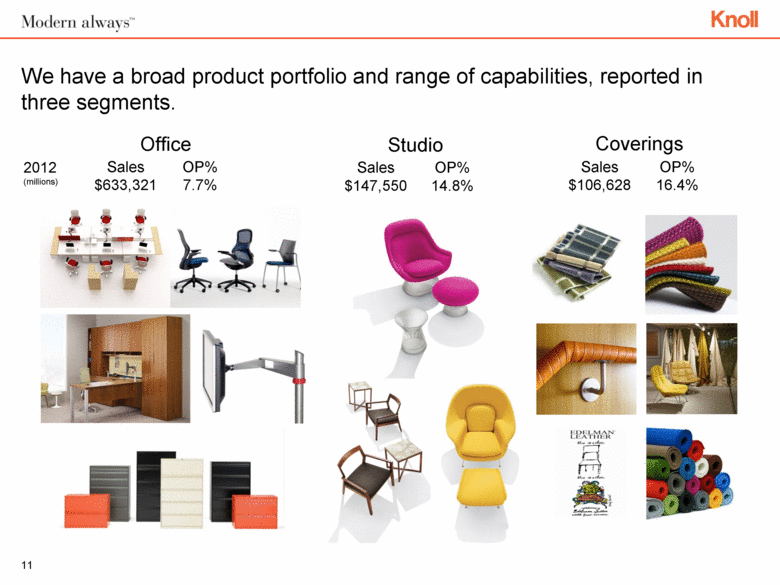
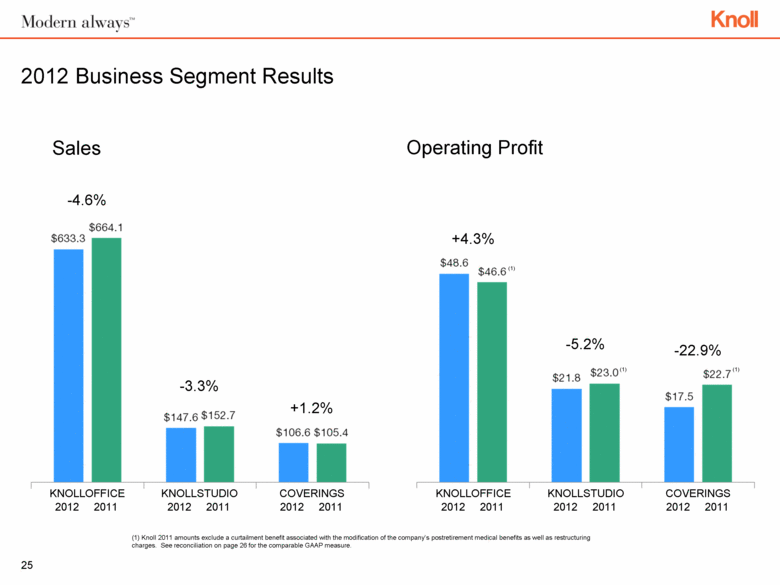
For the year, net sales totaled $887.5 million, a decrease of $34.7 million, or 3.8%, from 2011 net sales of $922.2 million. Net sales for the Office segment were $633.3 million, a decrease of $30.8 million, or 4.6%, when compared with 2011. This decrease in the Office Segment for the year was the result of lower sales to government and financial services clients. Sales to commercial clients grew during 2012, however, this growth was not enough to offset the decline in government and financial services clients. Net sales for the Studio segment were $147.6 million, a decrease of $5.1 million, or 3.3%, when compared with 2011. Lower sales resulting primarily from the poor economic conditions in Europe more than offset the growth of Studio sales in North America for the year. Net sales for the Coverings segment were $106.6 million, an increase of $1.2 million, or 1.1%, when compared with 2011.
During the full year, gross margin increased from 31.9% in 2011 to 33.2% in 2012. The largest contributors to this increase for 2012 were a more profitable business mix, pricing, and continuous improvement projects in our factories. Gross profit dollars were $294.4 million in 2011 and 2012.
Operating expenses for 2012 were $206.4 million, or 23.3% of net sales, compared to $202.1 million, or 21.9% of net sales, for 2011. The increase in operating expenses during 2012 was in large part due to increased spending on growth initiative programs in our Studio and Coverings segments as well as technology infrastructure upgrades.
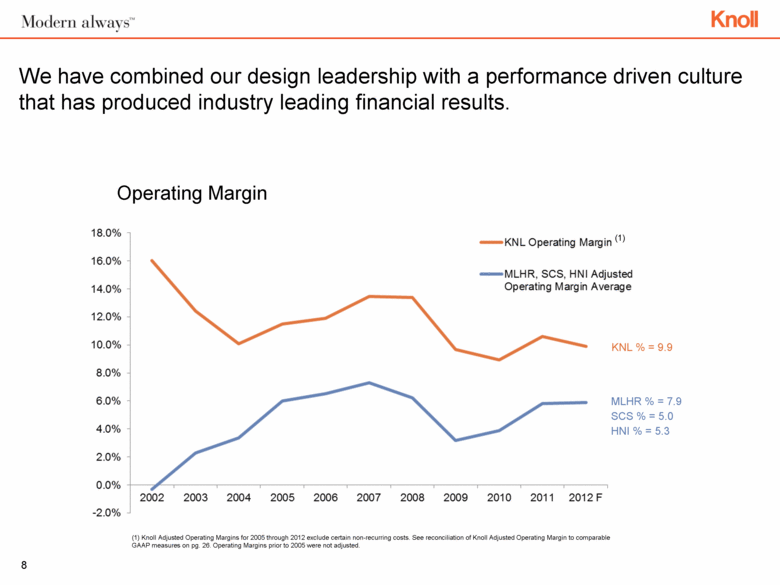
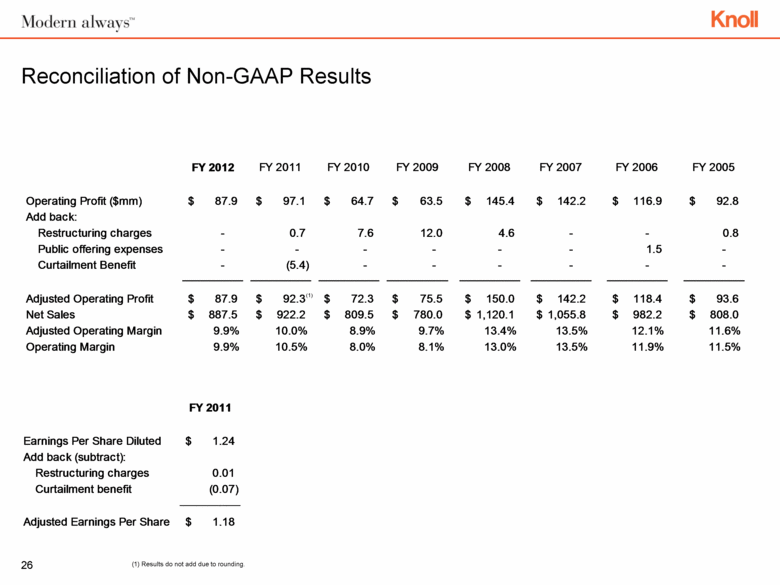
Our operating profit for 2012 was $87.9 million, a decrease of $9.2 million, or 9.5%, when compared with the same period in 2011. Operating profit as a percent of net sales was 9.9% for 2012 compared to 10.5% in 2011. Operating profit for 2011 includes a curtailment benefit of $5.4 million and restructuring charges of $0.7 million. Excluding these amounts, operating profit would have been $92.3 million, or 10.0% of net sales, during 2011. For a reconciliation of adjusted operating profit to GAAP operating profit, see “Reconciliation of Non-GAAP Financial Measures” below. Operating profit for the Office segment was $48.6 million in 2012, an increase of $2.0 million, or 4.3%, when compared with 2011. Operating profit for the Studio segment was $21.8 million, a decrease of $1.2 million, or 5.2%, when compared with 2011. Operating profit for the Coverings segment was $17.5 million, a decrease of $5.2 million, or 22.9%, when compared to 2011.
Interest expense for 2012 decreased $3.4 million when compared with the full year 2011. The decrease in interest expense is due to our lower outstanding debt and the expiration of two interest rate swap agreements that expired on June 9, 2011. Other (income) expense in 2012 consisted of expense related to $2.8 million of foreign exchange losses, expense of $0.5 million related to the write-off of deferred financing fees in conjunction with our new debt agreement completed in February of 2012, offset by $0.1 million of miscellaneous income. Other (income) expense in 2011 consisted of income of $2.7 million of foreign exchange gains, $1.6 million of miscellaneous expense related to a negative judicial ruling, and $0.4 million of miscellaneous income.
The effective tax rate was 36.2% for the year, as compared to 34.7% for the same period last year. Our effective tax rate is dependent upon the mix of pretax income in the countries in which we operate.
We generated 2012 net income of $50.0 million, or $1.06 diluted earnings per share, compared to $58.0 million, or $1.24 diluted earnings per share, in 2011.
Annual cash generated from operations in 2012 was $70.6 million, compared to $66.9 million the year before. Capital expenditures in 2012 totaled $16.6 million compared to $15.2 million for 2011. During 2012 we repaid $19.0 million of debt compared to $33.1 million in 2011. We also paid dividends of $20.5 million in 2012 compared with $16.7 million in 2011.
“A strong balance sheet remains a top priority and once again our balance sheet is stronger than the year before as we target working capital improvements and reduce our debt. With our strong balance sheet, we are well positioned to support and fund our longer term strategic investments and initiatives. Today we posted on our website a new investor presentation to further explain our three-year strategic investment plan,” commented Barry L. McCabe, EVP & CFO.
Business Segment Results
The following information categorizes the Company’s results into its defined reporting segments.
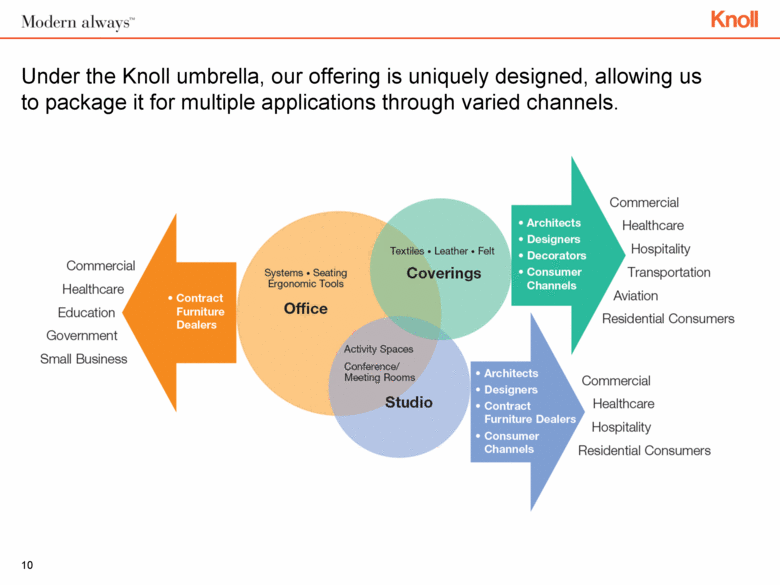
The Office segment serves corporate, government, healthcare, retail and other customers in the United States and Canada providing a portfolio of office furnishing solutions including office systems, seating, storage, tables, desks and KnollExtra ® ergonomic accessories. The Office segment also includes international sales of our North American office products. The Studio segment includes KnollStudio®, Knoll Europe which sells primarily KnollStudio products, and Richard Schultz® Design. The KnollStudio® portfolio includes a range of lounge seating; side, café and dining chairs; barstools; and conference, dining and occasional tables. The Coverings segment includes, KnollTextiles®, Spinneybeck®, Edelman® Leather, and FilzfeltTM. These businesses serve a wide range of customers offering high quality textiles and leather.
|
|
|
Three Months Ended |
| ||||||
|
|
|
|
| ||||||
|
Net Sales (in millions) |
|
2012 |
|
2011 |
| ||||
|
|
|
|
|
|
| ||||
|
Office |
|
|
$ |
181.1 |
|
|
$ |
157.3 |
|
|
Studio |
|
42.1 |
|
40.1 |
| ||||
|
Coverings |
|
|
26.8 |
|
|
25.7 |
| ||
|
|
|
|
|
|
| ||||
|
Total Sales |
|
$ |
250.0 |
|
|
$ |
223.1 |
| |
|
|
|
|
|
|
| ||||
|
|
|
|
| ||||||
|
|
|
Twelve Months Ended |
| ||||||
|
|
|
|
| ||||||
|
|
|
2012 |
|
2011 |
| ||||
|
|
|
|
|
|
| ||||
|
Office |
|
|
$ |
633.3 |
|
|
$ |
664.1 |
|
|
Studio |
|
147.6 |
|
152.7 |
| ||||
|
Coverings |
|
|
106.6 |
|
|
105.4 |
| ||
|
|
|
|
|
|
| ||||
|
Total Sales |
|
$ |
887.5 |
|
|
$ |
922.2 |
| |
|
|
|
Three Months Ended |
| ||||
|
|
|
|
| ||||
|
Operating Profit (in millions) |
|
2012 |
|
2011 |
| ||
|
|
|
|
|
|
| ||
|
Office |
|
$ |
20.0 |
|
$ |
10.7 |
|
|
Studio |
|
6.2 |
|
6.0 |
| ||
|
Coverings |
|
|
1.9 |
|
|
5.7 |
|
|
Total Segment Operating Profit |
|
|
28.1 |
|
|
22.4 |
|
|
Curtailment Benefit |
|
|
— |
|
|
5.4 |
|
|
Total Operating Profit |
|
$ |
28.1 |
|
$ |
27.8 |
|
|
|
|
|
|
|
| ||
|
|
|
|
|
|
| ||
|
|
|
Twelve Months Ended |
| ||||
|
|
|
|
| ||||
|
|
|
2012 |
|
2011 |
| ||
|
|
|
|
|
|
| ||
|
Office |
|
$ |
48.6 |
|
$ |
46.6 |
|
|
Studio |
|
21.8 |
|
23.0 |
| ||
|
Coverings |
|
|
17.5 |
|
|
22.7 |
|
|
Total Segment Operating Profit |
|
87.9 |
|
92.3 |
| ||
|
Curtailment Benefit |
|
— |
|
5.4 |
| ||
|
Restructuring Charges –primarily Office |
|
|
— |
|
|
(0.7 |
) |
|
Total Operating Profit |
|
$ |
87.9 |
|
$ |
97.1 |
(1) |
(1) Results do not add due to rounding.
Reconciliation of Non-GAAP Financial Measures
This release contains adjusted earnings per share and adjusted operating profit measures, which are both non-GAAP financial measures. Adjusted earnings per share and adjusted operating profit are calculated by excluding from earnings per share and operating profit items that we believe to be infrequent or not indicative of our operating performance. For the periods covered by this release such items consist a curtailment benefit associated with the modification of the Company’s post-retirement medical benefits and restructuring charges. We present adjusted earnings per share and adjusted operating profit because we consider them to be important supplemental measures of our performance and believe them to be useful to show ongoing results from operations distinct from items that are infrequent or not indicative of our operating performance.
Adjusted earnings per share and adjusted operating profit are not measurements of our financial performance under GAAP and should not be considered as an alternative to earnings per share or operating profit under GAAP. Adjusted earnings per share and adjusted operating profit have limitations as analytical tools, and you should not consider them in isolation or as a substitute for analysis of our results as reported under GAAP. In addition, in evaluating adjusted earnings per share and adjusted operating profit, you should be aware that in the future we may incur expenses similar to the adjustments in this presentation. Our presentation of adjusted earnings per share and adjusted operating profit should not be construed as an inference that our future results will be unaffected by unusual or infrequent items. We compensate for these limitations by providing equal prominence of our GAAP results and using adjusted earnings per share and adjusted operating profit only supplementally.
The following tables reconcile adjusted earnings per share to GAAP earnings per share for the periods indicated.
|
|
|
Three Months Ended |
| ||||||
|
|
|
|
|
|
| ||||
|
|
|
2012 |
|
2011 |
| ||||
|
|
|
|
|
|
|
|
| ||
|
Earnings per Share - Diluted |
|
$ |
0.37 |
|
|
$ |
0.37 |
|
|
|
Add back (deduct): |
|
|
|
|
|
|
| ||
|
Curtailment Benefit |
|
|
— |
|
|
|
(0.07 |
) |
|
|
|
|
|
|
|
|
|
| ||
|
|
|
|
|
|
|
|
| ||
|
Adjusted Earnings per Share - Diluted |
|
$ |
0.37 |
|
|
$ |
0.30 |
|
|
|
|
|
Twelve Months Ended |
| ||||||
|
|
|
|
|
|
| ||||
|
|
|
2012 |
|
2011 |
| ||||
|
|
|
|
|
|
|
|
| ||
|
Earnings per Share - Diluted |
|
$ |
1.06 |
|
|
$ |
1.24 |
|
|
|
Add back (deduct): |
|
|
|
|
|
|
| ||
|
Curtailment Benefit |
|
— |
|
|
(0.07 |
) |
| ||
|
Restructuring charges – primarily Office |
|
|
— |
|
|
|
0.01 |
|
|
|
|
|
|
|
|
|
|
| ||
|
|
|
|
|
|
|
|
| ||
|
Adjusted Earnings per Share - Diluted |
|
$ |
1.06 |
|
|
$ |
1.18 |
|
|
The following tables reconcile adjusted operating profit to GAAP operating profit for the periods indicated.
|
|
|
Three Months Ended |
|
| |||||
|
|
|
|
|
|
|
|
| ||
|
|
|
2012 |
|
|
2011 |
|
| ||
|
|
|
|
|
|
|
|
| ||
|
Operating Profit ($mm) |
|
$ |
28.1 |
|
|
$ |
27.8 |
|
|
|
Add back: |
|
|
|
|
|
|
| ||
|
Curtailment Benefit |
|
|
— |
|
|
|
(5.4) |
|
|
|
|
|
|
|
|
|
|
| ||
|
Adjusted Operating Profit |
|
$ |
28.1 |
|
|
$ |
22.4 |
|
|
|
Net Sales |
|
$ |
250.0 |
|
|
$ |
223.1 |
|
|
|
Operating Margin |
|
11.2% |
|
|
12.5% |
|
| ||
|
Adjusted Operating Margin |
|
11.2% |
|
|
10.0% |
|
| ||
|
|
|
Twelve Months Ended |
|
| |||||
|
|
|
|
|
|
|
|
| ||
|
|
|
2012 |
|
|
2011 |
|
| ||
|
|
|
|
|
|
|
|
| ||
|
Operating Profit ($mm) |
|
$ |
87.9 |
|
|
$ |
97.1 |
|
|
|
Add back: |
|
|
|
|
|
|
| ||
|
|
|
|
|
|
|
|
| ||
|
Curtailment Benefit |
|
— |
|
|
(5.4) |
|
| ||
|
Restructuring Charges –primarily Office |
|
|
— |
|
|
|
0.7 |
|
|
|
|
|
|
|
|
|
|
| ||
|
Adjusted Operating Profit |
|
$ |
87.9 |
|
|
$ |
92.3 |
|
(1) |
|
Net Sales |
|
$ |
887.5 |
|
|
$ |
922.2 |
|
|
|
Operating Margin |
|
9.9% |
|
|
10.5% |
|
| ||
|
Adjusted Operating Margin |
|
9.9% |
|
|
10.0% |
|
| ||
(1) Results do not add due to rounding.
Bank Net Leverage Ratio
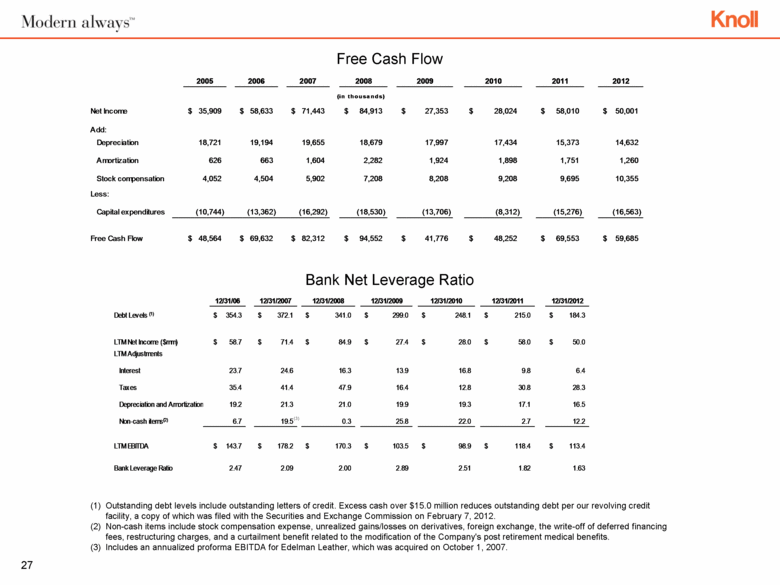
Bank Net leverage ratio is calculated in accordance with our revolving credit facility by dividing (i) outstanding debt minus cash in excess of $15.0 million by (ii) EBITDA (as defined in our revolving credit facility) for the last twelve months. For details of the leverage ratio calculation, please see below.
|
Dollars in millions |
|
12/31/2012 |
|
| |
|
|
|
|
|
| |
|
|
|
|
|
| |
|
|
|
|
|
| |
|
Debt Levels (1) |
|
$ |
184.3 |
|
|
|
|
|
|
|
| |
|
|
|
|
|
| |
|
LTM Net Income |
|
$ |
50.0 |
|
|
|
|
|
|
|
| |
|
|
|
|
|
| |
|
LTM Adjustments |
|
|
|
| |
|
|
|
|
|
| |
|
|
|
|
|
| |
|
|
|
|
|
| |
|
Interest |
|
6.4 |
|
| |
|
|
|
|
|
| |
|
Taxes |
|
28.3 |
|
| |
|
|
|
|
|
| |
|
Depreciation and Amortization |
|
16.5 |
|
| |
|
|
|
|
|
| |
|
Non-cash items (2) |
|
12.2 |
|
| |
|
|
|
|
|
| |
|
LTM Adjusted EBITDA |
|
$ |
113.4 |
|
|
|
|
|
|
|
| |
|
|
|
|
|
| |
|
Bank Leverage Calculation (3) |
|
1.63 |
x |
| |
(1) - Debt levels include outstanding letters of credit minus cash in excess of $15.0 million.
(2) - Non-cash items include stock-based compensation expenses and unrealized gains and losses on foreign exchange.
(3) - Debt divided by LTM Adjusted EBITDA.
Note: Bank Net Leverage Ratio is calculated in accordance with Knoll’s senior credit facility. For more details on this calculation, please see Knoll’s Senior Credit Agreement dated February 3, 2012, a copy of which was filed with the Securities and Exchange Commission on February 7, 2012.
Conference Call Information
Knoll will host a conference call on Tuesday, February 5, 2013 at 10:00 A.M. EST to discuss its financial results.
The call will include slides; participants are encouraged to listen to and view the presentation via webcast at http://www.knoll.com; go to “About Knoll” and click on “Investor Relations”.
The conference call may also be accessed by dialing:
|
North America |
866 831-6270 |
|
International |
617 213-8858 |
|
Passcode |
62199829 |
A replay of the webcast can be viewed by visiting the Investor Relations section of the Knoll corporate website.
In addition, an audio replay of the conference call will be available through February 12, 2013 by dialing 888 286-8010. International replay: 617 801-6888 (Passcode: 59674646).
About Knoll
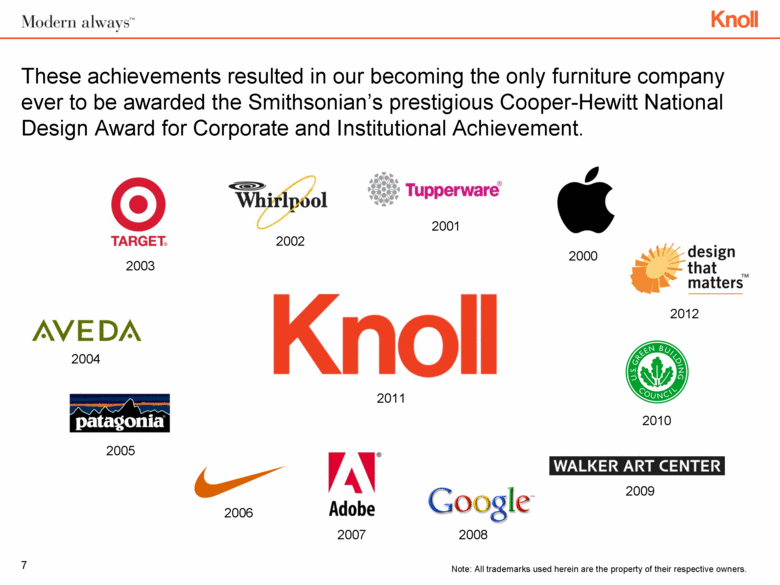
Knoll is the recipient of the 2011 National Design Award for Corporate and Institutional Achievement from the Smithsonian’s Copper-Hewitt, National Design Museum. Since 1938, Knoll has been recognized internationally for creating workplace and residential furnishings that inspire, evolve and endure. Today, our commitment to modern design, our understanding of the workplace and our dedication to sustainable design has yielded a unique portfolio of products that respond and adapt to changing needs. Knoll is aligned with the U.S. Green Building Council and the Canadian Green Building Council and can help companies achieve Leadership in Energy and Environmental Design LEED workplace certification. Knoll is the founding sponsor of the World Monuments Fund Modernism at Risk program.
Cautionary Statement Regarding Forward-Looking Information
This press release includes forward-looking statements within the meaning of Section 27A of the Securities Act of 1933, as amended, and Section 21E of the Securities Exchange Act of 1934, as amended. All statements regarding Knoll, Inc.’s expected future financial position, results of operations, revenue and profit levels, cash flows, business strategy, budgets, projected costs, capital expenditures, products, competitive positions, growth opportunities, plans and objectives of management for future operations, as well as statements that include words such as “anticipate,” “if,” “believe,” “plan,” “goals, “ “estimate,” “expect,” “intend,” “may,” “could,” “should,” “will,” and other similar expressions are forward-looking statements. This includes, without limitation, our statements and expectations regarding any current or future recovery in our industry and our publicly announced plans for increased capital and investment spending to achieve our long-term revenue and profitability growth goals. Such forward-looking statements are inherently uncertain, and readers must recognize that actual results may differ materially from the expectations of Knoll management. Knoll does not undertake a duty to update such forward-looking statements. Factors that may cause actual results to differ materially from those in the forward-looking statements include corporate spending and service-sector employment, price competition, acceptance of Knoll’s new products, the pricing and availability of raw materials and components, foreign currency exchange, transportation costs, demand for high quality, well designed office furniture solutions, changes in the competitive marketplace, changes in the trends in the market for office furniture or coverings, the financial strength and stability of our suppliers, customers and dealers, access to capital, and other risks identified in Knoll’s annual report on Form 10-K, and other filings with the Securities and Exchange Commission. Many of these factors are outside of Knoll’s control.
Contacts
|
Investors: |
Barry L. McCabe |
|
|
Executive Vice President and Chief Financial Officer |
|
|
Tel 215 679-1301 |
|
|
bmccabe@knoll.com |
|
|
|
|
Media: |
David E. Bright |
|
|
Senior Vice President, Communications |
|
|
Tel 212 343-4135 |
|
|
dbright@knoll.com |
KNOLL, INC.
CONDENSED CONSOLIDATED STATEMENTS OF OPERATIONS
(Dollars in thousands, except per share data)
|
|
|
Three Months Ended |
|
Twelve Months Ended | ||||||||||
|
|
|
|
|
|
|
|
|
|
|
| ||||
|
|
|
2012 |
|
2011 |
|
|
2012 |
|
2011 |
| ||||
|
|
|
|
|
|
|
|
|
|
|
| ||||
|
|
|
|
|
|
|
|
|
|
|
| ||||
|
Sales |
|
$ |
250,026 |
|
$ |
223,148 |
|
|
$ |
887,499 |
|
$ |
922,200 |
|
|
Cost of sales |
|
167,351 |
|
152,498 |
|
|
593,149 |
|
627,803 |
| ||||
|
|
|
|
|
|
|
|
|
|
|
| ||||
|
|
|
|
|
|
|
|
|
|
|
| ||||
|
Gross profit |
|
82,675 |
|
70,650 |
|
|
294,350 |
|
294,397 |
| ||||
|
Selling, general, and administrative expenses |
|
54,549 |
|
48,281 |
|
|
206,449 |
|
202,075 |
| ||||
|
Restructuring and other charges |
|
— |
|
— |
|
|
— |
|
696 |
| ||||
|
Curtailment benefit |
|
— |
|
(5,445 |
) |
|
— |
|
(5,445 |
) | ||||
|
|
|
|
|
|
|
|
|
|
|
| ||||
|
|
|
|
|
|
|
|
|
|
|
| ||||
|
Operating profit |
|
28,126 |
|
27,814 |
|
|
87,901 |
|
97,071 |
| ||||
|
Interest expense |
|
1,572 |
|
1,138 |
|
|
6,350 |
|
9,753 |
| ||||
|
Other (income) expense, net |
|
(509 |
) |
(35 |
) |
|
3,215 |
|
(1,508 |
) | ||||
|
|
|
|
|
|
|
|
|
|
|
| ||||
|
|
|
|
|
|
|
|
|
|
|
| ||||
|
Income before income tax expense |
|
27,063 |
|
26,711 |
|
|
78,336 |
|
88,826 |
| ||||
|
Income tax expense |
|
9,570 |
|
9,268 |
|
|
28,335 |
|
30,815 |
| ||||
|
|
|
|
|
|
|
|
|
|
|
| ||||
|
|
|
|
|
|
|
|
|
|
|
| ||||
|
Net income |
|
$ |
17,493 |
|
$ |
17,443 |
|
|
$ |
50,001 |
|
$ |
58,011 |
|
|
|
|
|
|
|
|
|
|
|
|
| ||||
|
|
|
|
|
|
|
|
|
|
|
| ||||
|
Earnings per share: |
|
|
|
|
|
|
|
|
|
| ||||
|
Basic |
|
$ |
0.37 |
|
$ |
0.38 |
|
|
$ |
1.07 |
|
$ |
1.25 |
|
|
Diluted |
|
$ |
0.37 |
|
$ |
0.37 |
|
|
$ |
1.06 |
|
$ |
1.24 |
|
|
Weighted-average shares outstanding: |
|
|
|
|
|
|
|
|
|
| ||||
|
Basic |
|
46,753,272 |
|
46,339,443 |
|
|
46,634,834 |
|
46,249,571 |
| ||||
|
Diluted |
|
47,082,864 |
|
46,767,149 |
|
|
47,059,186 |
|
46,835,712 |
| ||||
KNOLL, INC.
CONDENSED CONSOLIDATED BALANCE SHEETS
(Dollars in thousands, except per share data)
|
|
|
December 31, |
|
December 31, |
| ||
|
|
|
|
|
|
| ||
|
ASSETS |
|
|
|
|
| ||
|
Current assets: |
|
|
|
|
| ||
|
Cash and cash equivalents |
|
$ |
29,956 |
|
$ |
28,263 |
|
|
Customer receivables, net |
|
105,877 |
|
126,078 |
| ||
|
Inventories |
|
98,195 |
|
89,244 |
| ||
|
Prepaid and other current assets |
|
24,494 |
|
21,308 |
| ||
|
|
|
|
|
|
| ||
|
|
|
|
|
|
| ||
|
Total current assets |
|
258,522 |
|
264,893 |
| ||
|
Property, plant, and equipment, net |
|
124,838 |
|
121,792 |
| ||
|
Intangible assets, net |
|
302,830 |
|
297,250 |
| ||
|
Other noncurrent assets |
|
8,863 |
|
4,156 |
| ||
|
|
|
|
|
|
| ||
|
|
|
|
|
|
| ||
|
Total Assets |
|
$ |
695,053 |
|
$ |
688,091 |
|
|
|
|
|
|
|
| ||
|
|
|
|
|
|
| ||
|
LIABILITIES AND STOCKHOLDERS’ EQUITY |
|
|
|
|
| ||
|
Current liabilities: |
|
|
|
|
| ||
|
Accounts payable |
|
83,600 |
|
83,824 |
| ||
|
Other current liabilities |
|
92,345 |
|
99,304 |
| ||
|
|
|
|
|
|
| ||
|
|
|
|
|
|
| ||
|
Total current liabilities |
|
175,945 |
|
183,128 |
| ||
|
Long-term debt |
|
193,000 |
|
212,000 |
| ||
|
Other noncurrent liabilities |
|
136,691 |
|
127,540 |
| ||
|
|
|
|
|
|
| ||
|
|
|
|
|
|
| ||
|
Total liabilities |
|
505,636 |
|
522,668 |
| ||
|
|
|
|
|
|
| ||
|
|
|
|
|
|
| ||
|
Stockholders’ equity |
|
189,417 |
|
165,423 |
| ||
|
|
|
|
|
|
| ||
|
|
|
|
|
|
| ||
|
Total Liabilities and Stockholders’ Equity |
|
$ |
695,053 |
|
$ |
688,091 |
|
|
|
|
|
|
|
| ||
KNOLL, INC.
CONDENSED CONSOLIDATED STATEMENTS OF CASH FLOWS
(Dollars in thousands)
|
|
|
Year Ended December 31, | |||||
|
|
|
2012 |
|
2011 |
| ||
|
|
|
|
|
|
| ||
|
|
|
|
|
|
| ||
|
Net income |
|
$ |
50,001 |
|
$ |
58,011 |
|
|
|
|
|
|
|
| ||
|
|
|
|
|
|
| ||
|
Cash Flows provided by Operating Activities |
|
70,568 |
|
66,921 |
| ||
|
|
|
|
|
|
| ||
|
Cash Flows used in Investing Activities |
|
(23,001 |
) |
(16,332 |
) | ||
|
|
|
|
|
|
| ||
|
Cash Flows used in Financing Activities |
|
(45,791 |
) |
(49,913 |
) | ||
|
|
|
|
|
|
| ||
|
Effect of exchange rate changes on cash and cash equivalents |
|
(83 |
) |
652 |
| ||
|
|
|
|
|
|
| ||
|
|
|
|
|
|
| ||
|
Increase in cash and cash equivalents |
|
1,693 |
|
1,328 |
| ||
|
|
|
|
|
|
| ||
|
Cash and cash equivalents at beginning of period |
|
28,263 |
|
26,935 |
| ||
|
|
|
|
|
|
| ||
|
|
|
|
|
|
| ||
|
Cash and cash equivalents at end of period |
|
$ |
29,956 |
|
$ |
28,263 |
|
|
|
|
|
|
|
| ||
