UNITED STATES
SECURITIES AND EXCHANGE COMMISSION
Washington, D.C. 20549
FORM 10-K
(Mark one)
|
[x]
|
ANNUAL REPORT PURSUANT TO SECTION 13 OR 15(d) OF THE SECURITIES EXCHANGE ACT OF 1934
|
For the fiscal year ended June 30, 2019 OR
|
[ ]
|
TRANSITION REPORT PURSUANT TO SECTION 13 OR 15(d) OF THE SECURITIES EXCHANGE ACT OF 1934
|
Commission File Number: 000-28304
PROVIDENT FINANCIAL HOLDINGS, INC.
(Exact name of registrant as specified in its charter)
|
Delaware
|
33-0704889
|
|
|
(State or other jurisdiction of incorporation
|
(I.R.S. Employer
|
|
|
or organization)
|
Identification Number)
|
|
|
3756 Central Avenue, Riverside, California
|
92506
|
|
|
(Address of principal executive offices)
|
(Zip Code)
|
Registrant’s telephone number, including area code: (951) 686-6060
Securities registered pursuant to Section 12(b) of the Act:
|
Title of each class
Common Stock, par value $.01 per share
|
Trading Symbol(s)
PROV
|
Name of each exchange on which registered
The NASDAQ Stock Market LLC
|
Securities registered pursuant to Section 12(g) of the Act: None
Indicate by check mark if the Registrant is a well-known seasoned issuer, as defined in Rule 405 of the Securities Act. [ ] Yes [X] No
Indicate by check mark if the Registrant is not required to file reports pursuant to Section 13 or Section 15(d) of the Act. [ ] Yes [X] No
Indicate by check mark whether the Registrant (1) has filed all reports required to be filed by Section 13 or 15(d) of the Securities Exchange Act of 1934 during the preceding 12 months
(or for such shorter period that the Registrant was required to file such reports), and (2) has been subject to such filing requirements for the past 90 days. [X] Yes [ ] No
Indicate by check mark whether the registrant has submitted electronically and posted on its corporate Web site, if any, every Interactive Data File required to be submitted and posted
pursuant to Rule 405 of Regulation S-T (§232.405 of this chapter) during the preceding 12 months (or for such shorter period that the registrant was required to submit and post such files). [X] Yes [ ] No
Indicate by check mark whether the Registrant is a large accelerated filer, an accelerated filer, a non-accelerated filer, smaller reporting company, or emerging growth
company. See the definitions of “large accelerated filer,” “accelerated filer,” “smaller reporting company,” and "emerging growth company" in Rule 12b-2 of the Exchange Act.
|
Large accelerated filer [ ]
|
|
Accelerated filer [X]
|
|
Non-accelerated filer [ ]
|
|
Smaller reporting company [X]
|
|
|
|
Emerging growth company [ ]
|
If an emerging growth company, indicate by check mark if the registrant has elected not to use the extended transition period for complying with any new or revised financial accounting standards
provided pursuant to Section 13(a) of the Exchange Act. [ ]
Indicate by check mark whether the Registrant is a shell company (as defined in Exchange Act Rule 12b-2). [ ] Yes [X] No
The aggregate market value of the common stock held by non affiliates of the Registrant, based on the closing sales price of the Registrant’s common stock as quoted on the NASDAQ
Global Select Market on December 31, 2018, was $105.7 million. As of August 23, 2019, there were 7,480,563 shares of the Registrant’s common stock issued and outstanding.
DOCUMENTS INCORPORATED BY REFERENCE
|
1.
|
Portions of the Annual Report to Shareholders are incorporated by reference into Part II.
|
|
2.
|
Portions of the definitive Proxy Statement for the fiscal 2019 Annual Meeting of Shareholders (“Proxy Statement”) are incorporated by reference into Part III.
|
PROVIDENT FINANCIAL HOLDINGS, INC.
Table of Contents
|
Page
|
|
|
PART I
|
|
|
Item 1. Business:
|
1 |
|
General
|
1 |
|
Subsequent Events
|
1 |
|
Market Area
|
2 |
|
Competition
|
2 |
|
Personnel
|
3 |
|
Segment Reporting
|
3 |
|
Internet Website
|
3 |
|
Lending Activities
|
3 |
|
Loan Servicing
|
12 |
|
Delinquencies and Classified Assets
|
13 |
|
Investment Securities Activities
|
20 |
|
Deposit Activities and Other Sources of Funds
|
22 |
|
Subsidiary Activities
|
26 |
|
Regulation
|
27 |
|
Taxation
|
36 |
|
Executive Officers
|
38 |
|
Item 1A. Risk Factors
|
39 |
|
Item 1B. Unresolved Staff Comments
|
52 |
|
Item 2. Properties
|
52 |
|
Item 3. Legal Proceedings
|
52 |
|
Item 4. Mine Safety Disclosures
|
54 |
|
PART II
|
|
|
Item 5. Market for Registrant’s Common Equity, Related Stockholder Matters and Issuer Purchases of Equity Securities
|
54 |
|
Item 6. Selected Financial Data
|
56 |
|
Item 7. Management’s Discussion and Analysis of Financial Condition and Results of Operations:
|
57
|
|
General
|
58 |
|
Critical Accounting Policies
|
59 |
|
Executive Summary and Operating Strategy
|
61 |
|
Off-Balance Sheet Financing Arrangements and Contractual Obligations
|
62 |
|
Comparison of Financial Condition at June 30, 2019 and 2018
|
63 |
|
Comparison of Operating Results for the Years Ended June 30, 2019 and 2018
|
64 |
|
Average Balances, Interest and Average Yields/Costs
|
69 |
|
Rate/Volume Analysis
|
70 |
|
Liquidity and Capital Resources
|
71 |
|
Impact of Inflation and Changing Prices
|
72 |
|
Impact of New Accounting Pronouncements
|
72 |
|
Item 7A. Quantitative and Qualitative Disclosures about Market Risk
|
73 |
|
Item 8. Financial Statements and Supplementary Data
|
77 |
|
Item 9. Changes in and Disagreements With Accountants on Accounting and Financial Disclosure
|
77 |
|
Item 9A. Controls and Procedures
|
77 |
|
Item 9B. Other Information
|
80 |
|
Page
|
|
|
PART III
|
|
|
Item 10. Directors, Executive Officers and Corporate Governance
|
80 |
|
Item 11. Executive Compensation
|
81 |
|
Item 12. Security Ownership of Certain Beneficial Owners and Management and Related Stockholder Matters
|
81 |
|
Item 13. Certain Relationships and Related Transactions, and Director Independence
|
82 |
|
Item 14. Principal Accountant Fees and Services
|
82 |
|
PART IV
|
|
|
Item 15. Exhibits, Financial Statement Schedules
|
83 |
|
Signatures
|
85 |
As used in this report, the terms “we,” “our,” “us,” and “Provident” refer to Provident Financial Holdings, Inc. and its consolidated subsidiaries, unless the context indicates otherwise. When we refer to the “Bank” or
“Provident Savings Bank” in this report, we are referring to Provident Savings Bank, F.S.B., a wholly owned subsidiary of Provident Financial Holdings, Inc.
PART I
Item 1. Business
General
Provident Financial Holdings, Inc. (the “Corporation”), a Delaware corporation, was organized in January 1996 for the purpose of becoming the holding company of Provident Savings Bank, F.S.B. (the “Bank”) upon the
Bank’s conversion from a federal mutual to a federal stock savings bank (“Conversion”). The Conversion was completed on June 27, 1996. The Corporation is regulated by the Federal Reserve Board ("FRB"). At June 30, 2019, the Corporation had
consolidated total assets of $1.08 billion, total deposits of $841.3 million and stockholders’ equity of $120.6 million. The Corporation has not engaged in any significant activity other than holding the stock of the Bank. Accordingly, the
information set forth in this Annual Report on Form 10-K (“Form 10-K”), including the audited consolidated financial statements and related data, relates primarily to the Bank.
The Bank, founded in 1956, is a federally chartered stock savings bank headquartered in Riverside, California. The Bank is regulated by the Office of the Comptroller of the Currency (“OCC”), its primary federal
regulator, and the Federal Deposit Insurance Corporation (“FDIC”), the insurer of its deposits. The Bank’s deposits are federally insured up to applicable limits by the FDIC. The Bank has been a member of the Federal Home Loan Bank (“FHLB”) – San
Francisco since 1956.
The Bank is a financial services company committed to serving consumers and small to mid-sized businesses in the Inland Empire region of Southern California. The Bank conducts its business operations as Provident
Bank, and through its subsidiary, Provident Financial Corp. The business activities of the Bank consist of community banking, investment services and trustee services for real estate transactions.
The Bank’s community banking operations primarily consist of accepting deposits from customers within the communities surrounding its full service offices and investing those funds in single-family, multi-family,
commercial real estate, construction, commercial business, consumer and other mortgage loans. Additional business activities have included originating saleable single-family loans, primarily fixed-rate first mortgages. Through its subsidiary,
Provident Financial Corp, the Bank conducts trustee services for the Bank’s real estate transactions and in the past has held real estate for investment. For additional information, see “Subsidiary Activities” in this Form 10-K. The activities of
Provident Financial Corp are included in the Bank's operating segment results. The Bank’s revenues are derived principally from interest earned on its loan and investment portfolios, and fees generated through its community banking activities.
On June 22, 2006, the Bank established the Provident Savings Bank Charitable Foundation (“Foundation”) in order to further its commitment to the local community. The specific purpose of the Foundation is to promote
and provide for the betterment of youth, education, housing and the arts in the Bank’s primary market areas of Riverside and San Bernardino counties. The Foundation was funded with a $500,000 charitable contribution made by the Bank in the fourth
quarter of fiscal 2006. The
Bank contributed $40,000 to the Foundation in both fiscal 2019 and 2018.
Subsequent Event:
On July 30, 2019, the Corporation announced that the Corporation’s Board of Directors declared a cash dividend of $0.14 per share. Shareholders of the Corporation’s common stock at the close of business on August 20,
2019 are entitled to receive the cash dividend, payable on September 10, 2019.
1
Market Area
The Bank is headquartered in Riverside, California and operates 12 full-service banking offices in Riverside County and one full-service banking office in San Bernardino County. Management considers Riverside and
Western San Bernardino counties to be the Bank’s primary market for deposits. The Bank is the largest independent community bank headquartered in Riverside County and it has the ninth largest deposit market share of all banks and the second largest
of community banks in Riverside County.
The large geographic area encompassing Riverside and San Bernardino counties is referred to as the “Inland Empire.” According to the 2010 Census Bureau population statistics, Riverside and San Bernardino Counties have
the fourth and fifth largest populations in California, respectively. The Bank’s market area consists primarily of suburban and urban communities. Western Riverside and San Bernardino counties are relatively densely populated and are within the
greater Los Angeles metropolitan area. According to the United States of America (“U.S.”) Department of Labor, Bureau of Labor Statistics, the unemployment rate in the Inland Empire in June 2019 was 4.3%, compared to 4.2% in California and 3.7%
nationwide, an improvement compared to the unemployment data reported in June 2018, which was 4.7% in the Inland Empire, 4.2% in California and 4.0% nationwide.
In 2019, it has been forecast that the Inland Empire will continue the expansion underway since 2011. Through December 31, 2018, there have been 352,208 jobs created. The 2019 gain is forecast at another 38,200 jobs,
up 2.52%. If this occurs, a total of 390,408 local jobs will have been created from 2011-2019 taking the Inland Empire area to 1,556,857 positions. That would be 250,192 jobs or 19.1% above the pre-recession high of 1,306,342 in 2007. Unemployment is
forecasted to stay at 4.2% in 2019. Importantly among California’s metropolitan areas, the Inland Empire’s 2018 growth of 49,308 jobs ranked second, somewhat below job growth in Los Angeles (60,908) and well above job growth in San Francisco
(33,067), San Diego (32,500), Orange County (32,133), Silicon Valley (20,333) and the East Bay (20,550). Its 3.36% job growth rate led the state ahead of San Francisco’s job growth of 2.97% (Source: Inland Empire Quarterly Economic Reports - April
2019).
After rebounding in May 2019, California home sales fell below the benchmark 400,000 units in June 2019 as sales declined from both the previous month and year, according to the California Association of Realtors
(“C.A.R.”). Closed escrow sales of existing, single-family detached homes in California totaled a seasonally adjusted annualized rate of 389,690 units in June 2019, according to information collected by C.A.R. from more than 90 local Realtor
associations and MLSs statewide. The statewide annualized sales figure represents what would be the total number of homes sold during 2019 if sales maintained the June 2019 pace throughout the year. It is adjusted to account for seasonal factors that
typically influence home sales. June 2019’s sales figure was down 4.2 percent from the 406,960 units in May 2019 and down 5.1 percent from 410,800 home sales in June 2018. Sales have been under the benchmark for 10 of the past 11 months. While the
median price set another record in June 2019, the increase was tempered. June 2019’s median price was $611,420, essentially unchanged from $611,190 in May 2019 and up 1.4 percent from $602,770 in June 2018 (Source: California Association of Realtors
– July 17, 2019 News Release).
Competition
The Bank faces significant competition in its market area in originating real estate loans and attracting deposits. The population growth in the Inland Empire has attracted numerous financial institutions to the
Bank’s market area. The Bank’s primary competitors are large national and regional commercial banks as well as other community-oriented banks and savings institutions. The Bank also faces competition from credit unions and a large number of
mortgage companies that operate within its market area. Many of these institutions are significantly larger than the Bank and therefore have greater financial and marketing resources than the Bank. This competition may limit the Bank’s growth and
profitability in the future.
2
Personnel
As of June 30, 2019, the Bank had 187 full-time equivalent employees, which consisted of 138 full-time, 49 prime-time and no part-time employees. The employees are not represented by a collective bargaining unit and
management believes that its relationship with employees is good.
Reportable Segments
Management monitors the revenue and expense components of the various products and services the Bank offers, but operations are managed and financial performance is evaluated on a Corporation-wide basis in comparison
to a business plan which is developed each year. Accordingly, all operations are considered by management to be one operating segment and one reportable segment as contained in Note 18 to the Corporation’s audited consolidated financial statements
included in Item 8 of this Form 10-K.
Internet Website
The Corporation maintains a website at www.myprovident.com. The information contained on that website is not included as a part of, or incorporated by reference into, this Form 10-K. Other than an investor’s own
internet access charges, the Corporation makes available free of charge through that website the Corporation’s annual report, quarterly reports on Form 10-Q and current reports on Form 8-K, and amendments to these reports, as soon as reasonably
practicable after these materials have been electronically filed with, or furnished to, the Securities and Exchange Commission (“SEC”). In addition, the SEC maintains a website that contains reports, proxy and information statements, and other
information regarding companies that file electronically with the SEC. This information is available at www.sec.gov.
Lending Activities
General. The lending activity of the Bank is comprised of the origination of single-family, multi-family and commercial real estate loans and, to a lesser extent, construction,
commercial business, consumer and other mortgage loans to be held for investment. Additional lending activities have included originating saleable single-family loans, primarily fixed-rate first mortgages. The Bank’s net loans held for investment
were $879.9 million at June 30, 2019, representing 81.1% of consolidated total assets. This compares to $902.7 million, or 76.8% of consolidated total assets, at June 30, 2018.
At June 30, 2019, the maximum amount that the Bank could have loaned to any one borrower and the borrower’s related entities under applicable regulations was $18.3 million, or 15% of the Bank’s unimpaired capital and
surplus. At June 30, 2019, the Bank had no loans or group of loans to related borrowers with outstanding balances in excess of this amount. The Bank’s five largest lending relationships at June 30, 2019 consisted of: one commercial real estate loan
totaling $5.8 million to one group of borrowers; two multi-family loans totaling $4.6 million to one group of borrowers; two single-family loans totaling $4.5 million to one group of borrowers; one multi-family and one commercial real estate loan
totaling $4.4 million to one group of borrowers; and one commercial real estate loan totaling $4.3 million to one group of borrowers. The real estate collateral for these loans is located in Southern California. At June 30, 2019, all of these loans
were performing in accordance with their repayment terms.
On February 4, 2019, the Corporation announced that it was in the best interests of the Corporation to scale back the saleable single-family mortgage loan originations and improve on its efforts to increase the volume
of portfolio single-family mortgage loan originations and purchases. For additional information, see “Loan Originations” and “Critical Accounting Policies” in this Form 10-K.
3
Loans Held For Investment Analysis. The following table sets forth the composition of the Bank’s loans held for investment at the dates indicated:
|
At June 30,
|
||||||||||||||||||||||||||||||
|
2019
|
2018
|
2017
|
2016
|
2015
|
||||||||||||||||||||||||||
|
(Dollars In Thousands)
|
Amount
|
Percent
|
Amount
|
Percent
|
Amount
|
Percent
|
Amount
|
Percent
|
Amount
|
Percent
|
||||||||||||||||||||
|
Mortgage loans:
|
||||||||||||||||||||||||||||||
|
Single-family
|
$
|
324,952
|
36.87
|
%
|
$
|
314,808
|
34.80
|
%
|
$
|
322,197
|
35.51
|
%
|
$
|
324,497
|
38.44
|
%
|
$
|
365,961
|
44.65
|
%
|
||||||||||
|
Multi-family
|
439,041
|
49.81
|
476,008
|
52.63
|
479,959
|
52.89
|
415,627
|
49.23
|
347,020
|
42.34
|
||||||||||||||||||||
|
Commercial real
estate
|
111,928
|
12.70
|
109,726
|
12.13
|
97,562
|
10.75
|
99,528
|
11.79
|
100,897
|
12.31
|
||||||||||||||||||||
|
Construction
|
4,638
|
0.53
|
3,174
|
0.35
|
6,994
|
0.77
|
3,395
|
0.40
|
4,831
|
0.59
|
||||||||||||||||||||
|
Other
|
167
|
0.02
|
167
|
0.02
|
—
|
—
|
332
|
0.04
|
—
|
—
|
||||||||||||||||||||
|
Total mortgage loans
|
880,726
|
99.93
|
903,883
|
99.93
|
906,712
|
99.92
|
843,379
|
99.90
|
818,709
|
99.89
|
||||||||||||||||||||
|
Commercial business
loans
|
478
|
0.05
|
500
|
0.06
|
576
|
0.07
|
636
|
0.08
|
666
|
0.08
|
||||||||||||||||||||
|
Consumer loans
|
134
|
0.02
|
109
|
0.01
|
129
|
0.01
|
203
|
0.02
|
244
|
0.03
|
||||||||||||||||||||
|
Total loans held for
investment, gross
|
881,338
|
100.00
|
%
|
904,492
|
100.00
|
%
|
907,417
|
100.00
|
%
|
844,218
|
100.00
|
%
|
819,619
|
100.00
|
%
|
|||||||||||||||
|
Advance payments of
escrows
|
53
|
18
|
61
|
56
|
199
|
|||||||||||||||||||||||||
|
Deferred loan costs, net
|
5,610
|
5,560
|
5,480
|
4,418
|
3,140
|
|||||||||||||||||||||||||
|
Allowance for loan
losses
|
(7,076
|
)
|
(7,385
|
)
|
(8,039
|
)
|
(8,670
|
)
|
(8,724
|
)
|
||||||||||||||||||||
|
Total loans held for
investment, net
|
$
|
879,925
|
$
|
902,685
|
$
|
904,919
|
$
|
840,022
|
$
|
814,234
|
||||||||||||||||||||
4
Maturity of Loans Held for Investment. The following table sets forth information at June 30, 2019 regarding the dollar amount of principal payments becoming
contractually due during the periods indicated for loans held for investment. Demand loans, loans having no stated schedule of principal payments, loans having no stated maturity, and overdrafts are reported as becoming due within one year. The
table does not include any estimate of prepayments, which can significantly shorten the average life of loans held for investment and may cause the Bank’s actual principal payment experience to differ materially from that shown below:
|
(In Thousands)
|
Within
One Year
|
After
One Year
Through
3 Years
|
After
3 Years
Through
5 Years
|
After
5 Years
Through
10 Years
|
Beyond
10 Years
|
Total
|
||||||||||||
|
Mortgage loans:
|
||||||||||||||||||
|
Single-family
|
$
|
1,500
|
$
|
251
|
$
|
2,012
|
$
|
4,687
|
$
|
316,502
|
$
|
324,952
|
||||||
|
Multi-family
|
183
|
604
|
2,182
|
6,970
|
429,102
|
439,041
|
||||||||||||
|
Commercial real estate
|
153
|
2,194
|
11,335
|
83,111
|
15,135
|
111,928
|
||||||||||||
|
Construction
|
3,705
|
522
|
—
|
—
|
411
|
4,638
|
||||||||||||
|
Other
|
167
|
—
|
—
|
—
|
—
|
167
|
||||||||||||
|
Commercial business loans
|
74
|
50
|
68
|
—
|
286
|
478
|
||||||||||||
|
Consumer loans
|
134
|
—
|
—
|
—
|
—
|
134
|
||||||||||||
|
Total loans held for investment, gross
|
$
|
5,916
|
$
|
3,621
|
$
|
15,597
|
$
|
94,768
|
$
|
761,436
|
$
|
881,338
|
||||||
The following table sets forth the dollar amount of all loans held for investment due after June 30, 2020 which have fixed and floating or adjustable interest rates:
|
(Dollars In Thousands)
|
Fixed-Rate
|
%(1)
|
Floating or
Adjustable
Rate
|
%(1)
|
||||||
|
Mortgage loans:
|
||||||||||
|
Single-family
|
$
|
12,116
|
4
|
%
|
$
|
311,336
|
96
|
%
|
||
|
Multi-family
|
187
|
—
|
%
|
438,671
|
100
|
%
|
||||
|
Commercial real estate
|
449
|
—
|
%
|
111,326
|
100
|
%
|
||||
|
Construction
|
—
|
—
|
%
|
933
|
100
|
%
|
||||
|
Commercial business loans
|
354
|
88
|
%
|
50
|
12
|
%
|
||||
|
Total loans held for investment, gross
|
$
|
13,106
|
1
|
%
|
$
|
862,316
|
99
|
%
|
||
(1) As a percentage of each category.
Scheduled contractual principal payments of loans do not reflect the actual life of such assets. The average life of loans is generally substantially less than their contractual terms because of prepayments. In
addition, due-on-sale clauses generally give the Bank the right to declare loans immediately due and payable in the event, among other things, the borrower sells the real property that secures the loan. The average life of mortgage loans tends to
increase, however, when current market interest rates are substantially higher than the interest rates on existing loans held for investment and, conversely, decrease when the interest rates on existing loans held for investment are substantially
higher than current market interest rates, as borrowers are generally less inclined to refinance their loans when market rates increase and more inclined to refinance their loans when market rates decrease.
5
The table below describes the geographic dispersion of real estate secured loans held for investment (gross) at June 30, 2019 and 2018, as a percentage of the total dollar amount outstanding (dollars in thousands):
As of June 30, 2019:
|
Inland
Empire
|
Southern
California(1)
|
Other
California
|
Other
States
|
Total
|
|||||||||||||||||||||
|
Loan Category
|
Balance
|
%
|
Balance
|
%
|
Balance
|
%
|
Balance
|
%
|
Balance
|
%
|
|||||||||||||||
|
Single-family
|
$
|
104,967
|
33
|
%
|
$
|
146,963
|
45
|
%
|
$
|
71,997
|
22
|
%
|
$
|
1,025
|
—
|
%
|
$
|
324,952
|
100
|
%
|
|||||
|
Multi-family
|
70,241
|
16
|
%
|
272,282
|
62
|
%
|
96,192
|
22
|
%
|
326
|
—
|
%
|
439,041
|
100
|
%
|
||||||||||
|
Commercial real
estate
|
30,551
|
27
|
%
|
54,010
|
48
|
%
|
27,367
|
25
|
%
|
—
|
—
|
%
|
111,928
|
100
|
%
|
||||||||||
|
Construction
|
525
|
11
|
%
|
3,579
|
77
|
%
|
534
|
12
|
%
|
—
|
—
|
%
|
4,638
|
100
|
%
|
||||||||||
|
Other
|
—
|
—
|
%
|
—
|
—
|
%
|
167
|
100
|
%
|
—
|
—
|
%
|
167
|
100
|
%
|
||||||||||
|
Total
|
$
|
206,284
|
24
|
%
|
$
|
476,834
|
54
|
%
|
$
|
196,257
|
22
|
%
|
$
|
1,351
|
—
|
%
|
$
|
880,726
|
100
|
%
|
|||||
|
(1)
|
Other than the Inland Empire.
|
As of June 30, 2018:
|
Inland
Empire
|
Southern
California(1)
|
Other
California
|
Other
States
|
Total
|
|||||||||||||||||||||
|
Loan Category
|
Balance
|
%
|
Balance
|
%
|
Balance
|
%
|
Balance
|
%
|
Balance
|
%
|
|||||||||||||||
|
Single-family
|
$
|
110,510
|
35
|
%
|
$
|
149,261
|
48
|
%
|
$
|
53,960
|
17
|
%
|
$
|
1,077
|
—
|
%
|
$
|
314,808
|
100
|
%
|
|||||
|
Multi-family
|
76,473
|
16
|
%
|
287,174
|
60
|
%
|
109,684
|
23
|
%
|
2,677
|
1
|
%
|
476,008
|
100
|
%
|
||||||||||
|
Commercial real
estate
|
32,224
|
29
|
%
|
47,903
|
44
|
%
|
29,599
|
27
|
%
|
—
|
—
|
%
|
109,726
|
100
|
%
|
||||||||||
|
Construction
|
208
|
3
|
%
|
6,763
|
90
|
%
|
505
|
7
|
%
|
—
|
—
|
%
|
7,476
|
100
|
%
|
||||||||||
|
Other
|
—
|
—
|
%
|
—
|
—
|
%
|
167
|
100
|
%
|
—
|
—
|
%
|
167
|
100
|
%
|
||||||||||
|
Total
|
$
|
219,415
|
24
|
%
|
$
|
491,101
|
54
|
%
|
$
|
193,915
|
21
|
%
|
$
|
3,754
|
1
|
%
|
$
|
908,185
|
100
|
%
|
|||||
|
(1)
|
Other than the Inland Empire.
|
Single-Family Mortgage Loans. One of the Bank’s primary lending activity is the origination and purchase of adjustable rate mortgage loans to be held for investment secured by
first mortgages on owner-occupied, single-family (one to four units) residences in the communities where the Bank has established full service branches and surrounding areas in Southern and Northern California. During fiscal 2019 the Bank originated
$55.4 million and purchased $33.3 million of single-family loans to be held for investment, all of which were underwritten in accordance with the Bank’s origination guidelines. This compares to loan originations of $90.4 million and no loan purchases
during fiscal 2018. Additional lending activities have included originating saleable single-family loans, primarily fixed-rate first mortgages. At June 30, 2019, total single-family loans held for investment increased slightly to $325.0 million, or
36.9% of the total loans held for investment, from $314.8 million, or 34.8% of the total loans held for investment, at June 30, 2018. The slight increase in the single-family loans in fiscal 2019 was primarily attributable to new loans originated
and purchased for investment, partly offset by loan principal payments. During fiscal 2019, the Bank had net recoveries of $167,000 in non-performing single-family loans, as compared to net charge-offs of $114,000 during fiscal 2018. At June 30,
2019 and 2018, total non-performing single-family loans were $5.2 million and $6.0 million, net of allowances and charge-offs, respectively, and $660,000 and $804,000 were past due 30 to 89 days, respectively.
The Bank has underwriting standards that require verified documentation of income and assets from borrowers and our underwriting generally conforms to agency mandated credit score requirements. Generally, mortgage
insurance is required on all loans exceeding 80% loan-to-value based on the lower of purchase price or appraised value at the time of loan origination. Loan-to-value (“LTV”) is the ratio derived by dividing the original loan balance by the lower of
the original appraised value or purchase price of the real estate collateral. The maximum allowable loan-to-value is 97% on a purchase transaction for conventional financing with mortgage insurance and 96.5% loan-to-value for FHA financing with
mortgage
6
insurance. Second home purchases and rate and term refinance transactions are capped at 90% loan-to-value with mortgage insurance. Non-owner occupied purchase and rate and term refinance transactions are capped at
80% loan-to-value while non-owner occupied refinance cash-out transactions are capped at 75% loan-to-value. We manage our underwriting standards, loan-to-value ratios and credit standards to the currently required agency and investor policies and
guidelines. These standards may change at any time, given changes in real estate market conditions, secondary mortgage market requirements and changes to investor policies and guidelines.
The Bank offers closed-end, fixed-rate home equity loans that are secured by the borrower’s primary residence. These loans do not exceed 80% of the appraised value of the residence and have terms of up to 15 years
requiring monthly payments of principal and interest. At June 30, 2019, home equity loans amounted to $11.0 million or 3.4% of single-family loans held for investment, as compared to $14.1 million or 4.5% of single-family loans held for investment
at June 30, 2018.
The Bank offers adjustable rate mortgage (“ARM”) loans at rates and terms competitive with market conditions. Substantially all of the ARM loans originated by the Bank meet the underwriting standards of the secondary
market. The Bank offers several ARM products, which adjust monthly, semi-annually, or annually after an initial fixed period ranging from one month to ten years subject to a limitation on the annual increase of one to two percentage points and an
overall limitation of three to six percentage points. The following indexes, plus a margin of 2.00% to 3.25%, are used to calculate the periodic interest rate changes: the London Interbank Offered Rate (“LIBOR”), the FHLB Eleventh District cost of
funds (“COFI”), the 12-month average U.S. Treasury (“12 MAT”) or the weekly average yield on one year U.S. Treasury securities adjusted to a constant maturity of one year (“CMT”). Loans based on the LIBOR index constitute a majority of the Bank’s
loans held for investment. The majority of the ARM loans held for investment have five or seven-year fixed periods prior to the first adjustment (“5/1 or 7/1 hybrids”) and provide for fully amortizing loan payments throughout the term of the
loan. Loans of this type have embedded interest rate risk if interest rates should rise during the initial fixed rate period.
Prior to fiscal 2009, the Bank offered stated income single-family mortgage loans. As of June 30, 2019 and 2018, the outstanding balance of the stated income single-family mortgage loans was $52.6 million and $72.0
million, respectively, of which $2.1 million and $3.7 million, respectively were non-performing, while $660,000 were 30-89 days delinquent at June 30, 2019 and none were 30-89 days delinquent at June 30, 2018.
Borrower demand for ARM loans versus fixed-rate mortgage loans is a function of the level of interest rates, the expectations of changes in the level of interest rates and the difference between the initial interest
rates and fees charged for each type of loan. The relative amount of fixed-rate mortgage loans and ARM loans that can be originated at any time is largely determined by the demand for each product in a given interest rate and competitive
environment. Given the recent market environment, the production of ARM loans was lower as compared to fixed rate mortgages.
The retention of ARM loans, rather than fixed-rate loans, helps to reduce the Bank’s exposure to changes in interest rates. There is, however, unquantifiable credit risk resulting from the potential of increased
interest charges to be paid by the borrower as a result of increases in interest rates. It is possible that, during periods of rising interest rates, the risk of default on ARM loans may increase as a result of the increase in the required payment
from the borrower. Furthermore, the risk of default may increase because ARM loans originated by the Bank occasionally provide, as a marketing incentive, for initial rates of interest below those rates that would apply if the adjustment index plus
the applicable margin were initially used for pricing. Because of these characteristics, ARM loans are subject to increased risks of default or delinquency. Additionally, while ARM loans allow the Bank to decrease the sensitivity of its assets as a
result of changes in interest rates, the extent of this interest rate sensitivity is limited by the periodic and lifetime interest rate adjustment limits. Furthermore, because loan indexes may not respond perfectly to changes in market interest
rates, upward adjustments on loans may occur more slowly than increases in the Bank’s cost of interest-bearing liabilities, especially during periods of rapidly increasing interest rates. Because of these characteristics, the Bank has no assurance
that yields on ARM loans will be sufficient to offset increases in the Bank’s cost of funds.
The Dodd-Frank Wall Street Reform and Consumer Protection Act (the “Dodd-Frank Act”) requires lenders to make a reasonable, good faith determination of a borrower’s ability to repay any consumer closed-end credit
transaction secured by a
7
dwelling and to limit prepayment penalties. Increased risks of legal challenge, private right of action and regulatory enforcement actions result from these rules. The Bank originates an immaterial number of loans
that do not meet the definition of a “qualified mortgage” (“QM”). To mitigate the risks involved with non-QM loans, the Bank has implemented systems, processes, procedural and product changes, and maintains its underwriting standards, to ensure that
the “ability-to-repay” requirements of the new rules are adequately addressed.
A decline in real estate values subsequent to the time of origination of real estate secured loans could result in higher loan delinquency levels, foreclosures, provisions for loan losses and net charge-offs. Real
estate values and real estate markets are beyond the Bank’s control and are generally affected by changes in national, regional or local economic conditions and other factors. These factors include fluctuations in interest rates and the availability
of loans to potential purchasers, housing supply and demand, changes in tax laws and other governmental statutes, regulations and policies and acts of nature, such as earthquakes, fires and other natural disasters particular to California where
substantially all of our real estate collateral is located. If real estate values decline from the levels at the time of loan origination, the value of our real estate collateral securing the loans could be significantly reduced. The Bank’s ability
to recover on defaulted loans by foreclosing and selling the real estate collateral would then be diminished and it would be more likely to suffer losses on defaulted loans.
Multi-Family and Commercial Real Estate Mortgage Loans. At June 30, 2019, multi-family mortgage loans were $439.0 million and commercial real estate loans were $111.9 million,
or 49.8% and 12.7%, respectively, of loans held for investment. This compares to multi-family mortgage loans of $476.0 million and commercial real estate loans of $109.7 million, or 52.6% and 12.1%, respectively, of loans held for investment at June
30, 2018. Consistent with its strategy to diversify the composition of loans held for investment, the Bank has made the origination and purchase of multi-family and commercial real estate loans a priority. During fiscal 2019 the Bank originated
$57.6 million and purchased $17.8 million of multi-family and commercial real estate loans, all of which were underwritten in accordance with the Bank’s origination guidelines. This compares to loan originations of $91.1 million and loan purchases
of $13.5 million during fiscal 2018. At June 30, 2019, the Bank had 644 multi-family and 146 commercial real estate loans in loans held for investment.
Multi-family mortgage loans originated by the Bank are predominately adjustable rate loans, including 1/1, 3/1, 5/1 and 7/1 hybrids, with a term to maturity of 10 to 30 years and a 25 to 30 year amortization
schedule. Commercial real estate loans originated by the Bank are also predominately adjustable rate loans, including 1/1, 3/1 and 5/1 hybrids, with a term to maturity of 10 to 30 years and a 25 to 30 year amortization schedule. Rates on
multi-family and commercial real estate ARM loans generally adjust monthly, quarterly, semi-annually or annually at a specific margin over the respective interest rate index, subject to period interest rate caps and life-of-loan interest rate
caps. At June 30, 2019, $413.8 million, or 94.3%, of the Bank’s multi-family loans were secured by five to 36 unit projects. The Bank’s commercial real estate loan portfolio generally consists of loans secured by small office buildings, light
industrial buildings, warehouses and small retail centers. Properties securing multi-family and commercial real estate loans are primarily located in Alameda, Los Angeles, Orange, Riverside, San Bernardino, San Diego, San Francisco and Santa Clara
counties. The Bank originates multi-family and commercial real estate loans in amounts typically ranging from $350,000 to $6.0 million. At June 30, 2019, the Bank had 52 commercial real estate and multi-family loans with principal balances greater
than $1.5 million totaling $117.6 million. The Bank obtains appraisals on all properties that secure multi-family and commercial real estate loans. Underwriting of multi-family and commercial real estate loans includes, among other considerations,
a thorough analysis of the cash flows generated by the property to support the debt service and the financial resources, experience and the income level of the borrowers and guarantors.
Multi-family and commercial real estate loans afford the Bank an opportunity to price the loans with higher interest rates than those generally available from single-family mortgage loans. However, loans secured by
such properties are generally greater in amount, more difficult to evaluate and monitor and are more susceptible to default as a result of general economic conditions and, therefore, involve a greater degree of risk than single-family residential
mortgage loans. Because payments on loans secured by multi-family and commercial real estate properties are often dependent on the successful operation and management of the properties, repayment of such loans may be impacted by adverse conditions
in the real estate market or the economy. During both fiscal 2019 and 2018, the Bank had no charge-offs or recoveries on non-performing multi-family and commercial real estate loans. At June 30, 2019 or 2018, there were no non-performing
multi-family and commercial real estate
8
loans and none were past due 30 to 89 days. Non-performing loans and/or delinquent loans may increase if there is a general decline in California real estate markets and in the event poor general
economic conditions prevail.
Short-term construction loans include three types of loans: custom construction, tract construction, and speculative construction. Additionally, from time to time, the Bank makes short-term (18 to 36 month) lot loans
to facilitate land acquisition prior to the start of construction. At June 30, 2019, lot loans totaled $167,000. The Bank provides construction financing for single-family, multi-family and commercial real estate properties. Custom construction
loans are made to individuals who, at the time of application, have a contract executed with a builder to construct their residence. Custom construction loans are generally originated for a term of 12 to 18 months, with fixed interest rates at the
prime lending rate plus a margin and with loan-to-value ratios of up to 75% of the appraised value of the completed property. The owner secures long-term permanent financing at the completion of construction. At June 30, 2019, there were two custom
single-family construction loans totaling $1.7 million with $1.2 million of undisbursed funds. This compares to June 30, 2018 when the Bank had two custom single-family construction loans totaling $1.6 million with $916,000 of undisbursed funds.
The Bank makes tract construction loans to subdivision builders. These subdivisions are usually financed and built in phases. A thorough analysis of market trends and demand within the area are reviewed for
feasibility. Tract construction may include the building and financing of model homes under a separate loan. The terms for tract construction loans are generally 12 months with interest rates fixed at a margin above the prime lending rate. At June
30, 2019, there were no tract construction loans.
Speculative construction loans are made to home builders and are termed “speculative” because the home builder does not have, at the time of loan origination, a signed sale contract with a home buyer who has a
commitment for permanent financing with either the Bank or another lender for the finished home. The home buyer may be identified during or after the construction period. The builder may be required to debt service the speculative construction loan
for a significant period of time after the completion of construction until the homebuyer is identified. At June 30, 2019, there was one single-family speculative construction loan of $716,000 with $529,000 of undisbursed funds. This compares to
June 30, 2018 when the Bank had two single-family speculative construction loans totaling $1.1 million with $122,000 of undisbursed funds.
Construction/permanent loans automatically roll from the construction to the permanent phase. The construction phase of a construction/permanent loan generally lasts nine to 12 months and the interest rate charged is
generally fixed at a margin above prime rate and with a loan-to-value ratio of up to 75% of the appraised value of the completed property. At June 30, 2019, there was $410,000 of construction/permanent loans and there were no construction/permanent
loans at June 30, 2018.
Construction loans under $1.0 million are approved by Bank personnel specifically designated to approve construction loans. The Bank’s Loan Committee, comprised of the Chief Executive Officer, Chief Lending Officer,
Chief Financial Officer, Senior Vice President – Single-Family Division and Vice President - Loan Administration, approves all construction loans over $1.0 million. Prior to approval of any construction loan, an independent fee appraiser inspects
the site and the Bank reviews the existing or proposed improvements, identifies the market for the proposed project, and analyzes the pro-forma data and assumptions on the project. In the case of a tract or speculative construction loan, the Bank
reviews the experience and expertise of the builder. The Bank obtains credit reports, financial statements and tax returns on the borrowers and guarantors, an independent appraisal of the project, and any other expert report necessary to evaluate
the proposed project. In the event of cost overruns, the Bank requires the borrower to deposit their own funds into a loan-in-process account, which the Bank disburses consistent with the completion of the subject property pursuant to a revised
disbursement schedule.
9
The construction loan documents require that construction loan proceeds be disbursed in increments as construction progresses. Disbursements are based on periodic on-site inspections by independent inspectors and Bank
personnel. At inception, the Bank also requires borrowers to deposit funds into the loan-in-process account covering the difference between the actual cost of construction and the loan amount. The Bank regularly monitors the construction loan
portfolio, economic conditions and housing inventory. The Bank’s property inspectors perform periodic inspections. The Bank believes that the internal monitoring system helps reduce many of the risks inherent in its construction loans.
Construction loans afford the Bank the opportunity to achieve higher interest rates and fees with shorter terms to maturity than its single-family mortgage loans. Construction loans, however, are generally considered
to involve a higher degree of risk than single-family mortgage loans because of the inherent difficulty in estimating both a property’s value at completion of the project and the cost of the project. The nature of these loans is such that they are
generally more difficult to evaluate and monitor. If the estimate of construction costs proves to be inaccurate, the Bank may be required to advance funds beyond the amount originally committed to permit completion of the project. If the estimate
of value upon completion proves to be inaccurate, the Bank may be confronted with a project whose value is insufficient to assure full repayment. Projects may also be jeopardized by disagreements between borrowers and builders and by the failure of
builders to pay subcontractors. Loans to builders to construct homes for which no purchaser has been identified carry additional risk because the payoff for the loan depends on the builder’s ability to sell the property prior to the time that the
construction loan matures. The Bank has sought to address these risks by adhering to strict underwriting policies, disbursement procedures and monitoring practices. In addition, because the Bank’s construction lending is in its primary market area,
changes in the local or regional economy and real estate market could adversely affect the Bank’s construction loans held for investment. During fiscal 2019, the Bank had no charge-offs or recoveries, but had one loan totaling $971,000 that was
non-performing and no loans were 30-89 days delinquent at June 30, 2019. During fiscal 2018, the Bank had no charge-offs or recoveries and no loans were non-performing or 30-89 days delinquent at June 30, 2018.
Participation Loan Purchases and Sales. In an effort to expand production and diversify risk, the Bank purchases loans and loan participations, with collateral primarily in
California, which allows for greater geographic distribution outside of the Bank’s primary lending areas. The Bank generally purchases between 50% and 100% of the total loan amount. When the Bank purchases a participation loan, the lead lender will
usually retain a servicing fee, thereby decreasing the loan yield. This servicing fee approximates the expense the Bank would incur if the Bank were to service the loan. All properties serving as collateral for loan participations are inspected by
an employee of the Bank or a third party inspection service prior to being approved by the Loan Committee and the Bank relies upon the same underwriting criteria required for those loans originated by the Bank. The Bank purchased $51.1 million of
loans to be held for investment (primarily single-family and multi-family loans) in fiscal 2019, compared to $13.5 million of purchased loans to be held for investment (primarily multi-family loans) in fiscal 2018. As of June 30, 2019, total loans
serviced by other financial institutions were $33.9 million, as compared to $20.5 million at June 30, 2018. As of June 30, 2019, all loans serviced by others were performing according to their contractual payment terms.
The Bank also sells participating interests in loans when it has been determined that it is beneficial to diversify the Bank’s risk. Participation sales enable the Bank to maintain acceptable loan concentrations and
comply with the Bank’s loans to one borrower policy. Generally, selling a participating interest in a loan increases the yield to the Bank on the portion of the loan that is retained. The Bank did not sell any participation loans in fiscal 2019 or
fiscal 2018.
Commercial Business Loans. The Bank has a Business Banking Department that primarily serves businesses located within the Inland Empire. Commercial business loans allow the
Bank to diversify its lending and increase the average loan yield. As of June 30, 2019, commercial business loans were $478,000, or 0.1% of loans held for investment, a decrease of $22,000, or 4%, during fiscal 2019 from $500,000, or 0.1% of loans
held for investment at June 30, 2018. These loans represent secured and unsecured lines of credit and term loans secured by business assets.
Commercial business loans are generally made to customers who are well known to the Bank and are generally secured by accounts receivable, inventory, business equipment and/or other assets. The Bank’s commercial
business loans may be structured as term loans or as lines of credit. Lines of credit are made at variable rates of interest equal to a negotiated margin
10
above the prime rate and term loans are at a fixed or variable rate. The Bank may also require personal guarantees from financially capable parties associated with the business based on a review of personal financial
statements. Commercial business term loans are generally made to finance the purchase of assets and have maturities of five years or less. Commercial lines of credit are typically made for the purpose of providing working capital and are usually
approved with a term of one year or less.
Commercial business loans involve greater risk than residential mortgage loans and involve risks that are different from those associated with residential and commercial real estate loans. Real estate loans are generally considered to be collateral
based lending with loan amounts based on predetermined loan to collateral value and liquidation of the underlying real estate collateral is viewed as the primary source of repayment in the event of borrower default. Although commercial business loans
are often collateralized by equipment, inventory, accounts receivable or other business assets including real estate, the liquidation of collateral in the event of a borrower default is often an insufficient source of repayment because accounts
receivable may not be collectible and inventories and equipment may be obsolete or of limited use. Accordingly, the repayment of a commercial business loan depends primarily on the creditworthiness of the borrower (and any guarantors), while
liquidation of collateral is secondary and oftentimes an insufficient source of repayment. At June 30, 2019 and 2018, the Bank had $41,000 and $64,000 of non-performing commercial business loans, respectively, net of allowances and
charge-offs. During fiscal 2019 or 2018, the Bank had no charge-offs or recoveries on commercial business loans.
Consumer Loans. At June 30, 2019 and 2018, the Bank’s consumer loans were $134,000 and $109,000, respectively, or less than 0.1% of the Bank’s loans held for investment at these
dates. The Bank offers open-ended lines of credit on either a secured or unsecured basis. The Bank offers secured savings lines of credit which have an interest rate that is four percentage points above the COFI, which adjusts monthly. Secured
savings lines of credit at June 30, 2019 and 2018 were $0 and $3,000, respectively.
Consumer loans potentially have a greater risk than residential mortgage loans, particularly in the case of loans that are unsecured. Consumer loan collections are dependent on the borrower’s ongoing financial
stability, and thus are more likely to be adversely affected by job loss, illness or personal bankruptcy. Furthermore, the application of various federal and state laws, including federal and state bankruptcy and insolvency laws, may limit the
amount that can be recovered on such loans. The Bank had no non-performing consumer loans at June 30, 2019 and 2018. During fiscal 2019, the Bank had $1,000 of net charge-offs on consumer loans, as compared to net charge-offs of $4,000 during
fiscal 2018.
Loans Originations, Purchases, Sales and Repayments
The Bank’s saleable single-family loans are generally underwritten and documented in accordance with guidelines established by institutional loan buyers, Freddie Mac, Fannie Mae and the Federal Housing Administration
(“FHA”) (collectively, “the secondary market”). All conforming agency loans are generally underwritten and documented in accordance with the guidelines established by these secondary market purchasers, as well as the Department of Housing and Urban
Development (“HUD”), FHA and the Veterans’ Administration (“VA”). Loans are normally classified as either conforming (meeting agency criteria) or non-conforming (meeting an institutional investor’s criteria). Non-conforming loans are typically
those that exceed agency loan limits but closely mirror agency underwriting criteria. The non-conforming loans may be underwritten to expanded guidelines allowing a borrower with good credit a broader range of product choices.
Mortgage loans are originated for both investment and sale to the secondary market. The Corporation is primarily a single-family ARM lender for its own portfolio. Prior to scaling back originations of saleable
single-family fixed-rate mortgage loans during fiscal 2019, a large amount of single-family fixed-rate mortgage loans were originated for sale to institutional investors. Mortgage loans sold to investors generally are sold without recourse other than
standard representations and warranties. Generally, mortgage loans sold to Fannie Mae and Freddie Mac are sold on a non-recourse basis and foreclosure losses are generally the responsibility of the purchaser and not the Bank, except in the case of
FHA and VA loans used to form Government National Mortgage Association pools, which are subject to limitations on the FHA’s and VA’s loan guarantees. For additional information, see Note 1 of the Notes to Consolidated Financial Statements,
“Organization and Summary of Significant Accounting Policies,” under the subheading “Loans originated and held for sale.”
11
The following table shows the Bank’s loan originations, purchases, sales and principal repayments during the periods indicated:
|
Year Ended June 30,
|
|||||||||
|
(In Thousands)
|
2019
|
2018
|
2017
|
||||||
|
Loans originated and purchased for sale:
|
|||||||||
|
Retail originations
|
$
|
296,992
|
$
|
679,504
|
$
|
997,142
|
|||
|
Wholesale originations
|
170,102
|
506,492
|
915,896
|
||||||
|
Total loans originated and purchased for sale
|
467,094
|
1,185,996
|
1,913,038
|
||||||
|
Loans sold:
|
|||||||||
|
Servicing released
|
(551,754
|
)
|
(1,174,618
|
)
|
(1,935,349
|
)
|
|||
|
Servicing retained
|
(7,196
|
)
|
(27,566
|
)
|
(38,250
|
)
|
|||
|
Total loans sold
|
(558,950
|
)
|
(1,202,184
|
)
|
(1,973,599
|
)
|
|||
|
Loans originated for investment:
|
|||||||||
|
Mortgage loans:
|
|||||||||
|
Single-family
|
55,410
|
90,434
|
80,280
|
||||||
|
Multi-family
|
42,191
|
66,355
|
87,511
|
||||||
|
Commercial real estate
|
15,402
|
24,749
|
11,989
|
||||||
|
Construction
|
7,159
|
4,667
|
12,123
|
||||||
|
Other
|
—
|
167
|
—
|
||||||
|
Commercial business loans
|
—
|
—
|
45
|
||||||
|
Consumer loans
|
—
|
4
|
1
|
||||||
|
Total loans originated for investment
|
120,162
|
186,376
|
191,949
|
||||||
|
Loans purchased for investment:
|
|||||||||
|
Mortgage loans:
|
|||||||||
|
Single-family
|
33,256
|
—
|
19,516
|
||||||
|
Multi-family
|
16,645
|
12,654
|
42,188
|
||||||
|
Commercial real estate
|
1,157
|
868
|
—
|
||||||
|
Total loans purchased for investment
|
51,058
|
13,522
|
61,704
|
||||||
|
Loan principal repayments
|
(195,386
|
)
|
(208,503
|
)
|
(196,993
|
)
|
|||
|
Real estate acquired in the settlement of loans
|
—
|
(2,171
|
)
|
(1,845
|
)
|
||||
|
(Decrease) increase in other items, net(1)
|
(3,036
|
)
|
4,480
|
(2,267
|
)
|
||||
|
Net decrease in loans held for investment and loans held for sale at fair value
|
$
|
(119,058
|
)
|
$
|
(22,484
|
)
|
$
|
(8,013
|
)
|
|
(1)
|
Includes net changes in undisbursed loan funds, deferred loan fees or costs, allowance for loan losses, fair value of loans held for investment, fair value of loans held for sale, advance
payments of escrows and repurchases.
|
Loan Servicing
The Bank receives fees from a variety of investors in return for performing the traditional services of collecting individual loan payments on loans sold by the Bank to such investors. At June 30, 2019, the Bank was
servicing $120.2 million of loans for others, a 6% decrease from $128.4 million at June 30, 2018. The decrease was primarily attributable to loan prepayments, partly offset by loans sold with servicing retained during fiscal 2019. Loan servicing
includes processing payments, accounting
12
for loan funds and collecting and paying real estate taxes, hazard insurance and other loan-related items such as private mortgage insurance. After the Bank receives the gross mortgage payment from individual
borrowers, it remits to the investor a predetermined net amount based on the loan sale agreement for that mortgage.
Servicing assets are amortized in proportion to and over the period of the estimated net servicing income and are carried at the lower of cost or fair value. The fair value of servicing assets is determined by
calculating the present value of the estimated net future cash flows consistent with contractually specified servicing fees. The Bank periodically evaluates servicing assets for impairment, which is measured as the excess of cost over fair
value. This review is performed on a disaggregated basis, based on loan type and interest rate. Generally, loan servicing becomes more valuable when interest rates rise (as prepayments typically decrease) and less valuable when interest rates
decline (as prepayments typically increase). In estimating fair values at June 30, 2019 and 2018, the Bank used a weighted average Constant Prepayment Rate (“CPR”) of 23.86% and 13.42%, respectively, and a weighted-average discount rate of 9.11% and
9.11%, respectively. The required impairment reserve against servicing assets at June 30, 2019 and 2018 was $298,000 and $82,000, respectively. In aggregate, servicing assets had a carrying value of $925,000 and a fair value of $627,000 at June 30,
2019, compared to a carrying value of $998,000 and a fair value of $1.0 million at June 30, 2018.
Delinquencies and Classified Assets
Delinquent Loans. When a mortgage loan borrower fails to make a required payment when due, the Bank initiates collection procedures. In most cases, delinquencies are cured
promptly; however, if the loan remains delinquent on the 120th day for single-family loans or the 90th day for other loans, or sooner if the borrower is chronically delinquent, and after all reasonable means of obtaining the payment have been
exhausted, foreclosure proceedings, according to the terms of the security instrument and applicable law, are initiated. Interest income is reduced by the full amount of accrued and uncollected interest on such loans.
The following table sets forth delinquencies in the Bank’s loans held for investment as of the dates indicated, gross of collectively and individually evaluated allowances, if any:
|
At June 30,
|
|||||||||||||||||||||||||||||||||||
|
2019
|
2018
|
2017
|
|||||||||||||||||||||||||||||||||
|
30 – 89 Days
|
Non-performing
|
30 - 89 Days
|
Non-performing
|
30 - 89 Days
|
Non-performing
|
||||||||||||||||||||||||||||||
|
(Dollars In Thousands)
|
Number
of
Loans
|
Principal
Balance
of Loans
|
Number
of
Loans
|
Principal
Balance
of Loans
|
Number
of
Loans
|
Principal
Balance
of Loans
|
Number
of
Loans
|
Principal
Balance
of Loans
|
Number
of
Loans
|
Principal
Balance
of Loans
|
Number
of
Loans
|
Principal
Balance
of Loans
|
|||||||||||||||||||||||
|
Mortgage loans:
|
|||||||||||||||||||||||||||||||||||
|
Single-family
|
2
|
$
|
660
|
20
|
$
|
5,640
|
1
|
$
|
804
|
21
|
$
|
6,141
|
3
|
$
|
1,035
|
27
|
$
|
8,016
|
|||||||||||||||||
|
Commercial real estate
|
—
|
—
|
—
|
—
|
—
|
—
|
—
|
—
|
—
|
—
|
1
|
201
|
|||||||||||||||||||||||
|
Construction
|
—
|
—
|
1
|
971
|
—
|
—
|
—
|
—
|
—
|
—
|
—
|
—
|
|||||||||||||||||||||||
|
Commercial business
loans
|
—
|
—
|
1
|
49
|
—
|
—
|
1
|
70
|
—
|
—
|
1
|
80
|
|||||||||||||||||||||||
|
Consumer loans(1)
|
61
|
5
|
—
|
—
|
2
|
1
|
—
|
—
|
—
|
—
|
—
|
—
|
|||||||||||||||||||||||
|
Total
|
63
|
$
|
665
|
22
|
$
|
6,660
|
3
|
$
|
805
|
22
|
$
|
6,211
|
3
|
$
|
1,035
|
29
|
$
|
8,297
|
|||||||||||||||||
|
(1)
|
At June 30, 2019, the balance includes 61 overdrawn consumer deposit accounts which were not reported in prior years due to
immateriality.
|
As of June 30, 2019, total non-performing assets, net of allowance for loan losses and fair value adjustments, were $6.2 million, or 0.57% of total assets, which was primarily comprised of: 20
single-family loans ($5.2 million); one construction loan ($971,000); one commercial business loan ($41,000); and no REO. As of June 30, 2019, 70%, or $4.4 million of non-performing loans had a current payment status. This compares to total
non-performing assets, net of allowance for loan losses and fair value adjustments, of $7.0 million, or 0.59% of total assets, with $2.9 million, or 48%, of non-performing loans with a current payment status at June 30, 2018.
13
The following table sets forth information with respect to the Bank’s non-performing assets and troubled debt restructurings (“restructured loans”), net of allowance for loan losses and fair value
adjustments, at the dates indicated:
|
At June 30,
|
|||||||||||||||
|
(Dollars In Thousands)
|
2019
|
2018
|
2017
|
2016
|
2015
|
||||||||||
|
Loans on non-performing status
(excluding restructured loans):
|
|||||||||||||||
|
Mortgage loans:
|
|||||||||||||||
|
Single-family
|
$
|
3,315
|
$
|
2,665
|
$
|
4,668
|
$
|
6,292
|
$
|
7,010
|
|||||
|
Multi-family
|
—
|
—
|
—
|
709
|
653
|
||||||||||
|
Commercial real estate
|
—
|
—
|
201
|
—
|
680
|
||||||||||
|
Construction
|
971
|
—
|
—
|
—
|
—
|
||||||||||
|
Total
|
4,286
|
2,665
|
4,869
|
7,001
|
8,343
|
||||||||||
|
Accruing loans past due 90 days or more
|
—
|
—
|
—
|
—
|
—
|
||||||||||
|
Restructured loans on non-performing status:
|
|||||||||||||||
|
Mortgage loans:
|
|||||||||||||||
|
Single-family
|
1,891
|
3,328
|
3,061
|
3,232
|
2,902
|
||||||||||
|
Multi-family
|
—
|
—
|
—
|
—
|
1,593
|
||||||||||
|
Commercial real estate
|
—
|
—
|
—
|
—
|
1,019
|
||||||||||
|
Commercial business loans
|
41
|
64
|
65
|
76
|
89
|
||||||||||
|
Total
|
1,932
|
3,392
|
3,126
|
3,308
|
5,603
|
||||||||||
|
Total non-performing loans
|
6,218
|
6,057
|
7,995
|
10,309
|
13,946
|
||||||||||
|
Real estate owned, net
|
—
|
906
|
1,615
|
2,706
|
2,398
|
||||||||||
|
Total non-performing assets
|
$
|
6,218
|
$
|
6,963
|
$
|
9,610
|
$
|
13,015
|
$
|
16,344
|
|||||
|
Non-performing loans as a percentage of
loans held for investment, net
|
0.71
|
%
|
0.67
|
%
|
0.88
|
%
|
1.23
|
%
|
1.71
|
%
|
|||||
|
Non-performing loans as a percentage
of total assets
|
0.57
|
%
|
0.52
|
%
|
0.67
|
%
|
0.88
|
%
|
1.19
|
%
|
|||||
|
Non-performing assets as a percentage
of total assets
|
0.57
|
%
|
0.59
|
%
|
0.80
|
%
|
1.11
|
%
|
1.39
|
%
|
|||||
The Bank assesses loans individually and classifies the loans as non-performing and substandard in accordance with regulatory requirements when the accrual of interest has been discontinued, loans have been
restructured or management has serious doubts about the future collectibility of principal and interest, even though the loans are currently performing. Factors considered in determining classification include, but are not limited to, expected
future cash flows, collateral value, the financial condition of the borrower and current economic conditions. The Bank measures each non-performing loan based on ASC 310, “Receivables,” establishes a collectively evaluated or individually evaluated
allowance and charges off those loans or portions of loans deemed uncollectible.
14
Restructured Loans. A troubled debt restructuring is a loan which the Bank, for reasons related to a borrower’s financial difficulties, grants a concession to the borrower that
the Bank would not otherwise consider.
The loan terms which have been modified or restructured due to a borrower’s financial difficulty, include but are not limited to:
a) A reduction in the stated interest rate.
b) An extension of the maturity at an interest rate below market.
c) A reduction in the accrued interest.
d) Extensions, deferrals, renewals and rewrites.
To qualify for restructuring, a borrower must provide evidence of their creditworthiness such as, current financial statements, their most recent income tax returns, current paystubs, current W-2s, and most recent bank
statements, among other documents, which are then verified by the Bank. The Bank re-underwrites the loan with the borrower’s updated financial information, new credit report, current loan balance, new interest rate, remaining loan term, updated
property value and modified payment schedule, among other considerations, to determine if the borrower qualifies.
For the fiscal year ended June 30, 2019, there were no loans that were newly modified from their original terms, re-underwritten or identified as a restructured loan; one loan (previously modified) was downgraded;
while three loans were upgraded to the pass category; one loan was paid off; and no loans were converted to REO. For the fiscal year ended June 30, 2018, there were two loans that were newly modified from their original terms, re-underwritten or
identified as a restructured loan, two loans (previously modified) were downgraded, while two loans were upgraded to the pass category and one loan was converted to REO. During the fiscal years ended June 30, 2019 and 2018, no restructured loans
were in default within a 12-month period subsequent to their original restructuring. Additionally, during the fiscal year ended June 30, 2019, there was one restructured loan of $56,000 that was extended beyond the initial maturity of the
modification; while in fiscal 2018, there were no restructured loans that were extended beyond the initial maturity of the modification.
As of June 30, 2019, the net outstanding balance of the Corporation’s eight restructured loans was $3.8 million: one was classified as special mention and remains on accrual status ($437,000); one was classified as
substandard on accrual status ($1.4 million); and six were classified as substandard on non-accrual status ($1.9 million). As of June 30, 2019, $2.4 million, or 63 percent, of the restructured loans were current with respect to their payment
status. As of June 30, 2018, the net outstanding balance of the Corporation’s 11 restructured loans was $5.2 million: one loan was classified as special mention on accrual status ($389,000); one was classified as substandard on accrual status ($1.4
million); and nine loans were classified as substandard ($3.4 million, all on non-accrual status). As of June 30, 2018, $2.9 million, or 56 percent, of the restructured loans had a current payment status, consistent with their modified terms.
The Bank upgrades restructured single-family loans to the pass category if the borrower has demonstrated satisfactory contractual payments for at least six consecutive months or 12 months for those loans that were
restructured more than once and there is a reasonable assurance that the payments will continue. Once the borrower has demonstrated satisfactory contractual payments beyond 12 consecutive months, the loan is no longer categorized as a restructured
loan.
Other Loans of Concern. As of June 30, 2019, $8.6 million of loans which were not disclosed as non-performing loans were classified as special mention because known information
about possible credit problems of the borrowers causes management to have some doubt as to the ability of such borrowers to comply with present loan repayment terms. Of these loans, $3.8 million were single-family mortgage loans, $3.9 million were
multi-family mortgage loans and $927,000 was a commercial real estate loan. As of June 30, 2018, $7.5 million of loans which were not disclosed as non-performing loans were classified by the Bank as special mention for the same reasons. In
addition, as of June 30, 2019, total substandard loans were $7.6 million of which $6.2 million were classified as non-performing loans; while as of June 30, 2018, total substandard loans were $7.4 million of which $6.1 million were classified as
non-performing loans.
Foreclosed Real Estate. Real estate acquired by the Bank as a result of foreclosure or by deed-in-lieu of foreclosure is classified as REO until it is sold. When a property is
acquired, it is recorded at its fair market value less the estimated cost of sale. Subsequent declines in value are charged to operations. As of June 30, 2019, there was no REO property, compared to
15
$906,000 consisting of two single-family properties located in California at June 30, 2018. In managing the real estate owned properties for quick disposition, the Bank completes the necessary repairs and maintenance
to the individual properties before listing for sale, obtains new appraisals and broker price opinions (“BPO”) to determine current market listing prices, and engages local realtors who are most familiar with real estate sub-markets, among other
techniques, which generally results in the quick disposition of real estate owned.
Asset Classification. The OCC has adopted various regulations regarding the problem assets of savings institutions. The regulations require that each institution review and
classify its assets on a regular basis. In addition, in connection with examinations of institutions, OCC examiners have the authority to identify problem assets and, if appropriate, require them to be classified. There are three classifications
for problem assets: substandard, doubtful and loss. Substandard assets have one or more defined weaknesses and are characterized by the distinct possibility that the institution will sustain some loss if the deficiencies are not corrected. Doubtful
assets have the weaknesses of substandard assets with the additional characteristic that the weaknesses make collection or liquidation in full on the basis of currently existing facts, conditions and values questionable, and there is a high
possibility of loss. An asset classified as a loss is considered uncollectible and of such little value that continuance as an asset of the institution is not warranted. If an asset or portion thereof is classified as loss, the institution
establishes an individually evaluated allowance and may subsequently charge-off the amount of the asset classified as loss. A portion of the allowance for loan losses established to cover probable losses related to assets classified substandard or
doubtful may be included in determining an institution’s regulatory capital. Assets that do not currently expose the institution to sufficient risk to warrant classification in one of the aforementioned categories but possess weaknesses are
designated as special mention and are closely monitored by the Bank.
Classified assets increased 3% to $16.2 million at June 30, 2019 from $15.8 million at June 30, 2018. The aggregate amounts of the Bank’s classified assets are primarily located in California.
16
The following table summarizes classified assets, which is comprised of classified loans, including loans classified by the Bank as special mention, net of allowance for loan losses, and REO at the
dates indicated:
|
At June 30, 2019
|
At June 30, 2018
|
||||||||||
|
(Dollars In Thousands)
|
Balance
|
Count
|
Balance
|
Count
|
|||||||
|
Special mention loans:
|
|||||||||||
|
Mortgage loans:
|
|||||||||||
|
Single-family
|
$
|
3,795
|
13
|
$
|
2,584
|
8
|
|||||
|
Multi-family
|
3,864
|
3
|
3,947
|
3
|
|||||||
|
Commercial real estate
|
927
|
1
|
940
|
1
|
|||||||
|
Total special mention loans
|
8,586
|
17
|
7,471
|
12
|
|||||||
|
Substandard loans:
|
|||||||||||
|
Mortgage loans:
|
|||||||||||
|
Single-family
|
6,631
|
23
|
7,391
|
24
|
|||||||
|
Construction
|
971
|
1
|
—
|
—
|
|||||||
|
Commercial business loans
|
41
|
1
|
64
|
1
|
|||||||
|
Total substandard loans
|
7,643
|
25
|
7,455
|
25
|
|||||||
|
Total classified loans
|
16,229
|
42
|
14,926
|
37
|
|||||||
|
Real estate owned:
|
|||||||||||
|
Single-family
|
—
|
—
|
906
|
2
|
|||||||
|
Total real estate owned
|
—
|
—
|
906
|
2
|
|||||||
|
Total classified assets
|
$
|
16,229
|
42
|
$
|
15,832
|
39
|
|||||
|
Total classified assets as a percentage of total assets
|
1.50
|
%
|
1.35
|
%
|
|||||||
Not all of the Bank’s classified assets are delinquent or non-performing. In determining whether the Bank’s assets expose the Bank to sufficient risk to warrant classification, the Bank may consider various factors,
including the payment history of the borrower, the loan-to-value ratio, and the debt coverage ratio of the property securing the loan. After consideration of these factors, the Bank may determine that the asset in question, though not currently
delinquent, presents a risk of loss that requires it to be classified or designated as special mention. In addition, the Bank’s loans held for investment may include single-family, commercial and multi-family real estate loans with a balance
exceeding the current market value of the collateral which are not classified because they are performing and have borrowers who have sufficient resources to support the repayment of the loan.
Allowance for Loan Losses. The allowance for loan losses is maintained to cover losses inherent in the loans held for investment. In originating loans, the Bank recognizes that
losses will be experienced and that the risk of loss will vary with, among other factors, the type of loan being made, the creditworthiness of the borrower over the term of the loan, general economic conditions and, in the case of a secured loan, the
quality of the collateral securing the loan. The responsibility for the review of the Bank’s assets and the determination of the adequacy of the allowance lies with the Internal Asset Review Committee (“IAR Committee”). The Bank adjusts its
allowance for loan losses by charging (crediting) its provision (recovery) for loan losses against the Bank’s operations.
The Bank has established a methodology for the determination of the provision for loan losses. The methodology is set forth in a formal policy and takes into consideration the need for a collectively evaluated
allowance for groups of homogeneous loans
17
and an individually evaluated allowance that are tied to individual problem loans. The Bank’s methodology for assessing the appropriateness of the allowance consists of several key elements.
The allowance is calculated by applying loss factors to the loans held for investment. The loss factors are applied according to loan program type and loan classification. The loss factors for each program type and
loan classification are established based on an evaluation of the historical loss experience, prevailing market conditions, concentration in loan types and other relevant factors consistent with ASC 450, “Contingency”. Homogeneous loans, such as
residential mortgage, home equity and consumer installment loans are considered on a pooled loan basis. A factor is assigned to each pool based upon expected charge-offs for one year. The factors for larger, less homogeneous loans, such as
construction and commercial real estate loans, are based upon loss experience tracked over business cycles considered appropriate for the loan type.
Collectively evaluated or individually evaluated allowances are established to absorb losses on loans for which full collectibility may not be reasonably assured as prescribed in ASC 310. Estimates of identifiable
losses are reviewed continually and, generally, a provision (recovery) for losses is charged (credited) against operations on a quarterly basis as necessary to maintain the allowance at an appropriate level. Management presents the minutes
summarizing the actions of the IAR Committee to the Bank’s Board of Directors on a quarterly basis.
Non-performing loans are charged-off to their fair market values in the period the loans, or portion thereof, are deemed uncollectible, generally after the loan becomes 150 days delinquent for real estate secured first
trust deed loans and 120 days delinquent for commercial business or real estate secured second trust deed loans. For restructured loans, the charge-off occurs when the loan becomes 90 days delinquent; and where borrowers file bankruptcy, the
charge-off occurs when the loan becomes 60 days delinquent. The amount of the charge-off is determined by comparing the loan balance to the estimated fair value of the underlying collateral, less disposition costs, with the loan balance in excess of
the estimated fair value charged-off against the allowance for loan losses. The allowance for loan losses for non-performing loans is determined by applying Accounting Standards Codification (“ASC”) 310, “Receivables.” For restructured loans that
are less than 90 days delinquent, the allowance for loan losses are segregated into (a) individually evaluated allowances for those loans with applicable discounted cash flow calculations still in their restructuring period, classified lower than
pass, and containing an embedded loss component or (b) collectively evaluated allowances based on the aggregated pooling method. For non-performing loans less than 60 days delinquent where the borrower has filed bankruptcy, the collectively
evaluated allowances are assigned based on the aggregated pooling method. For non-performing commercial real estate loans, an individually evaluated allowance is calculated based on the loan's fair value and if the fair value is higher than the loan
balance, no allowance is required.
The IAR Committee meets quarterly to review and monitor conditions in the portfolio and to determine the appropriate allowance for loan losses. To the extent that any of these conditions are apparent by identifiable
problem loans or portfolio segments as of the evaluation date, the IAR Committee’s estimate of the effect of such conditions may be reflected as an individually evaluated allowance applicable to such loans or portfolio segments. Where any of these
conditions is not apparent by specifically identifiable problem loans or portfolio segments as of the evaluation date, the IAR Committee’s evaluation of the probable loss related to such condition is reflected in the general allowance. The intent of
the IAR Committee is to reduce the differences between estimated and actual losses. Pooled loan factors are adjusted to reflect current estimates of charge-offs for the subsequent 12 months. Loss activity is reviewed for non-pooled loans and the
loss factors are adjusted, if necessary. By assessing the probable estimated losses inherent in the loans held for investment on a quarterly basis, the Bank is able to adjust specific and inherent loss estimates based upon the most recent
information that has become available.
At June 30, 2019, the Bank had an allowance for loan losses of $7.1 million, or 0.80% of gross loans held for investment, compared to an allowance for loan losses at June 30, 2018 of $7.4 million, or 0.81% of gross
loans held for investment. A $475,000 recovery from the allowance for loan losses was recorded in fiscal 2019, compared to a $536,000 recovery from the allowance for loan losses in fiscal 2018. Although management believes the best information
available is used to make such (recovery) provision, future adjustments to the allowance for loan losses may be necessary and results of operations could be significantly and adversely affected if circumstances differ substantially from the
assumptions used in making the determinations.
18
While the Bank believes that it has established its existing allowance for loan losses in accordance with GAAP, there can be no assurance that regulators, in reviewing the Bank’s loan portfolio, will not recommend that
the Bank significantly increase its allowance for loan losses. In addition, because future events affecting borrowers and collateral cannot be predicted with certainty, there can be no assurance that the existing allowance for loan losses is
adequate or that substantial increases will not be necessary should the quality of any loans deteriorate as a result of the factors discussed above. Any material increase in the allowance for loan losses may adversely affect the Bank’s financial
condition and results of operations.
The following table sets forth an analysis of the Bank’s allowance for loan losses for the periods indicated. Where individually evaluated allowances have been established, any differences between the individually
evaluated allowances and the amount of loss realized has been charged or credited to current operations.
|
Year Ended June 30,
|
|||||||||||||||
|
(Dollars In Thousands)
|
2019
|
2018
|
2017
|
2016
|
2015
|
||||||||||
|
Allowance at beginning of period
|
$
|
7,385
|
$
|
8,039
|
$
|
8,670
|
$
|
8,724
|
$
|
9,744
|
|||||
|
Recovery from the allowance for loan losses
|
(475
|
)
|
(536
|
)
|
(1,042
|
)
|
(1,715
|
)
|
(1,387
|
)
|
|||||
|
Recoveries:
|
|||||||||||||||
|
Mortgage Loans:
|
|||||||||||||||
|
Single-family
|
198
|
278
|
507
|
539
|
635
|
||||||||||
|
Multi-family
|
—
|
—
|
18
|
1,228
|
360
|
||||||||||
|
Commercial real estate
|
—
|
—
|
—
|
216
|
—
|
||||||||||
|
Commercial business loans
|
—
|
—
|
75
|
85
|
—
|
||||||||||
|
Consumer loans
|
2
|
—
|
13
|
1
|
1
|
||||||||||
|
Total recoveries
|
200
|
278
|
613
|
2,069
|
996
|
||||||||||
|
Charge-offs:
|
|||||||||||||||
|
Mortgage loans:
|
|||||||||||||||
|
Single-family
|
(31
|
)
|
(392
|
)
|
(199
|
)
|
(406
|
)
|
(552
|
)
|
|||||
|
Multi-family
|
—
|
—
|
—
|
—
|
(4
|
)
|
|||||||||
|
Commercial real estate
|
—
|
—
|
—
|
—
|
(73
|
)
|
|||||||||
|
Consumer loans
|
(3
|
)
|
(4
|
)
|
(3
|
)
|
(2
|
)
|
—
|
||||||
|
Total charge-offs
|
(34
|
)
|
(396
|
)
|
(202
|
)
|
(408
|
)
|
(629
|
)
|
|||||
|
Net (charge-offs) recoveries
|
166
|
(118
|
)
|
411
|
1,661
|
367
|
|||||||||
|
Allowance at end of period
|
$
|
7,076
|
$
|
7,385
|
$
|
8,039
|
$
|
8,670
|
$
|
8,724
|
|||||
|
Allowance for loan losses as a percentage of
gross loans held for investment
|
0.80
|
%
|
0.81
|
%
|
0.88
|
%
|
1.02
|
%
|
1.06
|
%
|
|||||
|
Net charge-offs (recoveries) as a percentage
of average loans receivable, net, during the
period
|
(0.02
|
)%
|
0.01
|
%
|
(0.04
|
)%
|
(0.17
|
)%
|
(0.04
|
)%
|
|||||
19
The following table sets forth the breakdown of the allowance for loan losses by loan category at the periods indicated. Management believes that the allowance can be allocated by category only on
an approximate basis. The allocation of the allowance is based upon an asset classification matrix. The allocation of the allowance to each category is not necessarily indicative of future losses and does not restrict the use of the allowance in one
category to absorb losses in any other categories.
|
At June 30,
|
|||||||||||||||||||||||||||||
|
2019
|
2018
|
2017
|
2016
|
2015
|
|||||||||||||||||||||||||
|
(Dollars In Thousands)
|
Amount
|
% of
Loans in
Each
Category
to Total
Loans
|
Amount
|
% of
Loans in
Each
Category
to Total
Loans
|
Amount
|
% of
Loans in
Each
Category
to Total
Loans
|
Amount
|
% of
Loans in
Each
Category
to Total
Loans
|
Amount
|
% of
Loans in
Each
Category
to Total
Loans
|
|||||||||||||||||||
|
Mortgage loans:
|
|||||||||||||||||||||||||||||
|
Single-family
|
$
|
2,709
|
36.87
|
%
|
$
|
2,783
|
34.80
|
%
|
$
|
3,601
|
35.51
|
%
|
$
|
4,933
|
38.44
|
%
|
$
|
5,280
|
44.65
|
%
|
|||||||||
|
Multi-family
|
3,219
|
49.81
|
3,492
|
52.63
|
3,420
|
52.89
|
2,800
|
49.23
|
2,616
|
42.34
|
|||||||||||||||||||
|
Commercial real estate
|
1,050
|
12.70
|
1,030
|
12.13
|
879
|
10.75
|
848
|
11.79
|
734
|
12.31
|
|||||||||||||||||||
|
Construction
|
61
|
0.53
|
47
|
0.35
|
96
|
0.77
|
31
|
0.40
|
42
|
0.59
|
|||||||||||||||||||
|
Other
|
3
|
0.02
|
3
|
0.02
|
—
|
—
|
7
|
0.04
|
—
|
—
|
|||||||||||||||||||
|
Commercial business loans
|
26
|
0.05
|
24
|
0.06
|
36
|
0.07
|
43
|
0.08
|
43
|
0.08
|
|||||||||||||||||||
|
Consumer loans
|
8
|
0.02
|
6
|
0.01
|
7
|
0.01
|
8
|
0.02
|
9
|
0.03
|
|||||||||||||||||||
|
Total allowance for
loan losses
|
$
|
7,076
|
100.00
|
%
|
$
|
7,385
|
100.00
|
%
|
$
|
8,039
|
100.00
|
%
|
$
|
8,670
|
100.00
|
%
|
$
|
8,724
|
100.00
|
%
|
|||||||||
Investment Securities Activities
Federally chartered savings institutions are permitted under federal and state laws to invest in various types of liquid assets, including U.S. Treasury obligations, securities of various federal agencies and
government sponsored enterprises and of state and municipal governments, deposits at the FHLB, certificates of deposit of federally insured institutions, certain bankers’ acceptances, mortgage-backed securities and federal funds. Subject to various
restrictions, federally chartered savings institutions may also invest a portion of their assets in commercial paper and corporate debt securities. Savings institutions such as the Bank are also required to maintain an investment in FHLB – San
Francisco stock.
The investment policy of the Bank, established by the Board of Directors and implemented by the Bank’s Asset-Liability Committee, seeks to provide and maintain adequate liquidity, complement the Bank’s lending
activities, and generate a favorable return on investment without incurring undue interest rate risk or credit risk. Investments are made based on certain considerations, such as credit quality, yield, maturity, liquidity and marketability. The Bank
also considers the effect that the proposed investment would have on the Bank’s risk-based capital requirements and interest rate risk sensitivity.
At June 30, 2019 and 2018, the Bank’s investment securities portfolio was $100.1 million and $95.3 million, respectively, which primarily consisted of federal agency and government sponsored enterprise
obligations. The Bank’s investment securities portfolio was classified as held to maturity and available for sale. The Corporation purchased held to maturity mortgage-backed securities totaling $39.7 million and $53.9 million during fiscal 2019 and
2018, respectively.
20
The following table sets forth the composition of the Bank’s investment portfolio at the dates indicated:
|
At June 30,
|
||||||||||||||||||||||||||
|
2019
|
2018
|
2017
|
||||||||||||||||||||||||
|
(Dollars In Thousands)
|
Amortized
Cost
|
Estimated
Fair
Value
|
Percent
|
Amortized
Cost
|
Estimated
Fair
Value
|
Percent
|
Amortized
Cost
|
Estimated
Fair
Value
|
Percent
|
|||||||||||||||||
|
Held to maturity securities:
|
||||||||||||||||||||||||||
|
U.S. government sponsored
enterprise MBS (1)
|
$
|
90,394
|
$
|
91,669
|
90.47
|
%
|
$
|
84,227
|
$
|
83,668
|
88.32
|
%
|
$
|
59,841
|
$
|
60,029
|
85.82
|
%
|
||||||||
|
U.S. SBA securities(2)
|
2,896
|
2,890
|
2.85
|
2,986
|
2,971
|
3.14
|
—
|
—
|
—
|
|||||||||||||||||
|
Certificates of deposits
|
800
|
800
|
0.79
|
600
|
600
|
0.63
|
600
|
600
|
0.86
|
|||||||||||||||||
|
Total investment securities -
held to maturity
|
$
|
94,090
|
$
|
95,359
|
94.11
|
%
|
$
|
87,813
|
$
|
87,239
|
92.09
|
%
|
$
|
60,441
|
$
|
60,629
|
86.68
|
%
|
||||||||
|
Available for sale securities:
|
||||||||||||||||||||||||||
|
U.S. government agency MBS(1)
|
$
|
3,498
|
$
|
3,613
|
3.57
|
%
|
$
|
4,234
|
$
|
4,384
|
4.63
|
%
|
$
|
5,197
|
$
|
5,383
|
7.69
|
%
|
||||||||
|
U.S. government sponsored
enterprise MBS(1)
|
1,998
|
2,087
|
2.06
|
2,640
|
2,762
|
2.91
|
3,301
|
3,474
|
4.97
|
|||||||||||||||||
|
Private issue CMO(3)
|
261
|
269
|
0.26
|
346
|
350
|
0.37
|
456
|
461
|
0.66
|
|||||||||||||||||
|
Total investment securities -
available for sale
|
$
|
5,757
|
$
|
5,969
|
5.89
|
%
|
$
|
7,220
|
$
|
7,496
|
7.91
|
%
|
$
|
8,954
|
$
|
9,318
|
13.32
|
%
|
||||||||
|
Total investment securities
|
$
|
99,847
|
$
|
101,328
|
100.00
|
%
|
$
|
95,033
|
$
|
94,735
|
100.00
|
%
|
$
|
69,395
|
$
|
69,947
|
100.00
|
%
|
||||||||
|
(1)
|
Mortgage-backed securities (“MBS”)
|
|
(2)
|
Small Business Administration ("SBA")
|
|
(3)
|
Collateralized mortgage obligations (“CMO”)
|
The following table sets forth the outstanding balance, maturity and weighted average yield of the investment securities at June 30, 2019:
|
Due in
One Year
or Less
|
Due
After One to
Five Years
|
Due
After Five to
Ten Years
|
Due
After
Ten Years
|
Total
|
||||||||||||||||||||||
|
(Dollars in Thousands)
|
Amount
|
Yield
|
Amount
|
Yield
|
Amount
|
Yield
|
Amount
|
Yield
|
Amount
|
Yield
|
||||||||||||||||
|
Held to maturity securities:
|
||||||||||||||||||||||||||
|
U.S. government sponsored
enterprise MBS
|
$
|
—
|
—
|
%
|
$
|
32,184
|
2.15
|
%
|
$
|
35,306
|
2.97
|
%
|
$
|
22,904
|
3.62
|
%
|
$
|
90,394
|
2.84
|
%
|
||||||
|
U.S. SBA securities
|
—
|
—
|
—
|
—
|
—
|
—
|
2,896
|
2.85
|
2,896
|
2.85
|
||||||||||||||||
|
Certificates of deposits
|
400
|
2.51
|
400
|
2.74
|
—
|
—
|
—
|
—
|
800
|
2.63
|
||||||||||||||||
|
Total investment securities
held to maturity
|
$
|
400
|
2.51
|
%
|
$
|
32,584
|
2.16
|
%
|
$
|
35,306
|
2.97
|
%
|
$
|
25,800
|
3.53
|
%
|
$
|
94,090
|
2.84
|
%
|
||||||
|
Available for sale securities:
|
||||||||||||||||||||||||||
|
U.S. government agency MBS
|
$
|
—
|
—
|
%
|
$
|
—
|
—
|
%
|
$
|
—
|
—
|
%
|
$
|
3,613
|
3.86
|
%
|
$
|
3,613
|
3.86
|
%
|
||||||
|
U.S. government sponsored
enterprise MBS
|
—
|
—
|
—
|
—
|
—
|
—
|
2,087
|
4.75
|
2,087
|
4.75
|
||||||||||||||||
|
Private issue CMO
|
—
|
—
|
—
|
—
|
—
|
—
|
269
|
4.66
|
269
|
4.66
|
||||||||||||||||
|
Total investment securities
available for sale
|
$
|
—
|
—
|
%
|
$
|
—
|
—
|
%
|
$
|
—
|
—
|
%
|
$
|
5,969
|
4.21
|
%
|
$
|
5,969
|
4.21
|
%
|
||||||
|
Total investment securities
|
$
|
400
|
2.51
|
%
|
$
|
32,584
|
2.16
|
%
|
$
|
35,306
|
2.97
|
%
|
$
|
31,769
|
3.66
|
%
|
$
|
100,059
|
2.92
|
%
|
||||||
The actual maturity and yield for MBS and CMO may differ from the stated maturity and stated yield due to scheduled amortization, loan prepayments and acceleration of premium amortization or discount accretion.
21
Deposit Activities and Other Sources of Funds
General. Deposits, loan repayments and the proceeds from loan sales are the major sources of the Bank’s funds for lending and other investment purposes. Scheduled loan
repayments are a relatively stable source of funds, while deposit inflows and outflows are influenced significantly by general interest rates and money market conditions. Loan sales are also influenced significantly by general interest rates.
Borrowings through the FHLB – San Francisco and repurchase agreements may be used to compensate for declines in the availability of funds from other sources.
Deposit Accounts. Substantially all of the Bank’s depositors are residents of the State of California. Deposits are attracted from within the Bank’s market area by offering a
broad selection of deposit instruments, including checking, savings, money market and time deposits. Deposit account terms vary, differentiated by the minimum balance required, the time periods that the funds must remain on deposit and the interest
rate, among other factors. In determining the terms of its deposit accounts, the Bank considers current interest rates, profitability to the Bank, interest rate risk characteristics, competition and its customers’ preferences and
concerns. Generally, the Bank’s deposit rates are commensurate with the median rates of its competitors within a given market. The Bank may occasionally pay above-market interest rates to attract or retain deposits when less expensive sources of
funds are not available. The Bank may also pay above-market interest rates in specific markets in order to increase the deposit base of a particular office or group of offices. The Bank reviews its deposit composition and pricing on a weekly basis.
The Bank generally offers time deposits for terms not exceeding seven years. As illustrated in the following table, time deposits represented 23% of the Bank’s deposit portfolio at June 30, 2019, compared to 26% at
June 30, 2018. As of June 30, 2019, there were no brokered deposits. At June 30, 2018, total brokered deposits were $1.6 million with a weighted average interest rate of 3.88% and remaining maturities within one year. The Bank attempts to reduce
the overall cost of its deposit portfolio and to increase its franchise value by emphasizing transaction accounts, which are subject to a heightened degree of competition. For additional information, see Item 7, “Management’s Discussion and Analysis
of Financial Condition and Results of Operations” in this Form 10-K.
22
The following table sets forth information concerning the Bank’s weighted-average interest rate of deposits at June 30, 2019:
|
Weighted
Average Interest Rate
|
Original Term
|
Deposit Account Type
|
Minimum
Amount
|
Balance
(In Thousands)
|
Percentage
of Total Deposits
|
|||||
|
Transaction accounts:
|
||||||||||
|
—%
|
N/A
|
Checking accounts – non interest-bearing
|
$
|
—
|
$
|
90,184
|
10.72
|
%
|
||
|
0.12%
|
N/A
|
Checking accounts – interest-bearing
|
$
|
—
|
257,909
|
30.66
|
||||
|
0.20%
|
N/A
|
Savings accounts
|
$
|
10
|
264,387
|
31.43
|
||||
|
0.28%
|
N/A
|
Money market accounts
|
$
|
—
|
35,646
|
4.24
|
||||
|
Time deposits:
|
||||||||||
|
0.05%
|
30 days or less
|
Fixed-term, fixed rate
|
$
|
1,000
|
20
|
—
|
||||
|
0.13%
|
31 to 90 days
|
Fixed-term, fixed rate
|
$
|
1,000
|
4,104
|
0.49
|
||||
|
1.67%
|
91 to 180 days
|
Fixed-term, fixed rate
|
$
|
1,000
|
15,432
|
1.83
|
||||
|
0.21%
|
181 to 365 days
|
Fixed-term, fixed rate
|
$
|
1,000
|
25,293
|
3.01
|
||||
|
0.54%
|
Over 1 to 2 years
|
Fixed-term, fixed rate
|
$
|
1,000
|
27,657
|
3.29
|
||||
|
0.98%
|
Over 2 to 3 years
|
Fixed-term, fixed rate
|
$
|
1,000
|
28,383
|
3.37
|
||||
|
1.49%
|
Over 3 to 5 years
|
Fixed-term, fixed rate
|
$
|
1,000
|
79,601
|
9.46
|
||||
|
1.85%
|
Over 5 to 10 years
|
Fixed-term, fixed rate
|
$
|
1,000
|
12,655
|
1.50
|
||||
|
0.37%
|
$
|
841,271
|
100.00
|
%
|
||||||
The following table indicates the aggregate dollar amount of the Bank’s time deposits with balances of $100,000 or more differentiated by time remaining until maturity as of June 30, 2019:
|
Maturity Period
|
Amount
|
||
|
(In Thousands)
|
|||
|
Three months or less
|
$
|
19,219
|
|
|
Over three to six months
|
20,791
|
||
|
Over six to twelve months
|
17,978
|
||
|
Over twelve months
|
40,957
|
||
|
Total
|
$
|
98,945
|
|
23
Deposit Flows. The following table sets forth the balances (inclusive of interest credited) and changes in the dollar amount of deposits in the various types
of accounts offered by the Bank at and between the dates indicated:
|
At June 30,
|
||||||||||||||||||||||
|
2019
|
2018
|
|||||||||||||||||||||
|
(Dollars In Thousands)
|
Amount
|
Percent
of
Total
|
Increase
(Decrease)
|
Amount
|
Percent
of
Total
|
Increase
(Decrease)
|
||||||||||||||||
|
Checking accounts – non interest-bearing
|
$
|
90,184
|
10.72
|
%
|
$
|
4,010
|
$
|
86,174
|
9.49
|
%
|
$
|
8,257
|
||||||||||
|
Checking accounts – interest-bearing
|
257,909
|
30.66
|
(1,463
|
)
|
259,372
|
28.58
|
(65
|
)
|
||||||||||||||
|
Savings accounts
|
264,387
|
31.43
|
(25,404
|
)
|
289,791
|
31.93
|
3,824
|
|||||||||||||||
|
Money market accounts
|
35,646
|
4.24
|
1,013
|
34,633
|
3.82
|
(690
|
)
|
|||||||||||||||
|
Time deposits:
|
||||||||||||||||||||||
|
Fixed-term, fixed rate which mature:
|
||||||||||||||||||||||
|
Within one year
|
106,080
|
12.61
|
(10,253
|
)
|
116,333
|
12.82
|
2,387
|
|||||||||||||||
|
Over one to two years
|
37,117
|
4.41
|
(28,083
|
)
|
65,200
|
7.18
|
451
|
|||||||||||||||
|
Over two to five years
|
49,253
|
5.85
|
(5,027
|
)
|
54,280
|
5.98
|
(24,535
|
)
|
||||||||||||||
|
Over five years
|
695
|
0.08
|
(1,120
|
)
|
1,815
|
0.20
|
(8,552
|
)
|
||||||||||||||
|
Total
|
$
|
841,271
|
100.00
|
%
|
$
|
(66,327
|
)
|
$
|
907,598
|
100.00
|
%
|
$
|
(18,923
|
)
|
||||||||
Time Deposits by Rates. The following table sets forth the aggregate balance of time deposits categorized by interest rates at the dates indicated:
|
At June 30,
|
|||||||||
|
(Dollars In Thousands)
|
2019
|
2018
|
2017
|
||||||
|
Below 1.00%
|
$
|
80,701
|
$
|
114,975
|
$
|
143,133
|
|||
|
1.00 to 1.99%
|
95,904
|
113,211
|
115,555
|
||||||
|
2.00 to 2.99%
|
16,540
|
7,875
|
7,622
|
||||||
|
3.00 to 3.99%
|
—
|
1,567
|
1,567
|
||||||
|
Total
|
$
|
193,145
|
$
|
237,628
|
$
|
267,877
|
|||
Time Deposits by Maturities. The following table sets forth the aggregate dollar amount of time deposits at June 30, 2019 differentiated by interest rates
and maturity:
|
(Dollars In Thousands)
|
One Year
or Less
|
Over One
to
Two Years
|
Over Two
to
Three Years
|
Over Three
to
Four Years
|
After
Four
Years
|
Total
|
||||||||||||
|
Below 1.00%
|
$
|
62,477
|
$
|
15,306
|
$
|
2,791
|
$
|
125
|
$
|
2
|
$
|
80,701
|
||||||
|
1.00 to 1.99%
|
32,270
|
21,811
|
23,543
|
9,803
|
8,477
|
95,904
|
||||||||||||
|
2.00 to 2.99%
|
11,333
|
—
|
—
|
5,207
|
—
|
16,540
|
||||||||||||
|
Total
|
$
|
106,080
|
$
|
37,117
|
$
|
26,334
|
$
|
15,135
|
$
|
8,479
|
$
|
193,145
|
||||||
24
Deposit Activity. The following table sets forth the deposit activity of the Bank at and for the periods indicated:
|
At or For the Year Ended June 30,
|
|||||||||
|
(In Thousands)
|
2019
|
2018
|
2017
|
||||||
|
Beginning balance
|
$
|
907,598
|
$
|
926,521
|
$
|
926,384
|
|||
|
Net withdrawals before interest credited
|
(69,708
|
)
|
(22,418
|
)
|
(3,671
|
)
|
|||
|
Interest credited
|
3,381
|
3,495
|
3,808
|
||||||
|
Net (decrease) increase in deposits
|
(66,327
|
)
|
(18,923
|
)
|
137
|
||||
|
Ending balance
|
$
|
841,271
|
$
|
907,598
|
$
|
926,521
|
|||
Borrowings. The FHLB – San Francisco functions as a central reserve bank providing credit for member financial institutions. As a member, the Bank is required to own capital
stock in the FHLB – San Francisco and is authorized to apply for advances using such stock and certain of its mortgage loans and other assets (principally investment securities) as collateral, provided certain creditworthiness standards have been
met. Advances are made pursuant to several different credit programs. Each credit program has its own interest rate, maturity, terms and conditions. Depending on the program, limitations on the amount of advances are based on the financial
condition of the member institution and the adequacy of collateral pledged to secure the credit. The Bank utilizes advances from the FHLB – San Francisco as an alternative to deposits to supplement its supply of lendable funds, to meet deposit
withdrawal requirements and to help manage interest rate risk. The FHLB – San Francisco has, from time to time, served as the Bank’s primary borrowing source. As of June 30, 2019 and 2018, the FHLB – San Francisco borrowing capacity was limited to
35% of the Bank’s total assets at both dates, amounting to $391.8 million and $411.8 million, respectively. Advances from the FHLB – San Francisco are typically secured by the Bank’s single-family residential, multi-family and commercial real estate
mortgage loans. Total mortgage loans pledged to the FHLB – San Francisco were $643.0 million at June 30, 2019 as compared to $746.7 million at June 30, 2018. In addition, the Bank pledged investment securities totaling $3.2 million at June 30, 2019
as compared to $3.3 million at June 30, 2018 to collateralize its FHLB – San Francisco advances under the Securities-Backed Credit (“SBC”) facility. At June 30, 2019 and 2018, the Bank had $101.1 million and $126.2 million of borrowings,
respectively, from the FHLB – San Francisco with a weighted-average interest rate of 2.62% and 2.47%, respectively. At June 30, 2019, the outstanding borrowings mature between 2020 and 2025 with a weighted average maturity of 44 months. In addition
to the total borrowings mentioned above, the Bank utilized its borrowing facility for letters of credit and MPF credit enhancement. The outstanding letters of credit at June 30, 2019 and 2018 was $13.0 million and $8.0 million, respectively; and the
outstanding MPF credit enhancement was $2.5 million at both dates. For additional information, see Note 8 to the Corporation’s audited financial statements included in Item 8 of this Form 10-K. As of June 30, 2019 and 2018, the remaining financing
availability was $275.2 million and $275.1 million, respectively, with remaining available collateral of $434.7 million and $500.3 million, respectively. In addition, as of June 30, 2019 and 2018, the Bank had secured a discount window facility of
$74.2 million and $73.2 million, respectively, at the Federal Reserve Bank of San Francisco, collateralized by investment securities with a fair market value of $79.0 million and $77.9 million, respectively. The Bank also has a federal funds
facility with its correspondent bank for $17.0 million which matures on June 30, 2020. As of June 30, 2019, there were no outstanding borrowings under the discount window facility or the federal funds facility with the correspondent bank.
25
The following table sets forth certain information regarding borrowings by the Bank at the dates and for the years indicated:
|
At or For the Year Ended June 30,
|
||||||||||||||
|
(Dollars In Thousands)
|
2019
|
2018
|
2017
|
|||||||||||
|
Balance outstanding at the end of period:
|
||||||||||||||
|
FHLB – San Francisco advances
|
$
|
101,107
|
$
|
126,163
|
$
|
126,226
|
||||||||
|
Weighted average rate at the end of period:
|
||||||||||||||
|
FHLB – San Francisco advances
|
2.62
|
%
|
2.47
|
%
|
2.39
|
%
|
||||||||
|
Maximum amount of borrowings outstanding at any month end:
|
||||||||||||||
|
FHLB – San Francisco advances
|
$
|
136,158
|
$
|
126,163
|
$
|
181,287
|
||||||||
|
Average short-term borrowings during the period
with respect to:(1)
|
||||||||||||||
|
FHLB – San Francisco advances
|
$
|
8,425
|
$
|
8,687
|
$
|
14,022
|
||||||||
|
Weighted average short-term borrowing rate during the period
with respect to:(1)
|
||||||||||||||
|
FHLB – San Francisco advances
|
1.69
|
%
|
2.53
|
%
|
0.45
|
%
|
||||||||
(1) Borrowings with a remaining term of 12 months or less.
As a member of the FHLB – San Francisco, the Bank is required to maintain a minimum investment in FHLB – San Francisco stock. The Bank held the required investment at both June 30, 2019 and 2018 of $8.2 million with
an excess investment of $470,000 and $0, respectively. During fiscal 2019, the Bank did not purchase any additional FHLB – San Francisco stock, as compared to fiscal 2018 when the Bank purchased $91,000 of FHLB - San Francisco stock to comply with
the investment requirements. The Bank received cash dividends on the FHLB – San Francisco stock in fiscal 2019 and 2018 of $707,000 and $568,000, respectively. The cash dividends received on the FHLB - San Francisco stock in fiscal 2019 included a
special cash dividend of $133,000.
Subsidiary Activities
Federal savings institutions generally may invest up to 3% of their assets in service corporations, provided that at least one-half of any amount in excess of 1% is used primarily for community, inner-city and
community development projects. The Bank’s investment in its service corporations did not exceed these limits at June 30, 2019 and 2018.
The Bank has three wholly owned subsidiaries: Provident Financial Corp (“PFC”), Profed Mortgage, Inc., and First Service Corporation. PFC’s current activities include: (i) acting as trustee for the Bank’s real estate
transactions and (ii) holding real estate for investment, if any. Profed Mortgage, Inc., which formerly conducted the Bank’s mortgage banking activities, and First Service Corporation are currently inactive. At June 30, 2019 and 2018, the Bank’s
investment in its subsidiaries was $15,000 and $28,000, respectively.
26
REGULATION
The following is a brief description of certain laws and regulations which are applicable to the Corporation and the Bank. The description of these laws and regulations, as well as descriptions of laws and regulations
contained elsewhere herein, does not purport to be complete and is qualified in its entirety by reference to the applicable laws and regulations.
Legislation is introduced from time to time in the United States Congress that may affect the Corporation’s and the Bank’s operations. In addition, the regulations governing the Corporation and the Bank may be amended
from time to time by the OCC, FDIC, Federal Reserve Board, the SEC and the Consumer Financial Protection Bureau ("CFPB"), as appropriate. Any such legislation or regulatory changes could adversely affect the operations and financial condition of the
Corporation and the Bank and no prediction can be made as to whether any such changes may occur.
The Dodd-Frank Act has significantly changed the bank regulatory structure and is affecting the lending, investment, trading and operating activities of depository institutions and their holding companies. The
Dodd-Frank Act eliminated the Office of Thrift Supervision, the Bank’s former federal banking regulator, and responsibility for the supervision and regulation of federal savings associations such as the Bank was transferred to the OCC July 21, 2011.
The OCC is the agency that is primarily responsible for the regulation and supervision of national banks. Among other changes, the Dodd-Frank Act established the CFPB as an independent bureau of the Federal Reserve Board. The CFPB assumed
responsibility for the implementation of the federal financial consumer protection and fair lending laws and regulations and has authority to impose new requirements. The Bank is subject to consumer protection regulations issued by the CFPB with
respect to its compliance with consumer financial protection laws and CFPB regulations.
Many aspects of the Dodd-Frank Act are subject to delayed effective dates and/or rulemaking by the federal banking agencies. Their impact on operations cannot yet be fully assessed. However, it has been the general
view that the Dodd-Frank Act will increase the regulatory burden, compliance costs and interest expense for the Corporation, the Bank and the financial services industry more generally.
2018 Regulatory Reform
In May 2018, the Economic Growth, Regulatory Relief and Consumer Protection Act (the “Act”), was enacted to modify or remove certain financial reform rules and regulations, including some of those implemented under the
Dodd-Frank Act. While the Act maintains most of the regulatory structure established by the Dodd-Frank Act, it amends certain aspects of the regulatory framework for small depository institutions with assets of less than $10 billion and for large
banks with assets of more than $50 billion. Many of these changes could result in meaningful regulatory changes for community banks such as the Bank, and their holding companies.
The Act, among other matters, expands the definition of qualified mortgages which may be held by a financial institution and directs the federal banking agencies to simplify the regulatory capital rules for financial
institutions and their holding companies with total consolidated assets of less than $10 billion by instructing the federal banking regulators to establish a single “Community Bank Leverage Ratio” of between 8 and 10 percent. Under proposed
regulations not yet adopted in final form, the federal banking regulators established 9% as the ratio so that any qualifying depository institution or its holding company that exceeds the “community bank leverage ratio” will be considered to have met
generally applicable leverage and risk-based regulatory capital requirements and any qualifying depository institution that exceeds the new ratio will be considered to be “well capitalized” under the prompt corrective action rules. The Act also
expands the category of holding companies that may rely on the “Small Bank Holding Company and Savings and Loan Holding Company Policy Statement” by raising the maximum amount of assets a qualifying holding company may have from $1 billion to $3
billion. A major effect of this change is to exclude such holding companies from the minimum capital requirements of the Dodd-Frank Act. In addition, the Act includes regulatory relief for community banks regarding regulatory examination cycles,
call reports, the Volcker Rule (proprietary trading prohibitions), mortgage disclosures and risk weights for certain high-risk commercial real estate loans.
27
It is difficult at this time to predict when or how any new standards under the Act will ultimately be applied to the Bank or what specific impact the Act and the yet-to-be-written implementing rules and regulations
will have on community banks.
General
The Bank, as a federally chartered savings institution, is subject to extensive regulation, examination and supervision by the OCC, as its primary federal regulator, and the FDIC, as its insurer of deposits. The
Bank's relationship with its depositors and borrowers is regulated by federal consumer protection laws, and the CFPB issues regulations under those laws, which must be complied with by the Bank. The Bank is a member of the FHLB and its deposits are
insured up to applicable limits by the FDIC. The Bank must file reports with the OCC concerning its activities and financial condition in addition to obtaining regulatory approvals prior to entering into certain transactions such as mergers with, or
acquisitions of, other financial institutions. There are periodic examinations by the OCC to evaluate the Bank’s safety and soundness and compliance with various regulatory requirements. Under certain circumstances, the FDIC may also examine the
Bank. This regulatory structure establishes a comprehensive framework of activities in which the Bank may engage and is intended primarily for the protection of the insurance fund and depositors. The regulatory structure also gives the regulatory
authorities extensive discretion in connection with their supervisory and enforcement activities and examination policies, including policies with respect to the classification of assets and the establishment of adequate loan loss allowances for
regulatory purposes. Any change in such policies, whether by the OCC, the FDIC or Congress, could have a material adverse impact on the Corporation and the Bank and their operations. The Corporation, as a savings and loan holding company, is
required to file certain reports with, is subject to examination by, and otherwise must comply with the rules and regulations of the Federal Reserve Board, its primary regulator. The Corporation is also subject to the rules and regulations of the
SEC under the federal securities laws. For additional information, see “Savings and Loan Holding Company Regulations” below in this Form 10-K.
Federal Regulation of Savings Institutions
Office of the Comptroller of the Currency. The OCC has extensive authority over the operations of federally chartered savings institutions. As part of this authority, the Bank
is required to file periodic reports with the OCC and is subject to periodic examinations by the OCC. The OCC also has extensive enforcement authority over all federally chartered savings institutions, including the Bank. This enforcement authority
includes, among other things, the ability to assess civil money penalties, issue cease-and-desist orders and initiate injunctive actions. In general, these enforcement actions may be initiated for violations of laws and regulations and unsafe or
unsound practices. Other actions or inactions may provide the basis for enforcement action, including misleading or untimely reports filed with the OCC. Except under certain circumstances, public disclosure of final enforcement actions by the OCC
is required by law.
All savings institutions must pay assessments to the OCC, to fund the agency’s operations. The general assessments, paid on a semi-annual basis, are determined based on the savings institution’s total assets,
including consolidated subsidiaries. The Bank’s OCC annual assessments for the fiscal years ended June 30, 2019 and 2018 were $262,000 and $281,000, respectively.
Federal law provides that federally chartered savings institutions are subject to the national bank limit on loans to one borrower. A federally chartered savings institution generally may not make a loan or extend
credit to a single or related group of borrowers in excess of 15% of its unimpaired capital and surplus. An additional amount may be lent, equal to 10% of unimpaired capital and surplus, if secured by specified readily marketable collateral. The
Bank’s limits on loans to one borrower or group of related borrowers at June 30, 2019 and 2018 were $18.3 million and $18.6 million, respectively. At June 30, 2019, the Bank’s largest lending relationship to a single borrower or group of borrowers
was a commercial real estate loan totaling $5.8 million, which was performing according to its original payment terms.
The OCC and the other federal banking agencies have adopted guidelines establishing safety and soundness standards on such matters as loan underwriting and documentation, asset quality, earnings, internal controls and
audit systems, interest rate risk
28
exposure and compensation and other employee benefits. Any institution that fails to comply with these standards must submit a compliance plan.
The OCC’s oversight of the Bank includes reviewing its compliance with the customer privacy requirements imposed by the Gramm-Leach-Bliley Act of 1999 (“GLBA”) and the anti-money laundering provisions of the USA
Patriot Act of 2001 and regulations thereunder. The GLBA privacy requirements place limitations on the sharing of consumer financial information with unaffiliated third parties. They also require each financial institution offering financial products
or services to retail customers to provide such customers with its privacy policy and with the opportunity to “opt out” of the sharing of their personal information with unaffiliated third parties. The USA Patriot Act significantly expands the
responsibilities of financial institutions in preventing the use of the United States financial system to fund terrorist activities. Its anti-money laundering provisions require financial institutions operating in the United States to develop
anti-money laundering compliance programs and due diligence policies and controls to ensure the detection and reporting of money laundering. These compliance programs are intended to supplement existing compliance requirements under the Bank Secrecy
Act and the Office of Foreign Assets Control Regulations.
Federal Home Loan Bank System. The Bank is a member of the FHLB – San Francisco, which is one of 11 regional FHLBs, each of which serves as a reserve or central bank for its
members within its assigned region. The FHLB - San Francisco is funded primarily from proceeds derived from the sale of consolidated obligations of the FHLB System. It makes loans or advances to members in accordance with policies and procedures,
established by the Board of Directors of the FHLB, which are subject to the oversight of the Federal Housing Finance Agency. All advances from the FHLB are required to be fully secured by sufficient collateral as determined by the FHLB - San
Francisco. In addition, all long-term advances are required to provide funds for residential home financing. At June 30, 2019 and 2018, the Bank had $101.1 million and $126.2 million of outstanding advances, respectively, from the FHLB – San
Francisco with a remaining available credit facility of $275.2 million and $275.1 million, respectively, based on 35% of total assets for both dates, which is limited to available collateral. For additional information, see “Business – Deposit
Activities and Other Sources of Funds – Borrowings” above in this Form 10-K.
As a member of the FHLB - San Francisco, the Bank is required to purchase and maintain stock in the FHLB – San Francisco. At both June 30, 2019 and 2018, the Bank held $8.2 million of FHLB-San Francisco stock which
was in compliance with this membership requirement. During fiscal 2019 and 2018, there was no excess capital redemption. In fiscal 2019 and 2018, the FHLB – San Francisco distributed $707,000 and $568,000 of cash dividends, respectively, to the
Bank. The cash dividends received in fiscal 2019 included a special cash dividend of $133,000. There is no guarantee in the future that the FHLB – San Francisco will pay cash dividends or redeem excess capital stock held by its members.
Under federal law, the FHLB - San Francisco is required to contribute to low and moderately priced housing programs through direct loans or interest subsidies on advances targeted for community investment and low and
moderate income housing projects. These contributions have in the past adversely affected the level of dividends paid by the FHLB - San Francisco and could continue to do so in the future. These contributions also could have an adverse effect on
the value of FHLB - San Francisco stock in the future. A reduction in value of the Bank's FHLB - San Francisco stock may result in a corresponding reduction in the Bank’s capital.
Insurance of Accounts and Regulation by the FDIC. The Bank’s deposits are insured up to applicable limits by the Deposit Insurance Fund (“DIF”) of the FDIC. Deposits are
generally insured by FDIC up to $250,000 per account owner as defined by the FDIC, backed by the full faith and credit of the United States. As insurer, the FDIC imposes deposit insurance premiums in the form of assessments and is authorized to
conduct examinations of and to require reporting by FDIC insured institutions. It may prohibit any FDIC insured institution from engaging in any activity the FDIC determines by regulation or order to pose a serious risk to the insurance fund. The
FDIC also has the authority to initiate enforcement actions against savings institutions, after giving the OCC an opportunity to take such action, and may terminate the savings institution's deposit insurance if it
29
determines that the institution has engaged in unsafe or unsound practices or is in an unsafe or unsound condition. Management of the Bank is not aware of any practice, condition or violation that might lead to
termination of the Bank's deposit insurance.
The FDIC imposes an assessment for deposit insurance on all depository institutions. Under the FDIC’s risk-based assessment system, insured institutions are assigned to risk categories based on supervisory evaluations, regulatory capital levels and
certain other factors. An institution’s assessment rate depends upon the category to which it is assigned and certain adjustments specified by FDIC regulations, with institutions deemed less risky paying lower assessments. Currently, assessment rates
(inclusive of certain possible adjustments) range from 1.5 to 40 basis points of each institution’s total assets less tangible capital (subject to upward adjustment for certain debt). The FDIC may increase or decrease the scale uniformly, except that
no adjustment can deviate more than two basis points from the base scale without notice and comment rulemaking.
The Dodd-Frank Act increased the minimum reserve ratio (the ratio of the DIF to estimated insured deposits) from 1.15% to 1.35%. The FDIC must achieve the 1.35% reserve ratio by September 30, 2020 with insured
institutions with assets of $10 billion or more funding the increase. The Dodd-Frank Act gave the FDIC the authority to set a designated reserve ratio annually, which the FDIC currently has set at 2%, to be reached over time.
The FDIC has authority to increase insurance assessments. Any significant increases would have an adverse effect on the operating expenses and results of operations of the Bank. No predictions can be made as to what
assessment rates will be in the future. In addition to the assessment for deposit insurance, institutions are required to pay assessments relating to bonds issued in the late 1980s to recapitalize a predecessor deposit insurance fund. The FDIC
discontinued FICO assessments upon maturity of those bonds in March 2019. For final four quarters for which FICO assessments were made, the average annualized rate for these assessments was 0.23 basis points. For the fiscal year 2019, the average
annualized rate for the overall FDIC assessments was 3.47 basis points.
Qualified Thrift Lender Test. Like all savings institutions (subject to a narrow exception not applicable to the Bank), the Bank is required to meet a qualified thrift lender
(“QTL”) test to avoid certain restrictions on their operations. This test requires a savings institution to have at least 65% of its total assets as defined by regulation, in qualified thrift investments on a monthly average for nine out of every 12
months on a rolling basis. As an alternative, a savings institution may maintain 60% of its assets in those assets specified in Section 7701(a)(19) of the Internal Revenue Code of 1986 (“Code”), as amended. Under either test, such assets primarily
consist of residential housing related loans and investments.
A savings institution that fails to meet the QTL test is subject to certain operating restrictions and the Dodd-Frank Act also specifies that failing the test is a violation of law that could result in an enforcement
action and dividend limitations. As of June 30, 2019, the Bank maintained 87.7% of its portfolio assets in qualified thrift investments and, therefore, met the qualified thrift lender test. During fiscal 2019 and 2018, the Bank was in compliance
with the QTL test as of each month end.
Capital Requirements. Regulatory capital requirements apply to all depository institutions, top-tier bank holding companies with total consolidated assets of $3.0 billion or more
and top-tier savings and loan holding companies.
The Bank is subject to the capital requirements adopted by the OCC. Since the holding company has less than $3.0 billion in assets, the capital guidelines apply on a bank only basis, and the Federal Reserve Board
expects the holding company’s subsidiary bank to be well capitalized under the prompt corrective action regulations. These requirements include minimum risk-based ratios for Tier 1 capital, common equity Tier 1 (“CET1”) capital, a total capital ratio
based on risk-weighted assets and a Tier 1 leverage capital ratio; and an additional capital conservation buffer over the required risk-based capital ratios. Under the capital regulations to meet the minimum capital ratios plus the capital
conservation buffer applicable to the Bank, the Bank must have a Tier 1 leverage ratio of 4% and exceed the following ratios: (i) a CETI capital ratio of 7.00%; (ii) a Tier 1 capital ratio of 8.50%; and (iii) a total capital ratio of 10.50%.
30
Mortgage servicing rights and deferred tax assets over designated percentages of CET1 are also deducted from capital. In addition, Tier 1 capital includes accumulated other comprehensive income, which includes all
unrealized gains and losses on available for sale debt, equity securities and interest-only strips. Because of our asset size, we were given a one-time option to permanently opt-out of the inclusion of unrealized gains and losses on available for
sale debt, equity securities and interest-only strips in our capital calculations. We elected to exercise this option to opt-out in order to reduce the impact of market volatility on our regulatory capital levels.
As noted above, in addition to the minimum risk-based capital ratios, the Bank must maintain a capital conservation buffer consisting of additional CET1 capital greater than 2.5% of risk-weighted assets above the
required minimum levels in order to avoid limitations on paying dividends, engaging in share repurchases, and paying discretionary bonuses based on percentages of eligible retained income that could be utilized for such actions. The capital
conservation buffer requirement was fully phased-in on January 1, 2019. Failure to maintain the required capital conservation buffer will limit the ability of the Bank to pay dividends, repurchase shares or pay discretionary bonuses. If the Bank
does not have the ability to pay dividends to the Corporation, the Corporation may be limited in its ability to pay dividends to its stockholders.
Under the current standards, in order to be considered well-capitalized, the Bank must have a Tier 1 leverage ratio of 5%, a CET1 capital ratio of 6.5%, a Tier 1 capital ratio of 8% and a total capital ratio of 10% and
must not be subject to an order from the OCC mandating a specific capital ratio for the Bank. As of June 30, 2019, the most recent notification from the OCC categorized the Bank as “well capitalized” under the regulatory framework for prompt
corrective action. See Note 10 of the Notes to Consolidated Financial Statements included in Item 8 of this Form 10-K. An institution that is not well-capitalized is subject to certain restrictions on brokered deposits and the rates it can pay on
deposits.
Prompt Corrective Action. The OCC is required to take certain supervisory actions against undercapitalized savings institutions, the severity of which depends upon the
institution's degree of undercapitalization. Subject to a narrow exception, the OCC is required to appoint a receiver or conservator for a savings institution that is "critically undercapitalized." OCC regulations also require that a capital
restoration plan be filed with the OCC within 45 days of the date a savings institution receives notice that it is "undercapitalized," "significantly undercapitalized" or "critically undercapitalized." In addition, numerous mandatory supervisory
actions become immediately applicable to an undercapitalized institution, including, but not limited to, increased monitoring by regulators and restrictions on growth, capital distributions and expansion. “Significantly undercapitalized” and
“critically undercapitalized” institutions are subject to more extensive mandatory regulatory actions. The OCC also may take any one of a number of discretionary supervisory actions, including the issuance of a capital directive and the replacement
of senior executive officers and directors.
Limitations on Capital Distributions. OCC regulations impose various restrictions on savings institutions and on their ability to make distributions of capital, which include
dividends, stock redemptions or repurchases, cash-out mergers and other transactions charged to the capital account. Generally, savings institutions, such as the Bank, that before and after the proposed distribution are well-capitalized, may make
capital distributions during any calendar year up to 100% of net income for the year-to-date plus retained net income for the two preceding years. However, an institution deemed to be in need of more than normal supervision or in troubled condition
by the OCC may have its dividend authority restricted by the OCC. If the Bank, however, proposes to make a capital distribution when it does not meet its capital requirements (or will not following the proposed capital distribution) or that will
exceed these net income-based limitations, it must obtain the OCC's approval prior to making such distribution. In addition, the Bank must file a prior written notice of a dividend with the Federal Reserve Board. The Federal Reserve Board or the
OCC may object to a capital distribution based on safety and soundness concerns. Further restrictions on Bank dividends may apply if the Bank fails the QTL test. In addition, as noted above, if the Bank does not have the required capital
conservation buffer, its ability to pay dividends to the Corporation will be limited, which may limit the ability of the Corporation to pay dividends to its stockholders.
Activities of Savings Associations and Their Subsidiaries. When a savings institution establishes or acquires a subsidiary or elects to conduct any new activity through a
subsidiary that the association controls, the savings institution must seek approval
31
or notify the FDIC and the OCC 30 days in advance and provide the required information. Savings institutions also must conduct the activities of subsidiaries in accordance with existing regulations and orders.
The OCC may determine that the continuation by a savings institution of its ownership, control of, or its relationship to, the subsidiary constitutes a serious risk to the safety, soundness or stability of the savings
institution or is inconsistent with sound banking practices or with the purposes of the Federal Deposit Insurance Act. Based upon that determination, the FDIC or the OCC has the authority to order the savings institution to divest itself of control
of the subsidiary. The FDIC also may determine by regulation or order that any specific activity poses a serious threat to the DIF. If so, it may require that no DIF member engage in that activity directly.
Transactions with Affiliates and Insiders. The Bank’s authority to engage in transactions with “affiliates” is limited by Sections 23A and 23B of the Federal Reserve Act as
implemented by the Federal Reserve Board’s Regulation W. The term “affiliates” for these purposes generally means any company that controls or is under common control with an institution. The Corporation and its non-savings institution subsidiaries
are affiliates of the Bank. In general, transactions with affiliates must be on terms that are as favorable to the institution as comparable transactions with non-affiliates. In addition, certain types of transactions are restricted to an aggregate
percentage of the institution’s capital. Collateral in specified amounts must be provided by affiliates in order to receive loans from an institution. Savings institutions are prohibited from lending to any affiliate that is engaged in activities
that are not permissible for bank holding companies and no savings institution may purchase the securities of any affiliate other than a subsidiary. In addition, these institutions are prohibited from engaging in certain tying arrangements in
connection with any extension of credit or the providing of any property or service.
The Sarbanes-Oxley Act of 2002 (“Sarbanes-Oxley Act”) generally prohibits the Corporation from making loans to its executive officers and directors. However, that act contains a specific exception for loans by a
depository institution to its executive officers and directors, if the lending is in compliance with federal banking laws. Under such laws, the Bank’s authority to extend credit to executive officers, directors and 10% stockholders (“insiders”), as
well as entities which such persons control, is limited. The law restricts both the individual and aggregate amount of loans the Bank may make to insiders based, in part, on the Bank’s capital position and requires certain Board approval procedures
to be followed. Such loans must be made on terms substantially the same as those offered to unaffiliated individuals and not involve more than the normal risk of repayment. There is an exception for loans made pursuant to a benefit or compensation
program that is widely available to all employees of the institution and does not give preference to insiders over other employees. There are additional restrictions applicable to loans to executive officers.
Community Reinvestment Act and Consumer Protection Laws. Under the Community Reinvestment Act, every FDIC-insured institution has a continuing and affirmative obligation
consistent with safe and sound banking practices to help meet the credit needs of its entire community, including low and moderate income neighborhoods. The Community Reinvestment Act does not establish specific lending requirements or programs for
financial institutions nor does it limit an institution's discretion to develop the types of products and services that it believes are best suited to its particular community, consistent with the Community Reinvestment Act. The Community
Reinvestment Act requires the OCC, in connection with the examination of the Bank, to assess the institution’s record of meeting the credit needs of its community and to take such record into account in its evaluation of certain applications, such as
a merger or the establishment of a branch, by the Bank. The OCC may use an unsatisfactory rating as the basis for the denial of an application. Due to heightened attention to the Community Reinvestment Act in the past few years, the Bank may be
required to devote additional funds for investment and lending in its local community. The Bank received a rating of satisfactory when it was last examined for Community Reinvestment Act compliance.
In connection with its deposit-taking, lending and other activities, the Bank is subject to a number of federal laws designed to protect consumers and promote lending to various sectors of the economy and population.
The CFPB issues regulations and standards under these federal consumer protection laws, which include, among others, the Equal Credit Opportunity Act, the Truth-in-Lending Act, the Home Mortgage Disclosure Act and the Real Estate Settlement
Procedures Act. Through its
32
rulemaking authority, the CFPB has promulgated many final regulations under these laws that affect our consumer businesses. Among these regulatory initiatives, are final regulations setting “ability to repay” and
“qualified mortgage” standards for residential mortgage loans and establishing new mortgage loan servicing and loan originator compensation standards. The Bank devotes substantial compliance, legal and operational business resources to ensure
compliance with these consumer protection standards.
Bank Secrecy Act/Anti-Money Laundering Laws. The Bank is subject to the Bank
Secrecy Act and other anti-money laundering laws and regulations, including the USA Patriot Act of 2001. These laws and regulations require the Bank to implement policies, procedures, and controls to detect, prevent, and report money laundering and
terrorist financing and to verify the identity of their customers. Violations of these requirements can result in substantial civil and criminal sanctions. In addition, provisions of the USA Patriot Act require the federal financial institution
regulatory agencies to consider the effectiveness of a financial institution's anti-money laundering activities when reviewing mergers and acquisitions.
Regulatory and Criminal Enforcement Provisions. The OCC has primary enforcement responsibility over federally chartered savings institutions and has the authority to bring
action against all “institution-affiliated parties,” including stockholders, attorneys, appraisers and accountants who knowingly or recklessly participate in wrongful action likely to have an adverse effect on an insured institution. Formal
enforcement action may range from the issuance of a capital directive or cease-and-desist order to removal of officers or directors, receivership, conservatorship or termination of deposit insurance. Civil penalties cover a wide range of violations
and can be nearly $2.0 million per day per violation in especially egregious cases. The FDIC has the authority to recommend to the OCC that an enforcement action be taken with respect to a particular savings institution. If the OCC does not take
action, the FDIC has authority to take such action under certain circumstances. Federal law also establishes criminal penalties for certain violations.
Environmental Issues Associated with Real Estate Lending. The Comprehensive Environmental Response, Compensation and Liability Act (“CERCLA”), a federal statute, generally
imposes strict liability on all prior and present "owners and operators" of sites containing hazardous waste. However, Congress acted to protect secured creditors by providing that the term "owner and operator" excludes a person whose ownership is
limited to protecting its security interest in the site. Since the enactment of the CERCLA, this “secured creditor exemption” has been the subject of judicial interpretations which have left open the possibility that lenders could be liable for
cleanup costs on contaminated property that they hold as collateral for a loan.
To the extent that legal uncertainty exists in this area, all creditors, including the Bank, that have made loans secured by properties with potential hazardous waste contamination (such as petroleum contamination)
could be subject to liability for cleanup costs, which costs often substantially exceed the value of the collateral property.
Other Consumer Protection Laws and Regulations. The Bank is subject to a broad array of federal and state consumer protection laws and regulations that govern almost every
aspect of its business relationships with consumers. While the list set forth below is not exhaustive, these include the GLBA, USA Patriot Act, the Truth-in-Lending Act, the Truth in Savings Act, the Electronic Fund Transfers Act, the Expedited
Funds Availability Act, the Equal Credit Opportunity Act, the Fair Housing Act, the Real Estate Settlement Procedures Act, the Home Mortgage Disclosure Act, the Fair Credit Reporting Act, the Right to Financial Privacy Act, the Home Ownership and
Equity Protection Act, the Fair Credit Billing Act, the Homeowners Protection Act, the Check Clearing for the 21st Century Act, laws governing flood insurance, laws governing consumer protections in connection with the sale of insurance, federal and
state laws prohibiting unfair and deceptive business practices, and various regulations that implement some or all of the foregoing. These laws and regulations mandate certain disclosure requirements and regulate the manner in which financial
institutions must deal with customers when taking deposits, making loans, collecting loans, and providing other services. Failure to comply with these laws and regulations can subject the Bank to various penalties, including but not limited to,
enforcement actions, injunctions, fines, civil liability, criminal penalties, punitive damages, and the loss of certain contractual rights.
33
Savings and Loan Holding Company Regulation
General. As a savings and loan holding company, the Corporation is subject to the regulatory oversight of the Federal Reserve Board. Accordingly, the Corporation is required
to register and file reports with the Federal Reserve Board and is subject to regulation and examination by the Federal Reserve Board. In addition, the Federal Reserve Board has enforcement authority over the Corporation and its non-savings
institution subsidiaries, which also permits the Federal Reserve Board to restrict or prohibit activities that are determined to present a serious risk to the subsidiary savings institution. In accordance with the Dodd-Frank Act, the federal
banking regulators must require any company that controls an FDIC-insured depository institution to serve as a source of strength for the institution, with the ability to provide financial assistance if the institution suffers financial distress.
These and other Federal Reserve Board policies and regulations may restrict the Corporation’s ability to pay dividends.
Capital Requirements. Regulatory capital requirements adopted by the federal banking regulators apply to the Bank only, as discussed above. These capital requirements include
provisions that might impact the ability of the Corporation to pay dividends to its stockholders or repurchase its shares. For a description of the capital regulations, see “Federal Regulation of Savings Institutions - Capital Requirements” above.
Activities Restrictions. The GLBA provides that no company may acquire control of a savings association after May 4, 1999 unless it engages only in the financial activities
permitted for financial holding companies under the law or for multiple savings and loan holding companies as described below. The GLBA also specifies, subject to a grandfather provision, that existing savings and loan holding companies may only
engage in such activities. The Corporation qualifies for the grandfathering and is therefore not restricted in terms of its activities. Upon any non-supervisory acquisition of another savings association as a separate subsidiary, the Corporation
would become a multiple savings and loan holding company and would be limited to those activities permitted multiple savings and loan holding companies by Federal Reserve Board regulation. Multiple savings and loan holding companies may engage in
activities permitted for financial holding companies, and certain other activities including acting as a trustee under a deed of trust and real estate investments.
If the Bank fails the QTL test, the Corporation must, within one year of that failure, register as, and become subject to the restrictions applicable to bank holding companies. For additional information, see “Federal
Regulation of Savings Institutions – Qualified Thrift Lender Test” in this Form 10-K.
Mergers and Acquisitions. The Corporation must obtain approval from the Federal Reserve Board before acquiring more than 5% of the voting stock of another savings institution or
savings and loan holding company or acquiring such an institution or holding company by merger, consolidation or purchase of its assets. In evaluating an application for the Corporation to acquire control of a savings institution, the Federal
Reserve Board would consider the financial and managerial resources and future prospects of the Corporation and the target institution, the effect of the acquisition on the risk to the DIF, the convenience and the needs of the community and
competitive factors.
The Federal Reserve Board may not approve any acquisition that would result in a multiple savings and loan holding company controlling savings institutions in more than one state, subject to two exceptions; (i) the
approval of interstate supervisory acquisitions by savings and loan holding companies and (ii) the acquisition of a savings institution in another state if the laws of the states of the target savings institution specifically permit such
acquisitions. The states vary in the extent to which they permit interstate savings and loan holding company acquisitions.
Acquisition of the Company. Any company, except a bank holding company, that acquires control of a savings association or savings and loan holding company
becomes a “savings and loan holding company” subject to registration, examination and regulation by the Federal Reserve Board and must obtain the prior approval of the Federal Reserve Board under the Savings and Loan Holding Company Act before
obtaining control of a savings association or savings and loan holding company. A
34
bank holding company must obtain the prior approval of the Federal Reserve Board under the Bank Holding Company Act before obtaining control of a savings association or savings and loan holding
company and remains subject to regulation under the Bank Holding Company Act. The term “company” includes corporations, partnerships, associations, and certain trusts and other entities. “Control” of a savings association or savings and loan holding
company is deemed to exist if a company has voting control, directly or indirectly of more than 25% of any class of the savings association’s voting stock or controls in any manner the election of a majority of the directors of the savings association
or savings and loan holding company, and may be presumed under other circumstances, including, but not limited to, holding 10% or more of a class of voting securities if the institution has a class of registered securities, as the Corporation has.
Control may be direct or indirect and may occur through acting in concert with one or more other persons. In addition, a savings and loan holding company must obtain Federal Reserve Board approval prior to acquiring voting control of more than 5% of
any class of voting stock of another savings association or another savings association holding company. A similar provision limiting the acquisition by a bank holding company of 5% or more of a class of voting stock of any company is included in the
Bank Holding Company Act.
38
53
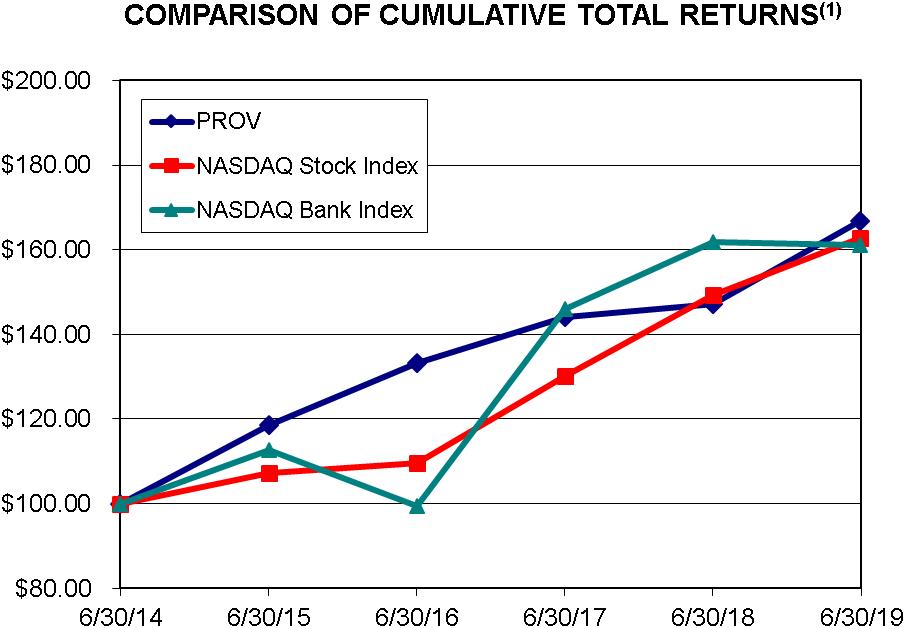
are based upon management’s beliefs and assumptions at the time they are made. We undertake no obligation to publicly update or revise any forward-looking statements included in this document or to update the reasons why actual results could differ
from those contained in such statements, whether as a result of new information, future events or otherwise. In light of these risks, uncertainties and assumptions, the forward-looking statements discussed in this document might not occur, and you
should not put undue reliance on any forward-looking statements.
59
73
Accordingly, the prior approval of the Federal Reserve Board would be required:
|
•
|
before any savings and loan holding company or bank holding company could acquire 5% or more of the common stock of the Corporation; and
|
|
•
|
before any other company could acquire 25% or more of the common stock of the Corporation, and may be required for an acquisition of as little as 10% of such stock.
|
In addition, persons that are not companies are subject to the same or similar definitions of control with respect to savings and loan holding companies and savings associations and requirements for prior regulatory
approval by the Federal Reserve Board in the case of control of a savings and loan holding company or by the OCC in the case of control of a savings association not obtained through control of a holding company of such savings association.
Sarbanes-Oxley Act. The Sarbanes-Oxley Act was enacted in 2002 in response to public concerns regarding corporate accountability in connection with certain accounting
scandals. The stated goals of the Sarbanes-Oxley Act were to increase corporate responsibility, to provide for enhanced penalties for accounting and auditing improprieties at publicly traded companies and to protect investors by improving the
accuracy and reliability of corporate disclosures pursuant to the securities laws. The Sarbanes-Oxley Act generally applies to all companies that file or are required to file periodic reports with the SEC, under the Securities Exchange Act of 1934,
including the Corporation.
The Sarbanes-Oxley Act includes very specific additional disclosure requirements and corporate governance rules, requires the SEC and securities exchanges to adopt extensive additional disclosures, corporate governance
and related rules and mandates. The Sarbanes-Oxley Act represents significant federal involvement in matters traditionally left to state regulatory systems, such as the regulation of the accounting profession, and to state corporate law, such as the
relationship between a board of directors and management and between a board of directors and its committees. The Dodd-Frank Act imposes additional disclosure and corporate government requirements and represents further federal involvement in
matters historically addressed by state corporate law.
Dividends and Stock Repurchases. Savings and loan holding companies are subject to Federal Reserve policies which call for companies to operate with capital levels well above
minimum ratios and notifying the Federal Reserve Board in advance for consultation with respect to a dividend that exceeds earnings for the relevant period, a material increase in stock dividends, and dividends or repurchases in circumstances that
could raise supervisory concerns. Examples of such circumstances include without limitation a dividend that could adversely change the company’s capital structure; a dividend when the company does not meet or is at risk of not meeting its capital
requirements; a repurchase of stock that would reduce the amount of stock outstanding at the end of a quarter as compared to the beginning of the quarter and other repurchases that could materially affect the level or composition of the company’s
capital base.
As discussed above, the capital conservation buffer requirements can limit the ability of a savings and loan holding company to pay dividends.
35
The Dodd-Frank Wall Street Reform and Consumer Protection Act of 2010: On July 21, 2010, the Dodd-Frank Act was signed
into law. The Dodd-Frank-Act imposes various restrictions and an expanded framework of regulatory oversight for financial institutions, including depository institutions and implements capital regulations discussed above under “2018 Regulatory
Reform" and "Federal Regulation of Savings Institutions - Capital Requirements." For certain provisions of the Dodd-Frank Act, the implementing regulations have not been promulgated, or amendments to current regulations are required under the Act
or have otherwise been proposed, so the full impact of the Dodd-Frank Act on public companies cannot be determined at this time.
TAXATION
Federal Taxation
General. The Corporation and the Bank report their income on a fiscal year basis using the accrual method of accounting and are subject to federal income taxation in the same
manner as other corporations with some exceptions, including particularly the Bank’s reserve for bad debts discussed below. The following discussion of tax matters is intended only as a summary and does not purport to be a comprehensive description
of the tax rules applicable to the Bank or the Corporation. On December 22, 2017, the U.S. Government enacted comprehensive tax legislation commonly referred to as the Tax Cuts and Jobs Act (the “Tax Act”). The Tax Act amends the Internal Revenue
Code to reduce tax rates and modify policies, credits, and deductions for individuals and businesses. For businesses, the Tax Act reduces the corporate federal income tax rate from a maximum of 35% to a flat 21%. The corporate federal income tax rate
reduction was effective January 1, 2018. Since the Corporation has a fiscal year end of June 30th, the reduced federal corporate income tax rate for fiscal year 2018 was the result of the application of a blended federal statutory tax rate of 28.06%,
which was based on the applicable tax rates before and after the Tax Act and corresponding number of days in the fiscal year before and after enactment, and for fiscal 2019 and thereafter, it is a flat 21% corporate income tax rate.
Other major changes include expensing of equipment investment; elimination of personal and dependent exemptions, the tax on people who do not obtain adequate health insurance coverage, and the corporate alternative
minimum tax; and increases in the standard deduction, the estate tax exemption, and the individual alternative minimum tax exemption.
Tax Bad Debt Reserves. As a result of legislation enacted in 1996, the reserve method of accounting for bad debt reserves was repealed for tax years beginning after December 31,
1995. Due to such repeal, the Bank is no longer able to calculate its deduction for bad debts using the percentage-of-taxable-income or the experience method. Instead, the Bank is permitted to deduct as bad debt expense its specific charge-offs
during the taxable year. In addition, the legislation required savings institutions to recapture into taxable income, over a six-year period, their post 1987 additions to their bad debt tax reserves. As of the effective date of the legislation, the
Bank had no post 1987 additions to its bad debt tax reserves. As of June 30, 2019, the Bank’s total pre-1988 bad debt reserve for tax purposes was approximately $9.0 million. Under current law, a savings institution will not be required to
recapture its pre-1988 bad debt reserve unless the Bank makes a “non-dividend distribution” as defined below. Currently, the Corporation uses the specific charge-off method to account for bad debt deductions for income tax purposes.
Distributions. In the event that the Bank makes “non-dividend distributions” to the Corporation that are considered as made from the reserve for losses on qualifying real estate
property loans, to the extent the reserve for such losses exceeds the amount that would have been allowed under the experience method or from the supplemental reserve for losses on loans (“Excess Distributions”), then an amount based on the amount
distributed will be included in the Bank’s taxable income. Non-dividend distributions include distributions in excess of the Bank’s current and accumulated earnings and profits, distributions in redemption of stock, and distributions in partial or
complete liquidation. However, dividends paid out of the Bank’s current or accumulated earnings and profits, as calculated for federal income tax purposes, will not be considered to result in a distribution
36
from the Bank’s bad debt reserve. Thus, any dividends to the Corporation that would reduce amounts appropriated to the Bank’s bad debt reserve and deducted for federal income tax purposes would create a tax liability
for the Bank. The amount of additional taxable income attributable to an Excess Distribution is an amount that, when reduced by the tax attributable to the income, is equal to the amount of the distribution. Thus, if the Bank makes a “non-dividend
distribution,” then approximately one and one-half times the amount distributed will be included in taxable income for federal income tax purposes. For additional information, see "Regulation - Federal Regulation of Savings Institutions -
Limitations on Capital Distributions” in this Form 10-K for limits on the payment of dividends by the Bank. The Bank does not intend to pay dividends that would result in a recapture of any portion of its tax bad debt reserve. During fiscal 2019,
the Bank declared and paid $7.5 million of cash dividends to the Corporation while the Corporation declared and paid $4.2 million of cash dividends to shareholders.
Tax Effect from Stock-Based Compensation. During fiscal 2019, there were 3,000 shares of restricted common stock distributed to non-employee members of the Corporation’s Board
of Directors and 86,500 shares of restricted common stock distributed to employees. Also, there were 2,896 shares of non-qualified stock options exercised and 34,749 shares of incentive stock options exercised as disqualifying dispositions. As a
result, there was a $93,000 federal tax benefit effect from stock-based compensation in fiscal 2019.
Other Matters. The Internal Revenue Service has audited the Bank’s income tax returns through 1996 and the California Franchise Tax Board has audited the Bank through
1990. Also, the Internal Revenue Service completed a review of the Corporation’s income tax returns for fiscal 2006 and 2007; and the California Franchise Tax Board completed a review of the Corporation’s income tax returns for fiscal 2009 and
2010. Fiscal years 2016 and thereafter remain subject to federal examination, while the California state tax returns for fiscal years 2015 and thereafter are subject to examination by state taxing authorities.
State Taxation
California. The California franchise tax rate applicable to the Bank, equals the franchise tax rate applicable to corporations generally, plus an “in lieu” rate of 2%, which is
approximately equal to personal property taxes and business license taxes paid by such corporations (but not generally paid by banks or financial corporations such as the Corporation). At June 30, 2019 and 2018, the Corporation’s net state tax rate
was 8.4% and 7.8%, respectively. Bad debt deductions are available in computing California franchise taxes using the specific charge-off method. The Bank and its California subsidiaries file California franchise tax returns on a combined
basis. The Corporation will be treated as a general corporation subject to the general corporate tax rate. There was a $54,000 state tax benefit effect from stock-based compensation in fiscal 2019, as described above in the section entitled
"Federal Taxation."
Delaware. As a Delaware holding company not earning income in Delaware, the Corporation is exempted from Delaware corporate income tax, but is required to file an annual report
with and pay an annual franchise tax to the State of Delaware. During fiscal 2019 and 2018, the Corporation paid franchise taxes of $200,000 and $208,000, respectively.
37
EXECUTIVE OFFICERS
The following table sets forth information with respect to the executive officers of the Corporation and the Bank:
|
Position
|
|||
|
Name
|
Age(1)
|
Corporation
|
Bank
|
|
Craig G. Blunden
|
71
|
Chairman and
|
Chairman and
|
|
Chief Executive Officer
|
Chief Executive Officer
|
||
|
Robert "Scott" Ritter
|
50
|
—
|
Senior Vice President
|
|
Single-Family Division
|
|||
|
Donavon P. Ternes
|
59
|
President
|
President
|
|
Chief Operating Officer
|
Chief Operating Officer
|
||
|
Chief Financial Officer
|
Chief Financial Officer
|
||
|
Corporate Secretary
|
Corporate Secretary
|
||
|
David S. Weiant
|
60
|
—
|
Senior Vice President
|
|
Chief Lending Officer
|
|||
|
Gwendolyn L. Wertz
|
53
|
—
|
Senior Vice President
|
|
Retail Banking Division
|
|||
|
(1)
|
As of June 30, 2019.
|
Biographical Information
Set forth below is certain information regarding the executive officers of the Corporation and the Bank. There are no family relationships among or between the executive officers.
Craig G. Blunden has been associated with Provident Savings Bank since 1974, currently serving as Chairman and Chief Executive Officer of the Bank and Provident, positions he has held since 1991 and 1996, respectively.
He served as President of the Bank from 1991 until June 2011 and as President of Provident from its formation in 1996 until June 2011. Mr. Blunden also serves on the Board of Directors of the Western Bankers Association and the Federal Home Loan Bank
of San Francisco.
Robert "Scott" Ritter joined the Bank as Senior Vice President on September 26, 2016 and currently oversees the single-family mortgage division. Prior to joining the Bank, Mr. Ritter was the Chief Operating Officer at
California Mortgage Advisors since November 2011 where he was responsible for overseeing all of California Mortgage Advisors' operations, including product development, underwriting, loan processing and information technology. Prior to that, he held
positions with increasing responsibilities at mortgage banking firms such as Green Point Financial and its predecessor Headlands Mortgage Company, among others.
Donavon P. Ternes joined the Bank and the Corporation as Senior Vice President and Chief Financial Officer on November 1, 2000 and was appointed Secretary of the Corporation and the Bank in April 2003. Effective
January 1, 2008, Mr. Ternes was appointed Executive Vice President and Chief Operating Officer, while continuing to serve as the Chief Financial Officer and Corporate Secretary of the Bank and the Corporation. Effective June 27, 2011, the Board of
Directors of the Bank and the Corporation promoted Mr. Ternes to serve as President of the Bank and the Corporation, while continuing to serve as Chief Operating Officer, Chief Financial Officer and Corporate Secretary. Prior to joining the Bank,
Mr. Ternes was the President,
38
Chief Executive Officer, Chief Financial Officer and Director of Mission Savings and Loan Association, located in Riverside, California, holding those positions for over 11 years.
David S. Weiant joined the Bank as Senior Vice President and Chief Lending Officer on June 29, 2007. Prior to joining the Bank, Mr. Weiant was a Senior Vice President of Professional Business Bank (June 2006 to June
2007) where he was responsible for commercial lending in the Los Angeles and Inland Empire regions of Southern California.
Gwendolyn L. Wertz joined the Bank as Senior Vice President of Retail Banking on February 3, 2014. Prior to joining the Bank, Ms. Wertz was with CommerceWest Bank where she was responsible for the management of
commercial banking activities, treasury management and specialty banking. Prior to that she was with Opportunity Bank, N.A. where she was responsible for the commercial treasury sales and service team. Ms. Wertz has more than 25 years of experience
with financial institutions including the last 10 years in senior management roles. Her experience includes depository growth initiatives, operations, compliance, and deposit acquisition management.
Item 1A. Risk Factors
We assume and manage a certain degree of risk in order to conduct our business. In addition to the risk factors described below, other risks and uncertainties not specifically mentioned, or that are currently known
to, or deemed by, management to be immaterial also may materially and adversely affect our financial position, results of operation and/or cash flows. Before making an investment decision, you should carefully consider the risks described below
together with all of the other information included in this Form 10-K. If any of the circumstances described in the following risk factors actually occur to a significant degree, the value of our common stock could decline, and you could lose all or
part of your investment.
Our business may be adversely affected by downturns in the national economy and the regional economies on which we depend.
As of June 30, 2019, approximately 78% of our real estate loans were secured by collateral and made to borrowers located in Southern California with the balance located predominantly throughout the rest of California.
Adverse economic conditions in California may reduce our rate of growth, affect our customers' ability to repay loans and adversely impact our financial condition and earnings. General economic conditions, including inflation, unemployment and money
supply fluctuations, also may adversely affect our profitability adversely. Weakness in the global economy has adversely affected many businesses operating in our markets that are dependent upon international trade.
While real estate values and unemployment rates have been improving, deterioration in economic conditions in the market areas we serve could result in the following consequences, any of which could have a materially
adverse impact on our business, financial condition and results of operations:
|
•
|
an increase in loan delinquencies, problem assets and foreclosures;
|
|
•
|
we may increase our allowance for loan losses
|
|
•
|
the slowing of sales of foreclosed assets;
|
|
•
|
a decline in demand for our products and services;
|
|
•
|
a decline in the value of collateral for loans may in turn reduce customers' borrowing power, and the value of assets and collateral associated with existing loans;
|
|
•
|
the net worth and liquidity of loan guarantors may decline, impairing their ability to honor commitments to us; and
|
|
•
|
a decrease in the amount of our low cost or non interest-bearing deposits.
|
A decline in California economic conditions may have a greater effect on our earnings and capital than on the earnings and capital of larger financial institutions whose real estate loan portfolios are geographically
diverse. Many of the loans in our portfolio are secured by real estate. Deterioration in the real estate markets where collateral for a mortgage loan is located could
39
negatively affect the borrower’s ability to repay the loan and the value of the collateral securing the loan. Real estate values are affected by various other factors, including changes in general or regional economic
conditions, governmental rules or policies and natural disasters such as fires and earthquakes. If we are required to liquidate a significant amount of collateral during a period of reduced real estate values, our financial condition and
profitability could be adversely affected.
Our business may be adversely affected by credit risk associated with residential property.
At June 30, 2019, $325.0 million, or 36.9% of our loans held for investment, were secured by single-family residential real property. This type of lending is generally sensitive to regional and local economic
conditions that may significantly impact the ability of borrowers to meet their loan payment obligations, making loss levels difficult to predict. Jumbo single-family loans which do not conform to secondary market mortgage requirements for our market
areas are not immediately saleable in the secondary market and may expose us to increased risk because of their larger balances. Recessionary conditions or declines in the volume of single-family real estate sales and/or the sales prices as well as
elevated unemployment rates may result in higher than expected loan delinquencies or problem assets, and a decline in demand for our products and services. These potential negative events may cause us to incur losses, adversely affect our capital and
liquidity and damage our financial condition and business operations.
Some of our residential mortgage loans are secured by liens on mortgage properties in which the borrowers have little or no equity because either we originated a first mortgage with an 80% loan-to-value ratio and a
concurrent second mortgage for a combined loan-to-value ratio of up to 100% or because of the decline in home values in our market areas. Residential loans with high loan-to-value ratios will be more sensitive to declining property values than those
with lower combined loan-to-value ratios and therefore may experience a higher incidence of default and severity of losses.
Prior to fiscal 2009, many of the loans we originated for investment consisted of non-traditional single-family residential loans that do not conform to Fannie Mae or Freddie Mac underwriting guidelines as a result of
the characteristics of the borrower or property, the loan terms, loan size or exceptions from agency underwriting guidelines. In exchange for the additional risk to us associated with these loans, these borrowers generally are required to pay a
higher interest rate, and depending on the credit history, a lower loan-to-value ratio was generally required than for a conforming loan. Our non-traditional single-family residential loans include interest-only loans, loans to borrowers who
provided limited or no documentation of their income or stated income loans, negative amortization loans (a loan in which accrued interest exceeding the required monthly loan payment is added to loan principal up to 115% of the original loan amount),
more than 30-year amortization loans, and loans to borrowers with a FICO score below 660 (these loans are considered subprime by the OCC). Including these low FICO score loans, as of June 30, 2019, our single-family residential borrowers had a
weighted average FICO score of 744 at the time of loan origination.
As of June 30, 2019, these non-traditional loans totaled $58.5 million, comprising 18.0% of total single-family residential loans held for investment and 6.6% of total loans held for investment. At that date,
interest-only loans totaled $1.5 million, stated income loans totaled $52.6 million, negative amortization loans totaled $1.5 million, more than 30-year amortization loans totaled $7.5 million, and low FICO score loans totaled $7.7 million (the
outstanding balances described may overlap more than one category).
Our multi-family and commercial real estate loans involve higher principal amounts than other loans and repayment of these loans may be dependent on factors outside our control or the control of our
borrowers.
We originate multi-family residential and commercial real estate loans for individuals and businesses for various purposes, which are secured by residential and non-residential properties. At June 30, 2019, we had
$551.0 million or 62.5% of total loans held for investment in multi-family and commercial real estate mortgage loans. These loans typically involve higher principal amounts than other types of loans and some of our commercial borrowers have more
than one loan outstanding with us. Consequently, an adverse development with respect to one loan or one credit relationship can expose us to a significantly
40
greater risk of loss compared to an adverse development with respect to a one-to-four family residential loan. Repayment on these loans are dependent upon income generated, or expected to be generated, by the property
securing the loan in amounts sufficient to cover operating expenses and debt service, which may be adversely affected by changes in the economy or local market conditions. For example, if the cash flow from the borrower's project is reduced as a
result of leases not being obtained or renewed, the borrower's ability to repay the loan may be impaired. Multi-family and commercial real estate loans also expose a lender to greater credit risk than loans secured by single-family residential real
estate because the collateral securing these loans typically cannot be sold as easily as single-family residential real estate. In addition, many of our multi-family and commercial real estate loans are not fully amortizing and contain large balloon
payments upon maturity. Such balloon payments may require the borrower to either sell or refinance the underlying property to make the payment, which may increase the risk of default or non-payment. In addition, as of June 30, 2019, the Bank had
$5.0 million in negative amortization multi-family mortgage loans (a loan in which accrued interest exceeding the required monthly loan payment may be added to the loan principal) as compared to $5.5 million in multi-family and commercial real estate
loans at June 30, 2018. Negative amortization involves a greater risk to the Bank because the credit risk exposure increases when the loan incurs negative amortization and the value of the property serving as collateral for the loan does not
increase proportionally.
A secondary market for many types of multi-family and commercial real estate loans is not readily liquid, so we have less opportunity to mitigate credit risk by selling part or all of our interest in these loans. As a
result of these characteristics, if we foreclose on a multi-family or commercial real estate loan, our holding period for the collateral typically is longer than for a single-family residential mortgage loan because there are fewer potential
purchasers of the collateral. Accordingly, charge-offs on multi-family and commercial real estate loans may be larger on a per loan basis than those incurred with our single-family residential or consumer loan portfolios.
We occasionally purchase loans in bulk or “pools.” We may experience lower yields or losses on loan “pools” because the assumptions we use when purchasing loans in bulk may not prove correct.
In order to achieve our loan growth objectives and/or improve earnings, we may purchase loans, either individually, through participations, or in bulk. The Corporation purchased $51.1 million of loans to be held for
investment (primarily single-family and multi-family loans) in fiscal 2019, compared to $13.5 million of purchased loans to be held for investment (primarily multi-family loans) in fiscal 2018. When we determine the purchase price we are willing to
pay to purchase loans in bulk, management makes certain assumptions about, among other things, how fast borrowers will prepay their loans, the real estate market, our ability to collect loans successfully and, if necessary, our ability to dispose of
any real estate that may be acquired through foreclosure. When we purchase loans in bulk, we perform certain due diligence procedures and typically require customary limited indemnities. To the extent that our underlying assumptions prove to be
inaccurate or the basis for those assumptions change, the purchase price paid for “pools” of loans may prove to have been excessive, resulting in a lower yield or a loss of some or all of the loan principal. For example, if we purchase pools of loans
at a premium and some of the loans are prepaid before we expected we will earn less interest income on the purchase than expected. Our success in growing through purchases of loan “pools” depends on our ability to price loan “pools” properly and on
the general economic conditions within the geographic areas where the underlying properties of our loans are located.
Acquiring loans through bulk purchases may involve acquiring loans of a type or in geographic areas where management may not have substantial prior experience. We may be exposed to a greater risk of loss to the extent
that bulk purchases contain such loans.
We may experience continuing variation in our operating results.
We reported net income of $4.4 million and $2.1 million for the fiscal years ended June 30, 2019 and 2018, respectively. Several factors affecting our business can cause significant variations in our quarterly and
annual results of operations. In particular, the scaling back of our mortgage banking operations/originations of saleable single-family mortgage loans, the differences between our costs of funds and the average interest rates of originated or
purchased loans, our inability to complete
41
significant loan sale transactions in a particular quarter and problems generally affecting the mortgage loan industry can result in significant increases or decreases in our revenues from quarter to quarter.
Consistent with the Corporation’s announcement to reduce its mortgage banking operations/scale back the origination of saleable single-family mortgage loans and improve on its efforts to increase the volume of
portfolio single-family mortgage loan originations and purchases, we recognized non-recurring costs of $2.8 million in fiscal 2019, which is comprised of $1.7 million in salaries and employee benefits expenses (attributable to severance and other
personnel expenses), $337,000 in premises and occupancy expenses (attributable to accelerated lease expenses and accelerated depreciation of furniture and fixtures), and $758,000 in equipment expenses (attributable to termination, charge-off, or
modification of data processing and other contractual arrangements).
Although we anticipate the elimination of quarterly pre-tax losses from the reduction in our mortgage banking operations/saleable single-family mortgage loan operations as a result of our actions and further anticipate
increases in our pre-tax income of approximately $1.2 million per quarter, no assurance can be given as to when or whether we will realize these benefits which may cause additional variations in our quarterly and annual results of operations.
Our allowance for loan losses may prove to be insufficient to absorb losses in our loan portfolio.
Lending money is a substantial part of our business and each loan carries a certain risk that it will not be repaid in accordance with its terms or that any underlying collateral will not be sufficient to assure
repayment. This risk is affected by, among other things:
|
•
|
cash flow of the borrower and/or the project being financed;
|
|
•
|
the changes and uncertainties as to the future value of the collateral, in the case of a collateralized loan;
|
|
•
|
the duration of the loan;
|
|
•
|
the character and creditworthiness of a particular borrower; and
|
|
•
|
changes in economic and industry conditions.
|
We maintain an allowance for loan losses, which is a reserve established through a provision (recovery) for loan losses charged (credited) to expense, which we believe is appropriate to provide for probable losses in
our loan portfolio. The amount of this allowance is determined by management through periodic reviews and consideration of several factors, including, but not limited to:
|
•
|
our collectively evaluated allowance, based on our historical default and loss experience and certain macroeconomic factors based on management's expectations of future events; and
|
|
•
|
our individually evaluated allowance, based on our evaluation of non-performing loans and the underlying fair value of collateral or based on discounted cash flow for restructured loans.
|
The determination of the appropriate level of the allowance for loan losses inherently involves a high degree of subjectivity and requires us to make various assumptions and judgments about the collectability of our
loan portfolio, including the creditworthiness of our borrowers and the value of the real estate and other assets serving as collateral for the repayment of many of our loans. In determining the amount of the allowance for loan losses, we review our
loans, losses, and delinquency experience, and evaluate economic conditions and make significant estimates of current credit risks and future trends, all of which may undergo material changes. If our estimates are incorrect, the allowance for loan
losses may not be sufficient to cover losses inherent in our loan portfolio, resulting in the need for additions to our allowance through an increase in the provision for loan losses, which is charged against income. Deterioration in economic
conditions affecting borrowers, new information regarding existing loans, identification of additional problem loans and other factors, both within and outside of our control, may require an increase in the provision for loan losses and our allowance
for loan losses. Further, included in our single-family residential loan portfolio, which comprised 36.9% of our total loan portfolio at June 30, 2019, were $58.5 million or 6.6% of total loans held for investment that were non-traditional
single-family loans, which include interest-only loans, negative amortization and more than 30-year amortization loans, stated income loans and low FICO score loans, all of which
42
have a higher risk of default and loss than conforming residential mortgage loans. For additional information, see “Our business may be adversely affected by credit risk associated with residential property” above.
Management also recognizes that significant new growth in loan portfolios, new loan products and the refinancing of existing loans can result in portfolios comprised of unseasoned loans that may not perform in a historical or projected manner and
will increase the risk that our allowance may be insufficient to absorb losses without significant additional provisions. Furthermore, the Financial Accounting Standards Board (“FASB”) has adopted a new accounting standard that will be effective for
fiscal years, including interim periods within those fiscal years, beginning after December 15, 2019, however, the FASB board proposed in July 2019 extending the adoption date for certain SEC registrants, including the Corporation, to fiscal years,
including interim periods within those fiscal years, beginning after December 15, 2022. This standard, referred to as Current Expected Credit Loss, or CECL, will require financial institutions to determine periodic estimates of lifetime expected
credit losses on loans, and recognize the expected credit losses as allowances for credit losses at inception of the loan. This will change the current method of providing allowances for credit losses that are probable, which may require us to
increase our allowance for loan losses, and may greatly increase the types of data we would need to collect and review to determine the appropriate level of the allowance for credit losses. The federal banking regulators (the Federal Reserve Board,
the OCC and the FDIC) have adopted a rule that applies to smaller reporting companies, such as the Corporation, beginning in 2023. In addition, bank regulatory agencies periodically review our allowance for loan losses and may require an increase in
the provision for possible loan losses or the recognition of further loan charge-offs, based on judgments different than those of management. If charge-offs in future periods exceed the allowance for loan losses, we may need additional provisions to
increase the allowance for loan losses. Any increases in the provision for loan losses will result in a decrease in net income and may have a material adverse effect on our financial condition, results of operations and capital.
If our non-performing assets increase, our earnings will be adversely affected.
At June 30, 2019 and 2018, our non-performing assets were $6.2 million and $7.0 million, respectively, or 0.57% and 0.59% of total assets, respectively. Our non-performing assets adversely affect our net income in
various ways:
|
•
|
we record interest income only on a cash basis for non-accrual loans except for non-performing loans under the cost recovery method where interest is applied to the principal of the loan
as a recovery of the charge-offs, if any, and we do not record interest income for REO;
|
|
•
|
we must provide for probable loan losses through a current period charge to the provision for loan losses;
|
|
•
|
non-interest expense increases when we write down the value of properties in our REO portfolio to reflect changing market values or recognize other-than-temporary impairment (“OTTI”) on
non-performing investment securities;
|
|
•
|
there are legal fees associated with the resolution of problem assets, as well as carrying costs, such as taxes, insurance, and maintenance fees related to our REO; and
|
|
•
|
the resolution of non-performing assets requires the active involvement of management, which can distract them from more profitable activity.
|
If additional borrowers become delinquent and do not pay their loans and we are unable to successfully manage our non-performing assets, our losses and troubled assets could increase significantly, which could have a
material adverse effect on our financial condition and results of operations.
Our securities portfolio may be negatively impacted by fluctuations in market value and interest rates.
Our securities portfolio may be impacted by fluctuations in market value, potentially reducing accumulated other comprehensive income and/or earnings. Fluctuations in market value may be caused by changes in market
interest rates, lower market prices for securities and limited investor demand. Our securities portfolio is evaluated for other-than-temporary impairment. If this evaluation shows impairment to the actual or projected cash flows associated with one
or more securities, a potential loss to earnings may occur. Changes in interest rates can also have an adverse effect on our financial condition, as our available-for-sale securities are reported at their estimated fair value, and therefore are
impacted by fluctuations in interest rates. We increase or decrease our shareholders' equity by the amount of change in the estimated fair value of the available-for-sale
43
securities, net of taxes. There can be no assurance that the declines in market value will not result in other-than-temporary impairments of these assets, which would lead to accounting charges that could have a
material adverse effect on our results of operations and capital levels.
Uncertainty relating to the LIBOR calculation process and potential phasing out of LIBOR may adversely affect our results of operations.
On July 27, 2017, the Chief Executive of the United Kingdom Financial Conduct Authority, which regulates LIBOR, announced that it intends to stop persuading or compelling banks to submit rates for the calibration of
LIBOR to the administrator of LIBOR after 2021. The announcement indicates that the continuation of LIBOR on the current basis cannot and will not be guaranteed after 2021. It is impossible to predict whether and to what extent banks will continue to
provide LIBOR submissions to the administrator of LIBOR or whether any additional reforms to LIBOR may be enacted in the United Kingdom or elsewhere. At this time, no consensus exists as to what rate or rates may become acceptable alternatives to
LIBOR and it is impossible to predict the effect of any such alternatives on the value of LIBOR-based securities and variable rate loans, subordinated debentures, or other securities or financial arrangements, given LIBOR's role in determining market
interest rates globally. The Federal Reserve Board, in conjunction with the Alternative Reference Rates Committee, a steering committee comprised of large U.S. financial institutions, is considering replacing U.S. dollar LIBOR with a new index
calculated by short-term repurchase agreements, backed by Treasury securities ("SOFR"). SOFR is observed and backward looking, which stands in contrast with LIBOR under the current methodology, which is an estimated forward-looking rate and relies,
to some degree, on the expert judgment of submitting panel members. Given that SOFR is a secured rate backed by government securities, it will be a rate that does not take into account bank credit risk (as is the case with LIBOR). SOFR is therefore
likely to be lower than LIBOR and is less likely to correlate with the funding costs of financial institutions. Whether or not SOFR attains market traction as a LIBOR replacement tool remains in question and the future of LIBOR remains uncertain at
this time. Uncertainty as to the nature of alternative reference rates and as to potential changes or other reforms to LIBOR may adversely affect LIBOR rates and the value of LIBOR-based loans and securities in our portfolio, and may impact the
availability and cost of hedging instruments and borrowings. If LIBOR rates are no longer available, and we are required to implement substitute indices for the calculation of interest rates under our loan agreements with our borrowers, we may incur
significant expenses in effecting the transition, and may be subject to disputes or litigation with customers over the appropriateness or comparability to LIBOR of the substitute indices, which could have an adverse effect on our results of
operations.
If our investments in real estate are not properly valued or sufficiently reserved to cover actual losses, or if we are required to increase our valuation reserves, our earnings could be reduced.
We obtain updated valuations in the form of appraisals and broker price opinions when a loan has been foreclosed upon and the property is taken in as REO and at certain other times during the REO holding period. Our
net book value (“NBV”) in the loan at the time of foreclosure and thereafter is compared to the updated market value of the foreclosed property less estimated selling costs (“fair value”). A charge-off is recorded for any excess in the asset's NBV
over its fair value. If our valuation process is incorrect, the fair value of the investments in real estate may not be sufficient to recover our NBV in such assets, resulting in the need for additional charge-offs. Additional material charge-offs
to our investments in real estate could have a material adverse effect on our financial condition and results of operations.
In addition, bank regulators periodically review our REO and may require us to recognize further charge-offs. Any increase in our charge-offs, as required by the bank regulators, may have a material adverse effect on
our financial condition and results of operations.
44
An increase in interest rates, change in the programs offered by governmental sponsored entities (“GSE”) or our ability to qualify for such programs may reduce our mortgage revenues, which would
negatively impact our non-interest income.
Our saleable mortgage loan operations may provide a significant portion of our non-interest income. We generate mortgage revenues primarily from gains on the sale of single-family residential loans pursuant to
programs currently offered by Fannie Mae, Freddie Mac and other investors on a servicing released basis. These entities account for a substantial portion of the secondary market in residential mortgage loans. Any future changes in these programs,
significant impairment of our eligibility to participate in such programs, the criteria for loans to be accepted or laws that significantly affect the activity of such entities could, in turn, result in a lower volume of corresponding loan
originations or other administrative costs which may materially adversely affect our results of operations.
We have experienced historically low interest rates in recent years but interest rates have been volatile. Saleable mortgage loan production, especially refinancing, generally declines in rising interest rate
environments resulting in fewer loans that are available to be sold to investors. When interest rates rise, or even if they do not, there can be no assurance that our saleable mortgage loan production will continue at current levels. The
profitability of our saleable mortgage loan operations depends in large part upon our ability to aggregate a high volume of loans and sell them in the secondary market at a gain. Thus, in addition to the interest rate environment, our mortgage
business is dependent upon (i) the existence of an active secondary market and (ii) our ability to profitably sell loans into that market. The loans in our held for sale portfolio are carried at fair market value with changes recognized in our
statement of operations. Carrying the loans at fair value may also increase the volatility in our earnings.
In addition, our results of operations are affected by the amount of non-interest expense associated with saleable mortgage loan activities, such as salaries and employee benefits, occupancy, equipment and data
processing expense and other operating costs. During periods of reduced loan demand, our results of operations may be adversely affected to the extent that we are unable to reduce expenses commensurate with the decline in loan originations.
Any breach of representations and warranties made by us to our loan purchasers or credit default on our loan sales may require us to repurchase or substitute such loans we have sold.
We have previously engaged in bulk loan sales pursuant to agreements that generally require us to repurchase or substitute loans in the event of a breach of a representation or warranty made by us to the loan
purchaser. Any misrepresentation during the mortgage loan origination process or, in some cases, upon any fraud or early payment default on such mortgage loans, may require us to repurchase or substitute loans. Any claims asserted against us in the
future by one of our loan purchasers may result in liabilities or legal expenses that could have a material adverse effect on our results of operations and financial condition. During fiscal 2019 and 2018, the Bank repurchased $948,000 and $602,000
of single family loans, respectively.
The CFPB, which was created under the Dodd Frank Act, has issued a number of final regulations and changes to certain consumer protections under existing laws and continues to issue new rules. These final rules, most
of the provisions of which (including the qualified mortgage rule) generally prohibit creditors from extending mortgage loans without regard for the consumer’s ability--to--repay and add restrictions and requirements to mortgage origination and
servicing practices. In addition, these rules limit prepayment penalties and require the creditor to retain evidence of compliance with the ability--to--repay requirement for three years. Compliance with these rules has increased our overall
regulatory compliance costs and may require changes to our underwriting practices with respect to residential mortgage loans. This includes compliance with, The Truth in Lending Act and the Real Estate Settlement Procedures Act Integrated Disclosure
(TRID) rule, which combines certain disclosures that consumers receive in connection with applying for and closing a mortgage loan.
45
Hedging against interest rate exposure may adversely affect our earnings.
We employ techniques that limit, or “hedge,” the adverse effects of rising interest rates on our loans held for sale, originated interest rate locks and our mortgage servicing asset. Our hedging activity varies based
on the level and volatility of interest rates and other changing market conditions. These techniques may include purchasing or selling futures contracts, purchasing put and call options on securities or securities underlying futures contracts, or
entering into other mortgage-backed derivatives. There are, however, no perfect hedging strategies, and interest rate hedging may fail to protect us from loss. Moreover, hedging activities could result in losses if the event against which we hedge
does not materialize. Additionally, interest rate hedging could fail to protect us or adversely affect us because, among other things:
|
•
|
available interest rate hedging may not correspond directly with the interest rate risk for which protection is sought;
|
|
•
|
the duration of the hedge may not match the duration of the related liability;
|
|
•
|
the party owing money in the hedging transaction may default on its obligation to pay;
|
|
•
|
the credit quality of the party owing money on the hedge may be downgraded to such an extent that it impairs our ability to sell or assign our side of the hedging transaction;
|
|
•
|
the value of derivatives used for hedging may be adjusted from time to time in accordance with accounting rules to reflect changes in fair value; and
|
|
•
|
downward adjustments, or “mark-to-market losses,” would reduce our stockholders' equity.
|
Fluctuating interest rates can adversely affect our profitability.
Our earnings and cash flows are largely dependent upon our net interest income. Interest rates are highly sensitive to many factors that are beyond our control, including general economic conditions and policies of
various governmental and regulatory agencies and, in particular, the Federal Reserve Board. The Federal Reserve Board has steadily increased the federal funds rate over the last three fiscal years to a range of 2.25% to 2.50% in June 2019 and
indicated that possible changes in the federal funds rate in the future are subject to economic conditions. On July 31, 2019, the Federal Reserve Board reduced the federal funds target rate to a range of 2.00% to 2.25% in response to some recent
weaknesses in economic data. If the Federal Reserve Board changes the targeted Fed Funds rate, overall interest rates will likely rise or fall, which may negatively impact the housing markets and the U.S. economic recovery. In addition, deflationary
pressures, while possibly lowering our operating costs, could have a significant negative effect on our borrowers, especially our business borrowers, and the values of collateral securing loans, which could negatively affect our financial
performance.
We principally manage interest rate risk by managing our volume and mix of our earning assets and funding liabilities. Changes in monetary policy, including changes in interest rates, could influence not only the
interest we receive on loans and investments and the amount of interest we pay on deposits and borrowings, but these changes could also affect (i) our ability to originate loans and obtain deposits, (ii) the fair value of our financial assets and
liabilities, which could negatively impact shareholders' equity, and our ability to realize gains from the sale of such assets; (iii) our ability to obtain and retain deposits in competition with other available investment alternatives; (iv) the
ability of our borrowers to repay adjustable or variable rate loans; and (v) the average duration of our investment securities portfolio and other interest-earning assets. If the interest rates paid on deposits and other borrowings increase at a
faster rate than the interest rates received on loans and other investments, our net interest income, and therefore earnings, could be adversely affected. Earnings could also be adversely affected if the interest rates received on loans and other
investments decline more rapidly than the interest rates paid on deposits and other borrowings. In a changing interest rate environment, we may not be able to manage this risk effectively. If we are unable to manage interest rate risk effectively,
our business, financial condition and results of operations could be materially affected.
As a result of the relatively low interest rate environment, a significant percentage of our deposits are comprised of certificates of deposit and other deposits yielding a relatively low rate of interest having a
shorter duration than our assets. At June 30, 2019, we had $106.1 million in time deposits that mature within one year and $557.9 million in interest-bearing checking, savings and money market accounts. We would incur a higher cost of funds to
retain these deposits in a rising interest rate environment. Earnings could also be adversely affected if the interest rates received on loans and other investments fall more
46
quickly than the interest rates paid on deposits and other borrowings. In addition, a substantial majority of our mortgage loans have adjustable interest rates. As a result, these loans may experience a higher rate
of default in a rising interest rate environment.
Changes in interest rates also affect the value of our interest-earning assets and, in particular, our securities portfolio. Generally, the fair value of fixed-rate securities fluctuates inversely with changes in
interest rates. Unrealized gains and losses on securities available for sale are reported as a separate component of equity, net of tax. Decreases in the fair value of securities available for sale resulting from increases in interest rates could
have an adverse effect on stockholders’ equity.
Although management believes it has implemented effective asset and liability management strategies to reduce the potential effects of changes in interest rates on our results of operations, any substantial, unexpected
or prolonged change in market interest rates could have a material adverse effect on our financial condition and results of operations. Also, our interest rate risk modeling techniques and assumptions likely may not fully predict or capture the
impact of actual interest rate changes on our consolidated balance sheet or projected operating results.
The financial services market is undergoing rapid technological changes, and if we are unable to stay current with those changes, we will not be able to effectively compete.
The financial services market is undergoing rapid changes with frequent introductions of new technology-driven products and services. Our future success will depend, in part, on our ability to keep pace with the
technological changes and to use technology to satisfy and grow customer demand for our products and services and to create additional efficiencies in our operations. We expect that we will need to make substantial investments in our technology and
information systems to compete effectively and to stay current with technological changes. Some of our competitors have substantially greater resources to invest in technological improvements and will be able to invest more heavily in developing and
adopting new technologies, which may put us at a competitive disadvantage. We may not be able to effectively implement new technology-driven products and services or be successful in marketing these products and services to our customers. As a
result, our ability to effectively compete to retain or acquire new business may be impaired, and our business, financial condition or results of operations may be adversely affected.
Conditions in the financial markets may limit our access to additional funding to meet our liquidity needs.
Liquidity is essential to our business. An inability to raise funds through deposits, borrowings or other sources could have a substantial negative effect on our liquidity. Our access to funding sources in amounts
adequate to finance our activities or the terms of which are acceptable to us could be impaired by factors that affect us specifically or the financial services industry or economy in general. Factors that could detrimentally impact our access to
liquidity sources include a decrease in the level of our business activity as a result of a downturn in the California markets in which our loans are concentrated or adverse regulatory action against us. Our ability to borrow could also be impaired
by factors that are not specific to us, such as a disruption in the financial markets or negative views and expectations about the prospects for the financial services industry. Deposit flows, calls of investment securities and wholesale borrowings,
and the prepayment of loans and mortgage-related securities are also strongly influenced by such external factors as the direction of interest rates, whether actual or perceived, and competition for deposits and loans in the markets we serve. In
particular, our liquidity position could be significantly constrained if we are unable to access funds from the FHLB-San Francisco or other wholesale funding sources, or if adequate financing is not available at acceptable interest rates. Finally, if
we are required to rely more heavily on more expensive funding sources, our revenues may not increase proportionately to cover our costs. Any decline in available funding could adversely impact our ability to originate loans, invest in securities,
meet our expenses, or fulfill obligations such as repaying our borrowings or meeting deposit withdrawal demands, any of which could, in turn, have a material adverse effect on our business, financial condition and results of operations.
47
Non-compliance with the USA PATRIOT Act, Bank Secrecy Act, or other laws and regulations could result in fines or sanctions and limit our ability to get regulatory approval of acquisitions.
The USA PATRIOT and Bank Secrecy Acts require financial institutions to develop programs to prevent financial institutions from being used for money laundering and terrorist activities. If such activities are
detected, financial institutions are obligated to file suspicious activity reports with the U.S. Treasury’s Office of Financial Crimes Enforcement Network. These rules require financial institutions to establish procedures for identifying and
verifying the identity of customers seeking to open new financial accounts. Failure to comply with these regulations could result in fines or sanctions and limit our ability to get regulatory approval of acquisitions. Several banking institutions
have received large fines for non-compliance with these laws and regulations. While we have developed policies and procedures designed to assist in compliance with these laws and regulations, no assurance can be given that these policies and
procedures will be effective in preventing violations of these laws and regulations.
Our growth or future losses may require us to raise additional capital in the future, but that capital may not be available when it is needed or the cost of that capital may be very high.
We are required by federal regulatory authorities to maintain adequate levels of capital to support our operations. Currently, we believe our capital resources satisfy our capital requirements for the foreseeable
future. However, we may at some point need to raise additional capital to support our growth.
Our ability to raise additional capital, if needed, will depend on conditions in the capital markets at that time, which are outside of our control, and on our financial condition and performance. Accordingly, we
cannot make assurances that we will be able to raise additional capital if needed on terms that are acceptable to us, or at all. If we cannot raise additional capital when needed, our ability to further expand our operations could be materially
impaired and our financial condition and liquidity could be materially and adversely affected. In addition, any additional capital we obtain may result in the dilution of the interests of existing holders of our common stock. Further, if we are
unable to raise additional capital when required by our bank regulators, we may be subject to adverse regulatory action.
Our litigation related costs might continue to increase.
The Bank is subject to a variety of legal proceedings that have arisen in the ordinary course of the Bank's business. The Bank's involvement in litigation may increase significantly, particularly related to employment
matters. The expenses of some legal proceedings will adversely affect the Bank’s results of operations until they are resolved. Further, there can be no assurance that the Bank’s loan workout and other activities will not expose the Bank to
additional legal actions, including lender liability or environmental claims. For a discussion of our pending litigation, see Item 3. “Legal Proceedings” of this Form 10-K.
Our business may be adversely affected by an increasing prevalence of fraud and other financial crimes.
As a bank, we are susceptible to fraudulent activity that may be committed against us or our clients, which may result in financial losses or increased costs to us or our customers, disclosure or misuse of our
information or our customer’s information, misappropriation of assets, privacy breaches against our customers, litigation or damage to our reputation. Such fraudulent activity may take many forms, including check fraud, electronic fraud, wire fraud,
phishing, social engineering and other dishonest acts. Nationally, reported incidents of fraud and other financial crimes have increased. We have also experienced losses due to apparent fraud and other financial crimes. While we have policies and
procedures designed to prevent such losses, there can be no assurance that such losses will not occur.
48
We are subject to certain risks in connection with our use of technology.
Our security measures may not be sufficient to mitigate the risk of a cyber attack. Communications and information systems are essential to the conduct of our business, as we
use such systems to manage our customer relationships, our general ledger and virtually all other aspects of our business. Our operations rely on the secure processing, storage, and transmission of confidential and other information in our computer
systems and networks. Although we take protective measures and endeavor to modify them as circumstances warrant, the security of our computer systems, software, and networks may be vulnerable to breaches, fraudulent or unauthorized access, denial or
degradation of service attacks, misuse, computer viruses, malware or other malicious code and cyber-attacks that could have a security impact. If one or more of these events occur, this could jeopardize our or our customers' confidential and other
information processed and stored in, and transmitted through, our computer systems and networks, or otherwise cause interruptions or malfunctions in our operations or the operations of our customers or counterparties. We may be required to expend
significant additional resources to modify our protective measures or to investigate and remediate vulnerabilities or other exposures, and we may be subject to litigation and financial losses that are either not insured against or not fully covered
through any insurance maintained by us. We could also suffer significant reputational damage.
Further, our cardholders use their debit and credit cards to make purchases from third parties or through third party processing services. As such, we are subject to risk from data breaches of such third party’s
information systems or their payment processors. Such a data security breach could compromise our account information. The payment methods that we offer also subject us to potential fraud and theft by criminals, who are becoming increasingly more
sophisticated, seeking to obtain unauthorized access to or exploit weaknesses that may exist in the payment systems. If we fail to comply with applicable rules or requirements for the payment methods we accept, or if payment-related data is
compromised due to a breach or misuse of data, we may be liable for losses associated with reimbursing our customers for such fraudulent transactions on customers’ card accounts, as well as costs incurred by payment card issuing banks and other third
parties or may be subject to fines and higher transaction fees, or our ability to accept or facilitate certain types of payments may be impaired. We may also incur other costs related to data security breaches, such as replacing cards associated with
compromised card accounts. In addition, our customers could lose confidence in certain payment types, which may result in a shift to other payment types or potential changes to our payment systems that may result in higher costs.
Breaches of information security also may occur through intentional or unintentional acts by those having access to our systems or our customers’ or counterparties’ confidential information, including employees. The
Corporation is continuously working to install new and upgrade its existing information technology systems and provide employee awareness training around ransomware, phishing, malware, and other cyber risks to further protect the Corporation against
cyber risks and security breaches.
There continues to be a rise in electronic fraudulent activity, security breaches and cyber-attacks within the financial services industry, especially in the commercial banking sector due to cyber criminals targeting
commercial bank accounts. We are regularly the target of attempted cyber and other security threats and must continuously monitor and develop our information technology networks and infrastructure to prevent, detect, address and mitigate the risk of
unauthorized access, misuse, computer viruses and other events that could have a security impact. Insider or employee cyber and security threats are increasingly a concern for companies, including ours. We are not aware that we have experienced any
material misappropriation, loss or other unauthorized disclosure of confidential or personally identifiable information as a result of a cyber-security breach or other act, however, some of our customers may have been affected by these breaches,
which could increase their risks of identity theft, debit and card fraud and other fraudulent activity that could involve their accounts with us.
Security breaches in our internet banking activities could further expose us to possible liability and damage our reputation. Increases in criminal activity levels and
sophistication, advances in computer capabilities, new discoveries, vulnerabilities in third party technologies (including browsers and operating systems) or other developments could result in a compromise or breach of the technology, processes and
controls that we use to prevent fraudulent transactions and to protect data about us, our
49
acustomers and underlying transactions. Any compromise of our security could deter customers from using our internet banking services that involve the transmission of confidential information. We rely on standard
internet security systems to provide the security and uthentication necessary to effect secure transmission of data. Although we have developed and continue to invest in systems and processes that are designed to detect and prevent security breaches
and cyber-attacks and periodically test our security, these precautions may not protect our systems from compromises or breaches of our security measures, and could result in losses to us or our customers, our loss of business and/or customers,
damage to our reputation, the incurrence of additional expenses, disruption to our business, our inability to grow our online services or other businesses, additional regulatory scrutiny or penalties, or our exposure to civil litigation and possible
financial liability, any of which could have a material adverse effect on our business, financial condition and results of operations.
Our security measures may not protect us from system failures or interruptions. While we have established policies and procedures to prevent or limit the impact of systems failures and interruptions, there can be no
assurance that such events will not occur or that they will be adequately addressed if they do. In addition, we outsource certain aspects of our data processing and other operational functions to certain third-party providers. While the Corporation
selects third-party vendors carefully, it does not control their actions. If our third-party providers encounter difficulties including those resulting from breakdowns or other disruptions in communication services provided by a vendor, failure of a
vendor to handle current or higher transaction volumes, cyber-attacks and security breaches or if we otherwise have difficulty in communicating with them, our ability to adequately process and account for transactions could be affected, and our
ability to deliver products and services to our customers and otherwise conduct business operations could be adversely impacted. Replacing these third-party vendors could also entail significant delay and expense. Threats to information security also
exist in the processing of customer information through various other vendors and their personnel. We cannot assure you that such breaches, failures or interruptions will not occur or, if they do occur, that they will be adequately addressed by us or
the third parties on which we rely. We may not be insured against all types of losses as a result of third party failures and insurance coverage may be inadequate to cover all losses resulting from breaches, system failures or other disruptions. If
any of our third-party service providers experience financial, operational or technological difficulties, or if there is any other disruption in our relationships with them, we may be required to identify alternative sources of such services, and we
cannot assure you that we could negotiate terms that are as favorable to us, or could obtain services with similar functionality as found in our existing systems without the need to expend substantial resources, if at all. Further, the occurrence of
any systems failure or interruption could damage our reputation and result in a loss of customers and business, could subject us to additional regulatory scrutiny, or could expose us to legal liability. Any of these occurrences could have a material
adverse effect on our financial condition and results of operations.
The board of directors oversees the risk management process, including the risk of cybersecurity, and engages with management on cybersecurity issues.
Our operations rely on numerous external vendors.
We rely on numerous external vendors to provide us with products and services necessary to maintain our day-to-day operations. Accordingly, our operations are exposed to risk that these vendors will not perform in
accordance with the contracted arrangements under service level agreements. The failure of an external vendor to perform in accordance with the contracted arrangements under service level agreements because of changes in the vendor’s organizational
structure, financial condition, support for existing products and services or strategic focus or for any other reason, could be disruptive to our operations, which in turn could have a material negative impact on our financial condition and results
of operations. We also could be adversely affected to the extent such an agreement is not renewed by a third party vendor or is renewed on terms less favorable to us. Additionally, the bank regulatory agencies expect financial institutions to be
responsible for all aspects of our vendors’ performance, including aspects which they delegate to third parties. Disruptions or failures in the physical infrastructure or operating systems that support our business and customers, or cyber-attacks or
security breaches of the networks, systems or devices that our customers use to access our products and services could result in customer attrition, regulatory fines, penalties or intervention, reputational damage, reimbursement or other compensation
costs, and/or additional compliance costs, any of which could materially adversely affect our results of operations or financial condition.
50
Managing reputational risk is important to attracting and maintaining customers, investors and employees.
Threats to our reputation can come from many sources, including adverse sentiment about financial institutions generally, unethical practices, employee misconduct, failure to deliver minimum standards of service or
quality, compliance deficiencies, and questionable or fraudulent activities of our customers. We have policies and procedures in place to protect our reputation and promote ethical conduct, but these policies and procedures may not be fully
effective. Negative publicity regarding our business, employees, or customers, with or without merit, may result in the loss of customers, investors and employees, costly litigation, a decline in revenues and increased governmental regulation.
Earthquakes, fires, mudslides and other natural disasters in our primary market area may result in material losses because of damage to collateral properties and borrowers' inability to repay loans.
Since our geographic concentration is in California, we are subject to earthquakes, fires, mudslides and other natural disasters. A major earthquake or other natural disaster may disrupt our business operations for an
indefinite period of time and could result in material losses, although we have not experienced any losses in many years as a result of earthquake damage or other natural disaster. Although we are in an earthquake prone area, we and other lenders
in the market area may not require earthquake insurance as a condition of making a loan. In addition to possibly sustaining damage to our own properties, if there is a major earthquake, fire, mudslide, or other natural disaster, we face the risk
that many of our borrowers may experience uninsured property losses, or sustained job interruption and/or loss which may materially impair their ability to meet the terms of their loan obligations.
Our assets as of June 30, 2019 include a deferred tax asset, the full value of which we may not be able to realize.
We recognize deferred tax assets and liabilities based on differences between the financial statement carrying amounts and the tax basis of assets and liabilities. At June 30, 2019, the net deferred tax asset was
approximately $3.5 million, a decrease from $4.2 million at the prior fiscal year end. The net deferred tax asset results primarily from (1) our provisions for loan losses recorded for financial reporting purposes, which were in the past
significantly larger than net loan charge-offs deducted for tax reporting proposes, (2) deferred compensation, (3) litigation reserves and (4) deferred loan costs.
We regularly review our deferred tax assets for recoverability based on our history of earnings, expectations for future earnings and expected timing of reversals of temporary differences. Realization of deferred tax
assets ultimately depends on the existence of sufficient taxable income, including taxable income in prior carryback years, as well as future taxable income. We believe the recorded net deferred tax asset at June 30, 2019 is fully realizable based on
our expected future earnings; however, expected future earnings may not be realized, which could impact our deferred tax assets.
Scaling back of saleable single-family mortgage loan originations could adversely affect our results of operations.
Consistent with the Corporation’s announcement to scale back the origination of saleable single-family mortgage loans and improve on its efforts to increase the volume of portfolio single-family mortgage loan
originations and purchases, we recognized non-recurring costs of $2.8 million in fiscal 2019, which is comprised of $1.7 million in salaries and employee benefits expenses (attributable to severance and other personnel expenses), $337,000 in premises
and occupancy expenses (attributable to accelerated lease expenses and accelerated depreciation of furniture and fixtures), and $758,000 in equipment expenses (attributable to termination, charge-off, or modification of data processing and other
contractual arrangements). The $2.8 million of non-recurring costs was lower than the initial estimate of $3.6 million to $4.0 million.
Although we anticipate the elimination of quarterly pre-tax losses from the saleable single-family mortgage loan operations as a result of our actions and further anticipate increases in our pre-tax income of
approximately $1.2 million per quarter, no assurance can be given as to when or whether we will realize these benefits.
51
Item 1B. Unresolved Staff Comments
None.
Item 2. Properties
At June 30, 2019, the net book value of the Bank’s property (including land and buildings) and its furniture, fixtures and equipment was $8.2 million. The Bank’s home office is located in Riverside,
California. Including the home office, the Bank has 13 retail banking offices, 12 of which are located in Riverside County in the cities of Riverside (5), Moreno Valley, Hemet, Sun City, Rancho Mirage, Corona, Temecula and Blythe. One office is
located in Redlands, San Bernardino County, California. The Bank owns six of the retail banking offices and has seven leased retail banking offices. The leases expire from 2020 to 2026.
Item 3. Legal Proceedings
Periodically, there have been various claims and lawsuits involving the Corporation, such as claims to enforce liens, condemnation proceedings on properties in which the Corporation holds security interests, claims
involving the making and servicing of real property loans, employment matters and other issues in the ordinary course of and incidental to the Corporation’s business. The Corporation is not a party to any pending legal proceedings that it believes
would have a material adverse effect on the financial condition, operations or cash flows of the Corporation, except as set forth below. Additionally, in some actions, it is difficult to assess potential exposure because the Corporation is still in
the early stages of the litigation.
McKeen-Chaplin and Neal lawsuits:
On December 17, 2012, a class and collective action lawsuit, Gina McKeen-Chaplin, individually and on behalf of others similarly situated vs. the Bank was filed in the United States District Court for the Eastern
District of California (the "Court") against the Bank claiming damages, restitution and injunctive relief for alleged misclassification of certain employees as exempt rather than non-exempt, resulting in a failure to pay appropriate overtime
compensation, to provide meal and rest periods, to pay waiting time penalties and to provide accurate wage statements (the “McKeen-Chaplin lawsuit”).
On May 22, 2013, counsel in the McKeen-Chaplin lawsuit filed another class action called Neal vs. Provident Savings Bank, F.S.B. (the “Neal lawsuit”) in California Superior Court in Alameda County (the "State Court").
The Neal lawsuit is virtually identical to the McKeen-Chaplin lawsuit alleging that mortgage underwriters were misclassified as exempt employees.
On August 12, 2015, the Court issued an order denying the plaintiffs' motion for summary judgment and granting the Bank's motion for summary judgment affirming that the plaintiffs were properly classified as exempt
employees and denying the federal claims under the Fair Labor Standards Act (“FSLA”). On August 18, 2015, the plaintiffs filed an appeal to the order. On July 5, 2017, the United States Court of Appeals for the Ninth Circuit (the “Ninth Circuit”)
reversed the Court’s ruling granting the Bank's motion for summary judgment, instead ruling the plaintiffs were improperly classified as exempt employees and were entitled to overtime compensation. The Ninth Circuit remanded the case back to the
Court with instructions to enter summary judgement in favor of the plaintiffs. As a result of the Ninth Circuit’s unfavorable ruling, the Bank filed on September 7, 2017, a petition for writ of certiorari to the United States Supreme Court, which was
denied on November 27, 2017.
On December 18, 2017, the Bank entered into a Memorandum of Understanding with the plaintiffs' representatives to memorialize an agreement in principle to settle the pending McKeen-Chaplin and Neal lawsuits. The
Memorandum of Understanding assumes class certification for purposes of the settlement only and provides for an aggregate settlement payment
52
by the Bank of $1.8 million, which includes all settlement funds, the named plaintiff service payments, and class counsel's attorneys' fees and costs. Any additional costs and expenses related to employer-side payroll
taxes will be paid by the Bank. The parties subsequently successfully negotiated and executed a mutually acceptable long-form settlement agreement.
On February 21, 2018, plaintiffs filed a motion in McKeen-Chaplin asking the Court to approve the FLSA portion of the settlement agreement. The parties also worked together to jointly request that the Court of Appeal
in the Neal lawsuit pass jurisdiction back to the State Court to oversee the settlement process, which was preliminary approved on May 15, 2018. Subsequently, on July 18, 2018 the Court approved the FLSA portion of the settlement which allowed the
parties to begin the process of providing notice of the settlement to class members. The State Court had already granted preliminary approval of the state law class settlement in the Neal lawsuit.
The Bank’s decision to settle these lawsuits was the result of the unfavorable ruling by the United States Supreme Court in the McKeen-Chaplin lawsuit and the significant legal costs, distraction from day-to-day
operating activities and substantial resources that would be required to defend the Bank in protracted litigation if the Neal lawsuit would proceed. In addition, the Bank determined that the settlement would reduce the Bank's potential exposure to
damages, penalties, fines and plaintiffs' legal fees in the event of an unfavorable outcome in the Neal lawsuit. The settlement includes the dismissal of all claims against the Bank and related parties in the McKeen-Chaplin and Neal lawsuits without
any admission of liability or wrongdoing attributed to the Bank.
Based on the proposed settlement, the Corporation recorded a litigation settlement expense accrual of $650,000 in the second quarter of fiscal 2018 to fully reserve for the agreed upon settlement amount.
On November 13, 2018, the State Court approved the motion for final approval of the settlement agreement in the two class and collective action lawsuits filed by McKeen-Chaplin and Neal, respectively, against the Bank.
Following the grant of the final approval, the Court in McKeen-Chaplin dismissed the case. The settlement funds have been distributed to the plaintiffs and plaintiff’s counsel consistent with the settlement agreements. On April 8, 2019, the State
Court signed an order closing and dismissing the cases. The McKeen-Chaplin and Neal cases are now completed and dismissed.
Cannon lawsuit:
On August 6, 2015, a former employee, Christina Cannon, filed a lawsuit called Cannon vs. the Bank in the California Superior Court for the County of San Bernardino (the “Cannon lawsuit”). Cannon seeks to represent a
class of all non-exempt employees in a class action lawsuit brought under California’s Unfair Competition Law, Business & Professions Code section 17200. The underlying claims include unpaid overtime (including off-the-clock work), meal and rest
period violations, minimum wage violations, and failure to reimburse business expenses. On September 8, 2017, the attorneys for the plaintiffs in the Cannon lawsuit sent notification to the Bank and to the California Labor & Workforce Development
Agency informing them of their intent to bring a claim under the Private Attorneys’ General Act of 2004 (“PAGA”) on behalf of all non-exempt employees and covering a variety of alleged wage and hour violations. On September 12, 2017, the Bank entered
into a Memorandum of Understanding with the plaintiffs’ representatives to memorialize an agreement in principle to settle the pending Cannon lawsuit. The Memorandum of Understanding assumes class certification for purposes of the settlement only and
provides for an aggregate settlement payment by the Bank of up to $2.8 million, which includes all settlement funds, the class representative enhancement award, settlement administrator’s expenses, any employer-side payroll taxes, and class counsel’s
attorneys’ fees and costs. The Bank’s decision to settle this matter was the result of the significant legal costs, distraction from day-to-day operating activities and substantial resources that would be required to defend the Bank in protracted
litigation. In addition, the Bank determined that the settlement would reduce the Bank’s potential exposure to damages, penalties, fines and plaintiffs’ legal fees in the event of an unfavorable outcome in a court trial. The settlement includes the
dismissal of all claims against the Bank and related parties in the Cannon lawsuit and claim under the PAGA, without any admission of liability or wrongdoing attributed to the Bank. Because of the uncertainty surrounding this litigation, no
litigation reserve had been previously established by the Bank resulting in the full $2.8 million settlement expense being recognized in the first quarter of fiscal 2018.
53
On December 20, 2018, counsel in the Cannon lawsuit filed a Motion for Preliminary Approval of the Settlement in the California Superior Court for the County of San Bernardino. On April 12, 2019, this court granted
preliminary approval of the settlement.
On July 24, 2019, the California Superior Court for the County of San Bernardino, California granted final approval of the settlement in the Cannon vs. Bank lawsuit. On July 26, 2019, the final order was signed by this
court and on August 6, 2019, the Bank forwarded the settlement amount to the class administrator. The total settlement may be slightly reduced.
The Corporation is not a party to any other pending legal proceedings that it believes would have a material adverse effect on the financial condition, operations and cash flows of the Corporation.
Item 4. Mine Safety Disclosures
Not applicable.
PART II
Item 5. Market for Registrant’s Common Equity, Related Stockholder Matters and Issuer Purchases of Equity Securities
The common stock of Provident Financial Holdings, Inc. is listed on the NASDAQ Global Select Market under the symbol PROV. At June 30, 2019, there were 7,486,106 shares of common stock issued and outstanding held by
414 shareholders of record, and there were approximately 1,613 persons or entities that hold stock in nominee or “street name” accounts with brokers.
The Corporation repurchases its common stock consistent with Board-approved stock repurchase plans. During the quarter ended June 30, 2019, the Corporation purchased 28,251 shares of the Corporation’s common stock at
an average cost of $20.06 per share. For the fiscal year ended June 30, 2019, the Corporation purchased 51,999 shares of the Corporation’s common stock at an average cost of $19.74 per share. As of June 30, 2019, a total of 51,999 shares or 14
percent of the shares authorized in the April 2018 stock repurchase plan have been purchased at an average cost of $19.74 per share, leaving 321,001 shares available for future purchases.
During the quarter ended June 30, 2019, the Corporation issued 17,000 shares of common stock consistent with the exercise of certain stock options and no shares of restricted common stock vested. The Corporation did
not purchase any shares from recipients to fund their withholding tax obligations in the fourth quarter of fiscal 2019.
For the fiscal year ended June 30, 2019, the Corporation issued 48,250 shares of common stock consistent with the exercise of certain stock options and 89,500 shares of restricted common stock vested. The Corporation
purchased 21,071 shares at an average price of $18.28 per share from recipients to fund their withholding tax obligations in fiscal 2019. During the quarter and fiscal year ended June 30, 2019, the Corporation did not sell any securities that were
not registered under the Securities Act of 1933.
54
The table below sets forth information regarding the Corporation’s purchases of its common stock during the fourth quarter of fiscal 2019.
|
Period
|
(a) Total Number of
Shares Purchased
|
(b) Average Price
Paid per Share
|
(c) Total Number of
Shares Purchased as
Part of Publicly
Announced Plan
|
(d) Maximum
Number of Shares
that May Yet Be
Purchased Under
the Plan (1)
|
|||||
|
April 1, 2019 – April 30, 2019
|
—
|
$
|
—
|
—
|
349,252
|
||||
|
May 1, 2019 – May 31, 2019
|
4,483
|
$
|
20.18
|
4,483
|
344,769
|
||||
|
June 1, 2019 – June 30, 2019
|
23,768
|
$
|
20.04
|
23,768
|
321,001
|
||||
|
Total
|
28,251
|
$
|
20.06
|
28,251
|
321,001
|
||||
|
(1)
|
Represents the remaining shares available for future purchases under the April 2018 stock repurchase plan.
|
55
Performance Graph
The following graph compares the cumulative total shareholder return on the Corporation’s common stock with the cumulative total return of the Nasdaq Stock Index (U.S. Stock) and Nasdaq Bank Index. Total return
assumes the reinvestment of all dividends.
|
6/30/2014
|
6/30/2015
|
6/30/2016
|
6/30/2017
|
6/30/2018
|
6/30/2019
|
|||||||||||||
|
PROV
|
$
|
100.00
|
$
|
118.52
|
$
|
133.23
|
$
|
144.05
|
$
|
147.14
|
$
|
166.74
|
||||||
|
NASDAQ Stock Index
|
$
|
100.00
|
$
|
107.13
|
$
|
109.063
|
$
|
130.03
|
$
|
149.33
|
$
|
162.76
|
||||||
|
NASDAQ Bank Index
|
$
|
100.00
|
$
|
112.73
|
$
|
99.53
|
$
|
145.89
|
$
|
161.76
|
$
|
160.99
|
||||||
|
(1) Assumes that the value of the investment in the Corporation’s common stock and each index was $100 on June 30, 2014 and that all
dividends were reinvested.
|
For additional information, see Part III, Item 12 of this Form 10-K for information regarding the Corporation’s Equity Compensation Plans, which is incorporated into this Item 5 by reference.
Item 6. Selected Financial Data
The information contained under the heading “Financial Highlights” in the Corporation’s Annual Report to Shareholders included as Exhibit 13 to this Form 10-K and is incorporated herein by reference.
56
Item 7. Management’s Discussion and Analysis of Financial Condition and Results of Operations
Safe-Harbor Statement
Certain matters in this Form 10-K constitute forward-looking statements within the meaning of the Private Securities Litigation Reform Act of 1995. This Form 10-K contains statements that the Corporation believes are
“forward-looking statements.” These statements relate to the Corporation’s financial condition, liquidity, results of operations, plans, objectives, future performance or business. When considering these forward-looking statements, you should keep
in mind these risks and uncertainties, as well as any cautionary statements the Corporation may make. Moreover, you should treat these statements as speaking only as of the date they are made and based only on information then actually known to the
Corporation. There are a number of important factors that could cause future results to differ materially from historical performance and these forward-looking statements. Factors which could cause actual results to differ materially include, but
are not limited to the following: the possibility that the actual costs incurred from our scaling back the saleable mortgage business will be materially different from the non-recurring expenses recorded in this report; the credit risks of lending
activities, including changes in the level and trend of loan delinquencies and charge-offs and changes in our allowance for loan losses and provision for loan losses that may be impacted by deterioration in the residential and commercial real estate
markets and may lead to increased losses and non-performing assets and may result in our allowance for loan losses not being adequate to cover actual losses and require us to materially increase our reserve; changes in general economic conditions,
either nationally or in our market areas; changes in the levels of general interest rates, and the relative differences between short and long term interest rates, deposit interest rates, our net interest margin and funding sources; fluctuations in
the demand for loans, the number of unsold homes, land and other properties and fluctuations in real estate values in our market areas; secondary market conditions for loans and our ability to sell loans in the secondary market; results of
examinations of the Corporation by the FRB or of the Bank by the OCC or other regulatory authorities, including the possibility that any such regulatory authority may, among other things, require us to enter into a formal enforcement action or to
increase our allowance for loan losses, write-down assets, change our regulatory capital position or affect our ability to borrow funds or maintain or increase deposits, or impose additional requirements and restrictions on us, any of which could
adversely affect our liquidity and earnings; legislative or regulatory changes that adversely affect our business including changes in regulatory policies and principles, including the interpretation of regulatory capital or other rules, including as
a result of Basel III; the impact of the Dodd-Frank Wall Street Reform and Consumer Protection Act and the implementing regulations; the availability of resources to address changes in laws, rules, or regulations or to respond to regulatory actions;
adverse changes in the securities markets; our ability to attract and retain deposits; increases in premiums for deposit insurance; our ability to control operating costs and expenses; the use of estimates in determining fair value of certain of our
assets, which estimates may prove to be incorrect and result in significant declines in valuation; difficulties in reducing risk associated with the loans on our balance sheet; staffing fluctuations in response to product demand or the implementation
of corporate strategies that affect our workforce and potential associated charges; disruptions, security breaches, or other adverse events, failures or interruptions in, or attacks on, our information technology systems or on the third-party vendors
who perform several of our critical processing functions; our ability to implement our branch expansion strategy; our ability to successfully integrate any assets, liabilities, customers, systems, and management personnel we have acquired or may in
the future acquire into our operations and our ability to realize related revenue synergies and cost savings within expected time frames and any goodwill charges related thereto; our ability to manage loan delinquency rates; our ability to retain key
members of our senior management team; costs and effects of litigation, including settlements and judgments; increased competitive pressures among financial services companies; changes in consumer spending, borrowing and savings habits; the
availability of resources to address changes in laws, rules, or regulations or to respond to regulatory actions; our ability to pay dividends on our common stock; adverse changes in the securities markets; the inability of key third-party providers
to perform their obligations to us; changes in accounting policies and practices, as may be adopted by the financial institution regulatory agencies or the Financial Accounting Standards Board, including additional guidance and interpretation on
accounting issues and details of the implementation of new accounting methods; war or terrorist activities; and other economic, competitive, governmental, regulatory, and technological factors affecting our operations, pricing, products and services
and other risks detailed in this report and in the Corporation’s other reports filed with or furnished to the SEC. These developments could have an adverse impact on our financial position and our results of operations. Forward-looking statements
57
General
Provident Financial Holdings, Inc., a Delaware corporation, was organized in January 1996 for the purpose of becoming the holding company of Provident Savings Bank, F.S.B. upon the Bank’s conversion from a federal
mutual to a federal stock savings bank (“Conversion”). The Conversion was completed on June 27, 1996. The Corporation is regulated by the Federal Reserve Board (“FRB”). At June 30, 2019, the Corporation had total assets of $1.08 billion, total
deposits of $841.3 million and total stockholders’ equity of $120.6 million. The Corporation has not engaged in any significant activity other than holding the stock of the Bank. Accordingly, the information set forth in this report, including
financial statements and related data, relates primarily to the Bank and its subsidiaries. As used in this report, the terms “we,” “our,” “us,” and “Corporation” refer to Provident Financial Holdings, Inc. and its consolidated subsidiaries, unless
the context indicates otherwise.
The Bank, founded in 1956, is a federally chartered stock savings bank headquartered in Riverside, California. The Bank is regulated by the OCC, its primary federal regulator, and the Federal Deposit Insurance
Corporation (“FDIC”), the insurer of its deposits. The Bank’s deposits are federally insured up to applicable limits by the FDIC. The Bank has been a member of the Federal Home Loan Bank System since 1956.
The Corporation operates in a single business segment through the Bank. The Bank's activities include attracting deposits, offering banking services and originating and purchasing single-family, multi-family,
commercial real estate, construction and, to a lesser extent, other mortgage, commercial business and consumer loans. Deposits are collected primarily from 13 banking locations located in Riverside and San Bernardino counties in California.
Additional activities have included originating saleable single-family loans, primarily fixed-rate first mortgages. Loans are primarily originated and purchased in Southern and Northern California. There are various risks inherent in the
Corporation’s business including, among others, the general business environment, interest rates, the California real estate market, the demand for loans, the prepayment of loans, the repurchase of loans previously sold to investors, the secondary
market conditions to sell loans, competitive conditions, legislative and regulatory changes, fraud and other risks.
The Corporation began to distribute quarterly cash dividends in the quarter ended September 30, 2002. On July 31, 2019, the Corporation declared a quarterly cash dividend of $0.14 per share. The Corporation’s
shareholders of record at the close of business on August 20, 2019 will receive the cash dividend, which is payable on September 10, 2019. Future declarations or payments of dividends will be subject to the consideration of the Corporation’s Board
of Directors, which will take into account the Corporation’s financial condition, results of operations, tax considerations, capital requirements, industry standards, legal restrictions, economic conditions and other factors, including the regulatory
restrictions which affect the payment of dividends by the Bank to the Corporation. Under Delaware law, dividends may be paid either out of surplus or, if there is no surplus, out of net profits for the current fiscal year and/or the preceding fiscal
year in which the dividend is declared.
Management’s Discussion and Analysis of Financial Condition and Results of Operations is intended to assist in understanding the financial condition and results of operations of the Corporation. The information
contained in this section should be read in conjunction with the audited Consolidated Financial Statements and accompanying selected Notes to Consolidated Financial Statements included in Item 8 of this Form 10-K.
58
Critical Accounting Policies
The discussion and analysis of the Corporation’s financial condition and results of operations is based upon the Corporation’s consolidated financial statements, which have been prepared in accordance with accounting
principles generally accepted in the United States of America. The preparation of these financial statements requires management to make estimates and judgments that affect the reported amounts of assets and liabilities, revenues and expenses, and
related disclosures of contingent assets and liabilities at the date of the consolidated financial statements. Actual results may differ from these estimates under different assumptions or conditions.
The allowance for loan losses involves significant judgment and assumptions by management, which has a material impact on the carrying value of net loans held for investment. Management considers the accounting
estimate related to the allowance for loan losses a critical accounting estimate because it is highly susceptible to change from period to period, requiring management to make assumptions about probable incurred losses inherent in the loans held for
investment at the date of the Consolidated Statements of Financial Condition. The impact of a sudden large loss could deplete the allowance and require increased provisions to replenish the allowance, which would negatively affect earnings.
The allowance is based on two principles of accounting: (i) ASC 450, “Contingencies,” which requires that losses be accrued when they are probable of occurring and can be estimated; and (ii) ASC 310,
“Receivables.” The allowance has two components: collectively evaluated allowances and individually evaluated allowances on loans held for investment. Each of these components is based upon estimates that can change over time. The allowance is
based on historical experience and as a result can differ from actual losses incurred in the future. Additionally, differences may result from changes to qualitative factors such as unemployment data, gross domestic product, interest rates, retail
sales, the value of real estate and real estate market conditions. The historical data is reviewed at least quarterly and adjustments are made as needed. Various techniques are used to arrive at an individually evaluated allowance, including
discounted cash flows and the fair market value of collateral. Management considers, based on currently available information, the allowance for loan losses sufficient to absorb probable losses inherent in loans held for investment. The use of
these techniques is inherently subjective and the actual losses could be greater or less than the estimates, which, can materially affect amounts recognized in the Consolidated Statements of Financial Condition and Consolidated Statements of
Operations.
The Corporation assesses loans individually and classifies loans when the accrual of interest has been discontinued, loans have been restructured or management has serious doubts about the future collectibility of
principal and interest, even though the loans may currently be performing. Factors considered in determining classification include, but are not limited to, expected future cash flows, the financial condition of the borrower and current economic
conditions. The Corporation measures each non-performing loan based on the fair value of its collateral, less selling costs, or discounted cash flow and charges off those loans or portions of loans deemed uncollectible.
Non-performing loans are charged-off to their fair values in the period the loans, or portion thereof, are deemed uncollectible, generally after the loan becomes 150 days delinquent for real estate secured first trust
deed loans and 120 days delinquent for commercial business or real estate secured second trust deed loans. For restructured loans, the charge-off occurs when the loan becomes 90 days delinquent; and where borrowers file bankruptcy, the charge-off
occurs when the loan becomes 60 days delinquent. The amount of the charge-off is determined by comparing the loan balance to the estimated fair value of the underlying collateral, less disposition costs, with the loan balance in excess of the
estimated fair value charged-off against the allowance for loan losses. The allowance for loan losses for non-performing loans is determined by applying ASC 310. For restructured loans that are less than 90 days delinquent, the allowance for loan
losses are segregated into (a) individually evaluated allowances for those loans with applicable discounted cash flow calculations still in their restructuring period, classified lower than pass and, containing an embedded loss component or (b)
collectively evaluated allowances based on the aggregated pooling method. For non-performing loans less than 60 days delinquent where the borrower has filed bankruptcy, the collectively evaluated allowances are assigned based on the aggregated
pooling method. For non-performing commercial
59
real estate loans, an individually evaluated allowance is calculated based on the loan's fair value and if the fair value is higher than the individual loan balance, no allowance is required.
A troubled debt restructuring (“restructured loan”) is a loan which the Corporation, for reasons related to a borrower’s financial difficulties, grants a concession to the borrower that the Corporation would not
otherwise consider.
The loan terms which have been modified or restructured due to a borrower’s financial difficulty, include but are not limited to:
|
•
|
A reduction in the stated interest rate.
|
|
•
|
An extension of the maturity at an interest rate below market.
|
|
•
|
A reduction in the accrued interest.
|
|
•
|
Extensions, deferrals, renewals and rewrites.
|
The Corporation measures the allowance for loan losses of restructured loans based on the difference between the original loan’s carrying amount and the present value of expected future cash flows discounted at the
original effective yield of the loan. Based on published guidance with respect to restructured loans from certain banking regulators and to conform to general practices within the banking industry, the Corporation determined it was appropriate to
maintain certain restructured loans on accrual status because there is reasonable assurance of repayment and performance, consistent with the modified terms based upon a current, well-documented credit evaluation.
Other restructured loans are classified as “Substandard” and placed on non-performing status. The loans may be upgraded and placed on accrual status once there is a sustained period of payment performance (usually six
months or, for loans that have been restructured more than once, 12 months) and there is a reasonable assurance that the payments will continue; and if the borrower has demonstrated satisfactory contractual payments beyond 12 consecutive months, the
loan is no longer categorized as a restructured loan. In addition to the payment history described above, multi-family, commercial real estate, construction and commercial business loans must also demonstrate a combination of corroborating
characteristics to be upgraded, such as: satisfactory cash flow, satisfactory guarantor support, and additional collateral support, among others.
To qualify for restructuring, a borrower must provide evidence of their creditworthiness such as, current financial statements, their most recent income tax returns, current paystubs, current W-2s, and most recent bank
statements, among other documents, which are then verified by the Corporation. The Corporation re-underwrites the loan with the borrower’s updated financial information, new credit report, current loan balance, new interest rate, remaining loan
term, updated property value and modified payment schedule, among other considerations, to determine if the borrower qualifies.
Interest is not accrued on any loan when its contractual payments are more than 90 days delinquent or if the loan is deemed impaired. In addition, interest is not recognized on any loan where management has determined
that collection is not reasonably assured. A non-performing loan may be restored to accrual status when delinquent principal and interest payments are brought current and future monthly principal and interest payments are expected to be collected.
When a loan is categorized as non-performing, all previously accrued but uncollected interest is reversed in the current operating results. When a full recovery of the outstanding principal loan balance is in doubt,
subsequent payments received are first applied as a recovery of principal charged-off and then to unpaid principal. This is referred to as the cost recovery method. A loan may be returned to accrual status at such time as the loan is brought fully
current as to both principal and interest, and, in management’s judgment, such loan is considered to be fully collectible on a timely basis. However, the Corporation’s policy also allows management to continue the recognition of interest income on
certain non-performing loans. This is referred to as the cash basis method under which the accrual of interest is suspended and interest income is recognized only when collected. This policy applies to non-performing loans that are considered to be
fully collectible but the timely collection of payments is in doubt.
60
Management accounts for income taxes by estimating future tax effects of temporary differences between the tax and book basis of assets and liabilities considering the provisions of enacted tax laws. These differences
result in deferred tax assets and liabilities, which are included in the Corporation’s Consolidated Statements of Financial Condition. The application of income tax law is inherently complex. Laws and regulations in this area are voluminous and are
often ambiguous. As such, management is required to make many subjective assumptions and judgments regarding the Corporation’s income tax exposures, including judgments in determining the amount and timing of recognition of the resulting deferred
tax assets and liabilities, including projections of future taxable income. Interpretations of and guidance surrounding income tax laws and regulations change over time. As such, changes in management’s subjective assumptions and judgments can
materially affect amounts recognized in the Consolidated Statements of Financial Condition and Consolidated Statements of Operations. Therefore, management considers its accounting for income taxes a critical accounting policy.
On February 4, 2019, the Corporation announced that it was in the best interests of the Corporation to scale back the saleable single-family mortgage loan originations and improve on its efforts to increase the volume
of portfolio single-family mortgage loan originations and purchases. For additional information, see “Loan Originations” in this Form 10-K. The Corporation recognized during fiscal 2019 non-recurring costs of $2.80 million, which is comprised of
$1.70 million in salaries and employee benefits expenses (attributable to severance and other personnel expenses), $337,000 in premises and occupancy expenses (attributable to accelerated lease expenses and accelerated depreciation of furniture and
fixtures), and $758,000 in equipment expenses (attributable to termination, charge-off, or modification of data processing and other contractual arrangements).
The Bank has not abandoned its single-family mortgage operations as the Bank is improving on its efforts to increase the volume of portfolio single-family mortgage loan originations and purchases in the same geographic
area, using the same underwriting criteria through the same origination channels. The Bank has chosen to scale back originations of salable single-family mortgage loans, which is similar to previous decisions where the Bank has grown or retrenched
the business given changing market opportunities. The Bank did not contemplate a permanent shut down of the single-family mortgage operations given its ongoing importance to the consolidated results of the Bank over time. Management believes these
facts support the Bank’s position that the single-family mortgage business is a cyclical business which requires changes as a result of changing market conditions. Therefore, the Bank has determined that the scaling back of salable single-family loan
originations and increasing its efforts to generate more portfolio single-family mortgage originations and purchases do not represent the abandonment of a business, and as such, all operating results continue to be reported as continuing operations.
Executive Summary and Operating Strategy
Provident Savings Bank, F.S.B., established in 1956, is a financial services company committed to serving consumers and small to mid-sized businesses in the Inland Empire region of Southern California. The Bank
conducts its business operations as Provident Bank and through its subsidiary, Provident Financial Corp. The business activities of the Corporation, primarily through the Bank and its subsidiary, consist of community banking and, to a lesser degree,
investment services for customers and trustee services on behalf of the Bank.
Community banking operations primarily consist of accepting deposits from customers within the communities surrounding the Corporation’s full service offices and investing those funds in single-family, multi-family and
commercial real estate loans. Also, to a lesser extent, the Corporation makes construction, commercial business, consumer and other mortgage loans. The primary source of income in community banking is net interest income, which is the difference
between the interest income earned on loans and investment securities, and the interest expense paid on interest-bearing deposits and borrowed funds. Additionally, certain fees are collected from depositors, such as returned check fees, deposit
account service charges, ATM fees, IRA/KEOGH fees, safe deposit box fees, wire transfer fees and overdraft protection fees, among others.
61
During the next three years, subject to market conditions, the Corporation intends to improve its community banking business by moderately increasing total assets; by increasing single-family, multi-family, commercial
real estate, construction and commercial business loans. In addition, the Corporation intends to decrease the percentage of time deposits in its deposit base and to increase the percentage of lower cost checking and savings accounts. This strategy
is intended to improve core revenue through a higher net interest margin and ultimately, coupled with the growth of the Corporation, an increase in net interest income. While the Corporation’s long-term strategy is for moderate growth, management
recognizes that growth may not occur as a result of weaknesses in general economic conditions.
Saleable single-family mortgage loan operations primarily consist of the origination and sale of mortgage loans secured by single-family residences. The primary sources of income in the saleable mortgage loan
operations are gain on sale of loans and certain fees collected from borrowers in connection with the loan origination process. On February 4, 2019, the Corporation announced that it was in the best interests of the Corporation to scale back the
saleable single-family mortgage loan originations and improve on its efforts to increase the volume of portfolio single-family mortgage loan originations.
Investment services operations primarily consist of selling alternative investment products such as annuities and mutual funds to the Bank’s depositors. Investment services and trustee services contribute a very small
percentage of gross revenue.
Provident Financial Corp performs trustee services for the Bank’s real estate secured loan transactions and has in the past held, and may in the future hold, real estate for investment.
There are a number of risks associated with the business activities of the Corporation, many of which are beyond the Corporation’s control, including: changes in accounting principles, laws, regulation, interest rates
and the economy, among others. The Corporation attempts to mitigate many of these risks through prudent banking practices, such as interest rate risk management, credit risk management, operational risk management, and liquidity risk
management. The California economic environment presents heightened risk for the Corporation primarily with respect to real estate values and loan delinquencies. Since the majority of the Corporation’s loans are secured by real estate located within
California, significant declines in the value of California real estate may also inhibit the Corporation’s ability to recover on defaulted loans by selling the underlying real estate. For further details on risk factors and uncertainties, see
“Safe-Harbor Statement” included above in this item 7, and Item 1A, "Risk Factors.”
Off-Balance Sheet Financing Arrangements
Commitments and Derivative Financial Instruments. The Corporation is a party to financial instruments with off-balance sheet risk in the normal course of business to meet the
financing needs of its customers. These financial instruments include commitments to extend credit, in the form of originating loans or providing funds under existing lines of credit, loan sale agreements to third parties and option
contracts. These instruments involve, to varying degrees, elements of credit and interest-rate risk in excess of the amount recognized in the accompanying Consolidated Statements of Financial Condition. The Corporation’s exposure to credit loss, in
the event of non-performance by the counterparty to these financial instruments, is represented by the contractual amount of these instruments. The Corporation uses the same credit policies in entering into financial instruments with off-balance
sheet risk as it does for on-balance sheet instruments. For a discussion on commitments and derivative financial instruments, see Note 15 of the Notes to Consolidated Financial Statements included in Item 8 of this Form 10-K.
Off-balance sheet arrangements. The Bank is a party to financial instruments with off-balance sheet risk in the normal course of business to meet the financing needs of its
customers. These financial instruments include commitments to extend credit, in the form of originating loans or providing funds under existing lines of credit, loan sale commitments to investors, To-Be-Announced ("TBA") Mortgage-Backed-Securities
("MBS") trades and option contracts. These instruments involve, to varying degrees, elements of credit and interest-rate risk in excess of the amount recognized in the accompanying Consolidated
62
Statements of Financial Condition. The Bank's exposure to credit loss, in the event of non-performance by the counter party to these financial instruments, is represented by the contractual amount of these
instruments. The Bank uses the same credit policies in making commitments to extend credit as it does for on-balance sheet instruments. As of June 30, 2019 and 2018, these commitments were $4.3 million and $66.3 million, respectively. For a
discussion on financial instruments with off-balance sheet risks, see Note 15 of the Notes to Consolidated Financial Statements included in Item 8 of this Form 10-K.
Comparison of Financial Condition at June 30, 2019 and 2018
Total assets decreased $90.7 million, or 8%, to $1.08 billion at June 30, 2019 from $1.18 billion at June 30, 2018. The decrease was primarily attributable to decreases in loans held for sale and, to a lesser extent,
loans held for investment, partly offset by an increase in cash and cash equivalents.
Total cash and cash equivalents, primarily excess cash deposited with the Federal Reserve Bank of San Francisco, increased $27.3 million, or 63%, to $70.6 million at June 30, 2019 from $43.3 million at June 30,
2018. The increase was primarily attributable to the decreases in loans held for sale and loans held for investment, partly offset by decreases in customer deposits and borrowings. The balance of cash and cash equivalents at June 30, 2019 was
consistent with the Corporation’s strategy of adequately managing credit and liquidity risk.
Total investment securities (held to maturity and available for sale) increased $4.8 million, or 5%, to $100.1 million at June 30, 2019 from $95.3 million at June 30, 2018. The increase was primarily the result of
purchases of mortgage-backed securities held to maturity, partly offset by scheduled and accelerated principal payments on mortgage-backed securities. For further analysis on investment securities, see Note 2 of the Notes to Consolidated Financial
Statements included in Item 8 of this Form 10-K.
Loans held for investment decreased $22.8 million, or 3% to $879.9 million at June 30, 2019 from $902.7 million at June 30, 2018. In fiscal 2019, the Corporation originated $120.2 million of loans held for investment,
consisting primarily of single-family, multi-family and commercial real estate loans, compared to $186.4 million, consisting primarily of single-family, multi-family and commercial real estate loans, for the same period last year. In addition, the
Corporation purchased $51.1 million of loans to be held for investment (primarily single-family and multi-family loans) in fiscal 2019, compared to $13.5 million of purchased loans to be held for investment (primarily multi-family loans) in fiscal
2018. Total loan principal payments in fiscal 2019 were $195.4 million, compared to $208.5 million in fiscal 2018. There was no REO acquired in the settlement of loans in fiscal 2019 as compared to $2.2 million in fiscal 2018. The balance of
multi-family, commercial real estate, construction and commercial business loans, net of undisbursed loan funds, decreased 6% to $556.1 million at June 30, 2019 from $589.4 million at June 30, 2018, and represented 63% and 65% of loans held for
investment, respectively. The balance of single-family loans held for investment increased $10.2 million, or 3%, to $325.0 million at June 30, 2019, from $314.8 million at June 30, 2018.
There were no loans held for sale at June 30, 2019 as compared to $96.3 million at June 30, 2018. The decrease was primarily due to the Corporation’s decision to scale back the saleable single-family mortgage loan
originations and improve on its efforts to increase the volume of portfolio single-family mortgage loan originations. Total loans originated for sale decreased $718.9 million, or 61%, to $467.1 million in fiscal 2019 from $1.19 billion in fiscal
2018.
Total deposits decreased $66.3 million, or 7%, to $841.3 million at June 30, 2019 from $907.6 million at June 30, 2018. Time deposits decreased $44.5 million, or 19%, to $193.1 million at June 30, 2019 from $237.6
million at June 30, 2018; while transaction accounts decreased $21.9 million, or 3%, to $648.1 million at June 30, 2019 from $670.0 million at June 30, 2018. As of June 30, 2019 and 2018, the percentage of transaction accounts to total deposits was
77% and 74%, respectively. The change in deposit mix was consistent with the Corporation’s marketing strategy to promote transaction accounts and the
63
strategic decision to increase the percentage of lower cost checking and savings accounts in its deposit base and decrease the percentage of time deposits by competing less aggressively for time deposits.
Borrowings, consisting of FHLB – San Francisco advances decreased $25.1 million, or 20%, to $101.1 million at June 30, 2019 from $126.2 million at June 30, 2018. The decrease was due to the maturity of short-term
advances and the prepayment of a long-term advance during fiscal 2019. The weighted-average maturity of the Corporation’s FHLB – San Francisco advances was approximately 44 months at June 30, 2019, down from 46 months at June 30, 2018.
Total stockholders’ equity increased slightly to $120.6 million at June 30, 2019 from $120.5 million at June 30, 2018, primarily as a result of net income and the amortization of stock-based compensation benefits in
fiscal 2019, partly offset by stock repurchases (see Part II, Item 2, “Unregistered Sales of Equity Securities and Use of Proceeds” of this Form 10-K) and quarterly cash dividends paid to shareholders.
Comparison of Operating Results for the Years Ended June 30, 2019 and 2018
General. The Corporation recorded net income of $4.4 million, or $0.58 per diluted share, for the fiscal year ended June 30, 2019, up $2.3 million, or 109%, from $2.1 million,
or $0.28 per diluted share, for the fiscal year ended June 30, 2018. The increase in net income in fiscal 2019 was primarily attributable to the $1.8 million net tax charge resulting from the revaluation of net deferred tax assets consistent with the
Tax Act recorded in fiscal 2018 and not replicated in fiscal 2019, while a decrease in non-interest expense and an increase in net interest income, was virtually offset by a decrease in non-interest income. The Corporation's efficiency ratio, defined
as non-interest expense divided by the sum of net interest income and non-interest income, improved slightly to 89% in fiscal 2019 from 91% in fiscal 2018. Return on average assets in fiscal 2019 increased to 0.39% from 0.18% in fiscal 2018 and
return on average stockholders' equity in fiscal 2019 increased to 3.63% from 1.73% in fiscal 2018.
Net Interest Income. Net interest income increased $1.9 million, or 5%, to $38.2 million in fiscal 2019 from $36.3 million in fiscal 2018. This increase resulted from an
increase in the net interest margin, partly offset by a decrease in the average balance of interest-earning assets. The net interest margin increased 28 basis points to 3.47% in fiscal 2019 from 3.19% in fiscal 2018, due to a 28 basis point increase
in the average yield on interest-earning assets, partially offset by a one basis point increase in the average cost of interest-bearing liabilities. The average balance of interest-earning assets decreased $39.2 million, or 3%, to $1.10 billion in
fiscal 2019 from $1.14 billion in fiscal 2018.
Interest Income. Total interest income increased $1.7 million, or 4%, to $44.4 million for fiscal 2019 from $42.7 million for fiscal 2018. The increase was primarily due to
higher interest income on investment securities and interest-earning deposits. The average yield on interest-earning assets increased 28 basis points to 4.03% in fiscal 2019 from 3.75% in fiscal 2018.
Interest income on loans receivable increased $76,000 to $40.1 million in fiscal 2019 from $40.0 million in fiscal 2018. This increase was attributable to a higher average loan yield, partly offset by a lower average
loan balance. The average loan yield, including loans held for sale, during fiscal 2019 increased 27 basis points to 4.33% from 4.06% in fiscal 2018. The average balance of loans receivable decreased $60.8 million, or 6%, to $926.0 million during
fiscal 2019 from $986.8 million during fiscal 2018. The average balance of loans held for sale decreased $42.6 million, or 48%, to $46.3 million for fiscal 2019 from $88.9 million in fiscal 2018 while the average yield on loans held for sale
increased 59 basis points to 4.69% in fiscal 2019 from 4.10% in fiscal 2018. The average balance of loans held for investment decreased $18.2 million, or 2%, to $879.7 million in fiscal 2019 from $897.9 million in fiscal 2018 while the average yield
on loans held for investment increased 26 basis points to 4.31% in fiscal 2019 from 4.05% in fiscal 2018.
Interest income from investment securities increased $698,000, or 52%, to $2.0 million in fiscal 2019 from $1.3 million in fiscal 2018. This increase was primarily a result of an increase in the average yield and, to a
lesser extent, an increase in the
64
average balance. The average yield on investment securities increased 61 basis points to 2.09% during fiscal 2019 from 1.48% during fiscal 2018. The increase in the average yield of investment securities was
primarily attributable to the purchase of new investment securities with a higher average yield than the existing portfolio and the upward repricing of adjustable rate mortgage-backed securities, partly offset by an accelerated amortization of
purchase premiums resulting from accelerated principal payments. The average balance of investment securities increased $7.2 million, or 8%, to $97.9 million in fiscal 2019 from $90.7 million in fiscal 2018 as a result of new purchases of investment
securities, partly offset by scheduled and accelerated principal payments on mortgage-backed securities. During fiscal 2019, the Bank purchased $39.7 million of mortgage-backed securities with an average yield of 3.01% and did not sell any
investment securities.
During fiscal 2019, the Bank received $707,000 of cash dividends from its FHLB - San Francisco stock, an increase of $139,000 or 24% from the $568,000 of cash dividends received in fiscal 2018. The increase in cash
dividends was due primarily to a special cash dividend received in the second quarter of fiscal 2019 that did not occur in fiscal 2018, and as a result, the average yield increased 163 basis points to 8.62% in fiscal 2019 from 6.99% in fiscal 2018.
Interest income from interest-earning deposits, primarily cash deposited at the Federal Reserve Bank of San Francisco, increased $753,000, or 96%, to $1.5 million in fiscal 2019 from $784,000 in fiscal 2018, due to a
higher average yield and, to a lesser extent, a higher average balance. The average yield increased 79 basis points to 2.24% in fiscal 2019 from 1.45% in fiscal 2018, resulting from increases in the target federal funds interest rate. The average
balance of interest-earning deposits increased $14.4 million, or 27%, to $67.8 million in fiscal 2019 from $53.4 million in fiscal 2018, due primarily to the decreases in loans held for sale (attributable to the Corporation’s decision to reduce
single-family loans originated for sale) and loans held for investment, partly offset by decreases in customer deposits and borrowings.
Interest Expense. Total interest expense for fiscal 2019 was $6.2 million as compared to $6.4 million for fiscal 2018, a decrease of $204,000, or 3%. This decrease was
primarily attributable to a lower interest expense on deposits, particularly in time deposits, and borrowings. The average balance of interest-bearing liabilities decreased $39.7 million or 4% to $989.7 million during fiscal 2019 as compared to $1.03
billion during fiscal 2018. This decrease was attributable to declines in the average balance of both deposits and borrowings. The average cost of interest-bearing liabilities was 0.63% during fiscal 2019, up one basis point from 0.62% during fiscal
2018. The slight increase in the average cost of liabilities was primarily due to a higher average cost of borrowings.
Interest expense on deposits for fiscal 2019 was $3.4 million as compared to $3.5 million for the same period of fiscal 2018, a decrease of $114,000, or 3%. The decrease in interest expense on deposits was primarily
attributable to a lower average balance. The average balance of deposits decreased $35.2 million, or 4%, to $880.1 million during fiscal 2019 from $915.3 million during fiscal 2018. The average balance of time deposits decreased by $31.2 million, or
12%, to $220.4 million in fiscal 2019 from $251.6 million in fiscal 2018. The decrease in the average balance of time deposits was much larger than the decrease in the average balance of transaction accounts, consistent with the Bank's marketing
strategy to promote transaction accounts and the strategic decision to compete less aggressively on time deposit interest rates. The average balance of transaction accounts decreased $4.0 million, or 1%, to $659.7 million in fiscal 2019 from $663.7
million in fiscal 2018. The average balance of transaction accounts to total deposits in the fiscal 2019 was 75%, compared to 73% in fiscal 2018. The average cost of deposits remained unchanged at 0.38% for both fiscal 2019 and 2018. The average cost
of transaction accounts also remained unchanged at 0.15% for both fiscal 2019 and 2018; while the average cost of time deposits in fiscal 2019 was 1.08%, up nine basis points, from 0.99% in fiscal 2018.
Interest expense on borrowings, consisting of FHLB - San Francisco advances, for fiscal 2019 decreased $90,000, or 3%, to $2.8 million as compared to $2.9 million in fiscal 2018. The decrease in interest expense on
borrowings was due primarily to a lower average balance, partly offset by a slightly higher average cost. The average balance of borrowings decreased $4.4 million, or 4%, to $109.6 million during fiscal 2019 from $114.0 million during fiscal 2018.
The average cost of borrowings increased to 2.58% in fiscal 2019 from 2.56% in fiscal 2018, an increase of two basis points. The increase in the average cost of
65
borrowings was primarily due to the maturity of short-term advances and an early payoff of a long-term advance with a lower average cost in fiscal 2019.
Provision (Recovery) for Loan Losses. During fiscal 2019, the Corporation recorded a recovery from the allowance for loan losses of $475,000, as compared to a $536,000 recovery
from the allowance for loan losses during fiscal 2018, a $61,000 or 11% decrease. The recovery from the allowance for loan losses in fiscal 2019 was primarily attributable to a decrease in loans held for investment and a relatively low balance of
non-performing loans, while maintaining a relatively stable credit risk profile, as reflected in our asset quality ratios described below. The allowance for loan losses decreased $309,000, or 4%, to $7.1 million at June 30, 2019 from $7.4 million at
June 30, 2018.
Non-performing assets (net of the collectively evaluated allowances and individually evaluated allowances), with underlying collateral primarily located in Southern California, decreased $745,000 or 11% to $6.2
million, or 0.57% of total assets, at June 30, 2019, compared to $7.0 million, or 0.59% of total assets, at June 30, 2018. Non-performing loans at June 30, 2019 increased $161,000 or 3% since June 30, 2018 to $6.2 million and were comprised of 20
single-family loans ($5.2 million), one construction loan ($971,000) and one commercial business loan ($41,000). There were no REO assets at June 30, 2019, as compared to $906,000 at June 30, 2018. As of June 30, 2019, 70%, or $4.4 million of
non-performing loans have a current payment status. Net loan recoveries in fiscal 2019 were $166,000 or 0.02% of average loans receivable, compared to net loan charge-offs of $118,000 or 0.01% of average loans receivable in fiscal 2018.
Classified assets at June 30, 2019 were $16.2 million, comprised of $8.6 million in the special mention category, $7.6 million in the substandard category and no outstanding REO. Classified assets at June 30, 2018
were $15.8 million, comprised of $7.5 million in the special mention category, $7.4 million in the substandard category and $906,000 in REO. For additional information, see Item 1, “Business - “Delinquencies and Classified Assets” in this Form 10-K.
No loans were modified from their original terms in fiscal 2019, while there were two loans that were modified or restructured from their original terms in fiscal 2018. The outstanding balance of restructured loans at
June 30, 2019 was $3.8 million (eight loans), down 27 percent from $5.2 million (11 loans) at June 30, 2018. As of June 30, 2019, one restructured loan was classified as special mention and remains on accrual status ($437,000), one restructured loan
was classified as substandard and remains on accrual status ($1.4 million) and six restructured loans were classified as substandard on non-accrual status ($1.9 million). As of June 30, 2019, 63%, or $2.4 million of the restructured loans have a
current payment status, consistent with their modified payment terms. During fiscal 2019, no restructured loans were in default within a 12-month period subsequent to their original restructuring while one restructured loan totaling $56,000 was
extended beyond the initial maturity date of the modification.
The allowance for loan losses was $7.1 million at June 30, 2019, or 0.80% of gross loans held for investment, compared to $7.4 million, or 0.81% of gross loans held for investment at June 30, 2018. The allowance for
loan losses at June 30, 2019 includes $130,000 of individually evaluated allowances, compared to $157,000 of individually evaluated allowances at June 30, 2018. Management believes that, based on currently available information, the allowance for
loan losses is sufficient to absorb potential losses inherent in loans held for investment at June 30, 2019. For additional information, see Item 1, “Business - Delinquencies and Classified Assets - Allowance for Loan Losses” in this Form 10-K.
The allowance for loan losses is maintained at a level sufficient to provide for estimated losses based on evaluating known and inherent risks in the loans held for investment portfolio and upon management's continuing
analysis of the factors underlying the quality of the loans held for investment. These factors include changes in the size and composition of the loans held for investment, actual loan loss experience, current economic conditions, detailed analysis
of individual loans for which full collectibility may not be assured, and determination of the realizable value of the collateral securing the loans. Provisions (recoveries) for loan losses are charged (credited) against operations on a quarterly
basis, as necessary, to maintain the allowance at appropriate levels. Management believes that the amount maintained in the allowance will be adequate to absorb probable losses inherent in the loans held for investment. Although management believes
it uses the best information available
66
to make such determinations, there can be no assurance that regulators, in reviewing the Bank's loans held for investment, will not request the Bank to significantly increase its allowance for loan losses. Future
adjustments to the allowance for loan losses may be necessary and results of operations could be significantly and adversely affected as a result of economic, operating, regulatory and other conditions beyond the control of the Bank.
Non-Interest Income. Total non-interest income decreased $9.4 million, or 43%, to $12.5 million in fiscal 2019 from $21.9 million in fiscal 2018. The decrease was primarily
attributable to decreases in the gain on sale of loans and loan servicing and other fees.
The net gain on sale of loans decreased $8.7 million, or 55%, to $7.1 million for fiscal 2019 from $15.8 million in fiscal 2018. The decrease was a result of a lower volume of loans originated for sale, partly offset
by a higher average loan sale margin. The decrease in the volume of loans originated for sale was consistent with the Corporation’s business decision to scale back the single-family loan originations for sale and improve on its efforts to increase
the volume of single-family loan originations held for investment. Total loan sale volume, which includes the net change in commitments to extend credit on loans to be held for sale, was $410.7 million in fiscal 2019 as compared to $1.15 billion in
fiscal 2018, down $741.0 million or 64%. The average loan sale margin during fiscal 2019 was 1.73% as compared to 1.37% in fiscal 2018, an increase of 36 basis points. The improvement in the average loan sale margin was the result of market
conditions and a higher percentage of retail loan originations, which typically have a higher loan sale margin, as compared to wholesale loan originations. The total retail loan originations as a percentage of total loans originated for sale during
fiscal 2019 was 64%, up from 57% in fiscal 2018. The gain on sale of loans includes an unfavorable fair-value adjustment on loans held for sale and derivative financial instruments (commitments to extend credit, commitments to sell loans, TBA MBS
trades and option contracts) that amounted to a net loss of $2.9 million and $2.1 million in fiscal 2019 and 2018, respectively.
Loan servicing and other fees decreased $524,000, or 33%, to $1.1 million for fiscal 2019 from $1.6 million in fiscal 2018. The decrease was attributable primarily to lower loan prepayment fees and higher servicing
asset impairments.
Non-Interest Expense. Total non-interest expense in fiscal 2019 was $45.2 million, a decrease of $8.0 million, or 15%, as compared to $53.2 million in fiscal 2018. The decrease
in non-interest expense was primarily attributable to decreases in salaries and employee benefits expense and other operating expenses, partly offset by an increase in equipment expense.
Salaries and employee benefits expense decreased $4.7 million, or 14%, to $30.1 million in fiscal 2019 from $34.8 million in fiscal 2018. The decrease in salaries and employee benefits was primarily due to lower
incentive compensation costs and staff reductions related to lower saleable mortgage loan originations, consistent with the Corporation’s business decision to scale back the saleable single-family mortgage loan originations. Total loans originated
and purchased for sale in fiscal 2019 was $467.1 million, down 61% from $1.19 billion in fiscal 2018. Total non-recurring salaries and employee benefits expenses of $1.7 million were recognized in fiscal 2019, which consist of severance and other
personnel expenses.
Total equipment expense increased $898,000, or 57%, to $2.5 million in fiscal 2019 from $1.6 million in fiscal 2018. The increase was primarily attributable to $758,000 of non-recurring charges related to termination,
charge-off, or modification of data processing and other contractual arrangements, consistent with the Corporation’s business decision to scaling back the saleable single-family mortgage loan originations.
Other non-interest expense decreased $3.9 million, or 49%, to $4.1 million in fiscal 2019 from $8.0 million in fiscal 2018. The decrease was primarily attributable to the $3.4 million increase in litigation expenses
recognized in fiscal 2018 and not replicated in fiscal 2019 (see Part I, Item 3. Legal Proceeding) and lower expenses related to reduced loan originations.
Provision for Income Taxes. The income tax provision reflects accruals for taxes at the applicable rates for federal income tax and California franchise tax based upon reported
pre-tax income, adjusted for the effect of all permanent differences between income for tax and financial reporting purposes, such as non-deductible stock-based compensation, bank-owned life insurance
67
policies and certain California tax-exempt loans, among others. Therefore, there are fluctuations in the effective income tax rate from period to period based on the relationship of net permanent differences to income
before tax.
The Tax Act reduced the federal corporate income tax rate from a maximum 35% to a flat 21% as of January 1, 2018. Since the Corporation has a fiscal year end of June 30th, the reduced corporate federal income tax rate
for fiscal year 2018 was the result of the application of a blended federal statutory tax rate of 28.06%, which was based on the applicable federal corporate income tax rates before and after the Tax Act and corresponding number of days in the fiscal
year before and after enactment. The Corporation realized the full impact of the reduced statutory federal corporate income tax rate of 21% beginning in fiscal 2019.
The provision for income taxes was $1.5 million for fiscal 2019, representing an effective tax rate of 25.4%, as compared to $3.4 million in fiscal 2018, representing an effective tax rate of 61.4%. The decline in the
provision for income taxes was due primarily to the net tax charge of $1.8 million resulting from the revaluation of net deferred tax assets (consistent with the Tax Act) recognized in fiscal 2018 and not replicated in fiscal 2019 and the application
of the federal income tax rate of 21% in fiscal 2019 as compared to the blended rate of 28.06% in fiscal 2018, partly offset by an increase in net income before income taxes.
The Corporation’s effective tax rate may differ from the estimated tax rates described above due to discrete items such as further adjustments to net deferred tax assets, excess tax benefits derived from stock option
exercises and non-taxable earnings from bank owned life insurance, among other items. The Corporation determined that the above tax rates meet its estimated income tax obligations. For additional information, see Note 9, "Income Taxes," of the Notes
to Consolidated Financial Statements, contained in Item 8 of this Form 10-K.
68
Average Balances, Interest and Average Yields/Costs
The following table sets forth certain information for the periods regarding average balances of assets and liabilities as well as the total dollar amounts of interest income from average
interest-earning assets and interest expense on average interest-bearing liabilities and average yields and costs thereof. Yields and costs for the periods indicated are derived by dividing income or expense by the average monthly balance of assets
or liabilities, respectively, for the periods presented.
|
Year Ended June 30,
|
||||||||||||||||||||||||||
|
2019
|
2018
|
2017
|
||||||||||||||||||||||||
|
(Dollars In Thousands)
|
Average
Balance |
Interest
|
Yield/
Cost
|
Average
Balance |
Interest
|
Yield/
Cost |
Average
Balance |
Interest
|
Yield/
Cost
|
|||||||||||||||||
|
Interest-earning assets:
|
||||||||||||||||||||||||||
|
Loans receivable, net(1)
|
$
|
926,003
|
$
|
40,092
|
4.33
|
%
|
$
|
986,815
|
$
|
40,016
|
4.06
|
%
|
$
|
1,025,885
|
$
|
40,249
|
3.92
|
%
|
||||||||
|
Investment securities
|
97,870
|
2,042
|
2.09
|
%
|
90,719
|
1,344
|
1.48
|
%
|
51,575
|
575
|
1.11
|
%
|
||||||||||||||
|
FHLB – San Francisco stock
|
8,199
|
707
|
8.62
|
%
|
8,126
|
568
|
6.99
|
%
|
8,097
|
967
|
11.94
|
%
|
||||||||||||||
|
Interest-earning deposits
|
67,816
|
1,537
|
2.24
|
%
|
53,438
|
784
|
1.45
|
%
|
81,027
|
626
|
0.76
|
%
|
||||||||||||||
|
Total interest-earning assets
|
1,099,888
|
44,378
|
4.03
|
%
|
1,139,098
|
42,712
|
3.75
|
%
|
1,166,584
|
42,417
|
3.64
|
%
|
||||||||||||||
|
Non interest-earning assets
|
30,778
|
32,905
|
32,003
|
|||||||||||||||||||||||
|
Total assets
|
$
|
1,130,666
|
$
|
1,172,003
|
$
|
1,198,587
|
||||||||||||||||||||
|
Interest-bearing liabilities:
|
||||||||||||||||||||||||||
|
Checking and money market
accounts(2)
|
$
|
381,790
|
428
|
0.11
|
%
|
$
|
372,781
|
407
|
0.11
|
%
|
$
|
358,532
|
387
|
0.11
|
%
|
|||||||||||
|
Savings accounts
|
277,896
|
572
|
0.21
|
%
|
290,959
|
595
|
0.20
|
%
|
283,520
|
579
|
0.20
|
%
|
||||||||||||||
|
Time deposits
|
220,432
|
2,381
|
1.08
|
%
|
251,604
|
2,493
|
0.99
|
%
|
290,080
|
2,842
|
0.98
|
%
|
||||||||||||||
|
Total deposits
|
880,118
|
3,381
|
0.38
|
%
|
915,344
|
3,495
|
0.38
|
%
|
932,132
|
3,808
|
0.41
|
%
|
||||||||||||||
|
Borrowings
|
109,558
|
2,827
|
2.58
|
%
|
113,984
|
2,917
|
2.56
|
%
|
117,329
|
2,871
|
2.45
|
%
|
||||||||||||||
|
Total interest-bearing
liabilities
|
989,676
|
6,208
|
0.63
|
%
|
1,029,328
|
6,412
|
0.62
|
%
|
1,049,461
|
6,679
|
0.64
|
%
|
||||||||||||||
|
Non interest-bearing
liabilities
|
19,288
|
19,392
|
16,828
|
|||||||||||||||||||||||
|
Total liabilities
|
1,008,964
|
1,048,720
|
1,066,289
|
|||||||||||||||||||||||
|
Stockholders’ equity
|
121,702
|
123,283
|
132,298
|
|||||||||||||||||||||||
|
Total liabilities and
stockholders’ equity
|
$
|
1,130,666
|
$
|
1,172,003
|
$
|
1,198,587
|
||||||||||||||||||||
|
Net interest income
|
$
|
38,170
|
$
|
36,300
|
$
|
35,738
|
||||||||||||||||||||
|
Interest rate spread(3)
|
3.40
|
%
|
3.13
|
%
|
3.00
|
%
|
||||||||||||||||||||
|
Net interest margin(4)
|
3.47
|
%
|
3.19
|
%
|
3.06
|
%
|
||||||||||||||||||||
|
Ratio of average interest-
earning assets to average
interest-bearing liabilities
|
111.14
|
%
|
110.66
|
%
|
111.16
|
%
|
||||||||||||||||||||
|
(1)
|
Includes loans held for sale and non-performing loans, as well as net deferred loan costs of $1.2 million, $1.1 million and $874 for the years ended June 30, 2019, 2018 and 2017,
respectively.
|
|
(2)
|
Includes the average balance of non interest-bearing checking accounts of $84.1 million, $79.9 million and $72.9 million in fiscal 2019, 2018 and 2017, respectively.
|
|
(3)
|
Represents the difference between the weighted-average yield on all interest-earning assets and the weighted-average rate on all interest-bearing liabilities.
|
|
(4)
|
Represents net interest income as a percentage of average interest-earning assets.
|
69
Rate/Volume Variance
The following tables set forth the effects of changing rates and volumes on interest income and expense of the Corporation for the period presented. Information is provided with respect to the
effects attributable to changes in volume (changes in volume multiplied by prior rate), the effects attributable to changes in rate (changes in rate multiplied by prior volume) and the effects attributable to changes that cannot be allocated between
rate and volume. Please refer to Item 7, "Management’s Discussion and Analysis of Financial Condition and Results of Operations, Comparison of Operating Results for the Years Ended June 30, 2019 and 2018” and Comparison of Operating Results for the
Years Ended June 30, 2018 and 2017" of this Form 10-K.
|
Year Ended June 30, 2019 Compared
To Year Ended June 30, 2018 Increase (Decrease) Due to |
||||||||||||
|
(In Thousands)
|
Rate
|
Volume
|
Rate/
Volume
|
Net
|
||||||||
|
Interest-earning assets:
|
||||||||||||
|
Loans receivable(1)
|
$
|
2,709
|
$
|
(2,469
|
)
|
$
|
(164
|
)
|
$
|
76
|
||
|
Investment securities
|
548
|
106
|
44
|
698
|
||||||||
|
FHLB – San Francisco stock
|
133
|
5
|
1
|
139
|
||||||||
|
Interest-earning deposits
|
431
|
208
|
114
|
753
|
||||||||
|
Total net change in income on interest-earning assets
|
3,821
|
(2,150
|
)
|
(5
|
)
|
1,666
|
||||||
|
Interest-bearing liabilities:
|
||||||||||||
|
Checking and money market accounts
|
—
|
21
|
—
|
21
|
||||||||
|
Savings accounts
|
29
|
(51
|
)
|
(1
|
)
|
(23
|
)
|
|||||
|
Time deposits
|
225
|
(309
|
)
|
(28
|
)
|
(112
|
)
|
|||||
|
Borrowings
|
24
|
(113
|
)
|
(1
|
)
|
(90
|
)
|
|||||
|
Total net change in expense on interest-bearing liabilities
|
278
|
(452
|
)
|
(30
|
)
|
(204
|
)
|
|||||
|
Net increase (decrease) in net interest income
|
$
|
3,543
|
$
|
(1,698
|
)
|
$
|
25
|
$
|
1,870
|
|||
|
(1)
|
Includes loans held for sale and non-performing loans. For purposes of calculating volume, rate and rate/volume variances, non-performing loans were included in the weighted-average balance outstanding.
|
70
|
Year Ended June 30, 2018 Compared
To Year Ended June 30, 2017 Increase (Decrease) Due to |
||||||||||||
|
(In Thousands)
|
Rate
|
Volume
|
Rate/
Volume
|
Net
|
||||||||
|
Interest-earning assets:
|
||||||||||||
|
Loans receivable(1)
|
$
|
1,354
|
$
|
(1,532
|
)
|
$
|
(55
|
)
|
$
|
(233
|
)
|
|
|
Investment securities
|
190
|
434
|
145
|
769
|
||||||||
|
FHLB – San Francisco stock
|
(401
|
)
|
3
|
(1
|
)
|
(399
|
)
|
|||||
|
Interest-earning deposits
|
558
|
(210
|
)
|
(190
|
)
|
158
|
||||||
|
Total net change in income on interest-earning assets
|
1,701
|
(1,305
|
)
|
(101
|
)
|
295
|
||||||
|
Interest-bearing liabilities:
|
||||||||||||
|
Checking and money market accounts
|
—
|
20
|
—
|
20
|
||||||||
|
Savings accounts
|
—
|
16
|
—
|
16
|
||||||||
|
Time deposits
|
32
|
(377
|
)
|
(4
|
)
|
(349
|
)
|
|||||
|
Borrowings
|
132
|
(82
|
)
|
(4
|
)
|
46
|
||||||
|
Total net change in expense on interest-bearing liabilities
|
164
|
(423
|
)
|
(8
|
)
|
(267
|
)
|
|||||
|
Net increase (decrease) in net interest income
|
$
|
1,537
|
$
|
(882
|
)
|
$
|
(93
|
)
|
$
|
562
|
||
|
(1)
|
Includes loans held for sale and non-performing loans. For purposes of calculating volume, rate and rate/volume variances, non-performing loans were included in the weighted-average balance outstanding.
|
Liquidity and Capital Resources
The Corporation's primary sources of funds are deposits, proceeds from principal and interest payments on loans, proceeds from the maturity and sale of investment securities, proceeds from FHLB - San Francisco
advances, and access to the discount window facility at the Federal Reserve Bank of San Francisco. While maturities and scheduled amortization of loans and investment securities are a relatively predictable source of funds, deposit flows, mortgage
prepayments and loan sales are greatly influenced by general interest rates, economic conditions and competition.
The primary investing activity of the Bank has been the origination and purchase of loans held for investment and loans held for sale. During the fiscal years ended June 30, 2019 and 2018, the Bank originated loans in
the amounts of $587.3 million and $1.37 billion, respectively, the majority of which were sold, as noted below. In addition, the Bank purchased loans for investment from other financial institutions in fiscal 2019 and 2018 in the amounts of $51.1
million and $13.5 million, respectively. Total loans sold in fiscal 2019 and 2018 were $559.0 million and $1.20 billion, respectively. At June 30, 2019 and 2018, the Bank had loan origination commitments totaling $4.3 million and $66.3 million,
respectively, with undisbursed loan funds of $6.6 million and $4.3 million, respectively. The Bank anticipates that it will have sufficient funds available to meet its current loan origination commitments.
The Bank's primary financing activity is gathering deposits. During the fiscal years ended June 30, 2019 and 2018, the net decrease in deposits was $66.3 million and $18.9 million, respectively. On June 30, 2019,
time deposits that are scheduled to mature in one year or less were $106.1 million. Historically, the Bank has been able to retain a significant percentage of its time deposits as they mature by adjusting deposit rates to the current interest rate
environment.
The Bank must maintain an adequate level of liquidity to ensure the availability of sufficient funds to support loan growth and deposit withdrawals, to satisfy financial commitments and to take advantage of investment
opportunities. The Bank generally maintains sufficient cash and cash equivalents to meet short-term liquidity needs. At June 30, 2019, total cash and cash equivalents were $70.6 million, or 6.5% of total assets. Depending on market conditions and
the pricing of deposit products
71
and FHLB - San Francisco advances, the Bank may continue to rely on FHLB - San Francisco advances for part of its liquidity needs. As of June 30, 2019, the remaining financing availability at FHLB - San Francisco was
$275.2 million and the remaining unused collateral was $434.7 million. In addition, the Bank has secured a $74.2 million discount window facility at the Federal Reserve Bank of San Francisco, collateralized by investment securities with a fair
market value of $79.0 million. The Bank also has a federal funds facility with its correspondent bank for $17.0 million which matures on June 30, 2020. As of June 30, 2019, there were no outstanding borrowings under the discount window facility or
the federal funds facility with its correspondent bank.
Regulations require the Bank to maintain adequate liquidity to assure safe and sound operations. The Bank's average liquidity ratio (defined as the ratio of average qualifying liquid assets to average deposits and
borrowings) for the quarter ended June 30, 2019 increased to 20.7% from 14.9% during the same quarter ended June 30, 2018. The increase in the liquidity ratio was due primarily to the increase in average qualifying liquid assets and the decline in
average deposits and borrowings during the quarter ended June 30, 2019 in comparison to the quarter ended June 30, 2018. The Bank augments its liquidity by maintaining sufficient borrowing capacity at the FHLB - San Francisco, Federal Reserve Bank
of San Francisco and its correspondent bank.
The Bank, as a federally-chartered, federally insured savings bank, is subject to the capital requirements established by the OCC. Under the OCC's capital adequacy guidelines and the regulatory framework for prompt
corrective action, the Bank must meet specific capital guidelines that involve quantitative measures of the Bank’s assets, liabilities and certain off-balance-sheet items as calculated under regulatory accounting practices. The Bank’s capital amounts
and classification are also subject to qualitative judgments by the regulators about components, risk weighting and other factors. In addition, Provident Financial Holdings, Inc., as a savings and loan holding company registered with the FRB, is
required by the FRB to maintain capital adequacy that generally parallels the OCC requirements. Since the holding company has less than $3.0 billion in assets, the capital guidelines apply on a bank only basis, and the Federal Reserve expects the
holding company’s subsidiary bank to be well capitalized under the prompt corrective action regulations.
At June 30, 2019, the Bank exceeded all regulatory capital requirements. Under the prompt corrective action provisions, minimum ratios of 5.0% for Tier 1 Leverage Capital, 6.5% for Common Equity Tier 1 ("CET1")
Capital, 8.0% for Tier 1 Capital and 10.0% for Total Capital are required to be deemed “well capitalized.” As of June 30, 2019, the Bank exceeded the capital ratios needed to be considered well capitalized with Tier 1 Leverage Capital, CET1 Capital,
Tier 1 Capital and Total Capital ratios of 10.5%, 18.0%, 18.0% and 19.1%, respectively.
Impact of Inflation and Changing Prices
The Corporation's consolidated financial statements are prepared in accordance with generally accepted accounting principles, which require the measurement of financial position and operating results in terms of
historical dollars without considering the changes in the relative purchasing power of money over time as a result of inflation. The impact of inflation is reflected in the increasing cost of the Corporation's operations. Unlike most industrial
companies, nearly all assets and liabilities of the Corporation are monetary. As a result, interest rates have a greater impact on the Corporation's performance than do the effects of general levels of inflation. In addition, interest rates do not
necessarily move in the direction, or to the same extent, as the prices of goods and services.
Impact of New Accounting Pronouncements
Various elements of the Corporation's accounting policies, by their nature, are inherently subject to estimation techniques, valuation assumptions and other subjective assessments. In particular, management has
identified several accounting policies that, as a result of the judgments, estimates and assumptions inherent in those policies, are important to an understanding of the financial statements of the Corporation. These policies relate to the
methodology for the recognition of interest income,
72
determination of the provision and allowance for loan losses, the estimated fair value of derivative financial instruments and the valuation of mortgage servicing rights and real estate owned. These policies and
judgments, estimates and assumptions are described in greater detail in this Item 7, "Management's Discussion and Analysis of Financial Condition and Results of Operations" and in the section entitled “Organization and Summary of Significant
Accounting Policies” contained in Note 1 of the Notes to the Consolidated Financial Statements included in Item 8 of this Form 10-K. Management believes that the judgments, estimates and assumptions used in the preparation of the financial
statements are appropriate based on the factual circumstances at the time. However, because of the sensitivity of the financial statements to these accounting policies, changes to the judgments, estimates and assumptions used could result in
material differences in the results of operations or financial condition.
Item 7A. Quantitative and Qualitative Disclosures about Market Risk
Quantitative Aspects of Market Risk. The Corporation does not maintain a trading account for any class of financial instrument nor does it purchase high-risk derivative
financial instruments. Furthermore, the Corporation is not subject to foreign currency exchange rate risk or commodity price risk. The primary market risk that the Corporation faces is interest rate risk. For information regarding the sensitivity
to interest rate risk of the Corporation's interest-earning assets and interest-bearing liabilities, see “Interest Rate Risk” below and Item 1, “Business - Lending Activities - Maturity of Loans Held for Investment,” “- Investment Securities
Activities,” and “- Deposit Activities and Other Sources of Funds - Time Deposits by Maturities” in this Form 10-K.
Qualitative Aspects of Market Risk. One of the Corporation's principal financial objectives is to achieve long-term profitability while reducing its exposure to fluctuating
interest rates. The Corporation has sought to reduce the exposure of its earnings to changes in interest rates by attempting to manage the repricing mismatch between interest-earning assets and interest-bearing liabilities. The principal element in
achieving this objective is to increase the interest-rate sensitivity of the Corporation's interest-earning assets by retaining for its portfolio new loan originations with interest rates subject to periodic adjustment to market conditions and by
selling fixed-rate, single-family mortgage loans. In addition, the Corporation maintains an investment portfolio, which is largely comprised of U.S. government agency MBS and U.S. government sponsored enterprise MBS with contractual maturities of up
to 30 years that reprice frequently or have a relatively short-average life. The Corporation relies on retail deposits as its primary source of funds while utilizing FHLB - San Francisco advances as a secondary source of funding. Management believes
retail deposits, unlike brokered deposits, reduce the effects of interest rate fluctuations because they generally represent a more stable source of funds. As part of its interest rate risk management strategy, the Corporation promotes transaction
accounts and time deposits with terms up to seven years. For additional information, see Item 7, “Management's Discussion and Analysis of Financial Condition and Results of Operations” in this Form 10-K.
Interest Rate Risk. The principal financial objective of the Corporation's interest rate risk management function is to achieve long-term profitability while limiting its
exposure to the fluctuation of interest rates. The Corporation, through the Corporation's Asset-Liability Committee, has sought to reduce the exposure of its earnings to changes in interest rates by managing the repricing mismatch between
interest-earning assets and interest-bearing liabilities. The principal element in achieving this objective is to manage the interest-rate sensitivity of the Corporation's assets by retaining loans with interest rates subject to periodic market
adjustments. In addition, the Corporation maintains a liquid investment portfolio primarily comprised of U.S. government agency MBS and government sponsored enterprise MBS. The Corporation relies on retail deposits as its primary source of funding
while utilizing FHLB - San Francisco advances as a secondary source of funding which can be structured with favorable interest rate risk characteristics. As part of its interest rate risk management strategy, the Corporation promotes transaction
accounts and time deposits with maturity terms up to seven years.
Through the use of an internal interest rate risk model, the Corporation is able to analyze its interest rate risk exposure by measuring the change in net portfolio value (“NPV”) over a variety of interest rate
scenarios. NPV is defined as the net present
73
value of expected future cash flows from assets, liabilities and off-balance sheet contracts. The calculation is intended to illustrate the change in NPV that would occur in the event of an immediate change in
interest rates of -200, -100, +100, +200 and +300 basis points (“bp”) with no effect given to steps that management might take to counter the effect of the interest rate movement. The current federal funds rate is 2.50 percent making an immediate
change of -300 basis points improbable.
The following table sets forth as of June 30, 2019 the estimated changes in NPV based on the indicated interest rate environment (dollars in thousands):
|
Basis Points ("bp")
Change in Rates
|
Net
Portfolio
Value
|
NPV
Change(1)
|
Portfolio
Value of
Assets
|
NPV as Percentage
of Portfolio Value
Assets(2)
|
Sensitivity
Measure(3)
|
|||||||||||||||||
|
+300 bp
|
|
$
|
227,236
|
$
|
97,090
|
$
|
1,182,584
|
19.22%
|
|
+742 bp
|
|
|||||||||||
|
+200 bp
|
|
$
|
199,418
|
$
|
69,272
|
$
|
1,160,389
|
17.19%
|
|
+539 bp
|
|
|||||||||||
|
+100 bp
|
|
$
|
167,306
|
$
|
37,160
|
$
|
1,134,099
|
14.75%
|
|
+295 bp
|
|
|||||||||||
|
-
|
$
|
130,146
|
$
|
—
|
$
|
1,102,969
|
11.80%
|
|
-
|
|||||||||||||
|
-100 bp
|
|
$
|
116,842
|
$
|
(13,304
|
)
|
$
|
1,094,979
|
10.67%
|
|
-113 bp
|
|
||||||||||
|
-200 bp
|
|
$
|
120,618
|
$
|
(9,528
|
)
|
$
|
1,099,778
|
10.97%
|
|
-83 bp
|
|
||||||||||
|
(1)
|
Represents the increase (decrease) of the NPV at the indicated interest rate change in comparison to the NPV at June 30, 2019 (“base case”).
|
|
(2)
|
Calculated as the NPV divided by the portfolio value of total assets.
|
|
(3)
|
Calculated as the change in the NPV ratio (NPV as a Percentage of Portfolio Value Assets) from the base case amount assuming the indicated change in interest rates (expressed in basis
points).
|
The following table is derived from the internal interest rate risk model and represents the change in the NPV at a -100 basis point rate shock at June 30, 2019 and 2018:
|
At June 30, 2019
|
At June 30, 2018
|
|
|
(-100 bp rate shock)
|
(-100 bp rate shock)
|
|
|
Pre-Shock NPV Ratio: NPV as a % of PV Assets
|
11.80%
|
10.24%
|
|
Post-Shock NPV Ratio: NPV as a % of PV Assets
|
10.67%
|
9.62%
|
|
Sensitivity Measure: Change in NPV Ratio
|
-113 bp
|
-62 bp
|
The pre-shock NPV ratio increased 156 basis points to 11.80 percent at June 30, 2019 from 10.24 percent at June 30, 2018 and the post-shock NPV ratio increased 105 basis points to 10.67 percent at June 30, 2019 from
9.62 percent at June 30, 2018. The increase of the NPV ratios was primarily attributable to net income in the fiscal 2019 and a higher net valuation of total assets in comparison to total liabilities, partly offset by a $7.5 million cash dividend
distribution from the Bank to the Corporation in September 2018.
As with any method of measuring interest rate risk, certain shortcomings are inherent in the method of analysis presented in the foregoing tables. For example, although certain assets and liabilities may have similar
maturities or periods to repricing, they may react in different degrees to changes in market interest rates. Also, the interest rates on certain types of assets and liabilities may fluctuate in advance of changes in market interest rates, while
interest rates on other types of assets and liabilities may lag behind changes in market interest rates. Additionally, certain assets, such as ARM loans, have features that restrict changes in interest rates on a short-term basis and over the life
of the asset. Further, in the event of a change in interest rates, expected rates of prepayments on loans and early withdrawals from time deposits could likely deviate significantly from those assumed when calculating the results described in the
tables above. It is also possible that, as a result of an interest rate increase, the higher mortgage payments required from ARM borrowers could result in an increase in delinquencies and defaults. Changes in market interest rates may also affect
the volume and profitability of the Corporation’s origination of saleable mortgage loans. Accordingly, the data presented in the tables in this section should not be relied upon as indicative of
74
actual results in the event of changes in interest rates. Furthermore, the NPV presented in the foregoing tables is not intended to present the fair market value of the Corporation, nor does it represent amounts that
would be available for distribution to shareholders in the event of the liquidation of the Corporation.
The Corporation measures and evaluates the potential effects of interest rate movements through an interest rate sensitivity "gap" analysis. Interest rate sensitivity reflects the potential effect on net interest
income when there is movement in interest rates. For loans, securities and liabilities with contractual maturities, the table presents contractual repricing or scheduled maturity. For transaction accounts (checking, money market and savings
deposits) that have no contractual maturity, the table presents estimated principal cash flows and, as applicable, the Corporation's historical experience, management's judgment and statistical analysis concerning their most likely withdrawal
behaviors.
The following table represents the interest rate gap analysis of the Corporation's assets and liabilities as of June 30, 2019:
|
Term to Contractual Repricing, Estimated Repricing, or Contractual
Maturity (1)
|
|||||||||||||||||
|
As of June 30, 2019
|
|||||||||||||||||
|
(Dollars In Thousands)
|
12 months or
less
|
Greater than
1 year to 3
years
|
Greater than
3 years to 5
years
|
Greater than
5 years or
non-sensitive
|
Total
|
||||||||||||
|
Repricing Assets:
|
|||||||||||||||||
|
Cash and cash equivalents
|
$
|
65,044
|
$
|
—
|
$
|
—
|
$
|
5,588
|
$
|
70,632
|
|||||||
|
Investment securities
|
32,169
|
400
|
—
|
67,490
|
100,059
|
||||||||||||
|
Loans held for investment
|
256,934
|
235,201
|
290,831
|
96,959
|
879,925
|
||||||||||||
|
FHLB - San Francisco stock
|
8,199
|
—
|
—
|
—
|
8,199
|
||||||||||||
|
Other assets
|
3,424
|
—
|
—
|
22,611
|
26,035
|
||||||||||||
|
Total assets
|
365,770
|
235,601
|
290,831
|
192,648
|
1,084,850
|
||||||||||||
|
Repricing Liabilities and Equity:
|
|||||||||||||||||
|
Checking deposits - non-interest bearing
|
—
|
—
|
—
|
90,184
|
90,184
|
||||||||||||
|
Checking deposits - interest bearing
|
38,686
|
77,373
|
77,373
|
64,477
|
257,909
|
||||||||||||
|
Savings deposits
|
52,877
|
105,755
|
105,755
|
—
|
264,387
|
||||||||||||
|
Money market deposits
|
17,823
|
17,823
|
—
|
—
|
35,646
|
||||||||||||
|
Time deposits
|
106,080
|
63,451
|
22,919
|
695
|
193,145
|
||||||||||||
|
Borrowings
|
—
|
41,107
|
40,000
|
20,000
|
101,107
|
||||||||||||
|
Other liabilities
|
345
|
—
|
—
|
21,486
|
21,831
|
||||||||||||
|
Stockholders' equity
|
—
|
—
|
—
|
120,641
|
120,641
|
||||||||||||
|
Total liabilities and stockholders' equity
|
215,811
|
305,509
|
246,047
|
317,483
|
1,084,850
|
||||||||||||
|
Repricing gap positive (negative)
|
$
|
149,959
|
$
|
(69,908
|
)
|
$
|
44,784
|
$
|
(124,835
|
)
|
$
|
—
|
|||||
|
Cumulative repricing gap:
|
|||||||||||||||||
|
Dollar amount
|
$
|
149,959
|
$
|
80,051
|
$
|
124,835
|
$
|
—
|
$
|
—
|
|||||||
|
Percent of total assets
|
14
|
%
|
7
|
%
|
12
|
%
|
—
|
%
|
—
|
%
|
|||||||
(1) Cash and cash equivalents are presented as estimated repricing; investment securities and loans held for investment are presented as contractual maturities or
contractual repricing (without consideration for prepayments); FHLB - San Francisco stock is presented as contractual repricing; transaction accounts (checking, savings and money market deposits) are presented as estimated repricing; while time
deposits (without consideration for early withdrawals) and borrowings are presented as contractual maturities.
75
The static gap analysis shows a positive position in the "Cumulative repricing gap - dollar amount" category, indicating more assets are sensitive to repricing than liabilities. Management views non-interest bearing
deposits to be the least sensitive to changes in market interest rates and these accounts are therefore characterized as long-term funding. Interest-bearing checking deposits are considered more sensitive, followed by increased sensitivity for
savings and money market deposits. For the purpose of calculating gap, a portion of these interest-bearing deposit balances are assumed to be subject to estimated repricing as follows: interest-bearing checking deposits at 15% per year, savings
deposits at 20% per year and money market deposits at 50% in the first and second years.
The gap results presented above could vary substantially if different assumptions are used or if actual experience differs from the assumptions used in the preparation of the gap analysis. Furthermore, the gap
analysis provides a static view of interest rate risk exposure at a specific point in time without taking into account redirection of cash flows activity and deposit fluctuations.
The extent to which the net interest margin will be impacted by changes in prevailing interest rates will depend on a number of factors, including how quickly interest-earning assets and interest-bearing liabilities
react to interest rate changes. It is not uncommon for rates on certain assets or liabilities to lag behind changes in the market rates of interest. Additionally, prepayments of loans and early withdrawals of certificates of deposit could cause
interest sensitivities to vary. As a result, the relationship between interest-earning assets and interest-bearing liabilities, as shown in the previous table, is only a general indicator of interest rate sensitivity and the effect of changing
interest rates on net interest income is likely to be different from that predicted solely on the basis of the interest rate sensitivity analysis set forth in the previous table.
The Corporation also models the sensitivity of net interest income for the 12-month period subsequent to any given month-end assuming a dynamic balance sheet accounting for, among other items:
|
•
|
The Corporation’s current balance sheet and repricing characteristics;
|
|
•
|
Forecasted balance sheet growth consistent with the business plan;
|
|
•
|
Current interest rates and yield curves and management estimates of projected interest rates;
|
|
•
|
Embedded options, interest rate floors, periodic caps and lifetime caps;
|
|
•
|
Repricing characteristics for market rate sensitive instruments;
|
|
•
|
Loan, investment, deposit and borrowing cash flows;
|
|
•
|
Loan prepayment estimates for each type of loan; and
|
|
•
|
Immediate, permanent and parallel movements in interest rates of plus 300, 200 and 100 and minus 100 and 200 basis points.
|
The following table describes the results of the analysis at June 30, 2019 and 2018:
|
At June 30, 2019
|
At June 30, 2018
|
|||
|
Basis Point (bp)
Change in Rates
|
Change in
Net Interest Income
|
Basis Point (bp)
Change in Rates
|
Change in
Net Interest Income
|
|
|
+300 bp
|
6.85%
|
+300 bp
|
6.83%
|
|
|
+200 bp
|
4.39%
|
+200 bp
|
5.73%
|
|
|
+100 bp
|
2.36%
|
+100 bp
|
4.53%
|
|
|
-100 bp
|
(3.63)%
|
-100 bp
|
(3.98)%
|
|
|
-200 bp
|
(6.69)%
|
-200 bp
|
(10.61)%
|
|
At June 30, 2019 and 2018, the Corporation was asset sensitive as its interest-earning assets at those dates are expected to reprice more quickly than its interest-bearing liabilities during the subsequent 12-month
period. Therefore, in a rising interest rate environment, the model projects an increase in net interest income over the subsequent 12-month period. In a falling interest rate environment, the results project a decrease in net interest income over
the subsequent 12-month period.
76
Management believes that the assumptions used to complete the analysis described in the table above are reasonable. However, past experience has shown that immediate, permanent and parallel movements in interest rates
will not necessarily occur. Additionally, while the analysis provides a tool to evaluate the projected net interest income to changes in interest rates, actual results may be substantially different if actual experience differs from the assumptions
used to complete the analysis, particularly with respect to the 12-month business plan when asset growth is forecast. Therefore, the model results that the Corporation discloses should be thought of as a risk management tool to compare the trends of
the Corporation’s current disclosure to previous disclosures, over time, within the context of the actual performance of the treasury yield curve.
Item 8. Financial Statements and Supplementary Data
Please refer to the Consolidated Financial Statements and Notes to Consolidated Financial Statements in this Form 10-K and incorporated into this Item 8 by reference.
Item 9. Changes in and Disagreements With Accountants on Accounting and Financial Disclosure
None.
Item 9A. Controls and Procedures
a) An evaluation of the Corporation’s disclosure controls and procedures (as defined in Section 13a-15(e) or 15d-15(e) of the Securities Exchange Act of 1934 (the “Act”)) was
carried out under the supervision and with the participation of the Corporation’s Chief Executive Officer, Chief Financial Officer and the Corporation’s Disclosure Committee as of the end of the period covered by this report. In designing and
evaluating the Corporation’s disclosure controls and procedures, management recognizes that disclosure controls and procedures, no matter how well conceived and operated, can provide only reasonable, not absolute, assurance that the objectives of the
disclosure controls and procedures are met. Also, because of the inherent limitations in all control procedures, no evaluation of controls can provide absolute assurance that all control issues and instances of fraud, if any, within the Corporation
have been detected. Additionally, in designing disclosure controls and procedures, management necessarily was required to apply its judgment in evaluating the cost-benefit relationship of possible disclosure controls and procedures. The design of
any disclosure controls and procedures is also based in part upon certain assumptions about the likelihood of future events, and there can be no assurance that any design will succeed in achieving its stated goals under all potential future
conditions. Based on their evaluation, the Corporation’s Chief Executive Officer and Chief Financial Officer concluded that the Corporation’s disclosure controls and procedures as of June 30, 2019 are effective, at the reasonable assurance level, in
ensuring that the information required to be disclosed by the Corporation in the reports it files or submits under the Act is (i) accumulated and communicated to the Corporation’s management (including the Chief Executive Officer and Chief Financial
Officer) in a timely manner, and (ii) recorded, processed, summarized and reported within the time periods specified in the SEC’s rules and forms.
b) There have been no changes in the Corporation’s internal control over financial reporting (as defined in Rule 13a-15(f) of the Act) that occurred during the fiscal year
ended June 30, 2019, that has materially affected, or is reasonably likely to materially affect, the Corporation’s internal control over financial reporting. The Corporation does not expect that its internal control over financial reporting will
prevent all error and all fraud. A control procedure, no matter how well conceived and operated, can provide only reasonable, not absolute, assurance that the objectives of the control procedure are met. Because of the inherent limitations in all
control procedures, no evaluation of controls can provide absolute assurance that all control issues and instances of fraud, if any, within the Corporation have been detected. These inherent limitations include the realities that judgments in
decision-making can be faulty, and that breakdowns can occur because of simple error or mistake. Additionally, controls can be circumvented by the individual acts of some persons, by collusion of two or more
77
people, or by management override of the control. The design of any control procedure is also based in part upon certain assumptions about the likelihood of future events, and there can be
no assurance that any design will succeed in achieving its stated goals under all potential future conditions; over time, controls may become inadequate because of changes in conditions, or the degree of compliance with the policies or procedures may
deteriorate. Because of the inherent limitations in a cost-effective control procedure, misstatements due to error or fraud may occur and not be detected.
Management Report on Internal Control Over Financial Reporting
This management report includes the subsidiary institution of Provident Financial Holdings, Inc. (the "Corporation"), Provident Savings Bank, F.S.B. which is subject to Part 363 in the statement of management's
responsibilities; the report on management's assessment of compliance with the Federal laws and regulations pertaining to insider loans and the Federal and, if applicable, State laws and regulations pertaining to dividend restrictions; and the report
on management's assessment of internal control over financial reporting.
Management of the Corporation is responsible for preparing the Corporation’s annual consolidated financial statements in accordance with generally accepted accounting principles; for establishing and maintaining an
adequate internal control structure and procedures for financial reporting, including controls over the preparation of regulatory financial statements in accordance with the instructions for the Parent Company Only Financial Statements for Small
Holding Companies (Form FR Y-9SP); and for complying with the Federal laws and regulations pertaining to insider loans and the Federal and, if applicable, State laws and regulations pertaining to dividend restrictions. The Corporation's internal
control over financial reporting was designed to provide reasonable assurance regarding the reliability of financial reporting and the preparation of financial statements for external purposes in accordance with generally accepted accounting
principles.
To comply with the requirements of Section 404 of the Sarbanes-Oxley Act of 2002, the Corporation designed and implemented a structured and comprehensive assessment process to evaluate its internal control over
financial reporting across the enterprise. The assessment of the effectiveness of the Corporation's internal control over financial reporting was based on criteria established in Internal Control-Integrated Framework (2013) issued by the Committee of
Sponsoring Organizations of the Treadway Commission. Management's assessment of the Corporation's internal control over financial reporting was also conducted to meet the reporting requirements of Section 112 of the Federal Deposit Insurance
Corporation Improvement Act (FDICIA), which include controls over the preparation of the schedules equivalent to the basic financial statements in accordance with the instructions for the Parent Company Only Financial Statements for Small Holding
Companies (Form FR Y-9SP).
Because of its inherent limitations, including the possibility of human error and the circumvention of overriding controls, a system of internal control over financial reporting can provide only reasonable assurance
and may not prevent or detect misstatements. Also, projections of any evaluation of effectiveness to future periods are subject to the risk that controls may become inadequate because of changes in conditions, or that the degree of compliance with
the policies or procedures may deteriorate. Based on its assessment, management has concluded that, as of June 30, 2019, the Corporation's internal control over financial reporting, including controls over the preparation of regulatory financial
statements in accordance with the instructions for the Parent Company Only Financial Statements for Small Holding Companies (Form FR Y-9SP), is effective based on the criteria established in Internal Control-Integrated Framework (2013).
The effectiveness of internal control over financial reporting as of June 30, 2019, has been audited by Deloitte & Touche LLP, the independent registered public accounting firm who also audited the Corporation's
consolidated financial statements. Deloitte & Touche LLP's attestation report on the Corporation's internal control over financial reporting follows.
Management of the Corporation has assessed the Corporation's compliance with the Federal laws and regulations pertaining to insider loans and the Federal and, if applicable, State laws and regulations pertaining to
dividend restrictions during the fiscal year ended on June 30, 2019. Management has concluded that the Corporation complied with the Federal laws and regulations
78
pertaining to insider loans and the Federal and, if applicable, State laws and regulations pertaining to dividend restrictions during the fiscal year ended on June 30, 2019.
Date: August 30, 2019
/s/ Craig G. Blunden
Craig G. Blunden
Chairman and Chief Executive Officer
/s/ Donavon P. Ternes
Donavon P. Ternes
President, Chief Operating Officer and
Chief Financial Officer
Report of Independent Registered Public Accounting Firm
To the Stockholders and Board of Directors of
Provident Financial Holdings, Inc.
Opinion on Internal Control over Financial Reporting
We have audited the internal control over financial reporting of Provident Financial Holdings, Inc. and subsidiary (the “Corporation”) as of June 30, 2019 based on criteria established in Internal Control - Integrated Framework (2013) issued by the Committee of Sponsoring Organizations of the Treadway Commission (COSO). Because management’s assessment and our audit were conducted to meet the reporting requirements of
Section 112 of the Federal Deposit Insurance Corporation Improvement Act (FDICIA), management’s assessment and our audit of the Corporation’s internal control over financial reporting included controls over the preparation of the schedules equivalent
to the basic financial statements in accordance with the instructions for the Consolidated Financial Statements for Bank Holding Companies (Form FR Y-9C). In our opinion, the Corporation maintained, in all material respects, effective internal
control over financial reporting as of June 30, 2019, based on criteria established in Internal Control — Integrated Framework (2013) issued by COSO.
We have not examined and, accordingly, we do not express an opinion or any other form of assurance on management's statement referring to compliance with laws and regulations.
We have also audited, in accordance with the standards of the Public Company Accounting Oversight Board (United States) (PCAOB), the consolidated financial statements as of and for the year ended June 30, 2019, of the
Corporation and our report dated August 30, 2019, expressed an unqualified opinion on those consolidated financial statements.
Basis for Opinion
The Corporation’s management is responsible for maintaining effective internal control over financial reporting and for its assessment of the effectiveness of internal control over financial reporting, included in the
accompanying Management Report on Internal Control over Financial Reporting. Our responsibility is to express an opinion on the Corporation’s internal control over financial reporting based on our audit. We are a public accounting firm registered
with the PCAOB and are required to be independent with respect to the Bank in accordance with the U.S. federal securities laws and the applicable rules and regulations of the Securities and Exchange Commission and the PCAOB.
We conducted our audit in accordance with the standards of the PCAOB. Those standards require that we plan and perform the audit to obtain reasonable assurance about whether effective internal control over financial
reporting was maintained in all material respects. Our audit included obtaining an understanding of internal control over financial reporting, assessing the risk that a material weakness exists, testing and evaluating the design and operating
effectiveness of internal control based on the
79
assessed risk, and performing such other procedures as we considered necessary in the circumstances. We believe that our audit provides a reasonable basis for our opinion.
Definition and Limitations of Internal Control over Financial Reporting
A company’s internal control over financial reporting is a process designed to provide reasonable assurance regarding the reliability of financial reporting and the preparation of financial statements for external
purposes in accordance with generally accepted accounting principles. A company’s internal control over financial reporting includes those policies and procedures that (1) pertain to the maintenance of records that, in reasonable detail, accurately
and fairly reflect the transactions and dispositions of the assets of the company; (2) provide reasonable assurance that transactions are recorded as necessary to permit preparation of financial statements in accordance with generally accepted
accounting principles, and that receipts and expenditures of the company are being made only in accordance with authorizations of management and directors of the company; and (3) provide reasonable assurance regarding prevention or timely detection
of unauthorized acquisition, use, or disposition of the company’s assets that could have a material effect on the financial statements.
Because of its inherent limitations, internal control over financial reporting may not prevent or detect misstatements. Also, projections of any evaluation of effectiveness to future periods are subject to the risk
that controls may become inadequate because of changes in conditions, or that the degree of compliance with the policies or procedures may deteriorate.
/s/ Deloitte & Touche LLP
Costa Mesa, California
August 30, 2019
Item 9B. Other Information
Not applicable.
PART III
Item 10. Directors, Executive Officers and Corporate Governance
The information required by this item regarding the Corporation’s Board of Directors is incorporated herein by reference from the section captioned “Proposal I – Election of Directors” in the Corporation’s Proxy
Statement, a copy of which will be filed with the Securities and Exchange Commission no later than 120 days after the Corporation’s fiscal year end.
The executive officers of the Corporation and the Bank are elected annually and hold office until their respective successors have been elected and qualified or until death, resignation or removal by the Board of
Directors. For information regarding the Corporation’s executive officers, see Item 1, “Business - Executive Officers” in this Form 10-K.
Code of Ethics for Senior Financial Officers
The Corporation has adopted a Code of Ethics, which applies to all directors, officers, and employees of the Corporation. The Code of Ethics is publicly available as Exhibit 14 to the Corporation’s Annual Report on
Form 10-K for the fiscal year June 30, 2007, and is available on the Corporation’s website, www.myprovident.com. If the Corporation makes any substantial amendments to the Code of Ethics or grants any waiver, including any implicit waiver,
from a provision of the Code to the Corporation’s Chief Executive Officer, Chief Financial Officer or Controller, the Corporation will disclose the nature of such amendment or waiver on the Corporation’s website and in a report on Form 8-K.
80
Audit Committee and Audit Committee Financial Expert
The Corporation has a separately-designated standing audit committee established in accordance with section 3(a)(58)(A) of the Securities Exchange Act of 1934, as amended. The audit committee consists of three
independent directors of the Corporation: Joseph P. Barr, Judy A. Carpenter and Debbi H. Guthrie. The Corporation has designated Joseph P. Barr, Audit Committee Chairman, as its audit committee financial expert. Mr. Barr is independent, as
independence for audit committee members is defined under the listing standards of the NASDAQ Stock Market, a Certified Public Accountant in California and Ohio and has been practicing public accounting for over 40 years.
Nominating Procedures
There have been no material changes to the procedures by which shareholders may recommend nominees to our Board of Directors since last disclosed to shareholders.
Item 11. Executive Compensation
The information required by this item is incorporated herein by reference from the sections captioned “Executive Compensation” and “Directors’ Compensation” in the Proxy Statement, a copy of which will be filed with
the Securities and Exchange Commission no later than 120 days after the Corporation’s fiscal year end.
Item 12. Security Ownership of Certain Beneficial Owners and Management and Related Stockholder Matters
(a) Security Ownership of Certain Beneficial Owners.
The information required by this item is incorporated herein by reference from the section captioned “Security Ownership of Certain Beneficial Owners and Management” in the Corporation’s Proxy Statement, a copy of
which will be filed with the Securities and Exchange Commission no later than 120 days after the Corporation’s fiscal year end.
(b) Security Ownership of Management.
The information required by this item is incorporated herein by reference from the sections captioned “Security Ownership of Certain Beneficial Owners and Management” and “Proposal 1 - Election of Directors” in the
Corporation’s Proxy Statement, a copy of which will be filed with the Securities and Exchange Commission no later than 120 days after the Corporation’s fiscal year end.
(c) Changes In Control.
The Corporation is not aware of any arrangements, including any pledge by any person of securities of the Corporation, the operation of which may at a subsequent date result in a change in control of the Corporation.
(d) Equity Compensation Plan Information.
81
The following table summarizes share and exercise price information regarding the Corporation's equity compensation plans as of June 30, 2019:
|
Plan Category
|
Number of Securities
to Be Issued Upon
Exercise of
Outstanding Options,
Warrants and Rights
|
Weighted-Average
Exercise Price of
Outstanding Options,
Warrants and Rights
|
Number of Securities
Remaining Available for
Future Issuance Under
Equity Compensation
Plans (Excluding
Securities Reflected in
Column (a))
|
||||||
|
(a)
|
(b)
|
(c)
|
|||||||
|
Equity compensation plans approved by security holders:
|
|||||||||
|
2006 Equity Incentive Plan:
|
|||||||||
|
Stock Options
|
33,500
|
$15.69
|
—
|
||||||
|
Restricted Stock
|
1,500
|
N/A
|
—
|
||||||
|
2010 Equity Incentive Plan:
|
|||||||||
|
Stock Options
|
323,250
|
$12.16
|
—
|
||||||
|
Restricted Stock
|
6,750
|
N/A
|
—
|
||||||
|
2013 Equity Incentive Plan:
|
|||||||||
|
Stock Options
|
214,000
|
$16.65
|
57,500
|
||||||
|
Restricted Stock
|
225,250
|
N/A
|
43,250
|
||||||
|
Equity compensation plans not approved by security holders
|
N/A
|
N/A
|
N/A
|
||||||
|
Total
|
804,250
|
$12.77
|
(1)
|
100,750
|
|||||
(1) Excludes restricted stock from the calculation since restricted stock awards do not contain an exercise price requirement.
Item 13. Certain Relationships and Related Transactions, and Director Independence
Certain Relationships and Related Transactions. The information required by this item is incorporated herein by reference from the section captioned “Board of Directors’
Meetings, Board Committees and Corporate Governance Matters - Corporate Governance - Certain Relationships and Related Transactions” in the Corporation’s Proxy Statement, a copy of which will be filed with the Securities and Exchange Commission no
later than 120 days after the Corporation’s fiscal year end.
Director Independence. The information contained in the section captioned “Board of Directors’ Meetings, Board Committees and Corporate Governance Matters - Corporate
Governance - Director Independence” in the Proxy Statement is incorporated herein by reference.
Item 14. Principal Accountant Fees and Services
The information required by this item is incorporated herein by reference from the section captioned “Proposal 3 - Ratification of Appointment of Independent Auditor” in the Corporation’s Proxy Statement, a copy of
which will be filed with the Securities and Exchange Commission no later than 120 days after the Corporation’s fiscal year end.
82
PART IV
Item 15. Exhibits, Financial Statement Schedules.
(a) 1. Financial Statements
See Exhibit 13 to Consolidated Financial Statements beginning on this Form 10-K.
2. Financial Statement Schedules
Schedules to the Consolidated Financial Statements have been omitted as the required information is inapplicable.
(b) Exhibits
Exhibits are available from the Corporation by written request
|
4.1
|
Form of Certificate of Provident's Common Stock (incorporated by reference to the Corporation’s Registration Statement on Form S-1 (333-2230) filed on March 11, 1996))
|
83
|
101
|
The following materials from the Corporation’s Annual Report on Form 10-K for the fiscal year ended June 30, 2019, formatted in Extensible Business Reporting Language (XBRL): (1) Consolidated Statements of
Financial Condition; (2) Consolidated Statements of Operations; (3) Consolidated Statements of Comprehensive Income; (4) Consolidated Statements of Stockholders’ Equity; (5) Consolidated Statements of Cash Flows; and (6) Selected Notes to
Consolidated Financial Statements.
|
84
SIGNATURES
Pursuant to the requirements of Section 13 or 15(d) of the Securities Exchange Act of 1934, the registrant has duly caused this report to be signed on its behalf by the undersigned, thereunto duly
authorized.
|
Date:
|
August 30, 2019
|
Provident Financial Holdings, Inc.
|
|
/s/ Craig G. Blunden
|
||
|
Craig G. Blunden
|
||
|
Chairman and Chief Executive Officer
|
Pursuant to the requirements of the Securities Exchange Act of 1934, this report has been signed below by the following persons on behalf of the registrant and in the capacities
and on the dates indicated.
|
SIGNATURES
|
TITLE
|
DATE
|
|
|
/s/ Craig G. Blunden
|
Chairman and
|
August 30, 2019
|
|
|
Craig G. Blunden
|
Chief Executive Officer
(Principal Executive Officer)
|
||
|
/s/ Donavon P. Ternes
|
President, Chief Operating Officer
|
August 30, 2019
|
|
|
Donavon P. Ternes
|
and Chief Financial Officer
(Principal Financial and
Accounting Officer)
|
||
|
/s/ Joseph P. Barr
|
Director
|
August 30, 2019
|
|
|
Joseph P. Barr
|
|||
|
/s/ Bruce W. Bennett
|
Director
|
August 30, 2019
|
|
|
Bruce W. Bennett
|
|||
|
/s/ Judy A. Carpenter
|
Director
|
August 30, 2019
|
|
|
Judy A. Carpenter
|
|||
|
/s/ Debbi H. Guthrie
|
Director
|
August 30, 2019
|
|
|
Debbi H. Guthrie
|
|||
|
/s/ Roy H. Taylor
|
Director
|
August 30, 2019
|
|
|
Roy H. Taylor
|
|||
|
/s/ William E. Thomas
|
Director
|
August 30, 2019
|
|
|
William E. Thomas
|
85
Provident Financial Holdings, Inc.
Consolidated Financial Statements
Index
|
Page
|
|
|
Report of Independent Registered Public Accounting Firm
|
87 |
|
Consolidated Statements of Financial Condition as of June 30, 2019 and 2018
|
88 |
|
Consolidated Statements of Operations for the years ended June 30, 2019 and 2018
|
89 |
|
Consolidated Statements of Comprehensive Income for the years ended June 30, 2019 and 2018
|
90 |
|
Consolidated Statements of Stockholders’ Equity for the years ended June 30, 2019 and 2018
|
91 |
|
Consolidated Statements of Cash Flows for the years ended June 30, 2019 and 2018
|
92 |
|
Notes to Consolidated Financial Statements
|
93 |
86
Report of Independent Registered Public Accounting Firm
To the Stockholders and Board of Directors of
Provident Financial Holdings, Inc.
Opinion on the Financial Statements
We have audited the accompanying consolidated statements of financial condition of Provident Financial Holdings, Inc. and subsidiary (the “Corporation”) as of June 30, 2019 and 2018, the related
consolidated statements of operations, comprehensive income, stockholders’ equity, and cash flows for each of the three years in the period ended June 30, 2019, and the related notes (collectively referred to as the “financial statements”). In our
opinion, the financial statements present fairly, in all material respects, the financial position of the Corporation as of June 30, 2019 and 2018, and the results of its operations and its cash flows for each of the three years in the period ended
June 30, 2019, in conformity with accounting principles generally accepted in the United States of America.
We have also audited, in accordance with the standards of the Public Company Accounting Oversight Board (United States) (PCAOB), the Corporation’s internal control over financial reporting as of
June 30, 2019, based on criteria established in Internal Control – Integrated Framework (2013) issued by the Committee of Sponsoring Organizations of the Treadway Commission and our report dated August 30,
2019, expressed an unqualified opinion on the Corporation’s internal control over financial reporting.
Basis for Opinion
These financial statements are the responsibility of the Corporation’s management. Our responsibility is to express an opinion on the Corporation’s financial statements based on our audits. We are
a public accounting firm registered with the PCAOB and are required to be independent with respect to the Corporation in accordance with the U.S. federal securities laws and the applicable rules and regulations of the Securities and Exchange
Commission and the PCAOB.
We conducted our audits in accordance with the standards of the PCAOB. Those standards require that we plan and perform the audit to obtain reasonable assurance about whether the financial
statements are free of material misstatement, whether due to error or fraud. Our audits included performing procedures to assess the risks of material misstatement of the financial statements, whether due to error or fraud, and performing procedures
that respond to those risks. Such procedures included examining, on a test basis, evidence regarding the amounts and disclosures in the financial statements. Our audits also included evaluating the accounting principles used and significant
estimates made by management, as well as evaluating the overall presentation of the financial statements. We believe that our audits provide a reasonable basis for our opinion.
/s/ Deloitte & Touche LLP
Costa Mesa, California
August 30, 2019
We have served as the Corporation’s auditor since 2001.
87
PROVIDENT FINANCIAL HOLDINGS, INC.
Consolidated Statements of Financial Condition
|
(In Thousands, Except Share Information)
|
June 30,
2019 |
June 30,
2018 |
||||
|
Assets
|
||||||
|
Cash and cash equivalents
|
$
|
70,632
|
$
|
43,301
|
||
|
Investment securities - held to maturity, at cost
|
94,090
|
87,813
|
||||
|
Investment securities – available for sale, at fair value
|
5,969
|
7,496
|
||||
|
Loans held for investment, net of allowance for loan losses of $7,076 and $7,385,
respectively; includes $5,094 and $5,234 of loans held at fair value, respectively)
|
879,925
|
902,685
|
||||
|
Loans held for sale, at fair value
|
—
|
96,298
|
||||
|
Accrued interest receivable
|
3,424
|
3,212
|
||||
|
Real estate owned, net
|
—
|
906
|
||||
|
Federal Home Loan Bank (“FHLB”) – San Francisco stock
|
8,199
|
8,199
|
||||
|
Premises and equipment, net
|
8,226
|
8,696
|
||||
|
Prepaid expenses and other assets
|
14,385
|
16,943
|
||||
|
Total assets
|
$
|
1,084,850
|
$
|
1,175,549
|
||
|
Liabilities and Stockholders’ Equity
|
||||||
|
Liabilities:
|
||||||
|
Non interest-bearing deposits
|
$
|
90,184
|
$
|
86,174
|
||
|
Interest-bearing deposits
|
751,087
|
821,424
|
||||
|
Total deposits
|
841,271
|
907,598
|
||||
|
Borrowings
|
101,107
|
126,163
|
||||
|
Accounts payable, accrued interest and other liabilities
|
21,831
|
21,331
|
||||
|
Total liabilities
|
964,209
|
1,055,092
|
||||
|
Commitments and Contingencies (Note 14)
|
||||||
|
Stockholders’ equity:
|
||||||
|
Preferred stock, $0.01 par value (2,000,000 shares authorized;
none issued and outstanding)
|
—
|
—
|
||||
|
Common stock, $0.01 par value (40,000,000 shares authorized;
18,081,365 and 18,033,115 shares issued; 7,486,106 and 7,421,426 shares outstanding, respectively)
|
181
|
181
|
||||
|
Additional paid-in capital
|
94,351
|
94,957
|
||||
|
Retained earnings
|
190,839
|
190,616
|
||||
|
Treasury stock at cost (10,595,259 and 10,611,689 shares, respectively)
|
(164,891
|
)
|
(165,507
|
)
|
||
|
Accumulated other comprehensive income, net of tax
|
161
|
210
|
||||
|
Total stockholders’ equity
|
120,641
|
120,457
|
||||
|
Total liabilities and stockholders’ equity
|
$
|
1,084,850
|
$
|
1,175,549
|
||
The accompanying notes are an integral part of these consolidated financial statements.
88
PROVIDENT FINANCIAL HOLDINGS, INC.
Consolidated Statements of Operations
|
Year Ended June 30,
|
||||||||||
|
(In Thousands, Except Per Share Information)
|
2019
|
2018
|
||||||||
|
Interest income:
|
||||||||||
|
Loans receivable, net
|
$
|
40,092
|
$
|
40,016
|
||||||
|
Investment securities
|
2,042
|
1,344
|
||||||||
|
FHLB – San Francisco stock
|
707
|
568
|
||||||||
|
Interest-earning deposits
|
1,537
|
784
|
||||||||
|
Total interest income
|
44,378
|
42,712
|
||||||||
|
Interest expense:
|
||||||||||
|
Deposits
|
3,381
|
3,495
|
||||||||
|
Borrowings
|
2,827
|
2,917
|
||||||||
|
Total interest expense
|
6,208
|
6,412
|
||||||||
|
Net interest income
|
38,170
|
36,300
|
||||||||
|
Recovery from the allowance for loan losses
|
(475
|
)
|
(536
|
)
|
||||||
|
Net interest income, after recovery from the allowance for loan losses
|
38,645
|
36,836
|
||||||||
|
Non-interest income:
|
||||||||||
|
Loan servicing and other fees
|
1,051
|
1,575
|
||||||||
|
Gain on sale of loans, net
|
7,135
|
15,802
|
||||||||
|
Deposit account fees
|
1,928
|
2,119
|
||||||||
|
Loss on sale and operations of real estate owned acquired in the settlement of loans, net
|
(4
|
)
|
(86
|
)
|
||||||
|
Card and processing fees
|
1,568
|
1,541
|
||||||||
|
Other
|
833
|
944
|
||||||||
|
Total non-interest income
|
12,511
|
21,895
|
||||||||
|
Non-interest expense:
|
||||||||||
|
Salaries and employee benefits(1)
|
30,149
|
34,821
|
||||||||
|
Premises and occupancy(2)
|
5,038
|
5,134
|
||||||||
|
Equipment expense(3)
|
2,474
|
1,576
|
||||||||
|
Professional expense
|
1,864
|
1,912
|
||||||||
|
Sales and marketing expense
|
980
|
1,039
|
||||||||
|
Deposit insurance premium and regulatory assessments
|
590
|
749
|
||||||||
|
Other(4)
|
4,141
|
7,973
|
||||||||
|
Total non-interest expense
|
45,236
|
53,204
|
||||||||
|
Income before income taxes
|
5,920
|
5,527
|
||||||||
|
Provision for income taxes(5)
|
1,503
|
3,396
|
||||||||
|
Net income
|
$
|
4,417
|
$
|
2,131
|
||||||
|
Basic earnings per share
|
$
|
0.59
|
$
|
0.28
|
||||||
|
Diluted earnings per share
|
$
|
0.58
|
$
|
0.28
|
||||||
|
Cash dividends per share
|
$
|
0.56
|
$
|
0.56
|
||||||
|
(1)
|
Includes $1.7 million of non-recurring expenses related to scaling back of the origination of saleable single-family mortgage loans for the fiscal year ended June 30, 2019.
|
|
(2)
|
Includes $0.3 million of non-recurring expenses related to scaling back of the origination of saleable single-family mortgage loans for the fiscal year ended June 30, 2019.
|
|
(3)
|
Includes $0.8 million of non-recurring expenses related to scaling back of the origination of saleable single-family mortgage loans for the fiscal year ended June 30, 2019.
|
|
(4)
|
Includes $3.4 million of litigation settlement expenses for the fiscal year ended June 30, 2018.
|
|
(5)
|
Includes a net tax charge of $1.8 million resulting from the revaluation of net deferred tax assets consistent with the Tax Cuts and Jobs Act of 2017 ("Tax Act") for the
fiscal year ended June 30, 2018.
|
The accompanying notes are an integral part of these consolidated financial statements.
89
PROVIDENT FINANCIAL HOLDINGS, INC.
Consolidated Statements of Comprehensive Income
|
Year Ended June 30,
|
||||||||
|
(In Thousands)
|
2019
|
2018
|
||||||
|
Net income
|
$
|
4,417
|
$
|
2,131
|
||||
|
Change in unrealized holding losses on securities available for sale and interest-only strips
|
(70
|
)
|
(137
|
)
|
||||
|
Reclassification of losses to net income
|
—
|
41
|
||||||
|
Other comprehensive loss, before income tax benefit
|
(70
|
)
|
(96
|
)
|
||||
|
Income tax benefit(1)
|
(21
|
)
|
(36
|
)
|
||||
|
Other comprehensive loss
|
(49
|
)
|
(60
|
)
|
||||
|
Total comprehensive income
|
$
|
4,368
|
$
|
2,071
|
||||
(1) Includes income tax benefit from the reclassification of losses to net income.
The accompanying notes are an integral part of these consolidated financial statements.
90
PROVIDENT FINANCIAL HOLDINGS, INC.
Consolidated Statements of Stockholders' Equity
|
Common
Stock
|
Additional
Paid-In
|
Retained
|
Treasury
|
Accumulated
Other
Compre-
hensive
Income (Loss),
|
||||||||||||||||
|
(In Thousands, Except Share Information)
|
Shares
|
Amount
|
Capital
|
Earnings
|
Stock
|
Net of Tax
|
Total
|
|||||||||||||
|
Balance at June 30, 2017
|
7,714,052
|
180
|
93,209
|
192,754
|
(158,142
|
)
|
229
|
128,230
|
||||||||||||
|
Net income
|
2,131
|
2,131
|
||||||||||||||||||
|
Other comprehensive loss
|
(41
|
)
|
(19
|
)
|
(60
|
)
|
||||||||||||||
|
Purchase of treasury stock (1)
|
(386,876
|
)
|
(7,347
|
)
|
(7,347
|
)
|
||||||||||||||
|
Forfeiture of restricted stock
|
18
|
(18
|
)
|
—
|
||||||||||||||||
|
Distribution of restricted stock
|
10,500
|
—
|
||||||||||||||||||
|
Amortization of restricted stock
|
589
|
589
|
||||||||||||||||||
|
Exercise of stock options
|
83,750
|
1
|
676
|
677
|
||||||||||||||||
|
Stock options expense
|
465
|
465
|
||||||||||||||||||
|
Cash dividends(2)
|
(4,228
|
)
|
(4,228
|
)
|
||||||||||||||||
|
Balance at June 30, 2018
|
7,421,426
|
$
|
181
|
$
|
94,957
|
$
|
190,616
|
$
|
(165,507
|
)
|
$
|
210
|
$
|
120,457
|
||||||
|
Net income
|
4,417
|
4,417
|
||||||||||||||||||
|
Other comprehensive loss
|
(49
|
)
|
(49
|
)
|
||||||||||||||||
|
Purchase of treasury stock (1)
|
(73,070
|
)
|
(1,412
|
)
|
(1,412
|
)
|
||||||||||||||
|
Distribution of restricted stock
|
89,500
|
—
|
||||||||||||||||||
|
Amortization of restricted stock
|
515
|
515
|
||||||||||||||||||
|
Award of restricted stock
|
(2,028
|
)
|
2,028
|
—
|
||||||||||||||||
|
Exercise of stock options
|
48,250
|
553
|
553
|
|||||||||||||||||
|
Stock options expense
|
354
|
354
|
||||||||||||||||||
|
Cash dividends(2)
|
(4,194
|
)
|
(4,194
|
)
|
||||||||||||||||
|
Balance at June 30, 2019
|
7,486,106
|
181
|
94,351
|
190,839
|
(164,891
|
)
|
161
|
120,641
|
||||||||||||
|
(1)
|
Includes the repurchase of 21,071 shares and 3,291 shares of distributed restricted stock in fiscal 2019 and 2018, respectively in settlement of employees' withholding tax obligations.
|
|
(2)
|
Cash dividends of $0.56 per share were paid in both fiscal 2019 and 2018.
|
The accompanying notes are an integral part of these consolidated financial statements.
91
Provident Financial Holdings, Inc.
Notes to Consolidated Financial Statements
June 30, 2019
PROVIDENT FINANCIAL HOLDINGS, INC.
Consolidated Statements of Cash Flows
|
Year Ended June 30,
|
||||||||
|
(In Thousands)
|
2019
|
2018
|
||||||
|
Cash flows from operating activities:
|
||||||||
|
Net income
|
$
|
4,417
|
$
|
2,131
|
||||
|
Adjustments to reconcile net income to net cash provided by
operating activities:
|
||||||||
|
Depreciation and amortization
|
3,075
|
3,130
|
||||||
|
Recovery from the allowance for loan losses
|
(475
|
)
|
(536
|
)
|
||||
|
Recovery of losses on real estate owned
|
—
|
(561
|
)
|
|||||
|
Gain on sale of loans, net
|
(7,135
|
)
|
(15,802
|
)
|
||||
|
(Gain) loss on sale of real estate owned, net
|
(9
|
)
|
558
|
|||||
|
Stock-based compensation
|
869
|
1,054
|
||||||
|
Provision for deferred income taxes
|
650
|
165
|
||||||
|
Increase in accounts payable, accrued interest and other liabilities
|
1,865
|
2,174
|
||||||
|
Decrease (increase) in prepaid expenses and other assets
|
774
|
(824
|
)
|
|||||
|
Loans originated for sale
|
(467,094
|
)
|
(1,185,996
|
)
|
||||
|
Proceeds from sale of loans
|
570,154
|
1,222,493
|
||||||
|
Net cash provided by operating activities
|
107,091
|
27,986
|
||||||
|
Cash flows from investing activities:
|
||||||||
|
Decrease (increase) in loans held for investment, net
|
22,479
|
(223
|
)
|
|||||
|
Purchase of investment securities held to maturity
|
(40,682
|
)
|
(54,148
|
)
|
||||
|
Maturity of investment securities held to maturity
|
800
|
200
|
||||||
|
Principal payments from investment securities held to maturity
|
32,765
|
25,497
|
||||||
|
Principal payments from investment securities available for sale
|
1,463
|
1,734
|
||||||
|
Purchase of FHLB – San Francisco stock
|
—
|
(91
|
)
|
|||||
|
Proceeds from sale of real estate owned
|
915
|
2,635
|
||||||
|
Purchase of premises and equipment
|
(449
|
)
|
(2,909
|
)
|
||||
|
Net cash provided by (used for) investing activities
|
17,291
|
(27,305
|
)
|
|||||
(Continued)
92
Provident Financial Holdings, Inc.
Notes to Consolidated Financial Statements
June 30, 2019
PROVIDENT FINANCIAL HOLDINGS, INC.
Consolidated Statements of Cash Flows
|
Year Ended June 30,
|
|||||||
|
(In Thousands)
|
2019
|
2018
|
|||||
|
Cash flows from financing activities:
|
|||||||
|
Decrease in deposits, net
|
(66,327
|
)
|
(18,923
|
)
|
|||
|
Proceeds from long-term borrowings
|
—
|
10,000
|
|||||
|
Repayments of long-term borrowings
|
(10,056
|
)
|
(10,063
|
)
|
|||
|
Repayments of short-term borrowings, net
|
(15,000
|
)
|
—
|
||||
|
Treasury stock purchases
|
(1,412
|
)
|
(7,347
|
)
|
|||
|
Proceeds from exercise of stock options
|
553
|
677
|
|||||
|
Withholding taxes on stock-based compensation
|
(615
|
)
|
(322
|
)
|
|||
|
Cash dividends
|
(4,194
|
)
|
(4,228
|
)
|
|||
|
Net cash used for financing activities
|
(97,051
|
)
|
(30,206
|
)
|
|||
|
Net increase (decrease) in cash and cash equivalents
|
27,331
|
(29,525
|
)
|
||||
|
Cash and cash equivalents at beginning of year
|
43,301
|
72,826
|
|||||
|
Cash and cash equivalents at end of year
|
$
|
70,632
|
$
|
43,301
|
|||
|
Supplemental information:
|
|||||||
|
Cash paid for interest
|
$
|
6,221
|
$
|
6,410
|
|||
|
Cash paid for income taxes
|
$
|
1,555
|
$
|
2,765
|
|||
|
Transfer of loans held for sale to held for investment
|
$
|
1,909
|
$
|
1,692
|
|||
|
Real estate acquired in the settlement of loans
|
$
|
—
|
$
|
2,171
|
|||
93
Provident Financial Holdings, Inc.
Notes to Consolidated Financial Statements
June 30, 2019
Note 1: Organization and Summary of Significant Accounting Policies
Basis of presentation
The consolidated financial statements include the accounts of Provident Financial Holdings, Inc., and its wholly owned subsidiary, Provident Savings Bank, F.S.B. (collectively, the
“Corporation”). All inter-company balances and transactions have been eliminated.
Provident Savings Bank, F.S.B. (the “Bank”) converted from a federally chartered mutual savings bank to a federally chartered stock savings bank effective June 27, 1996. Provident Financial
Holdings, Inc., a Delaware corporation organized by the Bank, acquired all of the capital stock of the Bank issued in the conversion; the transaction was recorded on a book value basis.
The Corporation has determined that it operates in one business segment through the Bank. The Bank's activities include attracting deposits, offering banking services and originating single-family,
multi-family, commercial real estate, construction and, to a lesser extent, other mortgage, commercial business and consumer loans for investment/its loan portfolio. Deposits are collected primarily from 13 banking locations located in Riverside
and San Bernardino counties in California. Additional activities include originating saleable single-family loans, primarily fixed-rate first mortgages. Loans are primarily originated and purchased in Southern and Northern California.
Use of estimates
The accounting and reporting policies of the Corporation conform to generally accepted accounting principles in the United States of America (“GAAP”). The preparation of financial statements in
conformity with generally accepted accounting principles requires management to make estimates and assumptions that affect the reported amounts of assets and liabilities, disclosures of contingent assets and liabilities at the date of the financial
statements, and the reported amounts of revenues and expenses during the reporting period. Actual results could differ from those estimates. Material estimates that are particularly susceptible to significant change in the near term relate to the
determination of the allowance for loan losses and the loan repurchase reserve and the valuation of investment securities, loans held for sale, loans held for investment at fair value, deferred tax assets, loan servicing assets, real estate owned,
derivative financial instruments and deferred compensation costs.
The following accounting policies, together with those disclosed elsewhere in the consolidated financial statements, represent the significant accounting policies of Provident Financial Holdings,
Inc. and the Bank.
Cash and cash equivalents
Cash and cash equivalents include cash on hand and due from banks, as well as overnight deposits placed at correspondent banks.
Investment securities
The Corporation classifies its qualifying investments as available for sale or held to maturity. The Corporation classifies investments as held to maturity when it has the ability and it is
management’s positive intent to hold such securities to maturity. Securities held to maturity are carried at amortized historical cost. All other securities are classified as available for sale and are carried at fair value. Fair value generally
is determined based upon quoted market prices. Changes in net unrealized gains (losses) on securities available for sale are included in accumulated other comprehensive income, net of tax. Gains and losses on sale or dispositions of investment
securities are included in non-interest income and are determined using the specific identification method. Purchase premiums and discounts are amortized over the expected average life of the securities using the effective interest method.
94
Provident Financial Holdings, Inc.
Notes to Consolidated Financial Statements
June 30, 2019
Investment securities are reviewed annually for possible other-than-temporary impairment (“OTTI”). For debt securities, an OTTI is evident if the Corporation intends to sell the debt security or
will more likely than not be required to sell the debt security before full recovery of the entire amortized cost basis is realized. However, even if the Corporation does not intend to sell the debt security and will not likely be required to sell
the debt security before recovery of its entire amortized cost basis, the Corporation must evaluate expected cash flows to be received and determine if a credit loss has occurred. In the event of a credit loss, the credit component of the impairment
is recognized within non-interest income and the non-credit component is recognized through accumulated other comprehensive income, net of tax.
Loans held for investment
Loans held for investment consist of long-term adjustable rate loans secured by first trust deeds on single-family residences. Additionally, multi-family and commercial real estate loans secured
by commercial property, land and other residential properties have become a substantial part of loans held for investment and comprised of 63% and 65% of total loans held for investment at June 30, 2019 and 2018, respectively. These loans are
generally offered to customers and businesses located in California.
Net loan origination fees and certain direct origination expenses are deferred and amortized to interest income over the contractual life of the loan using the effective interest
method. Amortization is discontinued for non-performing loans. Interest receivable represents, for the most part, the current month’s interest, which will be included as a part of the borrower’s next monthly loan payment. Interest receivable is
accrued only if deemed collectible. Loans are placed on non-performing status when they become 90 days past due or if the loan is deemed impaired. When a loan is placed on non-performing status, interest accrued but not received is reversed against
interest income. Interest income on non-performing loans is subsequently recognized only to the extent that cash is received and the principal balance is deemed collectible. If the principal balance is not deemed collectible, the entire payment
received (principal and interest) is applied to the outstanding loan balance. Non-performing loans that become current as to both principal and interest are returned to accrual status after demonstrating satisfactory payment history (usually six
consecutive months) and when future payments are expected to be collected.
Allowance for loan losses
The allowance for loan losses involves significant judgment and assumptions by management, which has a material impact on the carrying value of net loans. Management considers the accounting
estimate related to the allowance for loan losses a critical accounting estimate because it is highly susceptible to changes from period to period, requiring management to make assumptions about probable incurred losses inherent in the loan portfolio
at the balance sheet date. The impact of a sudden large loss could deplete the allowance and require increased provisions to replenish the allowance, which would negatively affect earnings.
The allowance is based on two principles of accounting: (i) ASC 450, “Contingencies,” which requires that losses be accrued when they are probable of occurring and can be estimated; and (ii) ASC
310, “Receivables,” which requires that losses be accrued for non-performing loans that may be determined on an individually evaluated basis or based on an aggregated pooling method. The allowance has two components: collectively evaluated allowances
and individually evaluated allowances. Each of these components is based upon estimates that can change over time. The allowance is based on historical experience and, as a result, can differ from actual losses incurred in the
future. Additionally, differences may result from qualitative factors such as unemployment data, gross domestic product, interest rates, retail sales, the value of real estate and real estate market conditions. The historical data is reviewed at
least quarterly and adjustments are made as needed. Management considers, based on currently available information, the allowance for loan losses sufficient to absorb probable losses inherent in loans held for investment. Various techniques are used
to arrive at an individually evaluated allowance, including discounted cash
95
Provident Financial Holdings, Inc.
Notes to Consolidated Financial Statements
June 30, 2019
flows and the fair market value of collateral. The use of these techniques is inherently subjective and the actual losses could be greater or
less than the estimates.
Loans originated and held for sale
Mortgage loans are originated for both investment and sale to the secondary market. Since the Corporation is primarily a single-family adjustable-rate mortgage (“ARM”) lender for its own loan
portfolio, a high percentage of fixed-rate loans are originated for sale to institutional investors. Loans held for sale consist primarily of long-term fixed-rate loans secured by first trust deeds on single-family residences, the majority of which
are Federal Housing Administration (“FHA”), United States Department of Veterans Affairs (“VA”), Fannie Mae and Freddie Mac loan products. The loans are generally offered to customers located in (a) Southern California, primarily in Riverside and
San Bernardino counties, commonly known as the Inland Empire, and Orange, Los Angeles, San Diego and other surrounding counties and (b) Northern California, primarily Alameda, Placer, San Luis Obispo and other surrounding counties. The loans have
been hedged with loan sale commitments, TBA MBS trades and option contracts. The loan sale settlement period is generally between 20 to 30 days from the date of the loan funding.
The Corporation adopted Accounting Standards Codification (“ASC”) 820, “Fair Value Measurements and Disclosures,” and elected the fair value option (ASC 825, “Financial Instruments”) on loans held
for sale. ASC 825 allows for the option to report certain financial assets and liabilities at fair value initially and at subsequent measurement dates with changes in fair value included in earnings. The option may be applied instrument by
instrument, but it is irrevocable. The Corporation has elected the fair value option on loans held for sale and believes the fair value option most closely aligns the timing of the recognition of non-interest income and non-interest expense. Fair
value is generally determined by measuring the value of outstanding loan sale commitments in comparison to investors’ current yield requirements as calculated on the aggregate loan basis. Loans are generally sold without recourse, other than
standard representations and warranties. A high percentage of loans are sold on a servicing released basis. In some transactions, the Corporation may retain the servicing rights in order to generate servicing income. Where the Corporation
continues to service loans after sale, investors are paid their share of the principal collections together with interest at an agreed-upon rate, which generally differs from the loan’s contractual interest rate.
Loans previously sold to the FHLB – San Francisco under the Mortgage Partnership Finance (“MPF”) program have a recourse liability. The FHLB – San Francisco absorbs the first four basis points of
loss by establishing a first loss account and a credit scoring process is used to calculate the maximum recourse amount for the Bank. All losses above the Bank’s maximum recourse are the responsibility of the FHLB – San Francisco. The FHLB – San
Francisco pays the Bank a credit enhancement fee on a monthly basis to compensate the Bank for accepting the recourse obligation. As of June 30, 2019, the Bank serviced $9.7 million of loans under this program and has established a recourse
liability of $50,000 as compared to $11.8 million of loans serviced and a recourse liability of $83,000 at June 30, 2018.
Occasionally, the Bank is required to repurchase loans sold to Freddie Mac, Fannie Mae or other investors if it is determined that such loans do not meet the credit requirements of the investor, or
if one of the parties involved in the loan misrepresented pertinent facts, committed fraud, or if such loans were 90-days past due within 120 days of the loan funding date. During the years ended June 30, 2019 and 2018, the Bank repurchased $948,000
and $602,000 of single-family loans, respectively. No other repurchase requests, which did not result in the repurchase of the loan itself, were settled in fiscal 2019 and 2018. In addition to the specific recourse liability for the MPF program,
the Bank established a recourse liability of $200,000 for loans sold to other investors as of both, June 30, 2019 and 2018.
96
Provident Financial Holdings, Inc.
Notes to Consolidated Financial Statements
June 30, 2019
Activity in the recourse liability for the years ended June 30, 2019 and 2018 was as follows:
|
For Year Ended June 30,
|
||||||
|
(In Thousands)
|
2019
|
2018
|
||||
|
Balance, beginning of year
|
$
|
283
|
$
|
305
|
||
|
Recourse recovery
|
(33
|
)
|
(22
|
)
|
||
|
Balance, end of the year
|
$
|
250
|
$
|
283
|
||
The Bank is obligated to refund loan sale premiums to investors when a loan pays off within a specific time period following the loan sale; the time period ranges from three to six months,
depending upon the loan sale agreement. Total loan sale premium refunds in fiscal 2019 and 2018 were $96,000 and $648,000, respectively. As of June 30, 2019 and 2018, the Bank’s estimated liability was $25,000 and $113,000, respectively, for future
loan sale premium refunds.
Gains or losses on the sale of loans, including fees received or paid, are recognized at the time of sale and are determined by the difference between the net sales proceeds and the allocated book
value of the loans sold.
Mortgage servicing assets (“MSA”) are amortized in proportion to and over the period of the estimated net servicing income and are carried at the lower of cost or fair value. The fair value of MSA
is based on the present value of estimated net future cash flows related to contractually specified servicing fees. The Bank periodically evaluates MSA for impairment, which is measured as the excess of cost over fair value. For additional
information, see Note 4 of the Notes to Consolidated Financial Statements, “Mortgage Loan Servicing and Loans Originated for Sale.”
Allowance for unfunded loan commitments
The Corporation maintains the allowance for unfunded loan commitments at a level that is adequate to absorb estimated probable losses related to these unfunded credit facilities. The Corporation
determines the adequacy of the allowance based on periodic evaluations of the unfunded credit facilities, including an assessment of the probability of commitment usage, credit risk factors for loans outstanding to these same customers, and the terms
and expiration dates of the unfunded credit facilities. The allowance for unfunded loan commitments is recorded in other liabilities on the Consolidated Statements of Financial Condition. Net adjustments to the allowance for unfunded loan
commitments are included in other non-interest expense on the Consolidated Statements of Operations.
Troubled debt restructuring (“restructured loans”)
A restructured loan is a loan which the Corporation, for reasons related to a borrower’s financial difficulties, grants a concession to the borrower that the Corporation would not otherwise
consider. These financial difficulties include, but are not limited to, the borrowers default status on any of their debts, bankruptcy and recent changes in their financial circumstances (loss of job, etc.).
The loan terms which have been modified or restructured due to a borrower’s financial difficulty, may include but are not limited to:
|
a)
|
A reduction in the stated interest rate.
|
|
b)
|
An extension of the maturity at an interest rate below market.
|
|
c)
|
A reduction in the accrued interest.
|
|
d)
|
Extensions, deferrals, renewals and rewrites.
|
|
e)
|
Loans that have been discharged in a Chapter 7 Bankruptcy that have not been reaffirmed by the borrower.
|
97
Provident Financial Holdings, Inc.
Notes to Consolidated Financial Statements
June 30, 2019
To qualify for restructuring, a borrower must provide evidence of creditworthiness such as, current financial statements, most recent income tax returns, current paystubs, current W-2s, and most
recent bank statements, among other documents, which are then verified by the Corporation. The Corporation re-underwrites the loan with the borrower's updated financial information, new credit report, current loan balance, new interest rate,
remaining loan term, updated property value and modified payment schedule, among other considerations, to determine if the borrower qualifies.
The Corporation measures the allowance for loan losses of restructured loans based on the difference between the loan's original carrying amount and the present value of expected future cash flows
discounted at the original effective yield of the loan. Based on the Office of the Comptroller of the Currency's ("OCC") guidance with respect to restructured loans and to conform to general practices within the banking industry, the Corporation
maintains certain restructured loans on accrual status, provided there is reasonable assurance of repayment and performance, consistent with the modified terms based upon a current, well-documented credit evaluation.
Other restructured loans are classified as “Substandard” and placed on non-performing status. The Corporation upgrades restructured single-family loans to the pass category if the borrower has
demonstrated satisfactory contractual payments for at least six consecutive months or 12 consecutive months for those loans that were restructured more than once. Once the borrower has demonstrated satisfactory contractual payments beyond 12
consecutive months, the loan is no longer categorized as a restructured loan. In addition to the payment history described above; multi-family, commercial real estate, construction and commercial business loans must also demonstrate a combination of
corroborating characteristics to be upgraded, such as: satisfactory cash flow, satisfactory guarantor support, and additional collateral support, among others.
Non-performing loans
The Corporation assesses loans individually and classifies as non-performing loans when the accrual of interest has been discontinued, loans have been restructured or management has serious doubts
about the future collectibility of principal and interest, even though the loans may currently be performing. Factors considered in determining classification include, but are not limited to, expected future cash flows, the financial condition of
the borrower and current economic conditions. The Corporation measures each non-performing loan based on ASC 310, establishes a collectively evaluated or individually evaluated allowance and charges off those loans or portions of loans deemed
uncollectible.
Real estate owned
Real estate acquired through foreclosure is initially recorded at the fair value of the real estate acquired, less estimated selling costs. Subsequent to foreclosure, the Corporation charges
current earnings for estimated losses if the carrying value of the property exceeds its fair value. Gains or losses on the sale of real estate are recognized upon disposition of the property. Costs relating to improvement, maintenance and repairs
of the property are expensed as incurred under gain (loss) on sale and operations of real estate owned acquired in the settlement of loans within the Consolidated Statements of Operations.
Impairment of long-lived assets
The Corporation reviews its long-lived assets for impairment annually or when events or circumstances indicate that the carrying amount of these assets may not be recoverable. Long-lived assets
include buildings, land, fixtures, furniture and equipment. An asset is considered impaired when the expected discounted cash flows over the remaining useful life are less than the net book value. When impairment is indicated for an asset, the
amount of impairment loss is the excess of the net book value over its fair value.
98
Provident Financial Holdings, Inc.
Notes to Consolidated Financial Statements
June 30, 2019
Premises and equipment
Premises and equipment are stated at cost, less accumulated depreciation and amortization. Depreciation is computed primarily on a straight-line basis over the estimated useful lives as follows:
|
Buildings
|
10 to 40 years
|
|
|
Furniture and fixtures
|
3 to 10 years
|
|
|
Automobiles
|
3 to 5 years
|
|
|
Computer equipment
|
3 to 5 years
|
Leasehold improvements are amortized over the lesser of their respective lease terms or the useful life of the improvement, which ranges from one to 10 years. Maintenance and repair costs are
charged to operations as incurred.
Income taxes
The Corporation accounts for income taxes in accordance with ASC 740, “Income Taxes.” ASC 740 requires the affirmative evaluation that it is more likely than not, based on the technical merits of
a tax position, that an enterprise is entitled to economic benefits resulting from positions taken in income tax returns. If a tax position does not meet the more-likely-than-not recognition threshold, the benefit of that position is not recognized
in the financial statements.
ASC 740 requires that when determining the need for a valuation allowance against a deferred tax asset, management must assess both positive and negative evidence with regard to the realizability
of the tax losses represented by that asset. To the extent available, if sources of taxable income are insufficient to absorb tax losses, a valuation allowance is necessary. Sources of taxable income for this analysis include prior years’ tax
returns, the expected reversals of taxable temporary differences between book and tax income, prudent and feasible tax-planning strategies, and future taxable income. The deferred income tax asset related to the allowance for loan losses will be
realized when actual charge-offs are made against the allowance. Based on the availability of loss carry-backs and projected taxable income during the periods for which loss carry-forwards are available, management believes it is more likely than
not the Corporation will realize the deferred tax asset. The Corporation continues to monitor the deferred tax asset on a quarterly basis for a valuation allowance. The future realization of these tax benefits primarily hinges on adequate future
earnings to utilize the tax benefit. Prospective earnings or losses, tax law changes or capital changes could prompt the Corporation to reevaluate the assumptions which may be used to establish a valuation allowance. As of June 30, 2019 and 2018,
the estimated deferred tax asset was $3.5 million and $4.2 million, respectively. The Corporation maintains net deferred tax assets for deductible temporary tax differences, such as loss reserves, deferred compensation, non-accrued interest and
unrealized gains, among other items. The decrease in the net deferred tax asset resulted primarily from items related to loss reserves and unpaid litigation expense, partly offset by increases in PBM rescaling costs and decreases in unrealized gains
and losses on assets measured at fair value. The Corporation did not have any liabilities for uncertain tax positions or any known unrecognized tax benefit at June 30, 2019 or 2018.
Bank owned life insurance (“BOLI”)
ASC 715-60-35, "Accounting for Deferred Compensation and Postretirement Benefit Aspects of Endorsement Split-Dollar Life Insurance Arrangements," requires an employer to recognize obligations
associated with endorsement split-dollar life insurance arrangements that extend into the participant's post-employment benefit cost for the continuing life insurance or based on the future death benefit depending on the contractual terms of the
underlying agreement. The Corporation adopted ASC 715-60-35 using the latter option, i.e., based on the future death benefit. The Bank purchases BOLI policies on the lives of certain executive officers while they are employed by the Bank and is the
owner and beneficiary of the policies. The Bank invests in BOLI to provide an efficient form of funding for long-term retirement and other employee benefits costs. The Bank records these BOLI policies within prepaid expenses and other assets in the
Consolidated Statements of Financial Condition at each
99
Provident Financial Holdings, Inc.
Notes to Consolidated Financial Statements
June 30, 2019
policy’s respective cash surrender value, with net changes recorded in other non-interest income in the Consolidated Statements of Operations.
Cash dividend
A declaration or payment of dividends is at the discretion of the Corporation’s Board of Directors, who take into account the Corporation’s financial condition, results of operations, tax
considerations, capital requirements, industry standards, economic conditions and other factors, including the regulatory restrictions which affect the payment of dividends by the Bank to the Corporation. Under Delaware law, dividends may be paid
either out of surplus or, if there is no surplus, out of net profits for the current fiscal year and/or the preceding fiscal year in which the dividend is declared. For additional information, see Note 22 of the Notes to Consolidated Financial
Statements regarding the subsequent event related to the cash dividend.
Stock repurchases
The Corporation repurchases its common stock consistent with Board-approved stock repurchase plans. As of June 30, 2019, a total of 51,999 shares of common stock were purchased during fiscal 2019
at an average cost of $19.74 per share, and 321,001 shares remain available for future repurchase pursuant to the Corporation’s April 2018 stock repurchase plan. In addition, the Corporation purchased 21,071 shares of distributed restricted stock in
settlement of employees' withholding tax obligations.
Earnings per common share (“EPS”)
Basic EPS represents net income divided by the weighted average common shares outstanding during the period excluding any potential dilutive effects. Diluted EPS gives effect to any potential
issuance of common stock that would have caused basic EPS to be lower as if the issuance had already occurred. Accordingly, diluted EPS reflects an increase in the weighted average shares outstanding as a result of the assumed exercise of stock
options and the vesting of restricted stock. The computation of diluted EPS does not assume exercise of stock options and vesting of restricted stock that would have an anti-dilutive effect on EPS.
Stock-based compensation
ASC 718, “Compensation – Stock Compensation,” requires companies to recognize in the statement of operations the grant-date fair value of stock options and other equity-based compensation issued to
employees and directors. Stock-based compensation expense, inclusive of restricted stock expense, recognized in the consolidated statements of operations for the years ended June 30, 2019 and 2018 was $869,000 and $1.1 million, respectively.
Employee Stock Ownership Plan ("ESOP")
The Corporation recognizes compensation expense when the Bank contributes funds to the ESOP for the purchase of the Corporation’s common stock to be allocated to the ESOP participants. Since the
contributions are discretionary, the benefits payable under the ESOP cannot be estimated.
Restricted stock
The Corporation recognizes compensation expense over the vesting period of the shares awarded, equal to the fair value of the shares at the award date. A total of $515,000 and $589,000 of
restricted stock was amortized during fiscal 2019 and 2018, respectively.
Post-retirement benefits
The estimated obligation for post-retirement health care and life insurance benefits is determined based on an actuarial computation of the cost of current and future benefits for the eligible
(grandfathered) retirees and employees. The post retirement benefit liability is included in accounts payable, accrued interest and other liabilities in the Consolidated Statements
100
Provident Financial Holdings, Inc.
Notes to Consolidated Financial Statements
June 30, 2019
of Financial Condition. Effective July 1, 2003, the Corporation discontinued the post -retirement health care and life insurance benefits to any employee not previously qualified (grandfathered)
for these benefits. At June 30, 2019 and 2018, the accrued liability for post-retirement benefits was $196,000 and $204,000, respectively, which was fully funded consistent with actuarially determined estimates of the future obligation.
Comprehensive income
ASC 220, “Comprehensive Income,” requires that realized revenue, expenses, gains and losses be included in net income (loss). Unrealized gains (losses) on available for sale securities and
interest-only strips are reported as a separate component of the stockholders’ equity section of the Consolidated Statements of Financial Condition and the change in the unrealized gains (losses) are reported on the Consolidated Statements of
Comprehensive Income and Consolidated Statements of Stockholders' Equity.
Accounting standard updates (“ASU”)
ASU 2015-14:
In August 2015, the Financial Accounting Standards Board ("FASB") issued ASU 2015-14, "Revenue from Contracts with Customers (Topic 606)," which defers the effective date of ASU No. 2014-09 one
year. ASU No. 2014-09 created Topic 606 and supersedes Topic 605, Revenue Recognition. The core principle of Topic 606 is that an entity recognizes revenue to depict the transfer of promised goods or services to customers in an amount that reflects
the consideration to which the entity expects to be entitled in exchange for those goods or services. In general, the new guidance requires companies to use more judgment and make more estimates than under current guidance, including identifying
performance obligations in the contract, estimating the amount of variable consideration to include in the transaction price and allocating the transaction price to each separate performance obligation. For financial reporting purposes, the standard
allows for either full retrospective adoption, meaning the standard is applied to all of the periods presented, or modified retrospective adoption, meaning the standard is applied only to the most current period presented in the financial statements
with the cumulative effect of initially applying the standard recognized at the date of initial application. Management adopted the new guidance on July 1, 2018. The adoption of this ASU did not have a material impact on the Corporation’s
Consolidated Financial Statements. See Note 17 for additional discussion.
ASU 2016-02:
In February 2016, the FASB issued ASU 2016-02, “Leases (Topic 842).” This ASU introduces a lessee model that brings most leases on the balance sheet and aligns many of the underlying principles of
the new lessor model with those in the new revenue recognition standard, ASC 606, Revenue From Contracts With Customers. The new leases standard represents a wholesale change to lease accounting requiring the recognition of lease assets and lease
liabilities in the balance sheet and disclosure of key information about leasing arrangements. The principal change required by ASU 2016-02 relates to lessee accounting, for operating leases, a lessee is required to (1) recognize a right-of-use asset
and a lease liability, initially measured at the present value of the lease payments, in the statement of financial position, (2) recognize a single lease cost, calculated so that the cost of the lease is allocated over the lease term generally on a
straight-line basis, and (3) classify all cash payments within operating activities in the statement of cash flows. For leases with an initial term of 12 months or less, a lessee is permitted to make an accounting policy election by class of
underlying asset not to recognize lease assets and lease liabilities. If a lessee makes this election, it should recognize lease expense for such leases generally on a straight-line basis over the lease term. ASU 2016-02 also changes disclosure
requirements related to leasing activities and requires certain qualitative disclosures along with specific quantitative disclosures. This ASU will be effective for annual periods beginning after December 15, 2018 (i.e., calendar periods beginning on
January 1, 2019), and interim periods therein, early adoption is permitted. In July 2018, the FASB issued ASU 2018-11, Leases, Targeted Improvements, which allows entities the option of initially applying the new leases standard at the adoption date
(such as January 1, 2019, for calendar year-end public business entities) and recognize a
101
Provident Financial Holdings, Inc.
Notes to Consolidated Financial Statements
June 30, 2019
cumulative-effect adjustment to the opening balance of retained earnings in the period of adoption. In January 2019, the FASB issued ASU 2019-01, Codification Improvements. The amendments in this
update include the following items: (i) determining the fair value of the underlying asset by lessors that are not manufacturers or dealers; (ii) requiring cash received from lessors from sales-type and direct financing leases to be presented in the
cash flow statement within investing activities; and (iii) clarifying interim disclosure requirements. The effective date and transition requirements for the first and second items of this ASU are effective for annual periods, and interim periods
within those annual periods, beginning after December 15, 2019 and early adoption is permitted. The effective date and transition requirements for the third item of this ASU are the same as ASU 2016-02. The Corporation plans to adopt these ASUs on
July 1, 2019 utilizing the transition method allowed under ASU 2018-11 and will not restate comparative periods. The Corporation will also elect to not recognize lease assets and lease liabilities for leases with an initial term of 12 months or less.
The Corporation expects the adoption of these ASUs will result in an increase in premises and equipment and an increase in other liabilities of approximately $3.3 million. The Corporation does not expect the adoption of these ASUs to have a material
impact on the Corporation’s Consolidated Financial Statements.
ASU 2016-13:
In June 2016, the FASB issued ASU 2016-13, “Financial Instruments — Credit Losses (Topic 326): Measurement of Credit Losses on Financial Instruments,” and subsequent amendment to the initial
guidance in November 2018, ASU No. 2018-19, Codification Improvements to Topic 326, Financial Instruments—Credit Losses, in April 2019, ASU 2019-04, Codification Improvements to Topic 326, Financial Instruments—Credit Losses, Topic 815, Derivatives
and Hedging, and Topic 825, Financial Instruments, and in May 2019, ASU 2019-05 Financial Instruments—Credit Losses, Topic 326, all of which clarifies codification and corrects unintended application of the guidance. This ASU requires organizations
to measure all expected credit losses for financial instruments held at the reporting date based on historical experience, current conditions and reasonable and supportable forecasts. ASU 2018-19 clarifies that receivables arising from operating
leases are accounted for using lease guidance and not as financial instruments. ASU 2019-04, “Codification Improvements to Topic 326, Financial Instruments—Credit Losses, Topic 815, Derivatives and Hedging, and Topic 825, Financial Instruments,”
affects a variety of topics in the Codification and applies to all reporting entities within the scope of the affected accounting guidance. ASU 2019-05 allows entities to irrevocably elect, upon adoption of ASU 2016-13, the fair value option on
financial instruments that (1) were previously recorded at amortized cost and (2) are within the scope of ASC 326-20 if the instruments are eligible for the fair value option under ASC 825-10. The fair value option election does not apply to
held-to-maturity debt securities. Entities are required to make this election on an instrument-by-instrument basis. These ASUs will be effective for fiscal years beginning after December 15, 2019, including interim periods within those fiscal years,
however, the FASB board proposed in July 2019 extending the adoption date for certain SEC filers, including the Corporation, to fiscal years beginning after December 15, 2022 The Corporation is evaluating its current expected loss methodology of its
loan and investment portfolios to identify the necessary modifications in accordance with these standards and expects a change in the processes and procedures to calculate the allowance for loan losses, including changes in assumptions and estimates
to consider expected credit losses over the life of the loan versus the current accounting practice that utilizes the incurred loss model. A valuation adjustment to its allowance for loan losses or investment portfolio that is identified in this
process will be reflected as a one-time adjustment in equity rather than earnings upon adoption. The Corporation is in the process of compiling historical data that will be used to calculate expected credit losses on its loan portfolio to ensure the
Corporation is fully compliant with these ASUs at the adoption date and is evaluating the potential impact adoption of this ASU will have on the Corporation’s Consolidated Financial Statements.
ASU 2017-07:
In March 2017, the FASB issued ASU 2017-07, “Compensation—Retirement Benefits (Topic 715): Improving the Presentation of Net Periodic Pension Cost and Net Periodic Post-Retirement Benefit Cost.”
This ASU requires an employer to report the service cost component in the same line item or items as other compensation costs arising from services rendered by the pertinent employees during the period. The other components of net benefit cost as
defined in paragraphs 715-30-35-4 and
102
Provident Financial Holdings, Inc.
Notes to Consolidated Financial Statements
June 30, 2019
715-60-35-9 are required to be presented in the income statement separately from the service cost component and outside a subtotal of income from operations, if one is presented. If a separate line
item or items are used to present the other components of net benefit cost, that line item or items must be appropriately described. If a separate line item or items are not used, the line item or items used in the income statement to present the
other components of net benefit cost must be disclosed. Management adopted the new guidance on July 1, 2018. The Corporation’s adoption of this ASU did not have a material impact on the Corporation’s Consolidated Financial Statements.
ASU 2018-13:
In August 2018, the FASB issued ASU 2018-13, Disclosure Framework – Changes to the Disclosure Requirements for Fair Value Measurement, which modifies disclosure requirements on fair value
measurements to improve their effectiveness. The guidance permits entities to consider materiality when evaluating fair value measurement disclosures and, among other modifications, requires certain new disclosures related to Level 3 fair value
measurements. The guidance will be effective beginning January 1, 2020, with early adoption permitted. The guidance only affects disclosures in the notes to the consolidated financial statements and will not otherwise affect the Corporation’s
Consolidated Financial Statements.
Note 2: Investment Securities
The amortized cost and estimated fair value of investment securities as of June 30, 2019 and 2018 were as follows:
|
June 30, 2019
|
Amortized
Cost
|
Gross
Unrealized
Gains
|
Gross
Unrealized
(Losses)
|
Estimated
Fair
Value
|
Carrying
Value
|
||||||||||
|
(In Thousands)
|
|||||||||||||||
|
Held to maturity
|
|||||||||||||||
|
U.S. government sponsored enterprise MBS
|
$
|
90,394
|
$
|
1,289
|
$
|
(14
|
)
|
$
|
91,669
|
$
|
90,394
|
||||
|
U.S. SBA securities(1)
|
2,896
|
—
|
(6
|
)
|
2,890
|
2,896
|
|||||||||
|
Certificate of deposits
|
800
|
—
|
—
|
800
|
800
|
||||||||||
|
Total investment securities - held to maturity
|
$
|
94,090
|
$
|
1,289
|
$
|
(20
|
)
|
$
|
95,359
|
$
|
94,090
|
||||
|
Available for sale
|
|||||||||||||||
|
U.S. government agency MBS
|
$
|
3,498
|
$
|
116
|
$
|
(1
|
)
|
$
|
3,613
|
$
|
3,613
|
||||
|
U.S. government sponsored enterprise MBS
|
1,998
|
89
|
—
|
2,087
|
2,087
|
||||||||||
|
Private issue CMO(2)
|
261
|
8
|
—
|
269
|
269
|
||||||||||
|
Total investment securities - available for sale
|
$
|
5,757
|
$
|
213
|
$
|
(1
|
)
|
$
|
5,969
|
$
|
5,969
|
||||
|
Total investment securities
|
$
|
99,847
|
$
|
1,502
|
$
|
(21
|
)
|
$
|
101,328
|
$
|
100,059
|
||||
|
(1)
|
Small Business Administration ("SBA").
|
|
(2)
|
Collateralized Mortgage Obligations (“CMO”).
|
103
Provident Financial Holdings, Inc.
Notes to Consolidated Financial Statements
June 30, 2019
|
June 30, 2018
|
Amortized
Cost
|
Gross
Unrealized
Gains
|
Gross
Unrealized
(Losses)
|
Estimated
Fair
Value
|
Carrying
Value
|
||||||||||
|
(In Thousands)
|
|||||||||||||||
|
Held to maturity
|
|||||||||||||||
|
U.S. government sponsored enterprise MBS
|
$
|
84,227
|
$
|
203
|
$
|
(762
|
)
|
$
|
83,668
|
$
|
84,227
|
||||
|
U.S. SBA securities(1)
|
2,986
|
—
|
(15
|
)
|
2,971
|
2,986
|
|||||||||
|
Certificate of deposits
|
600
|
—
|
—
|
600
|
600
|
||||||||||
|
Total investment securities - held to maturity
|
$
|
87,813
|
$
|
203
|
$
|
(777
|
)
|
$
|
87,239
|
$
|
87,813
|
||||
|
Available for sale
|
|||||||||||||||
|
U.S. government agency MBS
|
$
|
4,234
|
$
|
150
|
$
|
—
|
$
|
4,384
|
$
|
4,384
|
|||||
|
U.S. government sponsored enterprise MBS
|
2,640
|
122
|
—
|
2,762
|
2,762
|
||||||||||
|
Private issue CMO(2)
|
346
|
4
|
—
|
350
|
350
|
||||||||||
|
Total investment securities - available for sale
|
$
|
7,220
|
$
|
276
|
$
|
—
|
$
|
7,496
|
$
|
7,496
|
|||||
|
Total investment securities
|
$
|
95,033
|
$
|
479
|
$
|
(777
|
)
|
$
|
94,735
|
$
|
95,309
|
||||
|
(1)
|
Small Business Administration ("SBA").
|
|
(2)
|
Collateralized Mortgage Obligations (“CMO”).
|
In fiscal 2019 and 2018, the Corporation received MBS principal payments of $34.2 million and $27.2 million, respectively and did not sell any investment securities. The Corporation purchased
mortgage-backed securities totaling $39.9 million and $53.9 million during fiscal 2019 and 2018, respectively.
104
Provident Financial Holdings, Inc.
Notes to Consolidated Financial Statements
June 30, 2019
As of June 30, 2019 and 2018, the Corporation held investments with unrealized loss position of $21,000 and $777,000, respectively.
|
As of June 30, 2019
|
Unrealized Holding
Losses
|
Unrealized Holding
Losses |
Unrealized Holding
Losses
|
|||||||||||||||||
|
(In Thousands)
|
Less Than 12 Months
|
12 Months or More
|
Total
|
|||||||||||||||||
|
Fair
|
Unrealized
|
Fair
|
Unrealized
|
Fair
|
Unrealized
|
|||||||||||||||
|
Description of Securities
|
Value
|
Losses
|
Value
|
Losses
|
Value
|
Losses
|
||||||||||||||
|
Held to maturity
|
||||||||||||||||||||
|
U.S. government sponsored enterprise MBS
|
$
|
6,507
|
$
|
8
|
$
|
1,657
|
$
|
6
|
$
|
8,164
|
$
|
14
|
||||||||
|
U.S. SBA securities
|
—
|
$
|
—
|
2,883
|
6
|
2,883
|
6
|
|||||||||||||
|
Total investment securities – held to maturity
|
$
|
6,507
|
$
|
8
|
$
|
4,540
|
$
|
12
|
$
|
11,047
|
$
|
20
|
||||||||
|
Available for sale
|
||||||||||||||||||||
|
U.S. government agency MBS
|
$
|
289
|
$
|
1
|
$
|
—
|
$
|
—
|
$
|
289
|
$
|
1
|
||||||||
|
Total investment securities – available for sale
|
$
|
289
|
$
|
1
|
$
|
—
|
$
|
—
|
$
|
289
|
$
|
1
|
||||||||
|
Total investment securities
|
$
|
6,796
|
$
|
9
|
$
|
4,540
|
$
|
12
|
$
|
11,336
|
$
|
21
|
||||||||
|
|
||||||||||||||||||||
|
As of June 30, 2018
|
Unrealized Holding
Losses
|
Unrealized Holding
Losses
|
Unrealized Holding
Losses
|
|||||||||||||||||
|
(In Thousands)
|
Less Than 12 Months
|
12 Months or More
|
Total
|
|||||||||||||||||
|
Fair
|
Unrealized
|
Fair
|
Unrealized
|
Fair
|
Unrealized
|
|||||||||||||||
|
Description of Securities
|
Value
|
Losses
|
Value
|
Losses
|
Value
|
Losses
|
||||||||||||||
|
Held to maturity
|
||||||||||||||||||||
|
U.S. government sponsored enterprise MBS
|
$
|
47,045
|
$
|
762
|
$
|
—
|
$
|
—
|
$
|
47,045
|
$
|
762
|
||||||||
|
U.S. SBA securities
|
2,964
|
15
|
—
|
—
|
2,964
|
15
|
||||||||||||||
|
Total investment securities
|
$
|
50,009
|
$
|
777
|
$
|
—
|
$
|
—
|
$
|
50,009
|
$
|
777
|
||||||||
As of June 30, 2019, the Corporation had investment securities with unrealized holding losses of $9,000 that were less than 12 months and $12,000 that were in an unrealized loss position for more
than 12 months, as compared to investment securities at June 30, 2018 with unrealized holding losses of $777,000 that were less than 12 months. The unrealized loss at June 30, 2019 was attributable to one U.S. government agency MBS, three U.S.
government sponsored enterprise MBS and one U.S. SBA security and, based on the nature of the investments, management concluded that such unrealized losses were not other than temporary; while the unrealized loss at June 30, 2018 was attributable to
13 U.S. government sponsored enterprise MBS and one U.S. SBA security, and based on the nature of the investments, management concluded that such unrealized losses were not other than temporary. The Corporation does not believe that there was any
OTTI at June 30, 2019 and 2018. At each of these dates, the Corporation intended and had the ability to hold the investment securities and was not likely to be required to sell the securities before realizing a full recovery.
105
Provident Financial Holdings, Inc.
Notes to Consolidated Financial Statements
June 30, 2019
Contractual maturities of investment securities as of June 30, 2019 and 2018 were as follows:
|
June 30, 2019
|
June 30, 2018
|
||||||||||||
|
(In Thousands)
|
Amortized
Cost |
Estimated
Fair Value |
Amortized
Cost |
Estimated
Fair Value |
|||||||||
|
Held to maturity
|
|||||||||||||
|
Due in one year or less
|
$
|
400
|
$
|
400
|
$
|
600
|
$
|
600
|
|||||
|
Due after one through five years
|
32,584
|
32,728
|
24,961
|
24,569
|
|||||||||
|
Due after five through ten years
|
35,306
|
36,090
|
22,847
|
22,477
|
|||||||||
|
Due after ten years
|
25,800
|
26,141
|
39,405
|
39,593
|
|||||||||
|
Total investment securities - held to maturity
|
$
|
94,090
|
$
|
95,359
|
$
|
87,813
|
$
|
87,239
|
|||||
|
Available for sale
|
|||||||||||||
|
Due in one year or less
|
$
|
—
|
$
|
—
|
$
|
—
|
$
|
—
|
|||||
|
Due after one through five years
|
—
|
—
|
—
|
—
|
|||||||||
|
Due after five through ten years
|
—
|
—
|
—
|
—
|
|||||||||
|
Due after ten years
|
5,757
|
5,969
|
7,220
|
7,496
|
|||||||||
|
No stated maturity (common stock)
|
—
|
—
|
—
|
—
|
|||||||||
|
Total investment securities - available for sale
|
$
|
5,757
|
$
|
5,969
|
$
|
7,220
|
$
|
7,496
|
|||||
|
Total investment securities
|
$
|
99,847
|
$
|
101,328
|
$
|
95,033
|
$
|
94,735
|
|||||
106
Provident Financial Holdings, Inc.
Notes to Consolidated Financial Statements
June 30, 2019
Note 3: Loans Held for Investment
Loans held for investment consisted of the following at June 30, 2019 and 2018 :
|
(In Thousands)
|
June 30,
2019
|
June 30,
2018 |
||||
|
Mortgage loans:
|
||||||
|
Single-family
|
$
|
324,952
|
$
|
314,808
|
||
|
Multi-family
|
439,041
|
476,008
|
||||
|
Commercial real estate
|
111,928
|
109,726
|
||||
|
Construction
|
4,638
|
3,174
|
||||
|
Other
|
167
|
167
|
||||
|
Commercial business loans
|
478
|
500
|
||||
|
Consumer loans
|
134
|
109
|
||||
|
Total loans held for investment, gross
|
881,338
|
904,492
|
||||
|
Advance payments of escrows
|
53
|
18
|
||||
|
Deferred loan costs, net
|
5,610
|
5,560
|
||||
|
Allowance for loan losses
|
(7,076
|
)
|
(7,385
|
)
|
||
|
Total loans held for investment, net
|
$
|
879,925
|
$
|
902,685
|
||
The following table sets forth information at June 30, 2019 regarding the dollar amount of loans held for investment that are contractually repricing during the periods
indicated, segregated between adjustable rate loans and fixed rate loans. Fixed-rate loans comprised 2% of loans held for investment at both June 30, 2019 and June 30, 2018. Adjustable rate loans having no stated repricing date that reprice when
the index they are tied to reprices (e.g. prime rate index) and checking account overdrafts are reported as repricing within one year. The table does not include any estimate of prepayments which may cause the Corporation’s actual repricing
experience to differ materially from that shown.
|
Adjustable Rate
|
||||||||||||||||||
|
(In Thousands)
|
Within One
Year
|
After
One Year Through 3
Years
|
After
3 Years Through 5
Years
|
After
5 Years Through 10
Years
|
Fixed Rate
|
Total
|
||||||||||||
|
Mortgage loans:
|
||||||||||||||||||
|
Single-family
|
$
|
97,426
|
$
|
38,371
|
$
|
117,809
|
$
|
59,230
|
$
|
12,116
|
$
|
324,952
|
||||||
|
Multi-family
|
116,357
|
164,462
|
135,239
|
22,795
|
188
|
439,041
|
||||||||||||
|
Commercial real estate
|
40,053
|
32,331
|
37,815
|
1,280
|
449
|
111,928
|
||||||||||||
|
Construction
|
3,919
|
—
|
—
|
60
|
659
|
4,638
|
||||||||||||
|
Other
|
—
|
—
|
—
|
—
|
167
|
167
|
||||||||||||
|
Commercial business loans
|
122
|
—
|
—
|
—
|
356
|
478
|
||||||||||||
|
Consumer loans
|
134
|
—
|
—
|
—
|
—
|
134
|
||||||||||||
|
Total loans held for investment,
gross
|
$
|
258,011
|
$
|
235,164
|
$
|
290,863
|
$
|
83,365
|
$
|
13,935
|
$
|
881,338
|
||||||
107
Provident Financial Holdings, Inc.
Notes to Consolidated Financial Statements
June 30, 2019
The Corporation has developed an internal loan grading system to evaluate and quantify the Bank’s loans held for investment portfolio with respect to quality and risk. Management continually
evaluates the credit quality of the Corporation’s loan portfolio and conducts a quarterly review of the adequacy of the allowance for loan losses using quantitative and qualitative methods. The Corporation has adopted an internal risk rating policy
in which each loan is rated for credit quality with a rating of pass, special mention, substandard, doubtful or loss. The two primary components that are used during the loan review process to determine the proper allowance levels are individually
evaluated allowances and collectively evaluated allowances. Quantitative loan loss factors are developed by determining the historical loss experience, expected future cash flows, discount rates and collateral fair values, among others. Qualitative
loan loss factors are developed by assessing general economic indicators such as Gross Domestic Product, Retail Sales, Unemployment Rates, Employment Growth, California Home Sales and Median California Home Prices, among others. The Corporation
assigns individual factors for the quantitative and qualitative methods for each loan category and each internal risk rating.
The Corporation categorizes all of the loans held for investment into risk categories based on relevant information about the ability of the borrower to service their debt such as current financial
information, historical payment experience, credit documentation, public information, and current economic trends, among other factors. A description of the general characteristics of the risk grades is as follows:
|
▪
|
Pass - These loans range from minimal credit risk to average however still acceptable credit risk. The likelihood of loss is considered remote.
|
|
▪
|
Special Mention - A special mention asset has potential weaknesses that may be temporary or, if left uncorrected, may result in a loss. While concerns exist, the Bank is currently
protected and loss is considered unlikely and not imminent.
|
|
▪
|
Substandard - A substandard loan is inadequately protected by the current sound worth and paying capacity of the borrower or of the collateral pledged, if any. Loans so classified must
have a well-defined weakness, or weaknesses, that may jeopardize the liquidation of the debt. A substandard loan is characterized by the distinct possibility that the Bank will sustain some loss if the deficiencies are not corrected.
|
|
▪
|
Doubtful - A doubtful loan has all of the weaknesses inherent in one classified as substandard with the added characteristic that the weaknesses make collection or liquidation in full, on
the basis of the currently existing facts, conditions and values, highly questionable and improbable.
|
|
▪
|
Loss - A loss loan is considered uncollectible and of such little value that continuance as an asset of the Bank is not warranted.
|
The following tables summarize gross loans held for investment by loan types and risk category at the dates indicated:
|
June 30, 2019
|
|||||||||||||||||||||||||
|
(In Thousands)
|
Single-
family
|
Multi-
family
|
Commercial
Real Estate
|
Construction
|
Other
Mortgage
|
Commercial
Business
|
Consumer
|
Total
|
|||||||||||||||||
|
Pass
|
$
|
314,036
|
$
|
435,177
|
$
|
111,001
|
$
|
3,667
|
$
|
167
|
$
|
429
|
$
|
134
|
$
|
864,611
|
|||||||||
|
Special Mention
|
3,795
|
3,864
|
927
|
—
|
—
|
—
|
—
|
8,586
|
|||||||||||||||||
|
Substandard
|
7,121
|
—
|
—
|
971
|
—
|
49
|
—
|
8,141
|
|||||||||||||||||
|
Total loans held for
investment, gross
|
$
|
324,952
|
$
|
439,041
|
$
|
111,928
|
$
|
4,638
|
$
|
167
|
$
|
478
|
$
|
134
|
$
|
881,338
|
|||||||||
108
Provident Financial Holdings, Inc.
Notes to Consolidated Financial Statements
June 30, 2019
|
June 30, 2018
|
|||||||||||||||||||||||||
|
(In Thousands)
|
Single-
family
|
Multi-
family
|
Commercial
Real Estate
|
Construction
|
Other
Mortgage
|
Commercial
Business
|
Consumer
|
Total
|
|||||||||||||||||
|
Pass
|
$
|
304,619
|
$
|
472,061
|
$
|
108,786
|
$
|
3,174
|
$
|
167
|
$
|
430
|
$
|
109
|
$
|
889,346
|
|||||||||
|
Special Mention
|
2,548
|
3,947
|
940
|
—
|
—
|
—
|
—
|
7,435
|
|||||||||||||||||
|
Substandard
|
7,641
|
—
|
—
|
—
|
—
|
70
|
—
|
7,711
|
|||||||||||||||||
|
Total loans held for
investment, gross
|
$
|
314,808
|
$
|
476,008
|
$
|
109,726
|
$
|
3,174
|
$
|
167
|
$
|
500
|
$
|
109
|
$
|
904,492
|
|||||||||
The allowance for loan losses is maintained at a level sufficient to provide for estimated losses based on evaluating known and inherent risks in the loans held for investment and upon management’s
continuing analysis of the factors underlying the quality of the loans held for investment. These factors include changes in the size and composition of the loans held for investment, actual loan loss experience, current economic conditions,
detailed analysis of individual loans for which full collectability may not be assured, and determination of the realizable value of the collateral securing the loans. Provisions (recoveries) for loan losses are charged (credited) against operations
on a quarterly basis, as necessary, to maintain the allowance at appropriate levels. Although management believes it uses the best information available to make such determinations, there can be no assurance that regulators, in reviewing the
Corporation’s loans held for investment, will not request the Corporation to significantly increase its allowance for loan losses. Future adjustments to the allowance for loan losses may be necessary and results of operations could be significantly
and adversely affected as a result of economic, operating, regulatory, and other conditions beyond the Corporation’s control.
Non-performing loans are charged-off to their fair market values in the period the loans, or portion thereof, are deemed uncollectible, generally after the loan becomes 150 days delinquent for real
estate secured first trust deed loans and 120 days delinquent for commercial business or real estate secured second trust deed loans. For loans that were modified from their original terms, were re-underwritten and identified in the Corporation's
asset quality reports as restructured loans, the charge-off occurs when the loan becomes 90 days delinquent; and where borrowers file bankruptcy, the charge-off occurs when the loan becomes 60 days delinquent. The amount of the charge-off is
determined by comparing the loan balance to the estimated fair value of the underlying collateral, less disposition costs, with the loan balance in excess of the estimated fair value charged-off against the allowance for loan losses. The allowance
for loan losses for non-performing loans is determined by applying ASC 310, “Receivables.” For restructured loans that are less than 90 days delinquent, the allowance for loan losses are segregated into (a) individually evaluated allowances for
those loans with applicable discounted cash flow calculations still in their restructuring period, classified lower than pass, and containing an embedded loss component or (b) collectively evaluated allowances based on the aggregated pooling
method. For non-performing loans less than 60 days delinquent where the borrower has filed bankruptcy, the collectively evaluated allowances are assigned based on the aggregated pooling method. For non-performing commercial real estate loans,
individually evaluated allowances are calculated based on their fair values and if their fair values are higher than their loan balances, no allowances are required.
109
Provident Financial Holdings, Inc.
Notes to Consolidated Financial Statements
June 30, 2019
The following tables summarize the Corporation’s allowance for loan losses and recorded investment in gross loans, by portfolio type, at the dates and for the periods indicated.
|
Year Ended June 30, 2019
|
|||||||||||||||||||||||||
|
(In Thousands)
|
Single-
family
|
Multi-
family
|
Commercial
Real Estate
|
Construction
|
Other
Mortgage
|
Commercial Business
|
Consumer
|
Total
|
|||||||||||||||||
|
Allowance at beginning of period
|
$
|
2,783
|
$
|
3,492
|
$
|
1,030
|
$
|
47
|
$
|
3
|
$
|
24
|
$
|
6
|
$
|
7,385
|
|||||||||
|
Provision (recovery) for loan losses
|
(241
|
)
|
(273
|
)
|
20
|
14
|
—
|
—
|
5
|
(475
|
)
|
||||||||||||||
|
Recoveries
|
198
|
—
|
—
|
—
|
—
|
2
|
—
|
200
|
|||||||||||||||||
|
Charge-offs
|
(31
|
)
|
—
|
—
|
—
|
—
|
—
|
(3
|
)
|
(34
|
)
|
||||||||||||||
|
Allowance for loan losses, end of
period
|
$
|
2,709
|
$
|
3,219
|
$
|
1,050
|
$
|
61
|
$
|
3
|
$
|
26
|
$
|
8
|
$
|
7,076
|
|||||||||
|
Allowance:
|
|||||||||||||||||||||||||
|
Individually evaluated for impairment
|
$
|
122
|
$
|
—
|
$
|
—
|
$
|
—
|
$
|
—
|
$
|
8
|
$
|
—
|
$
|
130
|
|||||||||
|
Collectively evaluated for impairment
|
2,587
|
3,219
|
1,050
|
61
|
3
|
18
|
8
|
6,946
|
|||||||||||||||||
|
Allowance for loan losses, end of
period
|
$
|
2,709
|
$
|
3,219
|
$
|
1,050
|
$
|
61
|
$
|
3
|
$
|
26
|
$
|
8
|
$
|
7,076
|
|||||||||
|
Gross Loans:
|
|||||||||||||||||||||||||
|
Individually evaluated for impairment
|
$
|
5,199
|
$
|
—
|
$
|
—
|
$
|
971
|
$
|
—
|
$
|
49
|
$
|
—
|
$
|
6,219
|
|||||||||
|
Collectively evaluated for impairment
|
319,753
|
439,041
|
111,928
|
3,667
|
167
|
429
|
134
|
875,119
|
|||||||||||||||||
|
Total loans held for investment,
gross
|
$
|
324,952
|
$
|
439,041
|
$
|
111,928
|
$
|
4,638
|
$
|
167
|
$
|
478
|
$
|
134
|
$
|
881,338
|
|||||||||
|
Allowance for loan losses as a
percentage of gross loans held for
investment
|
0.83
|
%
|
0.73
|
%
|
0.94
|
%
|
1.32
|
%
|
1.80
|
%
|
5.44
|
%
|
5.97
|
%
|
0.80
|
%
|
|||||||||
110
Provident Financial Holdings, Inc.
Notes to Consolidated Financial Statements
June 30, 2019
|
Year Ended June 30, 2018
|
|||||||||||||||||||||||||
|
(In Thousands)
|
Single-
family
|
Multi-
family
|
Commercial
Real Estate
|
Construction
|
Other
Mortgage
|
Commercial Business
|
Consumer
|
Total
|
|||||||||||||||||
|
Allowance at beginning of period
|
$
|
3,601
|
$
|
3,420
|
$
|
879
|
$
|
96
|
$
|
—
|
$
|
36
|
$
|
7
|
$
|
8,039
|
|||||||||
|
Provision (recovery) for loan losses
|
(704
|
)
|
72
|
151
|
(49
|
)
|
3
|
(12
|
)
|
3
|
(536
|
)
|
|||||||||||||
|
Recoveries
|
278
|
—
|
—
|
—
|
—
|
—
|
—
|
278
|
|||||||||||||||||
|
Charge-offs
|
(392
|
)
|
—
|
—
|
—
|
—
|
—
|
(4
|
)
|
(396
|
)
|
||||||||||||||
|
Allowance for loan losses, end of
period
|
$
|
2,783
|
$
|
3,492
|
$
|
1,030
|
$
|
47
|
$
|
3
|
$
|
24
|
$
|
6
|
$
|
7,385
|
|||||||||
|
Allowance:
|
|||||||||||||||||||||||||
|
Individually evaluated for impairment
|
$
|
151
|
$
|
—
|
$
|
—
|
$
|
—
|
$
|
—
|
$
|
6
|
$
|
—
|
$
|
157
|
|||||||||
|
Collectively evaluated for impairment
|
2,632
|
3,492
|
1,030
|
47
|
3
|
18
|
6
|
7,228
|
|||||||||||||||||
|
Allowance for loan losses, end of
period
|
$
|
2,783
|
$
|
3,492
|
$
|
1,030
|
$
|
47
|
$
|
3
|
$
|
24
|
$
|
6
|
$
|
7,385
|
|||||||||
|
Gross Loans:
|
|||||||||||||||||||||||||
|
Individually evaluated for impairment
|
$
|
7,072
|
$
|
—
|
$
|
—
|
$
|
—
|
$
|
—
|
$
|
70
|
$
|
—
|
$
|
7,142
|
|||||||||
|
Collectively evaluated for impairment
|
307,736
|
476,008
|
109,726
|
3,174
|
167
|
430
|
109
|
897,350
|
|||||||||||||||||
|
Total loans held for investment,
gross
|
$
|
314,808
|
$
|
476,008
|
$
|
109,726
|
$
|
3,174
|
$
|
167
|
$
|
500
|
$
|
109
|
$
|
904,492
|
|||||||||
|
Allowance for loan losses as a
percentage of gross loans held for
investment
|
0.88
|
%
|
0.73
|
%
|
0.94
|
%
|
1.48
|
%
|
1.80
|
%
|
4.80
|
%
|
5.50
|
%
|
0.81
|
%
|
|||||||||
The following summarizes the components of the net change in the allowance for loan losses for the periods indicated:
|
Year Ended June 30,
|
|||||||||
|
(In Thousands)
|
2019
|
2018
|
|||||||
|
Balance, beginning of year
|
$
|
7,385
|
$
|
8,039
|
|||||
|
Recovery from the allowance for loan losses
|
(475
|
)
|
(536
|
)
|
|||||
|
Recoveries
|
200
|
278
|
|||||||
|
Charge-offs
|
(34
|
)
|
(396
|
)
|
|||||
|
Balance, end of year
|
$
|
7,076
|
$
|
7,385
|
|||||
The following tables identify the Corporation’s total recorded investment in non-performing loans by type at the dates and for the periods indicated.
Generally, a loan is placed on non-accrual status when it becomes 90 days past due as to principal or interest or if the loan is deemed impaired, after considering economic and business conditions and collection efforts, where the borrower’s
financial condition is such that collection of the contractual principal or interest on the loan is doubtful. In addition, interest income is not recognized on any loan where management has determined that collection is not reasonably assured. A
non-performing loan may be restored to accrual status when delinquent principal and interest payments are brought current and future monthly principal and interest payments are expected to be collected on a timely basis. Loans with a related
allowance reserve have been individually evaluated for impairment using either a discounted cash flow analysis or, for collateral
111
Provident Financial Holdings, Inc.
Notes to Consolidated Financial Statements
June 30, 2019
dependent loans, current appraisals less costs to sell to establish realizable value. These analysis may identify a specific impairment amount needed or may
conclude that no reserve is needed. Loans that are not individually evaluated for impairment are included in pools of homogeneous loans for evaluation of related allowance reserves.
|
At or For the Year Ended June 30, 2019
|
|||||||||||||||||||||||
|
Unpaid
|
Net
|
Average
|
Interest
|
||||||||||||||||||||
|
Principal
|
Related
|
Recorded
|
Recorded
|
Recorded
|
Income
|
||||||||||||||||||
|
(In Thousands)
|
Balance
|
Charge-offs
|
Investment
|
Allowance(1)
|
Investment
|
Investment
|
Recognized
|
||||||||||||||||
|
Mortgage loans:
|
|||||||||||||||||||||||
|
Single-family:
|
|||||||||||||||||||||||
|
With a related allowance
|
$
|
2,640
|
$
|
—
|
$
|
2,640
|
$
|
(434
|
)
|
$
|
2,206
|
$
|
1,583
|
$
|
110
|
||||||||
|
Without a related allowance(2)
|
3,518
|
(518
|
)
|
3,000
|
—
|
3,000
|
4,301
|
293
|
|||||||||||||||
|
Total single-family
|
6,158
|
(518
|
)
|
5,640
|
(434
|
)
|
5,206
|
5,884
|
403
|
||||||||||||||
|
Construction:
|
|||||||||||||||||||||||
|
Without a related allowance(2)
|
971
|
—
|
971
|
—
|
971
|
664
|
—
|
||||||||||||||||
|
Total commercial real estate
|
971
|
—
|
971
|
—
|
971
|
664
|
—
|
||||||||||||||||
|
Commercial business loans:
|
|||||||||||||||||||||||
|
With a related allowance
|
49
|
—
|
49
|
(8
|
)
|
41
|
58
|
5
|
|||||||||||||||
|
Total commercial business loans
|
49
|
—
|
49
|
(8
|
)
|
41
|
58
|
5
|
|||||||||||||||
|
Total non-performing loans
|
$
|
7,178
|
$
|
(518
|
)
|
$
|
6,660
|
$
|
(442
|
)
|
$
|
6,218
|
$
|
6,606
|
$
|
408
|
|||||||
(1) Consists of collectively and individually evaluated allowances, specifically assigned to the individual loan.
(2) There was no related allowance for loan losses because the loans have been charged-off to their fair value or the fair value of the collateral is higher than
the loan balance.
112
Provident Financial Holdings, Inc.
Notes to Consolidated Financial Statements
June 30, 2019
|
At or For the Year Ended June 30, 2018
|
|||||||||||||||||||||||
|
Unpaid
|
Net
|
Average
|
Interest
|
||||||||||||||||||||
|
Principal
|
Related
|
Recorded
|
Recorded
|
Recorded
|
Income
|
||||||||||||||||||
|
(In Thousands)
|
Balance
|
Charge-offs
|
Investment
|
Allowance(1)
|
Investment
|
Investment
|
Recognized
|
||||||||||||||||
|
Mortgage loans:
|
|||||||||||||||||||||||
|
Single-family:
|
|||||||||||||||||||||||
|
With a related allowance
|
$
|
1,333
|
$
|
—
|
$
|
1,333
|
$
|
(185
|
)
|
$
|
1,148
|
$
|
871
|
$
|
51
|
||||||||
|
Without a related allowance(2)
|
5,569
|
(724
|
)
|
4,845
|
—
|
4,845
|
6,767
|
203
|
|||||||||||||||
|
Total single-family
|
6,902
|
(724
|
)
|
6,178
|
(185
|
)
|
5,993
|
7,638
|
254
|
||||||||||||||
|
Commercial real estate:
|
|||||||||||||||||||||||
|
Without a related allowance(2)
|
—
|
—
|
—
|
—
|
—
|
17
|
13
|
||||||||||||||||
|
Total commercial real estate
|
—
|
—
|
—
|
—
|
—
|
17
|
13
|
||||||||||||||||
|
Commercial business loans:
|
|||||||||||||||||||||||
|
With a related allowance
|
70
|
—
|
70
|
(6
|
)
|
64
|
75
|
5
|
|||||||||||||||
|
Total commercial business loans
|
70
|
—
|
70
|
(6
|
)
|
64
|
75
|
5
|
|||||||||||||||
|
Total non-performing loans
|
$
|
6,972
|
$
|
(724
|
)
|
$
|
6,248
|
$
|
(191
|
)
|
$
|
6,057
|
$
|
7,730
|
$
|
272
|
|||||||
(1) Consists of collectively and individually evaluated allowances, specifically assigned to the individual loan.
(2) There was no related allowance for loan losses because the loans have been charged-off to their fair value or the fair value of the collateral is higher than
the loan balance.
At June 30, 2019 and 2018, there were no commitments to lend additional funds to those borrowers whose loans were classified as non-performing, except for one construction loan with undisbursed
loan funds of $1.0 million at June 30, 2019.
During the fiscal years ended June 30, 2019 and 2018, the Corporation’s average investment in non-performing loans was $6.6 million and $7.7 million, respectively. The Corporation records payments
on non-performing loans utilizing the cash basis or cost recovery method of accounting during the periods when the loans are on non-performing status. For the fiscal year ended June 30, 2019, the Bank received $574,000 in interest payments from
non-performing loans and $408,000 was recognized as interest income. The remaining $166,000 was applied to reduce the loan balances under the cost recovery method. In comparison, for the fiscal year ended June 30, 2018, the Bank received $564,000 in
interest payments from non-performing loans and $272,000 was recognized as interest income. The remaining $292,000 was applied to reduce the loan balances under the cost recovery method.
113
Provident Financial Holdings, Inc.
Notes to Consolidated Financial Statements
June 30, 2019
The following tables denote the past due status of the Corporation's loans held for investment, gross, at the dates indicated.
|
June 30, 2019
|
|||||||||||||
|
(In Thousands)
|
Current
|
30-89 Days
Past Due
|
Non-Accrual(1)
|
Total Loans Held for
Investment, Gross
|
|||||||||
|
Mortgage loans:
|
|||||||||||||
|
Single-family
|
$
|
318,671
|
$
|
660
|
$
|
5,621
|
$
|
324,952
|
|||||
|
Multi-family
|
439,041
|
—
|
—
|
439,041
|
|||||||||
|
Commercial real estate
|
111,928
|
—
|
—
|
111,928
|
|||||||||
|
Construction
|
3,667
|
—
|
971
|
4,638
|
|||||||||
|
Other
|
167
|
—
|
—
|
167
|
|||||||||
|
Commercial business loans
|
429
|
—
|
49
|
478
|
|||||||||
|
Consumer loans
|
129
|
5
|
—
|
134
|
|||||||||
|
Total loans held for investment, gross
|
$
|
874,032
|
$
|
665
|
$
|
6,641
|
$
|
881,338
|
|||||
(1) All loans 90 days or greater past due are placed on non-accrual status.
|
June 30, 2018
|
|||||||||||||
|
(In Thousands)
|
Current
|
30-89 Days
Past Due
|
Non-Accrual(1)
|
Total Loans Held for
Investment, Gross
|
|||||||||
|
Mortgage loans:
|
|||||||||||||
|
Single-family
|
$
|
307,863
|
$
|
804
|
$
|
6,141
|
$
|
314,808
|
|||||
|
Multi-family
|
476,008
|
—
|
—
|
476,008
|
|||||||||
|
Commercial real estate
|
109,726
|
—
|
—
|
109,726
|
|||||||||
|
Construction
|
3,174
|
—
|
—
|
3,174
|
|||||||||
|
Other
|
167
|
—
|
—
|
167
|
|||||||||
|
Commercial business loans
|
430
|
—
|
70
|
500
|
|||||||||
|
Consumer loans
|
108
|
1
|
—
|
109
|
|||||||||
|
Total loans held for investment, gross
|
$
|
897,476
|
$
|
805
|
$
|
6,211
|
$
|
904,492
|
|||||
(1) All loans 90 days or greater past due are placed on non-accrual status.
For the fiscal year ended June 30, 2019, there were no loans that were newly modified from their original terms, re-underwritten or identified as a restructured loan; one loan (previously modified)
was downgraded; three loans were upgraded to the pass category; one loan was paid off; and no loans were converted to real estate owned. For the fiscal year ended June 30, 2018, there were two loans that were newly modified from their original
terms, re-underwritten or identified as a restructured loan; two loans (previously modified) were downgraded; while two loans were upgraded to the pass category; and one loan was converted to a real estate owned. During the fiscal years ended June
30, 2019 and 2018, no restructured loans were in default within a 12-month period subsequent to their original restructuring. Additionally, during the fiscal year ended June 30, 2019, there was one restructured loan of $56,000 that was extended
beyond the initial maturity of the modification; while in fiscal 2018, there were no restructured loans that were extended beyond the initial maturity of the modification.
114
Provident Financial Holdings, Inc.
Notes to Consolidated Financial Statements
June 30, 2019
As of June 30, 2019, the net outstanding balance of the Corporation’s eight restructured loans was $3.8 million: one was classified as special mention and remains on accrual status ($437,000); one
was classified as substandard on accrual status ($1.4 million); and six were classified as substandard on non-accrual status ($1.9 million). As of June 30, 2019, $2.4 million, or 63 percent, of the restructured loans were current with respect to
their payment status. As of June 30, 2018, the net outstanding balance of the Corporation’s 11 restructured loans was $5.2 million: one loan was classified as special mention on accrual status ($389,000); one was classified as substandard on accrual
status ($1.4 million); and nine loans were classified as substandard ($3.4 million, all on non-accrual status). As of June 30, 2018, $2.9 million, or 56 percent, of the restructured loans had a current payment status, consistent with modified their
terms. At both June 30, 2019 and June 30, 2018, there were no commitments to lend additional funds to those borrowers whose loans were restructured.
The following table summarizes at the dates indicated the restructured loan balances, net of allowance for loan losses or charge-offs, by loan type and non-accrual versus
accrual status at June 30, 2019 and 2018 :
|
At June 30,
|
||||||
|
(In Thousands)
|
2019
|
2018
|
||||
|
Restructured loans on non-accrual status:
|
||||||
|
Mortgage loans:
|
||||||
|
Single-family
|
$
|
1,891
|
$
|
3,328
|
||
|
Commercial business loans
|
41
|
64
|
||||
|
Total
|
1,932
|
3,392
|
||||
|
Restructured loans on accrual status:
|
||||||
|
Mortgage loans:
|
||||||
|
Single-family
|
1,861
|
1,788
|
||||
|
Total
|
1,861
|
1,788
|
||||
|
Total restructured loans
|
$
|
3,793
|
$
|
5,180
|
||
115
Provident Financial Holdings, Inc.
Notes to Consolidated Financial Statements
June 30, 2019
The following tables show the restructured loans by type, net of allowance for loan losses or charge-offs, at June 30, 2019 and 2018:
|
At June 30, 2019
|
|||||||||||||||||
|
Unpaid
|
Net
|
||||||||||||||||
|
Principal
|
Related
|
Recorded
|
Recorded
|
||||||||||||||
|
(In Thousands)
|
Balance
|
Charge-offs
|
Investment
|
Allowance(1)
|
Investment
|
||||||||||||
|
Mortgage loans:
|
|||||||||||||||||
|
Single-family:
|
|||||||||||||||||
|
With a related allowance
|
$
|
2,199
|
$
|
—
|
$
|
2,199
|
$
|
(122
|
)
|
$
|
2,077
|
||||||
|
Without a related allowance(2)
|
2,040
|
(365
|
)
|
1,675
|
—
|
1,675
|
|||||||||||
|
Total single-family
|
4,239
|
(365
|
)
|
3,874
|
(122
|
)
|
3,752
|
||||||||||
|
Commercial business loans:
|
|||||||||||||||||
|
With a related allowance
|
49
|
—
|
49
|
(8
|
)
|
41
|
|||||||||||
|
Total commercial business loans
|
49
|
—
|
49
|
(8
|
)
|
41
|
|||||||||||
|
Total restructured loans
|
$
|
4,288
|
$
|
(365
|
)
|
$
|
3,923
|
$
|
(130
|
)
|
$
|
3,793
|
|||||
(1) Consists of collectively and individually evaluated allowances, specifically assigned to the individual loan.
(2) There was no related allowance for loan losses because the loans have been charged-off to their fair value or the fair value of the collateral is higher than
the loan balance.
|
At June 30, 2018
|
|||||||||||||||||
|
Unpaid
|
Net
|
||||||||||||||||
|
Principal
|
Related
|
Recorded
|
Recorded
|
||||||||||||||
|
(In Thousands)
|
Balance
|
Charge-offs
|
Investment
|
Allowance(1)
|
Investment
|
||||||||||||
|
Mortgage loans:
|
|||||||||||||||||
|
Single-family:
|
|||||||||||||||||
|
With a related allowance
|
$
|
2,228
|
$
|
—
|
$
|
2,228
|
$
|
(151
|
)
|
$
|
2,077
|
||||||
|
Without a related allowance(2)
|
3,450
|
(411
|
)
|
3,039
|
—
|
3,039
|
|||||||||||
|
Total single-family
|
5,678
|
(411
|
)
|
5,267
|
(151
|
)
|
5,116
|
||||||||||
|
Commercial business loans:
|
|||||||||||||||||
|
With a related allowance
|
70
|
—
|
70
|
(6
|
)
|
64
|
|||||||||||
|
Total commercial business loans
|
70
|
—
|
70
|
(6
|
)
|
64
|
|||||||||||
|
Total restructured loans
|
$
|
5,748
|
$
|
(411
|
)
|
$
|
5,337
|
$
|
(157
|
)
|
$
|
5,180
|
|||||
(1) Consists of collectively and individually evaluated allowances, specifically assigned to the individual loan.
(2) There was no related allowance for loan losses because the loans have been charged-off to their fair value or the fair value of the collateral is higher than
the loan balance.
116
Provident Financial Holdings, Inc.
Notes to Consolidated Financial Statements
June 30, 2019
In the ordinary course of business, the Bank makes loans to its directors, officers and employees on substantially the same terms prevailing at the time of origination for
comparable transactions with unaffiliated borrowers. The following is a summary of related-party loan activity:
|
Year Ended June 30,
|
|||||||
|
(In Thousands)
|
2019
|
2018
|
|||||
|
Balance, beginning of year
|
$
|
677
|
$
|
578
|
|||
|
Originations
|
—
|
2,415
|
|||||
|
Sales and payments
|
(675
|
)
|
(2,316
|
)
|
|||
|
Balance, end of year
|
$
|
2
|
$
|
677
|
|||
As of June 30, 2019 and 2018, all of the related-party loans were performing in accordance with their original contractual terms.
Note 4: Mortgage Loan Servicing and Loans Originated for Sale
The following summarizes the unpaid principal balance of loans serviced for others by the Corporation at the dates indicated:
|
At June 30,
|
|||||||||
|
(In Thousands)
|
2019
|
2018
|
|||||||
|
Loans serviced for Freddie Mac
|
$
|
18,613
|
$
|
19,244
|
|||||
|
Loans serviced for Fannie Mae
|
89,910
|
96,384
|
|||||||
|
Loans serviced for FHLB – San Francisco
|
9,724
|
11,786
|
|||||||
|
Loans serviced for other investors
|
1,989
|
995
|
|||||||
|
Total loans serviced for others
|
$
|
120,236
|
$
|
128,409
|
|||||
MSA are recorded when loans are sold to investors and the servicing of those loans is retained by the Bank. MSA are subject to interest rate risk and may become impaired when interest rates fall
and the borrowers refinance or prepay their mortgage loans. The MSA are derived primarily from single-family loans.
Servicing loans for others generally consists of collecting mortgage payments, maintaining escrow accounts, disbursing payments to investors and processing foreclosures. Income from servicing
loans is reported as loan servicing and other fees in the Corporation’s Consolidated Statements of Operations, and the amortization of MSA is reported as a reduction to the loan servicing income. Loan servicing income includes servicing fees from
investors and certain fees collected from borrowers, such as late payment fees. As of June 30, 2019 and 2018, the Corporation held borrowers’ escrow balances related to loans serviced for others of $539,000 and $577,000, respectively.
In estimating fair values of the MSA at June 30, 2019 and 2018, the Corporation used a weighted-average constant prepayment rate (“CPR”) of 23.86% and 13.42%, respectively, and a weighted-average
discount rate of 9.11% at both dates. Management obtained CPR estimates from an independent third party and reviewed for reasonableness given current market data. The discount rates were derived from market data. The MSA, which is included in
prepaid expenses and other assets in the Consolidated Statements of Financial Condition, had a carrying value of $925,000 and a fair value of $627,000 at June 30, 2019. This compares to the MSA at June 30, 2018 which had a carrying value of $998,000
and a fair value of $1.0 million. An allowance may be recorded to adjust the carrying value of each of the nine strata of MSA to the lower of cost or fair value. As
117
Provident Financial Holdings, Inc.
Notes to Consolidated Financial Statements
June 30, 2019
of June 30, 2019, a total allowance of $298,000 was required for all nine categories of MSA, compared to a total allowance of $82,000 for six categories of MSA as of June 30, 2018. Total additions
to the MSA during the years ended June 30, 2019 and 2018 were $52,000 and $237,000, respectively. Total amortization of the MSA during the years ended June 30, 2019 and 2018 was $125,000 and $136,000, respectively.
Loans sold to the FHLB – San Francisco were completed under the MPF Program, which entitles the Bank to a credit enhancement fee collected from FHLB – San Francisco on a monthly basis and is
described in Note 1 under Loans originated and held for sale.
The following table summarizes the Corporation’s MSA for years ended June 30, 2019 and 2018:
|
Year Ended June 30,
|
|||||||||
|
(Dollars In Thousands)
|
2019
|
2018
|
|||||||
|
MSA balance, beginning of fiscal year
|
$
|
998
|
$
|
897
|
|||||
|
Additions
|
52
|
237
|
|||||||
|
Amortization
|
(125
|
)
|
(136
|
)
|
|||||
|
MSA balance, end of fiscal year, before allowance
|
925
|
998
|
|||||||
|
Allowance
|
(298
|
)
|
(82
|
)
|
|||||
|
MSA balance, end of fiscal year
|
$ |
627 |
$ |
916 |
|||||
|
Fair value, beginning of fiscal year
|
$
|
1,015
|
$
|
811
|
|||||
|
Fair value, end of fiscal year
|
$
|
627
|
$
|
1,015
|
|||||
|
Allowance, beginning of fiscal year
|
$
|
82
|
$
|
158
|
|||||
|
Impairment provision (recovery)
|
216
|
(76
|
)
|
||||||
|
Allowance, end of fiscal year
|
$
|
298
|
$
|
82
|
|||||
|
Key Assumptions:
|
|||||||||
|
Weighted-average discount rate
|
9.11
|
%
|
9.11
|
%
|
|||||
|
Weighted-average prepayment speed
|
23.86
|
%
|
13.42
|
%
|
|||||
118
Provident Financial Holdings, Inc.
Notes to Consolidated Financial Statements
June 30, 2019
The following table summarizes the estimated future amortization of MSA for the next five years and thereafter:
|
Amount
|
|||
|
Year Ending June 30,
|
(In Thousands)
|
||
|
2020
|
$
|
190
|
|
|
2021
|
154
|
||
|
2022
|
114
|
||
|
2023
|
82
|
||
|
2024
|
59
|
||
|
Thereafter
|
326
|
||
|
Total estimated amortization expense
|
$
|
925
|
|
The following table represents the hypothetical effect on the fair value of the Corporation’s MSA using an unfavorable shock analysis of certain key valuation assumptions as of
June 30, 2019 and 2018. This analysis is presented for hypothetical purposes only. As the amounts indicate, changes in fair value based on changes in assumptions generally cannot be extrapolated because the relationship of the change in assumptions
to the change in fair value may not be linear.
|
Year Ended June 30,
|
||||||
|
(Dollars In Thousands)
|
2019
|
2018
|
||||
|
MSA net carrying value
|
$
|
627
|
$
|
916
|
||
|
CPR assumption (weighted-average)
|
23.86
|
%
|
13.42
|
%
|
||
|
Impact on fair value with 10% adverse change in prepayment speed
|
$
|
(30
|
)
|
$
|
(31
|
)
|
|
Impact on fair value with 20% adverse change in prepayment speed
|
$
|
(58
|
)
|
$
|
(61
|
)
|
|
Discount rate assumption (weighted-average)
|
9.11
|
%
|
9.11
|
%
|
||
|
Impact on fair value with 10% adverse change in discount rate
|
$
|
(20
|
)
|
$
|
(45
|
)
|
|
Impact on fair value with 20% adverse change in discount rate
|
$
|
(40
|
)
|
$
|
(88
|
)
|
Loans sold consisted of the following for the years indicated:
|
Year Ended June 30,
|
||||||
|
(In Thousands)
|
2019
|
2018
|
||||
|
Loans sold:
|
||||||
|
Servicing – released
|
$
|
551,754
|
$
|
1,174,618
|
||
|
Servicing – retained
|
7,196
|
27,566
|
||||
|
Total loans sold
|
$
|
558,950
|
$
|
1,202,184
|
||
During the years ended June 30, 2019 and 2018, the Corporation sold 16% and 12%, respectively, of its loans originated for sale to a single investor, other than Freddie Mac or Fannie Mae.
119
Provident Financial Holdings, Inc.
Notes to Consolidated Financial Statements
June 30, 2019
Loans held for sale, at fair value, at June 30, 2019 and 2018 consisted of the following:
|
(In Thousands)
|
June 30,
|
|||||
|
2019
|
2018
|
|||||
|
Fixed rate
|
$
|
—
|
$
|
94,730
|
||
|
Adjustable rate
|
—
|
1,568
|
||||
|
Total loans held for sale, at fair value
|
$
|
—
|
$
|
96,298
|
||
Consistent with the Corporation’s announcement on February 4, 2019 to scale back operations related to the origination of saleable single-family mortgage loans and improve on its efforts to
increase the volume of portfolio single-family mortgage loan originations, total loans sold in fiscal 2019 were $559.0 million, down 54% from $1.20 billion in fiscal 2018; and there were no outstanding loans held for sale at June 30, 2019 as compared
to $96.3 million at June 30, 2018. The Corporation recognized during fiscal 2019 non-recurring costs of $2.80 million in connection with reducing its saleable single-family loan origination operations, which is comprised of $1.70 million in salaries
and employee benefits expenses (attributable to severance and other personnel expenses), $337,000 in premises and occupancy expenses (attributable to accelerated lease expenses and accelerated depreciation of furniture and fixtures), and $758,000 in
equipment expenses (attributable to termination, charge-off, or modification of data processing and other contractual arrangements).
Note 5: Real Estate Owned
Real estate owned at June 30, 2019 and 2018 consisted of the following:
|
(In Thousands)
|
June 30,
|
|||||
|
2019
|
2018
|
|||||
|
Real estate owned
|
$
|
—
|
$
|
906
|
||
|
Allowance for estimated real estate owned losses
|
—
|
—
|
||||
|
Total real estate owned, net
|
$
|
—
|
$
|
906
|
||
Real estate owned is primarily the result of real estate acquired in the settlement of loans. As of June 30, 2019, the Corporation did not have any real estate owned. As of June 30, 2018, real
estate owned was comprised of two single-family residences located in California.
During fiscal 2019, the Corporation did not acquire any real estate owned properties in the settlement of loans and sold the remaining two properties for a net gain of $9,000 which was offset by
real estate owned expenses of $13,000. In fiscal 2018, the Corporation acquired four real estate owned properties in the settlement of loans and sold four properties for a net loss of $558,000 and incurred real estate owned expenses of $89,000,
which was offset by a recovery of losses on real estate owned of $561,000.
120
Provident Financial Holdings, Inc.
Notes to Consolidated Financial Statements
June 30, 2019
A summary of the disposition and operations of real estate owned acquired in the settlement of loans for the years ended June 30, 2019 and 2018 consisted of the following:
|
Year Ended June 30,
|
||||||
|
(In Thousands)
|
2019
|
2018
|
||||
|
Net gain (loss) on sale
|
$
|
9
|
$
|
(558
|
)
|
|
|
Net operating expenses
|
(13
|
)
|
(89
|
)
|
||
|
Recovery of losses on real estate owned
|
-
|
561
|
||||
|
Loss on sale and operations of real estate owned acquired in
the settlement of loans, net
|
$
|
(4
|
)
|
$
|
(86
|
)
|
Note 6: Premises and Equipment
Premises and equipment at June 30, 2019 and 2018 consisted of the following:
|
(In Thousands)
|
June 30,
|
|||||
|
2019
|
2018
|
|||||
|
Land
|
$
|
2,853
|
$
|
2,853
|
||
|
Buildings
|
9,759
|
9,843
|
||||
|
Leasehold improvements
|
3,252
|
3,458
|
||||
|
Furniture and equipment
|
5,438
|
5,657
|
||||
|
Automobiles
|
170
|
170
|
||||
|
21,472
|
21,981
|
|||||
|
Less accumulated depreciation and amortization
|
(13,246
|
)
|
(13,285
|
)
|
||
|
Total premises and equipment, net
|
$
|
8,226
|
$
|
8,696
|
||
Depreciation and amortization expense for the years ended June 30, 2019 and 2018 amounted to $881,000 and $845,000, respectively.
121
Provident Financial Holdings, Inc.
Notes to Consolidated Financial Statements
June 30, 2019
Note 7: Deposits
Deposits at June 30, 2019 and 2018 consisted of the following:
|
(Dollars in Thousands)
|
June 30, 2019
|
June 30, 2018
|
||||||
|
Interest Rate
|
Amount
|
Interest Rate
|
Amount
|
|||||
|
Checking deposits – non interest-bearing
|
—
|
$
|
90,184
|
—
|
$
|
86,174
|
||
|
Checking deposits – interest-bearing(1)
|
0% - 0.30%
|
257,909
|
0% - 0.30%
|
259,372
|
||||
|
Savings deposits(1)
|
0% - 1.29%
|
264,387
|
0% - 1.29%
|
289,791
|
||||
|
Money market deposits(1)
|
0% - 2.00%
|
35,646
|
0% - 2.00%
|
34,633
|
||||
|
Time deposits:(1)
|
||||||||
|
Under $100(2)
|
0.00% - 2.13%
|
94,200
|
0.00% - 3.90%
|
116,454
|
||||
|
$100 and over
|
0.15% - 2.52%
|
98,945
|
0.15% - 2.13%
|
121,174
|
||||
|
Total deposits
|
$
|
841,271
|
$
|
907,598
|
||||
|
Weighted-average interest rate on deposits
|
0.37
|
%
|
0.39
|
%
|
||||
|
(1)
|
Certain interest-bearing checking, savings, money market and time deposits require a minimum balance to earn interest.
|
|
(2)
|
Includes brokered deposits of $0 and $1.6 million at June 30, 2019 and 2018, respectively.
|
The aggregate annual maturities of time deposits at June 30, 2019 and 2018 were as follows:
|
(In Thousands)
|
June 30,
|
|||||
|
2019
|
2018
|
|||||
|
One year or less
|
$
|
106,080
|
$
|
116,333
|
||
|
Over one to two years
|
37,117
|
65,200
|
||||
|
Over two to three years
|
26,334
|
26,163
|
||||
|
Over three to four years
|
15,135
|
13,890
|
||||
|
Over four to five years
|
7,784
|
14,227
|
||||
|
Over five years
|
695
|
1,815
|
||||
|
Total time deposits
|
$
|
193,145
|
$
|
237,628
|
||
Interest expense on deposits for the periods indicated is summarized as follows:
|
Year Ended June 30,
|
||||||||
|
(In Thousands)
|
2019
|
2018
|
||||||
|
Checking deposits – interest-bearing
|
$
|
305
|
$
|
293
|
||||
|
Savings deposits
|
572
|
595
|
||||||
|
Money market deposits
|
123
|
114
|
||||||
|
Time deposits
|
2,381
|
2,493
|
||||||
|
Total interest expense on deposits
|
$
|
3,381
|
$
|
3,495
|
||||
The Bank is required to maintain reserve balances with the Federal Reserve Bank of San Francisco. Such reserves are calculated based on deposit balances and are offset by the cash balances
maintained by the Bank. The cash balances maintained by the Bank at June 30, 2019 and 2018 were sufficient to cover the reserve requirements.
122
Provident Financial Holdings, Inc.
Notes to Consolidated Financial Statements
June 30, 2019
Note 8: Borrowings
Advances from the FHLB – San Francisco, which mature on various dates through 2025, are collateralized by pledges of certain real estate loans with an aggregate balance at June 30, 2019 and 2018 of
$643.0 million and $746.7 million, respectively. In addition, the Bank pledged investment securities totaling $3.2 million at June 30, 2019 to collateralize its FHLB – San Francisco advances under the Securities-Backed Credit (“SBC”) program as
compared to $3.3 million at June 30, 2018. At June 30, 2019, the Bank’s FHLB – San Francisco borrowing capacity, which is limited to 35% of total assets reported on the Bank’s quarterly Call Report, was approximately $391.8 million as compared to
$411.8 million at June 30, 2018 which was similarly limited. As of June 30, 2019 and 2018, the remaining/available borrowing facility was $275.2 million and $275.1 million, respectively, and the remaining/available collateral was $434.7 million and
$500.3 million, respectively.
In addition, as of June 30, 2019 and 2018, the Bank had a $74.2 million and $73.2 million discount window facility, respectively, at the Federal Reserve Bank of San Francisco, collateralized by
investment securities with a fair market value of $79.0 million and $77.9 million, respectively. As of June 30, 2019 and 2018, the Bank also had a borrowing arrangement in the form of a federal funds facility with its correspondent bank for $17.0
million at both dates. The Bank intends to request a renewal of its borrowing arrangement with the correspondent bank prior to maturity.
Borrowings at June 30, 2019 and 2018 consisted of the following:
|
(In Thousands)
|
June 30,
|
|||||
|
2019
|
2018
|
|||||
|
FHLB – San Francisco advances
|
$
|
101,107
|
$
|
126,163
|
||
Borrowings, consisting of FHLB – San Francisco advances, at June 30, 2019 and 2018 were $101.1 million and $126.2 million, respectively.
In addition to the total borrowings described above, the Bank utilizes its borrowing facility for letters of credit and MPF credit enhancement. The outstanding letters of credit at June 30, 2019
and 2018 were $13.0 million and $8.0 million, respectively; and the outstanding MPF credit enhancement was $2.5 million at both, June 30, 2019 and June 30, 2018.
As a member of the FHLB – San Francisco, the Bank is required to maintain a minimum investment in FHLB – San Francisco capital stock. The Bank held a stock investment of $8.2 million with excess
capital stock of $470,000 at June 30, 2019. This compares to a required stock investment of $8.2 million with no excess capital stock at June 30, 2018.
The FHLB – San Francisco did not redeem any capital stock during fiscal 2019 and 2018, while the Bank purchased no FHLB - San Francisco capital stock in fiscal 2019 and $91,000 of FHLB - San
Francisco capital stock in fiscal 2018. In fiscal 2019 and 2018, the FHLB – San Francisco distributed $707,000 and $568,000 of cash dividends, respectively, to the Bank. The cash dividends received by the Bank in fiscal 2019 included a special cash
dividend of $133,000.
123
Provident Financial Holdings, Inc.
Notes to Consolidated Financial Statements
June 30, 2019
The following tables set forth certain information regarding borrowings by the Bank at the dates and for the years indicated:
|
At or For the Year
Ended June 30,
|
||||||
|
(Dollars in Thousands)
|
2019
|
2018
|
||||
|
Balance outstanding at the end of year:
FHLB – San Francisco advances
|
$
|
101,107
|
$
|
126,163
|
||
|
Weighted-average rate at the end of year:
FHLB – San Francisco advances
|
2.62
|
%
|
2.47
|
%
|
||
|
Maximum amount of borrowings outstanding at any month end:
FHLB – San Francisco advances
|
$
|
136,158
|
$
|
126,163
|
||
|
Average short-term borrowings during the year
with respect to:(1)
|
||||||
|
FHLB – San Francisco advances
|
$
|
8,425
|
$
|
8,687
|
||
|
Weighted-average short-term borrowing rate during the year
with respect to:(1)
|
||||||
|
FHLB – San Francisco advances
|
1.69
|
%
|
2.53
|
%
|
||
(1) Borrowings with a remaining term of 12 months or less.
The aggregate annual contractual maturities of borrowings at June 30, 2019 and 2018 were as follows:
|
(Dollars in Thousands)
|
June 30,
|
|||||
|
2019
|
2018
|
|||||
|
Within one year
|
$
|
—
|
$
|
25,000
|
||
|
Over one to two years
|
20,000
|
—
|
||||
|
Over two to three years
|
21,107
|
20,000
|
||||
|
Over three to four years
|
10,000
|
21,163
|
||||
|
Over four to five years
|
30,000
|
10,000
|
||||
|
Over five years
|
20,000
|
50,000
|
||||
|
Total borrowings
|
$
|
101,107
|
$
|
126,163
|
||
|
Weighted average interest rate
|
2.62
|
%
|
2.47
|
%
|
||
124
Provident Financial Holdings, Inc.
Notes to Consolidated Financial Statements
June 30, 2019
Note 9: Income Taxes
ASC 740, “Income Taxes,” requires the affirmative evaluation that it is more likely than not, based on the technical merits of a tax position, that an enterprise is entitled to economic benefits
resulting from positions taken in income tax returns. If a tax position does not meet the more-likely-than-not recognition threshold, the benefit of that position is not recognized in the financial statements. Management has determined that there
were no unrecognized tax benefits to be reported in the Corporation’s consolidated financial statements for the years ended June 30, 2019 and 2018.
On December 22, 2017, the U.S. Government enacted comprehensive tax legislation commonly referred to as the Tax Cuts and Jobs Act (the “Tax Act”). The Tax Act amends the Internal Revenue Code to
reduce tax rates and modify policies, credits, and deductions for individuals and businesses. For businesses, the Tax Act reduces the corporate federal tax income rate from a maximum of 35 percent to a flat 21 percent. The federal corporate tax rate
reduction was effective January 1, 2018. Since the Corporation has a fiscal year end of June 30th, the reduced federal corporate income tax rate for its fiscal year 2018 resulted in the application of a blended federal statutory income tax
rate of 28.06 percent, which was based on the applicable tax rates before and after the Tax Act and corresponding number of days in the fiscal year before and after enactment, and then a flat 21 percent tax rate thereafter.
Under generally accepted accounting principles, the Corporation uses the asset and liability method of accounting for income taxes. Under this method, deferred tax assets and liabilities are
recognized for the future tax consequences attributable to differences between the financial statement carrying amounts of existing assets and liabilities and their respective tax bases. Deferred tax assets and liabilities are measured using enacted
tax rates expected to apply to taxable income in the years in which those temporary differences are expected to be recovered or settled. At June 30, 2017, the Corporation’s deferred tax assets and liabilities were determined based on the then-current
enacted federal tax rate of 35 percent. As a result of the reduction in the federal corporate income tax rate under the Tax Act, the Corporation revalued its deferred tax assets and liabilities at December 31, 2017. Deferred tax assets and
liabilities realized in fiscal year 2018 and prior fiscal years were re-measured using the aforementioned blended rate. These re-measurements collectively resulted in a discrete tax expense of $1.8 million that was recognized in fiscal 2018. Deferred
tax assets and liabilities realized in fiscal 2019 were re-measured using the statutory federal rate of 21 percent.
The estimated combined federal and state statutory tax rates, before discrete items, for fiscal years 2019 and 2018 are as follows:
|
Statutory Tax Rates
|
FY2019
|
FY2018
|
||
|
Federal Tax Rate
|
21.00%
|
28.06%
|
||
|
State Tax Rate
|
10.84%
|
10.84%
|
||
|
Combined Statutory Tax Rate (1)
|
29.56%
|
35.86%
|
(1) The combined statutory tax rate is net of the federal tax benefit for the state tax deduction.
The Corporation’s effective tax rate may differ from the estimated statutory tax rates described above due to discrete items such as further adjustments to net deferred tax assets, excess tax
benefits derived from stock option exercises and non-taxable earnings from bank owned life insurance, among other items.
The Corporation utilizes the asset and liability method of accounting for income taxes whereby deferred tax assets are recognized for deductible temporary differences and tax
credit carryforwards and deferred tax liabilities are recognized for
125
Provident Financial Holdings, Inc.
Notes to Consolidated Financial Statements
June 30, 2019
taxable temporary differences. Temporary differences are the differences between the reported amounts of assets and liabilities and their tax basis.
Deferred tax assets are reduced by a valuation allowance when, in the opinion of management, it is more likely than not that some portion or all of the deferred tax assets will
not be realized. Deferred tax assets and liabilities are adjusted for the effect of changes in tax laws and rates on the date of enactment. The provision for income taxes for the periods indicated consisted of the following:
| Year Ended June 30, | ||||||||
|
(In Thousands)
|
2019
|
2018
|
||||||
|
Current:
|
||||||||
|
Federal
|
$
|
445
|
$
|
2,271
|
||||
|
State
|
408
|
960
|
||||||
|
853
|
3,231
|
|||||||
|
Deferred:
|
||||||||
|
Federal
|
478
|
582
|
||||||
|
State
|
172
|
(417
|
)
|
|||||
|
650
|
165
|
|||||||
|
Provision for income taxes
|
$
|
1,503
|
$
|
3,396
|
||||
The Corporation's tax benefit from non-qualified equity compensation recognized in the Consolidated Statements of Operations in connection with the adoption of ASU 2016-09 for fiscal 2019 and 2018
was $147,000 and $206,000, respectively.
The provision for income taxes differs from the amount of income tax determined by applying the applicable U.S. statutory federal income tax rate to net income before income
taxes as a result of the following differences for the periods indicated:
|
Year Ended June 30,
|
|||||||||||||
|
2019
|
2018
|
||||||||||||
|
(In Thousands)
|
Amount
|
Tax
Rate |
Amount
|
Tax
Rate |
|||||||||
|
Federal income tax at statutory rate
|
$
|
1,243
|
21.00
|
%
|
$
|
1,551
|
28.06
|
%
|
|||||
|
State income tax, net of federal income tax benefits
|
456
|
7.70
|
%
|
429
|
7.77
|
%
|
|||||||
|
Changes in taxes resulting from:
|
|||||||||||||
|
Bank-owned life insurance
|
(39
|
)
|
(0.66
|
)%
|
(50
|
)
|
(0.90
|
)%
|
|||||
|
Non-deductible expenses
|
21
|
0.35
|
%
|
30
|
0.53
|
%
|
|||||||
|
Non-deductible stock-based compensation
|
(2
|
)
|
(0.03
|
)%
|
15
|
0.26
|
%
|
||||||
|
Excess tax benefit on stock-based compensation
|
(104
|
)
|
(1.77
|
)%
|
(189
|
)
|
(3.41
|
)%
|
|||||
|
Deferred tax asset revaluation due to the Tax Act
|
—
|
—
|
%
|
1,765
|
31.93
|
%
|
|||||||
|
Return to provision adjustment
|
(77
|
)
|
(1.29
|
)%
|
—
|
—
|
%
|
||||||
|
Other(1)
|
5
|
0.08
|
%
|
(155
|
)
|
(2.81
|
)%
|
||||||
|
Effective income tax
|
$
|
1,503
|
25.38
|
%
|
$
|
3,396
|
61.43
|
%
|
|||||
(1) Tax benefit resulting from the corporate tax rate reduction in fiscal 2018.
126
Provident Financial Holdings, Inc.
Notes to Consolidated Financial Statements
June 30, 2019
Deferred tax assets at June 30, 2019 and 2018 by jurisdiction were as follows:
|
(In Thousands)
|
June 30,
|
||||||||
|
2019
|
2018
|
||||||||
|
Deferred taxes - federal
|
$
|
2,178
|
$
|
2,636
|
|||||
|
Deferred taxes - state
|
1,361
|
1,532
|
|||||||
|
Total net deferred tax assets
|
$
|
3,539
|
$
|
4,168
|
|||||
Net deferred tax assets at June 30, 2019 and 2018 were comprised of the following:
|
(In Thousands)
|
June 30,
|
||||||||
|
2019
|
2018
|
||||||||
|
Loss reserves
|
$
|
2,685
|
$
|
2,873
|
|||||
|
Non-accrued interest
|
483
|
502
|
|||||||
|
Deferred compensation
|
2,396
|
2,509
|
|||||||
|
Accrued vacation
|
124
|
224
|
|||||||
|
Depreciation
|
95
|
99
|
|||||||
|
Litigation reserves
|
876
|
1,441
|
|||||||
|
Other
|
588
|
358
|
|||||||
|
Total deferred tax assets
|
7,247
|
8,006
|
|||||||
|
FHLB - San Francisco stock dividends
|
(664
|
)
|
(664
|
)
|
|||||
|
Unrealized gain on derivative financial instruments, at fair value
|
—
|
(123
|
)
|
||||||
|
Prepaid expenses
|
(56
|
)
|
(49
|
)
|
|||||
|
Unrealized gain on investment securities
|
(63
|
)
|
(82
|
)
|
|||||
|
Unrealized gain on interest-only strips
|
(5
|
)
|
(6
|
)
|
|||||
|
Deferred loan costs
|
(2,723
|
)
|
(2,806
|
)
|
|||||
|
State tax
|
(197
|
)
|
(108
|
)
|
|||||
|
Total deferred tax liabilities
|
(3,708
|
)
|
(3,838
|
)
|
|||||
|
Net deferred tax assets
|
$
|
3,539
|
$
|
4,168
|
|||||
The net deferred tax assets were included in prepaid expenses and other assets in the Consolidated Statements of Financial Condition. The Corporation analyzes the deferred tax assets to determine
whether a valuation allowance is required based on the more likely than not criteria that such assets will be realized principally through future taxable income. This criteria takes into account the actual earnings and the estimates of future
profitability. The Corporation may carryback net federal tax losses to the preceding five taxable years and forward to the succeeding 20 taxable years. At June 30, 2019 and 2018, the Corporation had no federal and state net tax loss carryforwards.
Based on management's consideration of historical and anticipated future income before income taxes, as well as the reversal period for the items giving rise to the deferred tax assets and liabilities, a valuation allowance was not considered
necessary at June 30, 2019 and 2018 and management believes it is more likely than not the Corporation will realize its deferred tax asset.
Retained earnings at June 30, 2019 and 2018 includes approximately $9.0 million (pre-1988 bad debt reserve for tax purposes) for which federal income tax of $3.1 million has not been provided. If
the amounts that qualify as deductions for federal
127
Provident Financial Holdings, Inc.
Notes to Consolidated Financial Statements
June 30, 2019
income tax purposes are later used for purposes other than for bad debt losses, including distribution in liquidation, they will be subject to federal income tax at the then-current corporate tax
rate. If those amounts are not so used, they will not be subject to tax even in the event the Bank were to convert its charter from a thrift to a bank.
The Corporation files income tax returns for the United States and California jurisdictions. The Internal Revenue Service has audited the Bank’s income tax returns through 1996 and the California
Franchise Tax Board has audited the Bank through 1990. Also, the Internal Revenue Service completed a review of the Corporation’s income tax returns for fiscal 2006 and 2007; and the California Franchise Tax Board completed a review of the
Corporation’s income tax returns for fiscal 2009 and 2010. Fiscal years of 2015 and thereafter remain subject to federal examination, while the California state tax returns for fiscal years 2014 and thereafter are subject to examination by state
taxing authorities.
It is the Corporation’s policy to record any penalties or interest charges arising from federal or state taxes as a component of income tax expense. For the fiscal year ended June 30, 2019, there
was an $18,000 penalty that was non-tax deductible due to the nature of the expenses and no interest charges; during fiscal 2018, there were no tax penalties or interest charges.
Note 10: Capital
The Bank is subject to various regulatory capital requirements administered by the federal banking agencies. Failure to meet minimum capital requirements can initiate certain mandatory and
possibly additional discretionary actions by regulators that, if undertaken, could have a direct material effect on the Corporation’s financial statements. Under capital adequacy guidelines and the regulatory framework for prompt corrective action,
the Bank must meet specific capital guidelines that involve quantitative measures of the Bank’s assets, liabilities and certain off-balance-sheet items as calculated under regulatory accounting practices. The Bank’s capital amounts and
classification are also subject to qualitative judgments by the regulators about components, risk weightings and other factors.
Effective January 1, 2015 (with some changes transitioned into full effectiveness over two to four years), the Bank and Provident Financial Holdings, Inc. became subject to new capital adequacy
requirements which were fully phased-in on January 1, 2019. Since the Provident Financial Holdings, Inc. has less than $3.0 billion in assets, the capital guidelines apply on a bank only basis, and the Federal Reserve expects the holding company’s
subsidiary bank to be well capitalized under the prompt corrective action regulations. The capital adequacy requirements are quantitative measures established by regulation that require the Bank to maintain minimum amounts and ratios of capital.
The Bank changes in capital requirements adopted by the OCC required a ratio for common equity Tier 1 (“CET1”) capital, increased the Tier1 leverage and Tier 1 capital ratios, changed the
risk-weightings of certain assets for purposes of the risk-based capital ratios, created an additional capital conservation buffer over the required capital ratios and changed what qualifies as capital for purposes of meeting these various capital
requirements. Failure to meet minimum requirements can initiate certain mandatory and possibly additional discretionary actions by bank regulators that, if undertaken, could have a direct material effect on the Corporation’s financial statements.
The Bank is required to maintain additional levels of Tier 1 common equity over the minimum risk-based capital levels before payment of dividends, repurchase of shares or payment of discretionary bonuses.
In addition to the minimum CET1, Tier 1 and total capital ratios, the Bank must maintain a capital conservation buffer consisting of additional CET1 capital above the required minimum levels in
order to avoid limitations on paying dividends, engaging in share repurchases, and paying discretionary bonuses based on percentages of eligible retained income that could be
128
Provident Financial Holdings, Inc.
Notes to Consolidated Financial Statements
June 30, 2019
utilized for such actions. As of June 30, 2019, the capital conservation buffer required a minimum of 2.50% of risk weighted assets.
For calendar 2019, the minimum requirements call for a Tier1 leverage ratio of 4.00%, a ratio of common equity Tier 1 capital ("CET1") to total risk-weighted assets (“CET1 risk-based ratio”) of
7.00%, a Tier 1 capital ratio of 8.50%, and a total capital ratio of 10.50%.
Under the standards, in order to be considered well-capitalized, the Bank must have a Tier1 leverage ratio of 5%, a CET1 capital ratio of 6.5%, a Tier 1 capital ratio of 8%, and a total capital
ratio of 10%.
At June 30, 2019, the Bank exceeded all regulatory capital requirements. The Bank was categorized as "well-capitalized" at June 30, 2019 under the regulations of the OCC.
The Bank's actual and required minimum capital amounts and ratios at the dates indicated are as follows (dollars in thousands):
|
Regulatory Requirements
|
|||||||||||||||||||||||
|
Actual
|
Minimum for Capital
Adequacy Purposes
|
Minimum to Be
Well Capitalized
|
|||||||||||||||||||||
|
Amount
|
Ratio
|
Amount
|
Ratio
|
Amount
|
Ratio
|
||||||||||||||||||
|
Provident Savings Bank, F.S.B.:
|
|||||||||||||||||||||||
|
As of June 30, 2019
|
|||||||||||||||||||||||
|
Tier 1 leverage capital (to adjusted average assets)
|
$
|
115,009
|
10.50
|
%
|
$
|
43,824
|
4.00
|
%
|
$
|
54,779
|
5.00
|
%
|
|||||||||||
|
CET1 capital (to risk-weighted assets)
|
$
|
115,009
|
18.00
|
%
|
$
|
44,730
|
7.00
|
%
|
$
|
41,535
|
6.50
|
%
|
|||||||||||
|
Tier 1 capital (to risk-weighted assets)
|
$
|
115,009
|
18.00
|
%
|
$
|
54,314
|
8.50
|
%
|
$
|
51,119
|
8.00
|
%
|
|||||||||||
|
Total capital (to risk-weighted assets)
|
$
|
122,225
|
19.13
|
%
|
$
|
67,094
|
10.50
|
%
|
$
|
63,899
|
10.00
|
%
|
|||||||||||
|
As of June 30, 2018
|
|||||||||||||||||||||||
|
Tier 1 leverage capital (to adjusted average assets)
|
$
|
116,369
|
9.96
|
%
|
$
|
46,716
|
4.00
|
%
|
$
|
58,394
|
5.00
|
%
|
|||||||||||
|
CET1 capital (to risk-weighted assets)
|
$
|
116,369
|
16.81
|
%
|
$
|
44,125
|
6.38
|
%
|
$
|
44,990
|
6.50
|
%
|
|||||||||||
|
Tier 1 capital (to risk-weighted assets)
|
$
|
116,369
|
16.81
|
%
|
$
|
54,507
|
7.88
|
%
|
$
|
55,372
|
8.00
|
%
|
|||||||||||
|
Total capital (to risk-weighted assets)
|
$
|
123,911
|
17.90
|
%
|
$
|
68,350
|
9.88
|
%
|
$
|
69,215
|
10.00
|
%
|
|||||||||||
At June 30, 2019, the Bank exceeded all regulatory capital requirements. The Bank was categorized as "well-capitalized" at June 30, 2019 under the regulations of the OCC.
The ability of the Corporation to pay dividends to stockholders depends primarily on the ability of the Bank to pay dividends to the Corporation. The Bank may not declare or pay cash dividends on
or repurchase any of its shares of common stock, if the effect would cause stockholders’ equity to be reduced below applicable regulatory capital maintenance requirements or if such declaration and payment would otherwise violate regulatory
requirements.
Generally, savings institutions, such as the Bank, that before and after the proposed distribution are well-capitalized, may make capital distributions during any calendar year up to 100% of net
income for the year-to-date plus retained net income for the two preceding years. However, an institution deemed to be in need of more than normal supervision or in troubled condition by the OCC may have its dividend authority restricted by the
OCC. If the Bank, however, proposes to make a capital distribution
129
Provident Financial Holdings, Inc.
Notes to Consolidated Financial Statements
June 30, 2019
when it does not meet its capital requirements (or will not following the proposed capital distribution) or that will exceed these net income-based limitations, it must obtain the OCC's approval
prior to making such distribution. In addition, the Bank must file a prior written notice of a dividend with the Federal Reserve Board. The Federal Reserve Board or the OCC may object to a capital distribution based on safety and soundness
concerns. Additional restrictions on Bank dividends may apply if the Bank fails the QTL test. In fiscal 2019 and 2018, the Bank declared $7.5 million and $5.0 million of cash dividends to its parent, the Corporation, respectively.
Note 11: Benefit Plans
The Corporation has a 401(k) defined-contribution plan covering all employees meeting specific age and service requirements. Under the plan, employees may contribute to the plan from their pretax
compensation up to the limits set by the Internal Revenue Service. The Corporation makes matching contributions up to 3% of a participants’ pretax compensation. Participants vest immediately in their own contributions with 100% vesting in the
Corporation’s contributions occurring after six years of credited service. The Corporation’s expense for the plan was approximately $568,000 and $740,000 for the years ended June 30, 2019 and 2018, respectively.
The Corporation has a multi-year employment agreement and a post-retirement compensation agreement with one executive officer and a post-retirement compensation agreement with another executive
officer, which requires payments of certain benefits upon retirement. At June 30, 2019 and 2018, the accrued liability of the post-retirement compensation agreements was $5.6 million and $5.4 million, respectively; costs are being accrued and
expensed annually. For fiscal 2019 and 2018, the accrued expense for these liabilities was $210,000 and $183,000, respectively. The current obligation for these post-retirement benefits was fully funded consistent with contractual requirements and
actuarially determined estimates of the total future obligation. The Corporation invests in BOLI to provide sufficient funding for these post-retirement obligations. As of June 30, 2019 and 2018, the total outstanding cash surrender value of the
BOLI was $7.6 million and $7.4 million, respectively. For fiscal 2019 and 2018, the total BOLI non-taxable income, net of mortality cost was $186,000 and $177,000, respectively.
Employee Stock Ownership Plan
The Corporation established an ESOP on June 27, 1996 for all employees who are age 21 or older and have completed one year of service with the Corporation during which they have served a minimum of
1,000 hours.
The Corporation recognizes compensation expense when the Corporation contributes funds to the ESOP for the purchase of the Corporation’s common stock to be allocated to the ESOP participants. The
Corporation's contribution to the ESOP plan is discretionary. During fiscal 2019, there were 28,000 shares that were purchased in the open market and $539,000 of cash contributions to fulfill the annual discretionary allocation. This compares to
fiscal 2018 when the Corporation purchased 60,000 shares in the open market and no cash contributions to fulfill the annual discretionary allocation. Since the annual contributions are discretionary, the benefits payable under the ESOP cannot be
estimated.
Benefits generally become 100% vested after six years of credited service. Vesting accelerates upon retirement, death or disability of the participant or in the event of a change in control of the
Corporation. Forfeitures are reallocated among remaining participating employees in the same proportion as contributions. Benefits are payable upon death, retirement, early retirement, disability or separation from service.
130
Provident Financial Holdings, Inc.
Notes to Consolidated Financial Statements
June 30, 2019
The net expense related to the ESOP for both the years ended June 30, 2019 and 2018 was $1.1
million. Available shares and cash contributions, if any, are allocated every calendar year end; and the total allocated at December 31, 2018 were 30,000 shares and $539,000 of cash contributions. This compares to 60,000 shares and no cash
contributions allocated at December 31, 2017.
Note 12: Incentive Plans
As of June 30, 2019, the Corporation had three share-based compensation plans, which are described below. These plans are the 2013 Equity Incentive Plan (“2013 Plan”), the 2010 Equity Incentive
Plan (“2010 Plan”) and the 2006 Equity Incentive Plan (“2006 Plan”). For the years ended June 30, 2019 and 2018, the compensation cost for these plans was $869,000 and $1.1 million, respectively.
Equity Incentive Plans. The Corporation established and the shareholders approved the 2013 Plan, the 2010 Plan and the 2006 Plan (collectively, the “Plans”)
for directors, advisory directors, directors emeriti, officers and employees of the Corporation and its subsidiary. The 2013 Plan authorizes 300,000 stock options and 300,000 shares of restricted stock. The 2013 Plan also provides that no person
may be granted more than 60,000 stock options or 45,000 shares of restricted stock in any one year. The 2010 Plan authorizes 586,250 stock options and 288,750 shares of restricted stock. The 2010 Plan also provides that no person may be granted
more than 117,250 stock options or 43,312 shares of restricted stock in any one year. The 2006 Plan authorized 365,000 stock options and 185,000 shares of restricted stock. No new awards can be granted from the 2006 Plan.
Equity Incentive Plans - Stock Options. Under the Plans, options may not be granted at a price less than the fair market value at the date of the
grant. Options typically vest over a five-year or shorter period as long as the director, advisory director, director emeritus, officer or employee remains in service to the Corporation. The options are exercisable after vesting for up to the
remaining term of the original grant. The maximum term of the options granted is 10 years.
The fair value of each option grant is estimated using the Black-Scholes option valuation model with the following assumptions as of the grant date for the periods indicated. The expected
volatility is based on implied volatility from historical common stock closing prices for the prior 84 months. The expected dividend yield is based on the most recent quarterly dividend on an annualized basis. The expected term is based on the
historical experience of all fully vested stock option grants and is reviewed annually. The risk-free interest rate is based on the U.S. Treasury note rate with a term similar to the underlying stock option on the particular grant date.
|
Fiscal 2019
|
Fiscal 2018
|
||||
|
Expected volatility
|
16.5
|
%
|
—
|
%
|
|
|
Weighted-average volatility
|
16.5
|
%
|
—
|
%
|
|
|
Expected dividend yield
|
2.8
|
%
|
—
|
%
|
|
| Expected term (in years) | 7.5 |
— |
|||
|
Risk-free interest rate
|
2.1
|
%
|
—
|
%
|
|
In fiscal 2019, there were 90,000 options granted under the Plans, while 48,250 options were exercised and no options were forfeited. In fiscal 2018, there were no options granted under the Plans,
while 83,750 options were exercised and 2,500 options were forfeited.
131
Provident Financial Holdings, Inc.
Notes to Consolidated Financial Statements
June 30, 2019
As of June 30, 2019 and 2018, there were 57,500 and 147,500 options, respectively, available for future grants under the Plans.
The following tables summarize the stock option activity in the Plans during the years ended June 30, 2019 and 2018:
|
Options
|
Shares
|
Weighted-
Average Exercise Price |
Weighted-
Average Remaining Contractual Term (Years) |
Aggregate
Intrinsic Value ($000) |
|||
|
Outstanding at June 30, 2017
|
615,250
|
$12.14
|
|||||
|
Granted
|
—
|
$—
|
|||||
|
Exercised
|
(83,750
|
)
|
$8.08
|
||||
|
Forfeited
|
(2,500
|
)
|
$14.59
|
||||
|
Outstanding at June 30, 2018
|
529,000
|
$12.77
|
5.27
|
$
|
3,353
|
||
|
Vested and expected to vest at June 30, 2018
|
490,850
|
$12.57
|
5.17
|
$
|
3,204
|
||
|
Exercisable at June 30, 2018
|
338,250
|
$11.36
|
4.55
|
$
|
2,612
|
||
|
Outstanding at June 30, 2018
|
529,000
|
$12.77
|
|||||
|
Granted
|
90,000
|
$20.19
|
|||||
|
Exercised
|
(48,250
|
)
|
$11.45
|
||||
|
Forfeited
|
—
|
$—
|
|||||
|
Outstanding at June 30, 2019
|
570,750
|
$14.05
|
5.21
|
$
|
3,960
|
||
|
Vested and expected to vest at June 30, 2019
|
550,150
|
$13.82
|
5.05
|
$
|
3,942
|
||
|
Exercisable at June 30, 2019
|
467,750
|
$12.72
|
4.25
|
$
|
3,870
|
||
As of June 30, 2019 and 2018, there was $292,000 and $409,000 of unrecognized compensation expense, respectively, related to unvested share-based compensation arrangements with respect to stock
options issued under the Plans. The expense is expected to be recognized over a weighted-average period of 3.4 years and 10 months, respectively. The forfeiture rate during both fiscal 2019 and 2018 was 20 percent, and was calculated by using the
historical forfeiture experience of all fully vested stock option grants which is reviewed annually.
Equity Incentive Plans – Restricted Stock. The Corporation used 300,000 shares, 288,750 shares and 185,000 shares of its treasury stock to fund awards of
restricted stock under the 2013 Plan, the 2010 Plan and the 2006 Plan, respectively. Awarded shares typically vest over a five-year or shorter period as long as the director, advisory director, director emeriti, officer or employee remains in
service to the Corporation. Once vested, a recipient of restricted stock will have all rights of a shareholder, including the power to vote and the right to receive dividends. The Corporation recognizes compensation expense for the restricted stock
awards based on the fair value of the shares at the award date.
In fiscal 2019, 224,500 shares of restricted stock were awarded under the Plans with 50% vesting after two years of service and 50% vesting after four years of service, while 89,500 shares were
vested and distributed and no shares were forfeited. In fiscal 2018, no shares of restricted stock were awarded under the Plans, while 10,500 shares were vested and distributed and 2,000 shares were forfeited. As of June 30, 2019 and 2018, there
were 43,250 and 267,750 shares available for future awards under the Plans, respectively. No new awards can be granted from the 2006 Plan.
132
Provident Financial Holdings, Inc.
Notes to Consolidated Financial Statements
June 30, 2019
The following table summarizes the restricted stock activity for the years ended June 30, 2019 and 2018:
|
Unvested Shares
|
Shares
|
Weighted-Average
Award Date Fair Value |
|
|
Unvested at June 30, 2017
|
111,000
|
$14.16
|
|
|
Awarded
|
—
|
$—
|
|
|
Vested
|
(10,500
|
)
|
$15.37
|
|
Forfeited
|
(2,000
|
)
|
$13.30
|
|
Unvested at June 30, 2018
|
98,500
|
$14.35
|
|
|
Expected to vest at June 30, 2018
|
78,800
|
$14.35
|
|
|
Unvested at June 30, 2018
|
98,500
|
$14.35
|
|
|
Awarded
|
224,500
|
$18.57
|
|
|
Vested
|
(89,500
|
)
|
$13.97
|
|
Forfeited
|
—
|
$—
|
|
|
Unvested at June 30, 2019
|
233,500
|
$18.55
|
|
|
Expected to vest at June 30, 2019
|
186,800
|
$18.55
|
|
As of June 30, 2019 and 2018, the unrecognized compensation expense was $4.2 million and $409,000, respectively, related to unvested share-based compensation arrangements with respect to restricted
stock issued under the Plans, and reported as a reduction to stockholders’ equity. This expense is expected to be recognized over a weighted-average period of 3.9 years and 10 months, respectively. Similar to stock options, a forfeiture rate of 20
percent has been applied to the restricted stock compensation expense calculations in fiscal 2019 and 2018. For the fiscal years ended June 30, 2019 and 2018, the fair value of shares vested and distributed was $1.6 million and $194,000,
respectively.
Note 13: Earnings Per Share
Basic earnings per share (“EPS”) excludes dilution and is computed by dividing income available to common shareholders by the weighted-average number of shares outstanding for the period. Diluted
EPS reflects the potential dilution that could occur if securities or other contracts to issue common stock were exercised or converted into common stock or resulted in the issuance of common stock that would then share in the earnings of the
Corporation.
As of June 30, 2019 and 2018, there were outstanding options to purchase 570,750 shares and 529,000 shares of the Corporation’s common stock, respectively, and no shares and 20,000 shares,
respectively, were excluded from the diluted EPS computation as their effect was anti-dilutive. As of June 30, 2019 and 2018, there were outstanding restricted stock awards of 233,500 shares and 98,500 shares, respectively.
133
Provident Financial Holdings, Inc.
Notes to Consolidated Financial Statements
June 30, 2019
The following table provides the basic and diluted EPS computations for the fiscal years ended June 30, 2019 and 2018, respectively:
|
(Dollars in Thousands, Except Share Amount)
|
For the Year Ended June 30, 2019
|
|||||||||||
|
Income
(Numerator)
|
Shares
(Denominator)
|
Per-Share
Amount
|
||||||||||
|
Basic EPS
|
$
|
4,417
|
7,484,925
|
$
|
0.59
|
|||||||
|
Effect of dilutive shares:
|
||||||||||||
|
Stock options
|
95,960
|
|||||||||||
|
Restricted stock
|
15,383
|
|||||||||||
|
Diluted EPS
|
$
|
4,417
|
7,596,268
|
$
|
0.58
|
|||||||
|
(Dollars in Thousands, Except Share Amount)
|
For the Year Ended June 30, 2018
|
|||||||||||
|
Income
(Numerator)
|
Shares
(Denominator)
|
Per-Share
Amount
|
||||||||||
|
Basic EPS
|
$
|
2,131
|
7,542,071
|
$
|
0.28
|
|||||||
|
Effect of dilutive shares:
|
||||||||||||
|
Stock options
|
104,796
|
|||||||||||
|
Restricted stock
|
53,504
|
|||||||||||
|
Diluted EPS
|
$
|
2,131
|
7,700,371
|
$
|
0.28
|
|||||||
Note 14: Commitments and Contingencies
Periodically, there have been various claims and lawsuits involving the Corporation, such as claims to enforce liens, condemnation proceedings on properties in which the Corporation holds security
interests, claims involving the making and servicing of real property loans, employment matters and other issues in the ordinary course of and incidental to the Corporation’s business. The Corporation is not a party to any pending legal proceedings
that it believes would have a material adverse effect on the financial condition, operations or cash flows of the Corporation, except as set forth below. Additionally, in some actions, it is difficult to assess potential exposure because the
Corporation is still in the early stages of the litigation.
McKeen-Chaplin and Neal lawsuits:
On December 17, 2012, a class and collective action lawsuit, Gina McKeen-Chaplin, individually and on behalf of others similarly situated vs. the Bank was filed in the United States District Court
for the Eastern District of California (the "Court") against the Bank claiming damages, restitution and injunctive relief for alleged misclassification of certain employees as exempt rather than non-exempt, resulting in a failure to pay appropriate
overtime compensation, to provide meal and rest periods, to pay waiting time penalties and to provide accurate wage statements (the “McKeen-Chaplin lawsuit”).
On May 22, 2013, counsel in the McKeen-Chaplin lawsuit filed another class action called Neal vs. Provident Savings Bank, F.S.B. (the “Neal lawsuit”) in California Superior Court in Alameda County
(the "State Court"). The Neal lawsuit is virtually identical to the McKeen-Chaplin lawsuit alleging that mortgage underwriters were misclassified as exempt employees.
134
Provident Financial Holdings, Inc.
Notes to Consolidated Financial Statements
June 30, 2019
On August 12, 2015, the Court issued an order denying the plaintiffs' motion for summary judgment and granting the Bank's motion for summary judgment affirming that the plaintiffs were properly
classified as exempt employees and denying the federal claims under the Fair Labor Standards Act (“FSLA”). On August 18, 2015, the plaintiffs filed an appeal to the order. On July 5, 2017, the United States Court of Appeals for the Ninth Circuit (the
“Ninth Circuit”) reversed the Court’s ruling granting the Bank's motion for summary judgment, instead ruling the plaintiffs were improperly classified as exempt employees and were entitled to overtime compensation. The Ninth Circuit remanded the case
back to the Court with instructions to enter summary judgement in favor of the plaintiffs. As a result of the Ninth Circuit’s unfavorable ruling, the Bank filed on September 7, 2017, a petition for writ of certiorari to the United States Supreme
Court, which was denied on November 27, 2017.
On December 18, 2017, the Bank entered into a Memorandum of Understanding with the plaintiffs' representatives to memorialize an agreement in principle to settle the pending McKeen-Chaplin and Neal
lawsuits. The Memorandum of Understanding assumes class certification for purposes of the settlement only and provides for an aggregate settlement payment by the Bank of $1.8 million, which includes all settlement funds, the named plaintiff service
payments, and class counsel's attorneys' fees and costs. Any additional costs and expenses related to employer-side payroll taxes will be paid by the Bank. The parties subsequently successfully negotiated and executed a mutually acceptable long-form
settlement agreement.
On February 21, 2018, plaintiffs filed a motion in McKeen-Chaplin asking the Court to approve the FLSA portion of the settlement agreement. The parties also worked together to jointly request that
the Court of Appeal in the Neal lawsuit pass jurisdiction back to the State Court to oversee the settlement process, which was preliminary approved on May 15, 2018. Subsequently, on July 18, 2018 the Court approved the FLSA portion of the settlement
which allowed the parties to begin the process of providing notice of the settlement to class members. The State Court had already granted preliminary approval of the state law class settlement in the Neal lawsuit.
The Bank’s decision to settle these lawsuits was the result of the unfavorable ruling by the United States Supreme Court in the McKeen-Chaplin lawsuit and the significant legal costs, distraction
from day-to-day operating activities and substantial resources that would be required to defend the Bank in protracted litigation if the Neal lawsuit would proceed. In addition, the Bank determined that the settlement would reduce the Bank's
potential exposure to damages, penalties, fines and plaintiffs' legal fees in the event of an unfavorable outcome in the Neal lawsuit. The settlement includes the dismissal of all claims against the Bank and related parties in the McKeen-Chaplin and
Neal lawsuits without any admission of liability or wrongdoing attributed to the Bank.
Based on the proposed settlement, the Corporation recorded a litigation settlement expense accrual of $650,000 in the second quarter of fiscal 2018 to fully reserve for the agreed upon settlement
amount.
On November 13, 2018, the State Court approved the motion for final approval of the settlement agreement in the two class and collective action lawsuits filed by McKeen-Chaplin and Neal,
respectively, against the Bank. Following the grant of the final approval, the Court in McKeen-Chaplin dismissed the case. The settlement funds have been distributed to the plaintiffs and plaintiff’s counsel consistent with the settlement
agreements. On April 8, 2019, the State Court signed an order closing and dismissing the cases. The McKeen-Chaplin and Neal cases are now completed and dismissed.
Cannon lawsuit:
On August 6, 2015, a former employee, Christina Cannon, filed a lawsuit called Cannon vs. the Bank in the California Superior Court for the County of San Bernardino (the “Cannon lawsuit”). Cannon
seeks to represent a class of all non-exempt employees in a class action lawsuit brought under California’s Unfair Competition Law, Business & Professions Code section 17200. The underlying claims include unpaid overtime (including off-the-clock
work), meal and rest period violations, minimum wage violations, and failure to reimburse business expenses. On September 8, 2017, the attorneys for the plaintiffs in the Cannon lawsuit sent notification to the Bank and to the California Labor &
Workforce Development Agency informing them of their intent to bring a claim under the Private Attorneys’ General Act of 2004 (“PAGA”) on behalf of all non-exempt employees and covering a variety of alleged wage and hour violations. On September 12,
2017, the Bank entered into a Memorandum of Understanding with the plaintiffs’ representatives to memorialize an agreement in principle to settle the pending Cannon lawsuit. The Memorandum of Understanding assumes class certification for purposes of
the settlement only and provides for an aggregate settlement payment by the Bank of up to $2.8 million, which includes all settlement funds, the class representative
135
Provident Financial Holdings, Inc.
Notes to Consolidated Financial Statements
June 30, 2019
enhancement award, settlement administrator’s expenses, any employer-side payroll taxes, and class counsel’s attorneys’ fees and costs. The Bank’s decision to settle this matter was the result of
the significant legal costs, distraction from day-to-day operating activities and substantial resources that would be required to defend the Bank in protracted litigation. In addition, the Bank determined that the settlement would reduce the Bank’s
potential exposure to damages, penalties, fines and plaintiffs’ legal fees in the event of an unfavorable outcome in a court trial. The settlement includes the dismissal of all claims against the Bank and related parties in the Cannon lawsuit and
claim under the PAGA, without any admission of liability or wrongdoing attributed to the Bank. Because of the uncertainty surrounding this litigation, no litigation reserve had been previously established by the Bank resulting in the full $2.8
million settlement expense being recognized in the first quarter of fiscal 2018.
On December 20, 2018, counsel in the Cannon lawsuit filed a Motion for Preliminary Approval of the Settlement in the California Superior Court for the County of San Bernardino. On April 12, 2019,
this court granted preliminary approval of the settlement.
On July 24, 2019, the California Superior Court for the County of San Bernardino, California granted final approval of the settlement in the Cannon vs. Bank lawsuit. On July 26, 2019, the final
order was signed by this court and on August 6, 2019, the Bank forwarded the settlement amount to the class administrator. The total settlement may be slightly reduced.
The Corporation is not a party to any other pending legal proceedings that it believes would have a material adverse effect on the financial condition, operations and cash flows of the Corporation.
The Corporation conducts a portion of its operations in leased facilities and has maintenance contracts under non-cancelable agreements classified as operating leases. The
following is a schedule of the Corporation’s operating lease obligations:
|
Amount
|
|||
|
Year Ending June 30,
|
(In Thousands)
|
||
|
2020
|
$
|
2,040
|
|
|
2021
|
1,776
|
||
|
2022
|
1,516
|
||
|
2023
|
802
|
||
|
2024
|
367
|
||
|
Thereafter
|
415
|
||
|
Total minimum payments required
|
$
|
6,916
|
|
Lease expense under operating leases was approximately $3.9 million and $3.1 million for the years ended June 30, 2019 and 2018, respectively.
The Bank sold single-family mortgage loans to unrelated third parties with standard representation and warranty provisions in the ordinary course of its business activities. Under these
provisions, the Bank is required to repurchase any previously sold loan for which the representations or warranties of the Bank prove to be inaccurate, incomplete or misleading. In the event of a borrower default or fraud, pursuant to a breached
representation or warranty, the Bank may be required to reimburse the investor for any losses suffered. As of both June 30, 2019 and 2018, the Bank maintained a non-contingent recourse liability related to these representations and warranties of
$200,000. In addition, the Bank maintained a recourse liability of $50,000 and $83,000 at June 30, 2019 and 2018, respectively, for loans sold to the FHLB – San Francisco under the MPF program.
In the ordinary course of business, the Corporation enters into contracts with third parties under which the third parties provide services on behalf of the Corporation. In many of these
contracts, the Corporation agrees to indemnify the third party service provider under certain circumstances. The terms of the indemnity vary from contract to contract and the amount of the indemnification liability, if any, cannot be
determined. The Corporation also enters into other contracts and agreements; such
136
Provident Financial Holdings, Inc.
Notes to Consolidated Financial Statements
June 30, 2019
as, loan sale agreements, litigation settlement agreements, confidentiality agreements, loan servicing agreements, leases and subleases, among others, in which the Corporation agrees to indemnify third parties for acts by the Corporation’s agents, assignees and/or sub-lessees, and employees. Due to the nature of these indemnification provisions, the Corporation cannot calculate its aggregate potential exposure.
Pursuant to their governing instruments, the Corporation and its subsidiaries provide indemnification to directors, officers, employees and, in some cases, agents of the Corporation against certain
liabilities incurred as a result of their service on behalf of or at the request of the Corporation and its subsidiaries. It is not possible for the Corporation to determine the aggregate potential exposure resulting from the obligation to provide
this indemnity.
Note 15: Derivative and Other Financial Instruments with Off-Balance Sheet Risks
The Corporation is a party to financial instruments with off-balance sheet risk in the normal course of business to meet the financing needs of its customers. These financial instruments include
commitments to extend credit in the form of originating loans or providing funds under existing lines of credit, loan sale commitments to third parties and option contracts. These instruments involve, to varying degrees, elements of credit and
interest-rate risk in excess of the amount recognized in the accompanying Consolidated Statements of Financial Condition. The Corporation’s exposure to credit loss, in the event of non-performance by the counterparty to these financial instruments,
is represented by the contractual amount of these instruments. The Corporation uses the same credit policies in entering into financial instruments with off-balance sheet risk as it does for on-balance sheet instruments. As of June 30, 2019 and
2018, the Corporation had commitments to extend credit (on loans to be held for investment and loans to be held for sale) of $4.3 million and $66.3 million, respectively.
The following table provides information at the dates indicated regarding undisbursed funds to borrowers on existing lines of credit with the Corporation as well as commitments
to originate loans to be held for investment at the dates indicated below:
|
June 30,
|
||||||
|
Commitments
|
2019
|
2018
|
||||
|
(In Thousands)
|
||||||
|
Undisbursed loan funds – Construction loans
|
$
|
6,592
|
$
|
4,302
|
||
|
Undisbursed lines of credit – Commercial business loans
|
1,003
|
495
|
||||
|
Undisbursed lines of credit – Consumer loans
|
479
|
503
|
||||
|
Commitments to extend credit on loans to be held for investment
|
4,254
|
9,352
|
||||
|
Total
|
$
|
12,328
|
$
|
14,652
|
||
The following table provides information regarding the allowance for loan losses for the undisbursed funds and commitments to extend credit on loans to be held for investment
for the years ended June 30, 2019 and 2018:
|
Year Ended June 30,
|
||||||
|
(In Thousands)
|
2019
|
2018
|
||||
|
Balance, beginning of the year
|
$
|
157
|
$
|
277
|
||
|
Provision (recovery)
|
(16
|
)
|
(120
|
)
|
||
|
Balance, end of the year
|
$
|
141
|
$
|
157
|
||
137
Provident Financial Holdings, Inc.
Notes to Consolidated Financial Statements
June 30, 2019
Consistent with the Corporation’s announcement on February 4, 2019 to scale back the origination of saleable single-family mortgage loans and improve on its efforts to increase the volume of
portfolio single-family mortgage loan originations, the Corporation does not have any outstanding derivative and other financial instruments as of June 30, 2019.
In accordance with ASC 815, “Derivatives and Hedging,” and interpretations of the Derivatives Implementation Group of the FASB, the fair value of the commitments to extend credit on loans to be
held for sale, loan sale commitments, TBA MBS trades, put option contracts and call option contracts are recorded at fair value on the Consolidated Statements of Financial Condition. At June 30, 2019, there were no fair value derivative balances
included in other assets and other liabilities. At June 30, 2018, $849,000 was included in other assets and $464,000 was included in other liabilities. The Corporation does not apply hedge accounting to its derivative financial instruments;
therefore, all changes in fair value are recorded in the Consolidated Statements of Operations.
The net impact of derivative financial instruments on the gain on sale of loans contained in the Consolidated Statements of Operations for the years ended June 30, 2019 and 2018 was as follows:
|
Year Ended June 30,
|
|||||||
|
Derivative Financial Instruments
|
2019
|
2018
|
|||||
|
Commitments to extend credit on loans to be held for sale
|
$
|
(825
|
)
|
$
|
16
|
||
|
Mandatory loan sale commitments and TBA MBS trades
|
440
|
(1,026
|
)
|
||||
|
Option contracts
|
—
|
(37
|
)
|
||||
|
Total net loss
|
$
|
(385
|
)
|
$
|
(1,047
|
)
|
|
The outstanding derivative financial instruments at the dates indicated were as follows:
|
(In Thousands)
|
June 30, 2019
|
June 30, 2018
|
|||||||||||
|
Derivative Financial Instruments
|
Amount
|
Fair
Value |
Amount
|
Fair
Value |
|||||||||
|
Commitments to extend credit on loans to be held for sale(1)
|
$
|
—
|
$
|
—
|
$
|
56,906
|
$
|
825
|
|||||
|
Best efforts loan sale commitments
|
—
|
—
|
(29,502
|
)
|
—
|
||||||||
|
Mandatory loan sale commitments and TBA MBS trades
|
—
|
—
|
(117,759
|
)
|
(440
|
)
|
|||||||
|
Option contracts
|
—
|
—
|
—
|
—
|
|||||||||
|
Total
|
$
|
—
|
$
|
—
|
$
|
(90,355
|
)
|
$
|
385
|
||||
|
(1)
|
Net of 24.7% at June 30, 2018, which management has estimated may not fund.
|
Note 16: Fair Value of Financial Instruments
The Corporation adopted ASC 820, “Fair Value Measurements and Disclosures,” and elected the fair value option pursuant to ASC 825, “Financial Instruments” on single-family loans originated for
sale. ASC 820 defines fair value, establishes a framework for measuring fair value, and expands disclosures about fair value measurements. ASC 825 permits entities to elect to measure many financial instruments and certain other assets and
liabilities at fair value on an instrument-by-instrument basis (the “Fair Value Option”) at specified election dates. At each subsequent reporting date, an entity is required to report
138
Provident Financial Holdings, Inc.
Notes to Consolidated Financial Statements
June 30, 2019
unrealized gains and losses on items in earnings for which the fair value option has been elected. The objective of the Fair Value Option is to improve financial reporting by providing entities
with the opportunity to mitigate volatility in reported earnings caused by measuring related assets and liabilities differently without having to apply complex hedge accounting provisions.
The following table describes the difference at the dates indicated between the aggregate fair value and the aggregate unpaid principal balance of loans held for investment at fair value and loans
held for sale at fair value:
|
(In Thousands)
|
Aggregate
Fair Value
|
Aggregate
Unpaid
Principal
Balance
|
Net
Unrealized
Gain (Loss)
|
||||||
|
As of June 30, 2019:
|
|||||||||
|
Loans held for investment, at fair value
|
$
|
5,094
|
$
|
5,218
|
$
|
(124
|
)
|
||
|
Loans held for sale, at fair value
|
$
|
-
|
$
|
-
|
$
|
-
|
|||
|
As of June 30, 2018:
|
|||||||||
|
Loans held for investment, at fair value
|
$
|
5,234
|
$
|
5,546
|
$
|
(312
|
)
|
||
|
Loans held for sale, at fair value
|
$
|
96,298
|
$
|
93,791
|
$
|
2,507
|
|||
ASC 820 establishes a three-level valuation hierarchy that prioritizes inputs to valuation techniques used in fair value calculations. The three levels of inputs are defined as follows:
|
Level 1
|
-
|
Unadjusted quoted prices in active markets for identical assets or liabilities that the Corporation has the ability to access at the measurement date.
|
|
Level 2
|
-
|
Observable inputs other than Level 1 such as: quoted prices for similar assets or liabilities in active markets, quoted prices for identical or similar assets or liabilities in markets that
are not active, or other inputs that are observable or can be corroborated to observable market data for substantially the full term of the asset or liability.
|
|
Level 3
|
-
|
Unobservable inputs for the asset or liability that use significant assumptions, including assumptions of risks. These unobservable assumptions reflect the Corporation’s estimate of
assumptions that market participants would use in pricing the asset or liability. Valuation techniques include the use of pricing models, discounted cash flow models and similar techniques.
|
ASC 820 requires the Corporation to maximize the use of observable inputs and minimize the use of unobservable inputs. If a financial instrument uses inputs that fall in different levels of the
hierarchy, the instrument will be categorized based upon the lowest level of input that is significant to the fair value calculation.
The Corporation’s financial assets and liabilities measured at fair value on a recurring basis consist of investment securities available for sale, loans held for investment at fair value, loans
held for sale at fair value, interest-only strips and derivative financial instruments; while non-performing loans, MSA and real estate owned are measured at fair value on a nonrecurring basis.
Investment securities - available for sale are primarily comprised of U.S. government agency MBS, U.S. government sponsored enterprise MBS and privately issued CMO. The Corporation utilizes quoted
prices in active markets for similar securities for
139
Provident Financial Holdings, Inc.
Notes to Consolidated Financial Statements
June 30, 2019
its fair value measurement of MBS (Level 2) and broker price indications for similar securities in non-active markets for its fair value measurement of the CMO (Level 3).
Derivative financial instruments are comprised of commitments to extend credit on loans to be held for sale, mandatory loan sale commitments, TBA MBS trades and option contracts. The fair value of
TBA MBS trades is determined using quoted secondary-market prices (Level 2). The fair values of other derivative financial instruments are determined by quoted prices for a similar commitment or commitments, adjusted for the specific attributes of
each commitment (Level 3).
Loans held for sale at fair value are primarily single-family loans. The fair value is determined, when possible, using quoted secondary-market prices such as mandatory loan sale commitments. If
no such quoted price exists, the fair value of a loan is determined by quoted prices for a similar loan or loans, adjusted for the specific attributes of each loan (Level 2).
Non-performing loans are loans which are inadequately protected by the current sound worth and paying capacity of the borrowers or of the collateral pledged. The non-performing loans are
characterized by the distinct possibility that the Corporation will sustain some loss if the deficiencies are not corrected. The fair value of a non-performing loan is determined based on an observable market price or current appraised value of the
underlying collateral. Appraised and reported values may be discounted based on management’s historical knowledge, changes in market conditions from the time of valuation, and/or management’s expertise and knowledge of the collateral. For
non-performing loans which are restructured loans, the fair value is derived from discounted cash flow analysis (Level 3), except those which are in the process of foreclosure or 90 days delinquent for which the fair value is derived from the
appraised value of its collateral (Level 2). For other non-performing loans which are not restructured loans, other than non-performing commercial real estate loans, the fair value is derived from relative value analysis: historical experience and
management estimates by loan type for which collectively evaluated allowances are assigned (Level 3); or the appraised value of its collateral for loans which are in the process of foreclosure or where borrowers file bankruptcy (Level 2). For
non-performing commercial real estate loans, the fair value is derived from the appraised value of its collateral (Level 2). Non-performing loans are reviewed and evaluated on at least a quarterly basis for additional allowance and adjusted
accordingly, based on the same factors identified above. This loss is not recorded directly as an adjustment to current earnings or other comprehensive income (loss), but rather as a component in determining the overall adequacy of the allowance for
loan losses. These adjustments to the estimated fair value of non-performing loans may result in increases or decreases to the provision for loan losses recorded in current earnings.
The Corporation uses the amortization method for its MSA, which amortizes the MSA in proportion to and over the period of estimated net servicing income and assesses the MSA for impairment based on
fair value at each reporting date. The fair value of the MSA is derived using the present value method; which includes a third party’s prepayment projections of similar instruments, weighted-average coupon rates, estimated servicing costs and
discount interest rates (Level 3).
The fair value of interest-only strips is derived using the same assumptions that are used to value the related MSA (Level 3).
The fair value of real estate owned is derived from the lower of the appraised value or the listing price, net of estimated selling costs (Level 2).
140
Provident Financial Holdings, Inc.
Notes to Consolidated Financial Statements
June 30, 2019
The Corporation’s valuation methodologies may produce a fair value calculation that may not be indicative of net realizable value or reflective of future fair values. While management believes
the Corporation’s valuation methodologies are appropriate and consistent with other market participants, the use of different methodologies or assumptions to determine the fair value of certain financial instruments could result in a different
estimate of fair value at the reporting date.
The following fair value hierarchy table presents information at the dates indicated about the Corporation’s assets measured at fair value on a recurring basis:
|
Fair Value Measurement at June 30, 2019 Using:
|
||||||||||||
|
(In Thousands)
|
Level 1
|
Level 2
|
Level 3
|
Total
|
||||||||
|
Assets:
|
||||||||||||
|
Investment securities - available for sale:
|
||||||||||||
|
U.S. government agency MBS
|
$
|
—
|
$
|
3,613
|
$
|
—
|
$
|
3,613
|
||||
|
U.S. government sponsored enterprise MBS
|
—
|
2,087
|
—
|
2,087
|
||||||||
|
Private issue CMO
|
—
|
—
|
269
|
269
|
||||||||
|
Investment securities - available for sale
|
—
|
5,700
|
269
|
5,969
|
||||||||
|
Loans held for investment, at fair value
|
—
|
—
|
5,094
|
5,094
|
||||||||
|
Interest-only strips
|
—
|
—
|
16
|
16
|
||||||||
|
Total assets
|
$
|
—
|
$
|
5,700
|
$
|
5,379
|
$
|
11,079
|
||||
|
Liabilities:
|
$
|
—
|
$
|
—
|
$
|
—
|
$
|
—
|
||||
|
Total liabilities
|
$
|
—
|
$
|
—
|
$
|
—
|
$
|
—
|
||||
Provident Financial Holdings, Inc.
Notes to Consolidated Financial Statements
June 30, 2019
|
Fair Value Measurement at June 30, 2018 Using:
|
||||||||||||
|
(In Thousands)
|
Level 1
|
Level 2
|
Level 3
|
Total
|
||||||||
|
Assets:
|
||||||||||||
|
Investment securities - available for sale:
|
||||||||||||
|
U.S. government agency MBS
|
$
|
—
|
$
|
4,384
|
$
|
—
|
$
|
4,384
|
||||
|
U.S. government sponsored enterprise MBS
|
—
|
2,762
|
—
|
2,762
|
||||||||
|
Private issue CMO
|
—
|
—
|
350
|
350
|
||||||||
|
Investment securities - available for sale
|
—
|
7,146
|
350
|
7,496
|
||||||||
|
Loans held for investment, at fair value
|
—
|
—
|
5,234
|
5,234
|
||||||||
|
Loans held for sale, at fair value
|
—
|
96,298
|
—
|
96,298
|
||||||||
|
Interest-only strips
|
—
|
—
|
23
|
23
|
||||||||
|
Derivative assets:
|
||||||||||||
|
Commitments to extend credit on loans to be held for sale
|
—
|
—
|
849
|
849
|
||||||||
|
Derivative assets
|
—
|
—
|
849
|
849
|
||||||||
|
Total assets
|
$
|
—
|
$
|
103,444
|
$
|
6,456
|
$
|
109,900
|
||||
|
Liabilities:
|
||||||||||||
|
Derivative liabilities:
|
||||||||||||
|
Commitments to extend credit on loans to be held for sale
|
$
|
—
|
$
|
—
|
$
|
24
|
$
|
24
|
||||
|
Mandatory loan sale commitments
|
—
|
—
|
32
|
32
|
||||||||
|
TBA MBS trades
|
—
|
408
|
—
|
408
|
||||||||
|
Derivative liabilities
|
—
|
408
|
56
|
464
|
||||||||
|
Total liabilities
|
$
|
—
|
$
|
408
|
$
|
56
|
$
|
464
|
||||
142
Provident Financial Holdings, Inc.
Notes to Consolidated Financial Statements
June 30, 2019
The following is a reconciliation of the beginning and ending balances during the periods shown of recurring fair value measurements recognized in the Consolidated Statements of
Financial Condition using Level 3 inputs:
|
Fair Value Measurement
Using Significant Other Unobservable Inputs
(Level 3)
|
|||||||||||||||||||||
|
(In Thousands)
|
Private
Issue
CMO
|
Loans Held
For
Investment, at
fair value(1)
|
Interest-
Only
Strips
|
Loan
Commit-
ments to
Originate(2)
|
Manda-
tory
Commit-
ments(3)
|
Option
Contracts
|
Total
|
||||||||||||||
|
Beginning balance at June 30, 2018
|
$
|
350
|
$
|
5,234
|
$
|
23
|
$
|
825
|
$
|
(32
|
)
|
$
|
—
|
$
|
6,400
|
||||||
|
Total gains or losses (realized/
unrealized):
|
|||||||||||||||||||||
|
Included in earnings
|
—
|
188
|
—
|
(825
|
)
|
19
|
—
|
(618
|
)
|
||||||||||||
|
Included in other comprehensive
income (loss)
|
4
|
—
|
(7
|
)
|
—
|
—
|
—
|
(3
|
)
|
||||||||||||
|
Purchases
|
—
|
—
|
—
|
—
|
—
|
—
|
—
|
||||||||||||||
|
Issuances
|
—
|
—
|
—
|
—
|
—
|
—
|
—
|
||||||||||||||
|
Settlements
|
(85
|
)
|
(1,288
|
)
|
—
|
—
|
13
|
—
|
(1,360
|
)
|
|||||||||||
|
Transfers in and/or out of Level 3
|
—
|
960
|
—
|
—
|
—
|
—
|
960
|
||||||||||||||
|
Ending balance at June 30, 2019
|
$
|
269
|
$
|
5,094
|
$
|
16
|
$
|
—
|
$
|
—
|
$
|
—
|
$
|
5,379
|
|||||||
|
(1)
|
The valuation of loans held for investment at fair value includes management estimates of the specific credit risk attributes of each loan, in addition to the quoted secondary-market
prices which account for interest rate characteristics.
|
|
(2)
|
Consists of commitments to extend credit on loans to be held for sale.
|
|
(3)
|
Consists of mandatory loan sale commitments.
|
143
Provident Financial Holdings, Inc.
Notes to Consolidated Financial Statements
June 30, 2019
|
Fair Value Measurement
Using Significant Other Unobservable Inputs
(Level 3)
|
|||||||||||||||||||||
|
(In Thousands)
|
Private
Issue
CMO
|
Loans Held
For
Investment, at
fair value(1)
|
Interest-
Only
Strips
|
Loan
Commit-
ments to
Originate(2)
|
Manda-
tory
Commit-
ments(3)
|
Option
Contracts
|
Total
|
||||||||||||||
|
Beginning balance at June 30, 2017
|
$
|
461
|
$
|
6,445
|
$
|
31
|
$
|
809
|
$
|
47
|
$
|
37
|
$
|
7,830
|
|||||||
|
Total gains or losses (realized/
unrealized):
|
|||||||||||||||||||||
|
Included in earnings
|
—
|
(60
|
)
|
—
|
16
|
(87
|
)
|
(37
|
)
|
(168
|
)
|
||||||||||
|
Included in other comprehensive
income (loss)
|
(1
|
)
|
—
|
(8
|
)
|
—
|
—
|
—
|
(9
|
)
|
|||||||||||
|
Purchases
|
—
|
—
|
—
|
—
|
—
|
—
|
—
|
||||||||||||||
|
Issuances
|
—
|
—
|
—
|
—
|
—
|
—
|
—
|
||||||||||||||
|
Settlements
|
(110
|
)
|
(2,242
|
)
|
—
|
—
|
8
|
—
|
(2,344
|
)
|
|||||||||||
|
Transfers in and/or out of Level 3
|
—
|
1,091
|
—
|
—
|
—
|
—
|
1,091
|
||||||||||||||
|
Ending balance at June 30, 2018
|
$
|
350
|
$
|
5,234
|
$
|
23
|
$
|
825
|
$
|
(32
|
)
|
$
|
—
|
$
|
6,400
|
||||||
|
(1)
|
The valuation of loans held for investment at fair value includes management estimates of the specific credit risk attributes of each loan, in addition to the quoted secondary-market
prices which account for interest rate characteristics.
|
|
(2)
|
Consists of commitments to extend credit on loans to be held for sale.
|
|
(3)
|
Consists of mandatory loan sale commitments.
|
The following fair value hierarchy table presents information about the Corporation’s assets measured at fair value at the dates indicated on a nonrecurring basis:
|
Fair Value Measurement at June 30, 2019 Using:
|
||||||||||||
|
(In Thousands)
|
Level 1
|
Level 2
|
Level 3
|
Total
|
||||||||
|
Non-performing loans
|
$
|
—
|
$
|
3,971
|
$
|
2,247
|
$
|
6,218
|
||||
|
Mortgage servicing assets
|
—
|
—
|
627
|
627
|
||||||||
|
Real estate owned, net
|
—
|
—
|
—
|
—
|
||||||||
|
Total
|
$
|
—
|
$
|
3,971
|
$
|
2,874
|
$
|
6,845
|
||||
|
Fair Value Measurement at June 30, 2018 Using:
|
||||||||||||
|
(In Thousands)
|
Level 1
|
Level 2
|
Level 3
|
Total
|
||||||||
|
Non-performing loans
|
$
|
—
|
$
|
4,845
|
$
|
1,212
|
$
|
6,057
|
||||
|
Mortgage servicing assets
|
—
|
—
|
135
|
135
|
||||||||
|
Real estate owned, net
|
—
|
906
|
—
|
906
|
||||||||
|
Total
|
$
|
—
|
$
|
5,751
|
$
|
1,347
|
$
|
7,098
|
||||
144
Provident Financial Holdings, Inc.
Notes to Consolidated Financial Statements
June 30, 2019
The following table presents additional information about valuation techniques and inputs used for assets and liabilities, including derivative financial instruments, which are
measured at fair value and categorized within Level 3 as of June 30, 2019:
|
(Dollars In Thousands)
|
Fair Value
As of June 30, 2019 |
Valuation
Techniques
|
Unobservable Inputs
|
Range(1)
(Weighted Average)
|
Impact to
Valuation
from an
Increase in
Inputs(2)
|
||
|
Assets:
|
|||||||
|
Securities available-for sale:
Private issue CMO
|
$
|
269
|
Market comparable pricing
|
Comparability adjustment
|
2.5% - 2.9% (2.8%)
|
Increase
|
|
|
Loans held for investment, at fair
value
|
$
|
5,094
|
Relative value analysis
|
Broker quotes
Credit risk factor
|
98.7% - 104.3%
(102.0%) of par
1.2% - 100.0% (4.3%)
|
Increase
Decrease |
|
|
Non-performing loans(3)
|
$
|
693
|
Discounted cash flow
|
Default rates
|
5.0%
|
Decrease
|
|
|
Non-performing loans(4)
|
$
|
1,554
|
Relative value analysis
|
Credit risk factor
|
20.0% - 30.0% (19.9%)
|
Decrease
|
|
|
Mortgage servicing assets
|
$
|
627
|
Discounted cash flow
|
Prepayment speed (CPR)
Discount rate
|
14.6% - 60.0% (23.9%)
9.0% - 10.5% (9.1%) |
Decrease
Decrease |
|
|
Interest-only strips
|
$
|
16
|
Discounted cash flow
|
Prepayment speed (CPR)
Discount rate
|
19.7% - 39.1% (37.7%)
9.0% |
Decrease
Decrease |
|
|
Liabilities:
|
|||||||
|
None
|
|||||||
|
(1)
|
The range is based on the historical estimated fair values and management estimates.
|
|
(2)
|
Unless otherwise noted, this column represents the directional change in the fair value of the Level 3 investments that would result from an increase to the corresponding unobservable
input. A decrease to the unobservable input would have the opposite effect. Significant changes in these inputs in isolation could result in significantly higher or lower fair value measurements.
|
|
(3)
|
Consist of restructured loans.
|
|
(4)
|
Consist of other non-performing loans, excluding restructured loans.
|
The significant unobservable inputs used in the fair value measurement of the Corporation’s assets and liabilities include the following: CMO offered quotes, prepayment speeds, discount rates, TBA
MBS quotes, fallout ratios, investor quotes and roll-forward costs, among others. Significant increases or decreases in any of these inputs in isolation could result in significantly lower or higher fair value measurement. The various unobservable
inputs used to determine valuations may have similar or diverging impacts on valuation.
145
Provident Financial Holdings, Inc.
Notes to Consolidated Financial Statements
June 30, 2019
The carrying amount and fair value of the Corporation’s other financial instruments as of June 30, 2019 and 2018 were as follows:
|
June 30, 2019
|
|||||||||||||||
|
(In Thousands)
|
Carrying
Amount |
Fair
Value |
Level 1 |
Level 2 |
Level 3 |
||||||||||
|
Financial assets:
|
|||||||||||||||
|
Loans held for investment, not recorded at fair
value
|
$
|
874,831
|
$
|
861,374
|
$
|
—
|
$
|
—
|
$
|
861,374
|
|||||
|
Investment securities - held to maturity
|
$
|
94,090
|
$
|
95,359
|
$
|
—
|
$
|
95,359
|
$
|
—
|
|||||
|
FHLB – San Francisco stock
|
$
|
8,199
|
$
|
8,199
|
$
|
—
|
$
|
8,199
|
$
|
—
|
|||||
|
Financial liabilities:
|
|||||||||||||||
|
Deposits
|
$
|
841,271
|
$
|
813,087
|
$
|
—
|
$
|
—
|
$
|
813,087
|
|||||
|
Borrowings
|
$
|
101,107
|
$
|
102,826
|
$
|
—
|
$
|
—
|
$
|
102,826
|
|||||
|
June 30, 2018
|
|||||||||||||||
|
(In Thousands)
|
Carrying
Amount |
Fair
Value |
Level 1 |
Level 2 |
Level 3 |
||||||||||
|
Financial assets:
|
|||||||||||||||
|
Loans held for investment, not recorded at fair
value
|
$
|
897,451
|
$
|
873,112
|
$
|
—
|
$
|
—
|
$
|
873,112
|
|||||
|
Investment securities - held to maturity
|
$
|
87,813
|
$
|
87,239
|
$
|
—
|
$
|
87,239
|
$
|
—
|
|||||
|
FHLB – San Francisco stock
|
$
|
8,199
|
$
|
8,199
|
$
|
—
|
$
|
8,199
|
$
|
—
|
|||||
|
Financial liabilities:
|
|||||||||||||||
|
Deposits
|
$
|
907,598
|
$
|
877,641
|
$
|
—
|
$
|
—
|
$
|
877,641
|
|||||
|
Borrowings
|
$
|
126,163
|
$
|
123,778
|
$
|
—
|
$
|
—
|
$
|
123,778
|
|||||
Investment securities - held to maturity: The investment securities - held to maturity consist of time deposits at CRA qualified minority financial institutions, U.S. SBA securities and U.S.
government sponsored enterprise MBS. Due to the short-term nature of the time deposits, the principal balance approximated fair value (Level 2). For the MBS and the U.S. SBA securities, the Corporation utilizes quoted prices in active markets for
similar securities for its fair value measurement (Level 2).
Loans held for investment, not recorded at fair value: For loans that reprice frequently at market rates, the carrying amount approximates the fair value. For fixed-rate loans, the fair value is
determined by either (i) discounting the estimated future cash flows of such loans over their estimated remaining contractual maturities using a current interest rate at which such loans would be made to borrowers, or (ii) quoted market prices.
FHLB – San Francisco stock: The carrying amount reported for FHLB – San Francisco stock approximates fair value. When redeemed, the Corporation will receive an amount equal to the par value of the
stock.
146
Provident Financial Holdings, Inc.
Notes to Consolidated Financial Statements
June 30, 2019
Deposits: The fair value of time deposits is estimated using a discounted cash flow calculation. The discount rate is based upon rates currently offered for deposits of similar remaining
maturities. The fair value of transaction accounts (checking, money market and savings accounts) is estimated using a discounted cash flow calculation and management estimates of current market conditions.
Borrowings: The fair value of borrowings has been estimated using a discounted cash flow calculation. The discount rate on such borrowings is based upon rates currently offered for borrowings of
similar remaining maturities.
The Corporation has various processes and controls in place to ensure that fair value is reasonably estimated. The Corporation generally determines fair value of their Level 3 assets and
liabilities by using internally developed models which primarily utilize discounted cash flow techniques and prices obtained from independent management services or brokers. The Corporation performs due diligence procedures over third-party pricing
service providers in order to support their use in the valuation process.
While the Corporation believes its valuation methods are appropriate and consistent with other market participants, the use of different methodologies or assumptions to determine the fair value of
certain financial instruments could result in a different estimate of fair value at the reporting date. For the fiscal year ended June 30, 2019, there were no significant changes to the Corporation’s valuation techniques that had, or are expected to
have, a material impact on its consolidated financial position or results of operations.
Note 17: Revenue From Contracts With Customers
In accordance with ASC 606, revenues are recognized when goods or services are transferred to the customer in exchange for the consideration the Corporation expects to be entitled to receive. The
largest portion of the Corporation’s revenue is from interest income, which is not in the scope of ASC 606. All of the Corporation’s revenue from contracts with customers in the scope of ASC 606 is recognized in non-interest income.
If a contract is determined to be within the scope of ASC 606, the Corporation recognizes revenue as it satisfies a performance obligation. Payments from customers are generally collected at the
time services are rendered, monthly, or quarterly. For contracts with customers within the scope of ASC 606, revenue is either earned at a point in time or revenue is earned over time. Examples of revenue earned at a point in time are automated
teller machine ("ATM") transaction fees, wire transfer fees, overdraft fees and interchange fees. Revenue is primarily based on the number and type of transactions that are generally derived from transactional information accumulated by our systems
and is recognized immediately as the transactions occur or upon providing the service to complete the customer's transaction. The Corporation is generally the principal in these contracts, with the exception of interchanges fees, in which case the
Corporation is acting as the agent and records revenue net of expenses paid to the principal. Examples of revenue earned over time, which generally occur on a monthly basis, are deposit account maintenance fees, investment advisory fees, merchant
revenue, trust and investment management fees and safe deposit box fees. Revenue is generally derived from transactional information accumulated by our systems or those of third-parties and is recognized as the related transactions occur or services
are rendered to the customer.
147
Provident Financial Holdings, Inc.
Notes to Consolidated Financial Statements
June 30, 2019
Disaggregation of Revenue:
The following table includes the Corporation's non-interest income disaggregated by type of services for the fiscal years ended June 30, 2019 and 2018:
|
Year Ended June 30,
|
||||||
|
Type of Services
|
2019
|
2018
|
||||
|
(In Thousands)
|
||||||
|
Asset management fees
|
$
|
296
|
$
|
407
|
||
|
Debit card and ATM fees
|
1,725
|
1,635
|
||||
|
Deposit related fees
|
1,978
|
2,169
|
||||
|
Loan related fees
|
35
|
(37
|
)
|
|||
|
BOLI (1)
|
186
|
260
|
||||
|
Loan servicing fees (1)
|
1,051
|
1,575
|
||||
|
Net gain on sale of loans (1)
|
7,135
|
15,802
|
||||
|
Other
|
105
|
84
|
||||
|
Total non-interest income
|
$
|
12,511
|
$
|
21,895
|
||
|
(1)
|
Not in scope of ASC 606.
|
For the fiscal years ended June 30, 2019 and 2018, substantially all of the Corporation's revenues within the scope of ASC 606 are for performance obligations satisfied at a specified date.
Revenues recognized in scope of ASC 606:
Asset management fees: Asset management fees are variable, since they are based on the underlying portfolio value, which is subject to market conditions and
amounts invested by customers through a third-party provider. Asset management fees are recognized over the period that services are provided, and when the portfolio values are known or can be estimated at the end of each month.
Debit card and ATM fees: Debit and ATM interchange income represents fees earned when a debit card issued by the Bank is used. The Bank earns interchange
fees from cardholder transactions through a third party payment network. Interchange fees from cardholder transactions represent a percentage of the underlying transaction value and are recognized daily, concurrently with the transaction processing
services provided to the cardholder. The performance obligation is satisfied and the fees are earned when the cost of the transaction is charged to the cardholders' debit card. Certain expenses directly associated with the debit cards are recorded on
a net basis with the interchange income.
Deposit related fees: Fees are earned on the Bank's deposit accounts for various products offered to or services performed for the Bank's customers. Fees
include business account fees, non-sufficient fund fees, stop payment fees, wire services, safe deposit box and others. These fees are recognized on a daily, monthly or quarterly basis, depending on the type of service.
Loan related fees: Non-interest loan fee income is earned on loans that the Bank services, excluding loan servicing fees which are not within the scope of
ASC 606. Loan related fees include prepayment fees, late charges, brokered loan fees, maintenance fees and others. These fees are recognized on a daily, monthly, quarterly or annual basis, depending on the type of service.
Other: Fees earned on other services, such as merchant services or occasional non-recurring type services, are recognized at the time of the event or the
applicable billing cycle.
148
Provident Financial Holdings, Inc.
Notes to Consolidated Financial Statements
June 30, 2019
Note 18: Reportable Segments
The segment reporting is organized consistent with the Corporation’s executive summary and operating strategy. The business activities of the Corporation consist primarily of the Bank. The Bank’s
operations primarily consist of accepting deposits from customers within the communities surrounding the Bank’s full service offices and investing those funds in single-family, multi-family, commercial real estate, construction, commercial business,
consumer, and other mortgage loans. Management monitors the revenue and expense components of the various products and services the Bank offers, but operations are managed and financial performance is evaluated on a Corporation-wide basis in
comparison to a business plan which is developed each year. Accordingly, all operations are considered by management to be one operating segment and one reportable segment.
The following table illustrates the Corporation’s single operating segment, the Bank, for the fiscal years ended June 30, 2019 and 2018, respectively:
|
Year Ended June 30,
|
|||||||||
|
(In Thousands)
|
2019
|
2018
|
|||||||
|
Net interest income
|
$
|
38,170
|
$
|
36,300
|
|||||
|
Provision (recovery) for loan losses
|
(475
|
)
|
(536
|
)
|
|||||
|
Net interest income, after provision (recovery) for loan losses
|
38,645
|
36,836
|
|||||||
|
Non-interest income:
|
|||||||||
|
Loan servicing and other fees
|
1,051
|
1,575
|
|||||||
|
Gain on sale of loans, net
|
7,135
|
15,802
|
|||||||
|
Deposit account fees
|
1,928
|
2,119
|
|||||||
|
Loss on sale and operations of real estate owned
acquired in the settlement of loans, net |
(4
|
)
|
(86
|
)
|
|||||
|
Card and processing fees
|
1,568
|
1,541
|
|||||||
|
Other
|
833
|
944
|
|||||||
|
Total non-interest income
|
12,511
|
21,895
|
|||||||
|
Non-interest expense:
|
|||||||||
|
Salaries and employee benefits(1)
|
30,149
|
34,821
|
|||||||
|
Premises and occupancy(2)
|
5,038
|
5,134
|
|||||||
|
Operating and administrative expenses(3)
|
10,049
|
13,249
|
|||||||
|
Total non-interest expense
|
45,236
|
53,204
|
|||||||
|
Income (loss) before taxes
|
5,920
|
5,527
|
|||||||
|
Provision (benefit) for income taxes(4)
|
1,503
|
3,396
|
|||||||
|
Net income (loss)
|
$
|
4,417
|
$
|
2,131
|
|||||
|
Total assets, end of period
|
$
|
1,084,850
|
$
|
1,175,549
|
|||||
|
(1)
|
Includes $1.7 million of non-recurring expenses related to scaling back of the origination of saleable single-family mortgage loans for the fiscal year ended June 30,
2019.
|
|
(2)
|
Includes $0.3 million of non-recurring expenses related to scaling back of the origination of saleable single-family mortgage loans for the fiscal year ended June 30,
2019.
|
|
(3)
|
Includes $0.8 million of non-recurring equipment expenses related to scaling back of the origination of saleable single-family mortgage loans for the fiscal year ended
June 30, 2019; and includes $3.4 million of litigation settlement expenses for the fiscal year ended June 30, 2018.
|
|
(4)
|
Includes a net tax charge of $1.8 million resulting from the revaluation of net deferred tax assets consistent with the Tax Act for the fiscal year ended June 30, 2018.
|
149
Provident Financial Holdings, Inc.
Notes to Consolidated Financial Statements
June 30, 2019
Note 19: Holding Company Condensed Financial Information
This information should be read in conjunction with the other notes to the consolidated financial statements. The following is the condensed statements of financial condition for Provident
Financial Holdings (Holding Company only) as of June 30, 2019 and 2018 and condensed statements of operations, comprehensive income and cash flows for the fiscal years ended June 30, 2019 and 2018.
Condensed Statements of Financial Condition
|
June 30,
|
||||||
|
(In Thousands)
|
2019
|
2018
|
||||
|
Assets
|
||||||
|
Cash and cash equivalents
|
$
|
5,421
|
$
|
3,789
|
||
|
Investment in subsidiary
|
115,185
|
116,608
|
||||
|
Other assets
|
131
|
123
|
||||
|
$
|
120,737
|
$
|
120,520
|
|||
|
Liabilities and Stockholders’ Equity
|
||||||
|
Other liabilities
|
$
|
96
|
$
|
63
|
||
|
Stockholders’ equity
|
120,641
|
120,457
|
||||
|
$
|
120,737
|
$
|
120,520
|
|||
Condensed Statements of Operations
|
Year Ended June 30,
|
||||||||||
|
(In Thousands)
|
2019
|
2018
|
||||||||
|
Dividend from the Bank
|
$ |
7,500 |
$ |
5,000 |
||||||
|
Interest and other income
|
17
|
19
|
||||||||
|
Total income
|
7,517
|
5,019
|
||||||||
|
General and administrative expenses
|
1,209
|
1,077
|
||||||||
|
Earnings before income taxes and equity in undistributed earnings of the Bank
|
6,308
|
3,942
|
||||||||
|
Income tax benefit
|
(352
|
)
|
(379
|
)
|
||||||
|
Earnings before equity in undistributed earnings of the Bank
|
6,660
|
4,321
|
||||||||
|
Equity in undistributed earnings of the Bank
|
(2,243
|
)
|
(2,190
|
)
|
||||||
| Net income |
$ |
4,417 |
$ |
2,131 |
||||||
150
Provident Financial Holdings, Inc.
Notes to Consolidated Financial Statements
June 30, 2019
Condensed Statements of Comprehensive Income
|
Year Ended June 30,
|
||||||||
|
(In Thousands)
|
2019
|
2018
|
||||||
|
Net income
|
$
|
4,417
|
$
|
2,131
|
||||
|
Other comprehensive income
|
—
|
—
|
||||||
|
Total comprehensive income
|
$
|
4,417
|
$
|
2,131
|
||||
Condensed Statements of Cash Flows
|
Year Ended June 30,
|
||||||||
|
(In Thousands)
|
2019
|
2018
|
||||||
|
Cash flows from operating activities:
|
||||||||
|
Net income
|
$
|
4,417
|
$
|
2,131
|
||||
|
Adjustments to reconcile net income to net cash
provided by operating activities:
|
||||||||
|
Equity in undistributed earnings of the Bank
|
2,243
|
2,190
|
||||||
|
(Increase) decrease in other assets
|
(8
|
)
|
18
|
|||||
|
Increase in other liabilities
|
33
|
10
|
||||||
|
Net cash provided by operating activities
|
6,685
|
4,349
|
||||||
|
Cash flow from financing activities:
|
||||||||
|
Exercise of stock options
|
553
|
677
|
||||||
|
Treasury stock purchases
|
(1,412
|
)
|
(7,347
|
)
|
||||
|
Cash dividends
|
(4,194
|
)
|
(4,228
|
)
|
||||
|
Net cash used for financing activities
|
(5,053
|
)
|
(10,898
|
)
|
||||
|
Net increase (decrease) in cash and cash equivalents
|
1,632
|
(6,549
|
)
|
|||||
|
Cash and cash equivalents at beginning of year
|
3,789
|
10,338
|
||||||
|
Cash and cash equivalents at end of year
|
$
|
5,421
|
$
|
3,789
|
||||
151
Provident Financial Holdings, Inc.
Notes to Consolidated Financial Statements
June 30, 2019
Note 20: Reclassification Adjustment of Accumulated Other Comprehensive Income ("AOCI")
The following table provides the changes in AOCI by component for the fiscal years ended June 30, 2019 and 2018:
|
Unrealized Gains and Losses on
|
|||||||||
|
(Dollars In Thousands, Net of Statutory Taxes)
|
Investment Securities
Available for Sale
|
Interest-Only
Strips
|
Total
|
||||||
|
Beginning balance at June 30, 2017
|
$
|
211
|
$
|
18
|
$
|
229
|
|||
|
Other comprehensive loss before reclassifications
|
(55
|
)
|
(5
|
)
|
(60
|
)
|
|||
|
Amount reclassified from accumulated other comprehensive
income
|
38
|
3
|
41
|
||||||
|
Net other comprehensive loss
|
(17
|
)
|
(2
|
)
|
(19
|
)
|
|||
|
Ending balance at June 30, 2018
|
194
|
16
|
210
|
||||||
|
Other comprehensive loss before reclassifications
|
(44
|
)
|
(5
|
)
|
(49
|
)
|
|||
|
Amount reclassified from accumulated other comprehensive
income
|
—
|
—
|
—
|
||||||
|
Net other comprehensive loss
|
(44
|
)
|
(5
|
)
|
(49
|
)
|
|||
|
Ending balance at June 30, 2019
|
$
|
150
|
$
|
11
|
$
|
161
|
|||
Note 21: Offsetting Derivative and Other Financial Instruments
The Corporation’s derivative transactions are generally governed by International Swaps and Derivatives Association Master Agreements and similar arrangements, which include provisions governing
the offset of assets and liabilities between the parties. When the Corporation has more than one outstanding derivative transaction with a single counterparty, the offset provisions contained within these agreements generally allow the
non-defaulting party the right to reduce its liability to the defaulting party by amounts eligible for offset, including the collateral received as well as eligible offsetting transactions with that counterparty, irrespective of the currency, place
of payment, or booking office. The Corporation’s policy is to present its derivative assets and derivative liabilities on the Consolidated Statements of Financial Condition on a net basis for each type of derivative. The derivative assets and
liabilities are comprised of mandatory loan sale commitments, TBA MBS trades and option contracts.
152
Provident Financial Holdings, Inc.
Notes to Consolidated Financial Statements
June 30, 2019
The following tables present the gross and net amounts of derivative assets and liabilities and other financial instruments as reported in the Corporation’s Consolidated Statements of Financial
Condition, and the gross amount not offset in the Corporation’s Consolidated Statements of Financial Condition as of the dates indicated.
As of June 30, 2019:
|
Net
|
||||||||||||||||||
|
Gross
|
Amount
|
|||||||||||||||||
|
Amount
|
of Assets
|
Gross Amount Not
|
||||||||||||||||
|
Offset in the
|
Presented in
|
Offset in the Consolidated
|
||||||||||||||||
|
Gross
|
Consolidated
|
the Consolidated
|
Statements of Financial Condition
|
|||||||||||||||
|
Amount of
|
Statements
|
Statements
|
Cash
|
|||||||||||||||
|
Recognized
|
of Financial
|
of Financial
|
Financial
|
Collateral
|
Net
|
|||||||||||||
|
(In Thousands)
|
Assets
|
Condition
|
Condition
|
Instruments
|
Received
|
Amount
|
||||||||||||
|
Assets
|
||||||||||||||||||
|
Derivatives
|
$
|
—
|
$
|
—
|
$
|
—
|
$
|
—
|
$
|
—
|
$
|
—
|
||||||
|
Total
|
$
|
—
|
$
|
—
|
$
|
—
|
$
|
—
|
$
|
—
|
$
|
—
|
||||||
|
Net
|
||||||||||||||||||
|
Gross
|
Amount
|
|||||||||||||||||
|
Amount
|
of Liabilities
|
Gross Amount Not
|
||||||||||||||||
|
Offset in the
|
Presented in
|
Offset in the Consolidated
|
||||||||||||||||
|
Gross
|
Consolidated
|
the Consolidated
|
Statements of Financial Condition
|
|||||||||||||||
|
Amount of
|
Statements
|
Statements
|
Cash
|
|||||||||||||||
|
Recognized
|
of Financial
|
of Financial
|
Financial
|
Collateral
|
Net
|
|||||||||||||
|
(In Thousands)
|
Liabilities
|
Condition
|
Condition
|
Instruments
|
Pledged
|
Amount
|
||||||||||||
|
Liabilities
|
||||||||||||||||||
|
Derivatives
|
$
|
—
|
$
|
—
|
$
|
—
|
$
|
—
|
$
|
—
|
$
|
—
|
||||||
|
Total
|
$
|
—
|
$
|
—
|
$
|
—
|
$
|
—
|
$
|
—
|
$
|
—
|
||||||
153
Provident Financial Holdings, Inc.
Notes to Consolidated Financial Statements
June 30, 2019
As of June 30, 2018:
|
Net
|
||||||||||||||||||
|
Gross
|
Amount
|
|||||||||||||||||
|
Amount
|
of Assets
|
Gross Amount Not
|
||||||||||||||||
|
Offset in the
|
Presented in
|
Offset in the Consolidated
|
||||||||||||||||
|
Gross
|
Consolidated
|
the Consolidated
|
Statements of Financial Condition
|
|||||||||||||||
|
Amount of
|
Statements
|
Statements
|
Cash
|
|||||||||||||||
|
Recognized
|
of Financial
|
of Financial
|
Financial
|
Collateral
|
Net
|
|||||||||||||
|
(In Thousands)
|
Assets
|
Condition
|
Condition
|
Instruments
|
Received
|
Amount
|
||||||||||||
|
Assets
|
||||||||||||||||||
|
Derivatives
|
$
|
—
|
$
|
—
|
$
|
—
|
$
|
—
|
$
|
—
|
$
|
—
|
||||||
|
Total
|
$
|
—
|
$
|
—
|
$
|
—
|
$
|
—
|
$
|
—
|
$
|
—
|
||||||
|
Net
|
||||||||||||||||||
|
Gross
|
Amount
|
|||||||||||||||||
|
Amount
|
of Liabilities
|
Gross Amount Not
|
||||||||||||||||
|
Offset in the
|
Presented in
|
Offset in the Consolidated
|
||||||||||||||||
|
Gross
|
Consolidated
|
the Consolidated
|
Statements of Financial Condition
|
|||||||||||||||
|
Amount of
|
Statements
|
Statements
|
Cash
|
|||||||||||||||
|
Recognized
|
of Financial
|
of Financial
|
Financial
|
Collateral
|
Net
|
|||||||||||||
|
(In Thousands)
|
Liabilities
|
Condition
|
Condition
|
Instruments
|
Pledged
|
Amount
|
||||||||||||
|
Liabilities
|
||||||||||||||||||
|
Derivatives
|
$
|
440
|
$
|
—
|
$
|
440
|
$
|
—
|
$
|
—
|
$
|
440
|
||||||
|
Total
|
$
|
440
|
$
|
—
|
$
|
440
|
$
|
—
|
$
|
—
|
$
|
440
|
||||||
Note 22: Subsequent Event
On July 30, 2019, the Corporation announced that the Corporation’s Board of Directors declared a quarterly cash dividend of $0.14 per share. Shareholders of the Corporation’s common stock at the
close of business on August 20, 2019 are entitled to receive the cash dividend, that is payable on September 10, 2019.
154
Provident Financial Holdings, Inc.
Notes to Consolidated Financial Statements
June 30, 2019
Exhibit Index
| 4.2
|
Description of Capital
Stock of Provident Financial Holdings, Inc. |
|
101
|
The following materials from the Corporation’s Annual Report on Form 10-K for the fiscal year ended June 30, 2019, formatted in Extensible Business Reporting Language (XBRL): (1)
Consolidated Statements of Financial Condition; (2) Consolidated Statements of Operations; (3) Consolidated Statements of Comprehensive Income; (4) Consolidated Statements of Stockholders’ Equity; (5) Consolidated Statements of Cash Flows;
and (6) Notes to Consolidated Financial Statements.
|
155