Exhibit 99.1
 |
 |
|
3756 Central Avenue
Riverside, CA 92506
(951) 686-6060
|
PROVIDENT FINANCIAL HOLDINGS REPORTS
SECOND QUARTER FISCAL 2012 EARNINGS
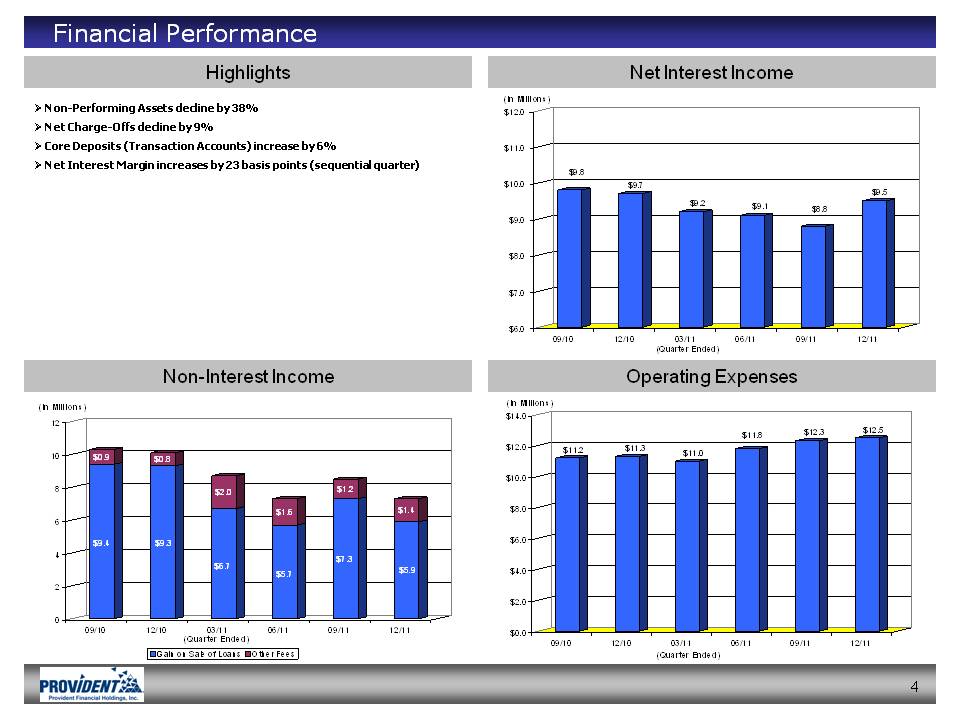
Net Interest Margin Increases by 23 Basis Points (Sequential Quarter)
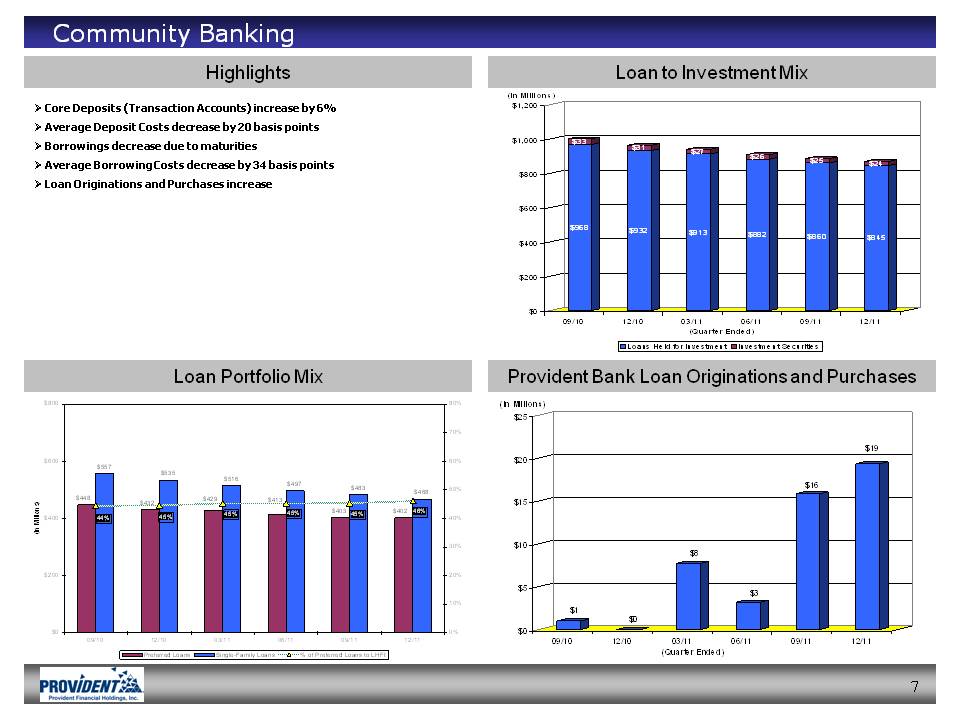
Core Deposits (Transaction Accounts) Increase by 6%
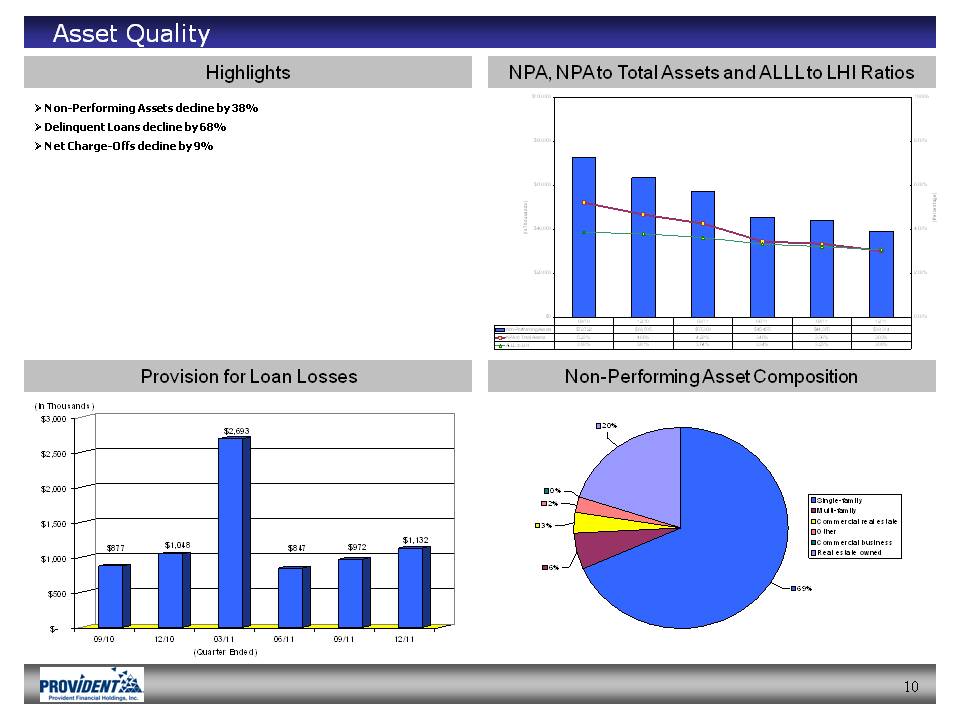
Non-Performing Assets Decline by 38%
Net Charge-Offs Decline by 9%
Repurchased 263,503 Shares of Common Stock at an Average Cost of $9.27 Per Share
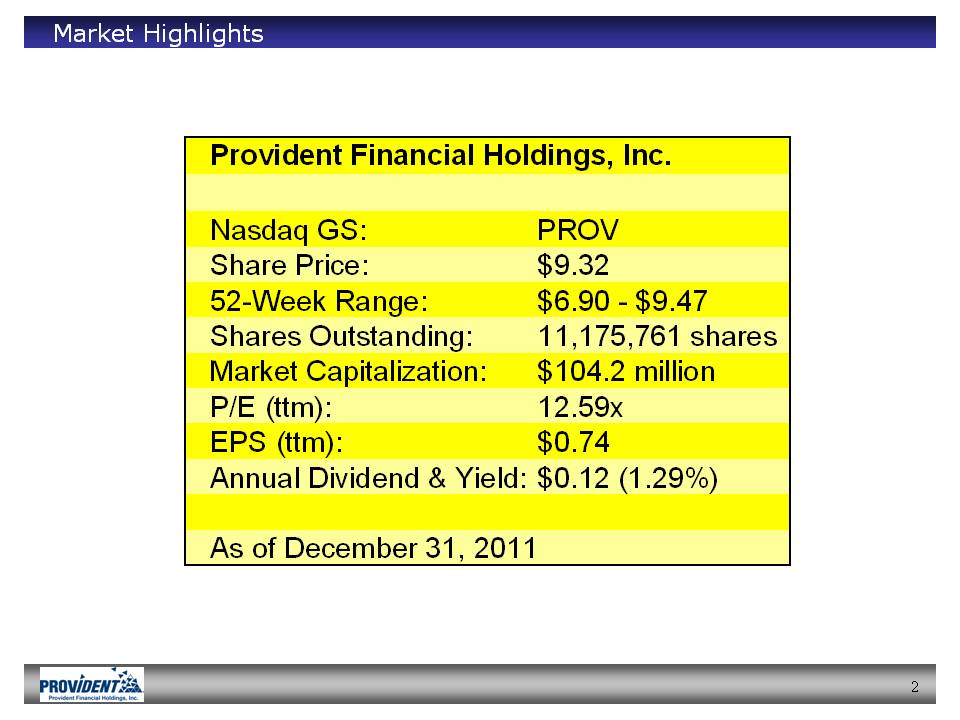
Riverside, Calif. – January 31, 2012 – Provident Financial Holdings, Inc. (“Company”), NASDAQ GS: PROV, the holding company for Provident Savings Bank, F.S.B. (“Bank”), today announced second quarter earnings for the fiscal year ending June 30, 2012.
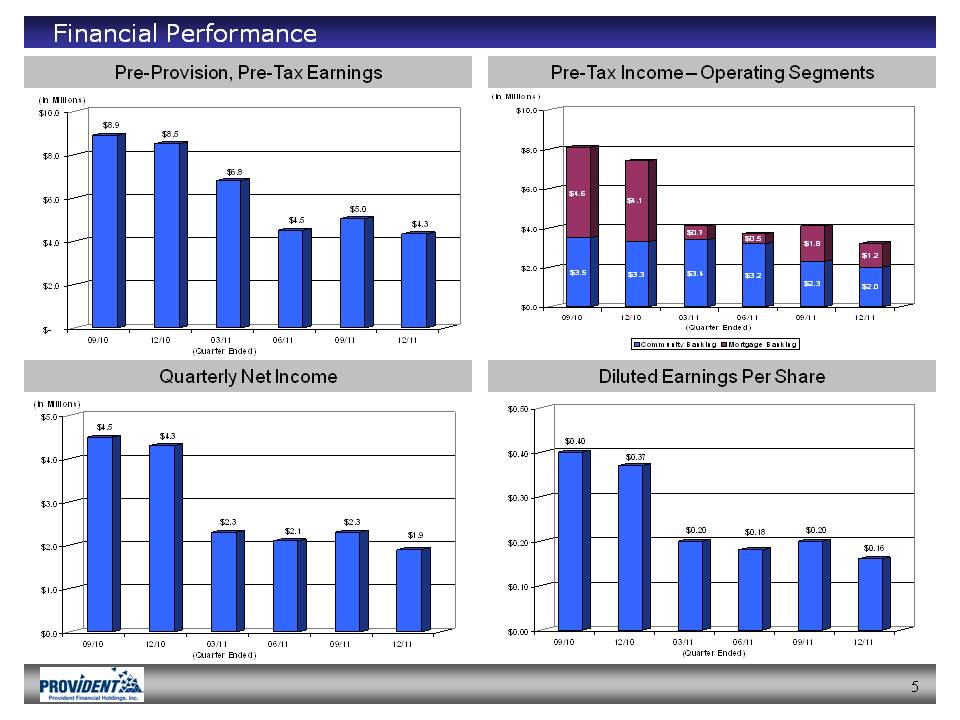
For the quarter ended December 31, 2011, the Company reported net income of $1.85 million, or $0.16 per diluted share (on 11.38 million average shares outstanding), compared to net income of $4.26 million, or $0.37 per diluted share (on 11.39 million average shares outstanding), in the comparable period a year ago. The decrease in net income for the second quarter of fiscal 2012 was primarily attributable to a decrease in net interest income (before provision for loan losses), a decrease in the gain on sale of loans and an increase in compensation expenses, partly offset by an improvement in real estate owned operations and a lower FDIC insurance premium as compared to the same period last year.
Page 1 of 22
|
|
“Although net income is down from last year, our Company is in a better position today than at any time over the prior three years. Capital levels are strong, asset quality continues to improve, core deposits are increasing and we are well-positioned for growth,” said Craig G. Blunden, Chairman and Chief Executive Officer of the Company. “We remain optimistic regarding our mortgage banking business and believe near-term fundamentals will result in favorable earnings momentum for the foreseeable future.”
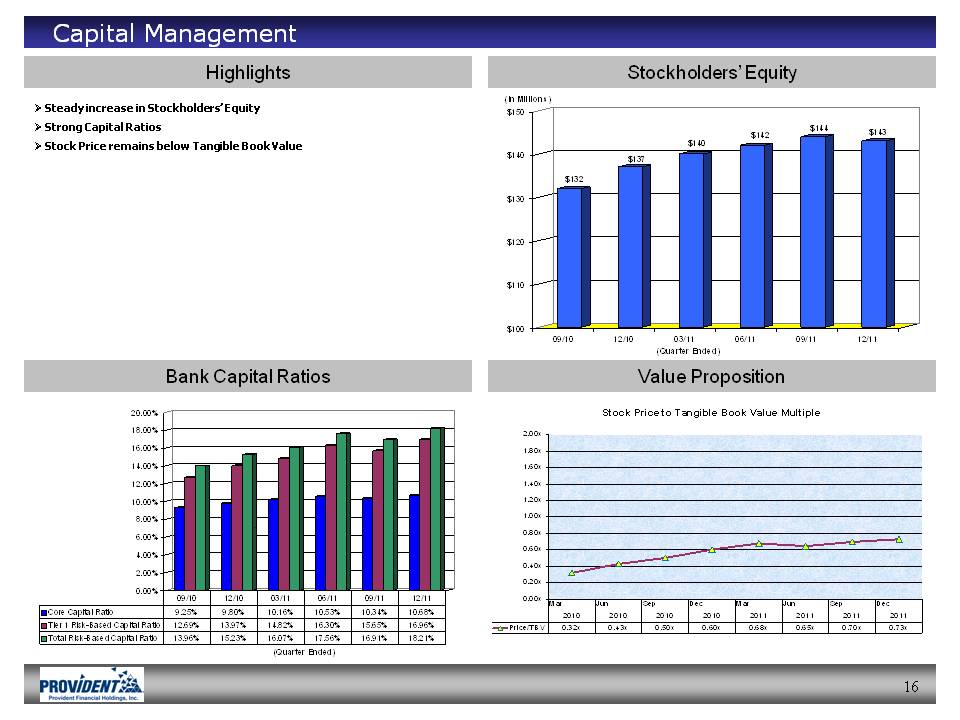
As of December 31, 2011, the Bank exceeded all regulatory capital requirements with Tangible Capital, Core Capital, Total Risk-Based Capital and Tier 1 Risk-Based Capital ratios of 10.68 percent, 10.68 percent, 18.21 percent and 16.96 percent, respectively. As of June 30, 2011, these ratios were 10.53 percent, 10.53 percent, 17.56 percent and 16.30 percent, respectively. For each of these periods, the Bank’s capital ratios exceeded the minimum required ratios to be deemed “well-capitalized” (5.00 percent for Core Capital, 10.00 percent for Total Risk-Based Capital and 6.00 percent for Tier 1 Risk-Based Capital).
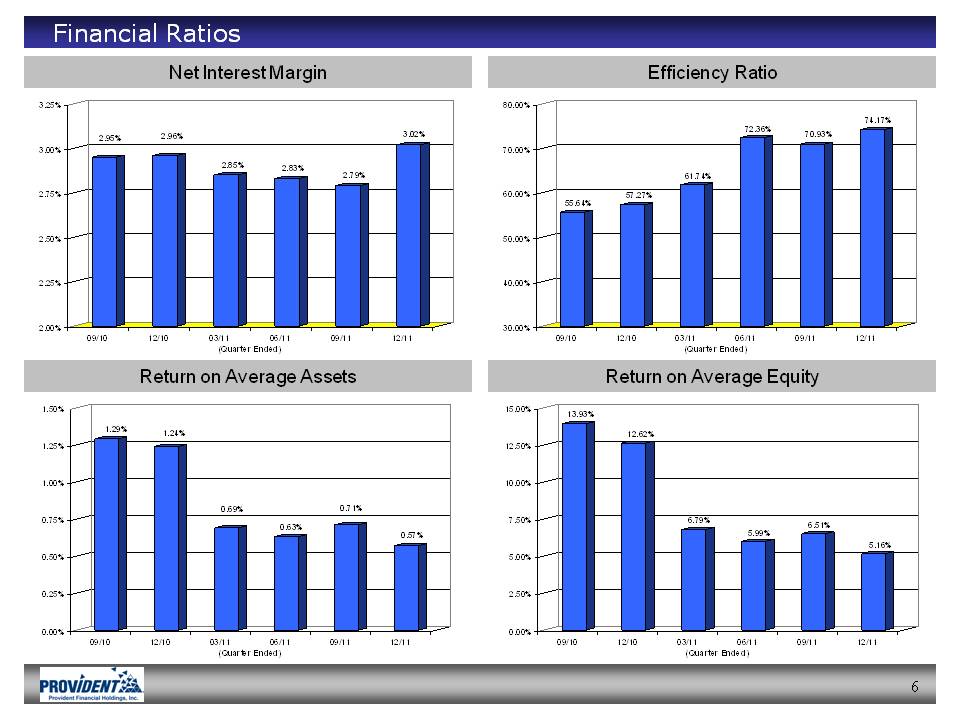
Return on average assets for the second quarter of fiscal 2012 decreased to 0.57 percent from 1.24 percent for the same period of fiscal 2011. Return on average stockholders’ equity for the second quarter of fiscal 2012 also decreased to 5.16 percent from 12.62 percent for the comparable period of fiscal 2011.
On a sequential quarter basis, the second quarter net income of fiscal 2012 reflects a 20 percent decrease from net income of $2.32 million in the first quarter of fiscal 2012. The decrease in net income in the second quarter of fiscal 2012 was primarily attributable to a decrease in the gain on sale of loans, partly offset by an increase in net interest income (before provision for loan losses) and a decrease in compensation expenses and a
Page 2 of 22
|
|
decrease in FDIC insurance premiums, as compared to the first quarter of fiscal 2012. Diluted earnings per share for the second quarter of fiscal 2012 decreased to $0.16 per share from $0.20 per share in the first quarter of fiscal 2012. Return on average assets decreased to 0.57 percent for the second quarter of fiscal 2012 from 0.71 percent in the first quarter of fiscal 2012; and return on average stockholders’ equity for the second quarter of fiscal 2012 was 5.16 percent, compared to 6.51 percent for the first quarter of fiscal 2012.
For the six months ended December 31, 2011, net income decreased to $4.17 million from $8.78 million in the comparable period ended December 31, 2010; and diluted earnings per share for the six months ended December 31, 2011 decreased to $0.36 from $0.77 for the comparable six-month period last year. The return on average assets for the six months ended December 31, 2011 decreased to 0.64 percent from 1.27 percent for the comparable six-month period a year earlier. The return on average stockholders’ equity for the six months ended December 31, 2011 decreased to 5.83 percent from 13.26 percent for the comparable six-month period a year earlier.
Net interest income before the provision for loan losses decreased $202,000, or two percent, to $9.51 million in the second quarter of fiscal 2012 from $9.71 million for the same quarter in fiscal 2011, due to a decrease of $51.4 million, or four percent, in average earning assets. Non-interest income decreased $2.79 million, or 28 percent, to $7.31 million in the second quarter of fiscal 2012 from $10.10 million in the same quarter of fiscal 2011. Non-interest expenses increased $1.13 million, or 10 percent, to $12.47 million in the second quarter of fiscal 2012 from $11.34 million in the same quarter in
Page 3 of 22
|
|
fiscal 2011. The decrease in non-interest income and the increase in the non-interest expense relate primarily to mortgage banking operations.
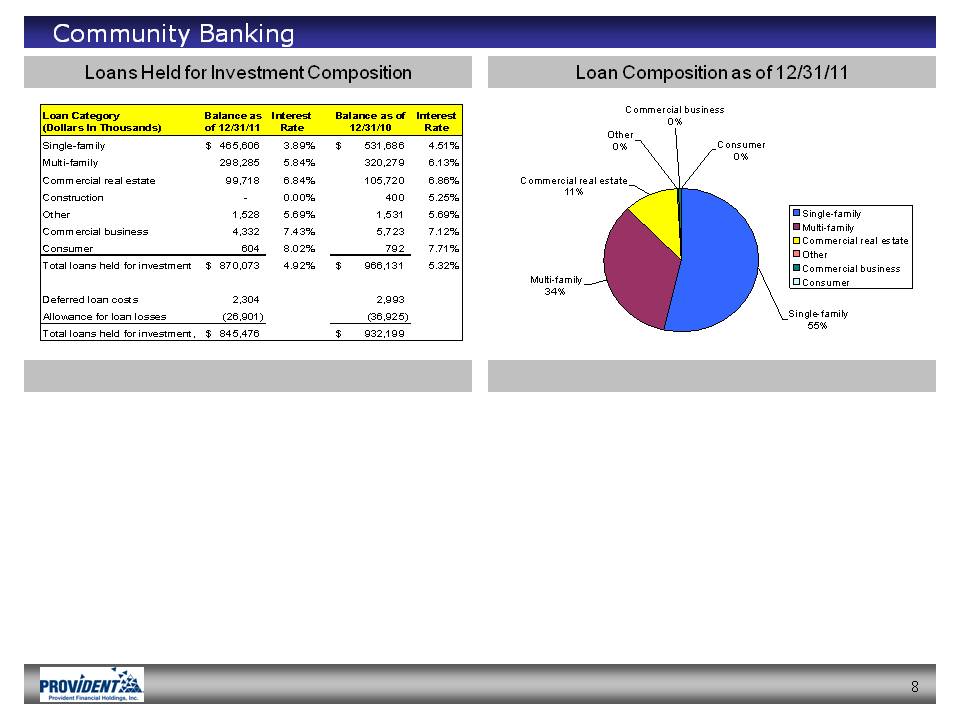
The average balance of loans outstanding, including loans held for sale, increased by $7.4 million, or one percent, to $1.15 billion in the second quarter of fiscal 2012 as compared to the same quarter of fiscal 2011. The increase in the average loan balance was due to the increase in the average balance of loans held for sale. The average yield on loans receivable decreased by 60 basis points to 4.60 percent in the second quarter of fiscal 2012 from an average yield of 5.20 percent in the same quarter of fiscal 2011. The decrease in the average loan yield was primarily attributable to payoffs of loans which had a higher yield than the average yield of loans held for investment, adjustable rate loans repricing to lower current market interest rates and the higher average balance of loans held for sale with a lower average yield. The average balance of loans held for sale in the second quarter of fiscal 2012 was $302.6 million as compared to $192.8 million in the same quarter last year; and the average yield was 3.81% and 4.07%, respectively. Loans originated and purchased for investment in the second quarter of fiscal 2012 totaled $20.3 million, consisting primarily of multi-family and commercial real estate loans. The outstanding balance of “preferred loans” (multi-family, commercial real estate, construction and commercial business loans) decreased by $29.8 million, or seven percent, to $402.3 million at December 31, 2011 from $432.1 million at December 31, 2010. There were no construction loans outstanding at December 31, 2011, compared to $400,000 outstanding at December 31, 2010. The percentage of preferred loans to total loans held for investment at December 31, 2011 increased slightly to 46 percent from 45 percent at December 31, 2010. Loan principal payments received in the second quarter
Page 4 of 22
|
|
of fiscal 2012 were $32.9 million, compared to $28.9 million in the same quarter of fiscal 2011. In addition, real estate acquired in the settlement of loans (real estate owned) in the second quarter of fiscal 2012 declined to $6.4 million, compared to $10.6 million in the same quarter of fiscal 2011.
The average balance of investment securities decreased by $7.6 million, or 24 percent, to $24.7 million in the second quarter of fiscal 2012 from $32.3 million in the same quarter of fiscal 2011. The decrease was attributable primarily to $3.3 million of agency debt securities, which were called by the issuer in the third quarter of fiscal 2011, and $3.8 million of principal payments received on mortgage-backed securities during the last 12 months. The average yield on investment securities decreased 52 basis points to 2.17 percent in the second quarter of fiscal 2012 from 2.69 percent in the same quarter of fiscal 2011. The decline in average yield was primarily attributable to the downward repricing of adjustable rate mortgage-backed securities.
In October 2011, the Federal Home Loan Bank (“FHLB”) – San Francisco announced a partial redemption of excess capital stock held by member banks and a cash dividend. As a result, a total of $1.2 million of excess capital stock was redeemed and a $20,000 cash dividend was received by the Bank in the second quarter of fiscal 2012. This compares to the same quarter last year when the Bank received a $1.2 million stock redemption and a $30,000 cash dividend.
The average balance of the Company’s interest-earning deposits, primarily cash with the Federal Reserve Bank of San Francisco, decreased to $57.2 million in the second quarter of fiscal 2012 from $103.6 million in the same quarter of fiscal 2011. The Bank maintains high levels of cash and cash equivalents in response to the uncertain operating
Page 5 of 22
|
|
environment and to fund its mortgage banking operations. The decrease in the average balance was due primarily to the utilization of the funds for a higher average balance of loans held for sale. The average yield earned on interest-earning deposits was 0.25% in the second quarter of fiscal 2012, much lower than the yield that could have been earned if the excess liquidity was deployed in loans or investment securities.
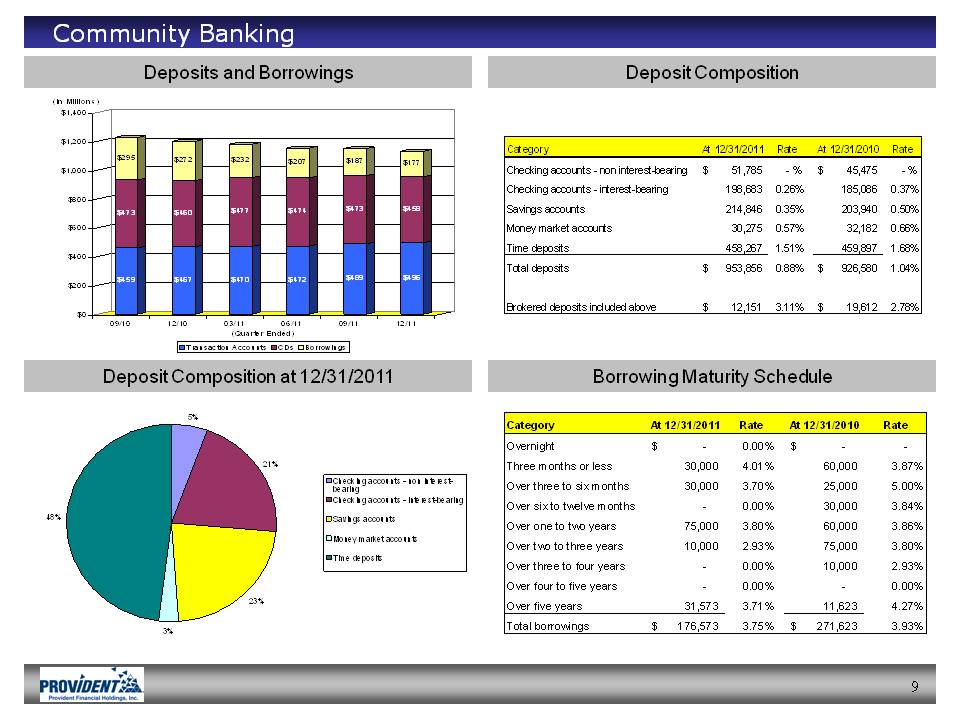
Average deposits increased $22.1 million, or two percent, to $955.1 million in the second quarter of fiscal 2012 from $933.0 million in the same quarter of fiscal 2011. The average cost of deposits decreased by 20 basis points to 0.91 percent in the second quarter of fiscal 2012 from 1.11 percent in the same quarter last year, primarily due to higher costing time deposits repricing to lower current market interest rates and a reduction in rates paid on transaction account balances (“core deposits”). Core deposits increased by $28.9 million, or six percent, to $495.6 million at December 31, 2011 from $466.7 million at December 31, 2010, consistent with the Bank’s strategy to decrease the percentage of time deposits in its deposit base and to increase the percentage of lower cost checking and savings accounts. Time deposits decreased slightly to $458.3 million at December 31, 2011 compared to $459.9 million at December 31, 2010. As of December 31, 2011, the remaining outstanding balance of brokered deposits was $12.2 million, compared to $19.6 million as of December 31, 2010.
The average balance of borrowings, which consisted of FHLB – San Francisco advances, decreased $93.7 million, or 34 percent, to $185.7 million in the second quarter of fiscal 2012 and the average cost of advances decreased 34 basis points to 3.75 percent in the second quarter of fiscal 2012, compared to an average balance of $279.4 million
Page 6 of 22
|
|
and an average cost of 4.09 percent in the same quarter of fiscal 2011. The decrease in borrowings was primarily attributable to scheduled maturities.
The net interest margin during the second quarter of fiscal 2012 increased six basis points to 3.02 percent from 2.96 percent in the same quarter last year. The increase was primarily due to the decline in the average cost of liabilities outpacing the declining yield of interest-earning assets. The declining yield of interest-earning assets was attributable to the downward repricing of loans and investment securities, partly offset by a higher average balance of loans receivable and a lower level of excess liquidity invested at a nominal yield. The decline in the average cost of liabilities was primarily due to the downward repricing of deposits to current market interest rates and a decline in the average cost of borrowings attributable primarily to the scheduled maturities during the period.
During the second quarter of fiscal 2012, the Company recorded a provision for loan losses of $1.13 million, compared to the $1.05 million provision for loan losses during the same period of fiscal 2011 and the $972,000 provision recorded in the first quarter of fiscal 2012 (sequential quarter).
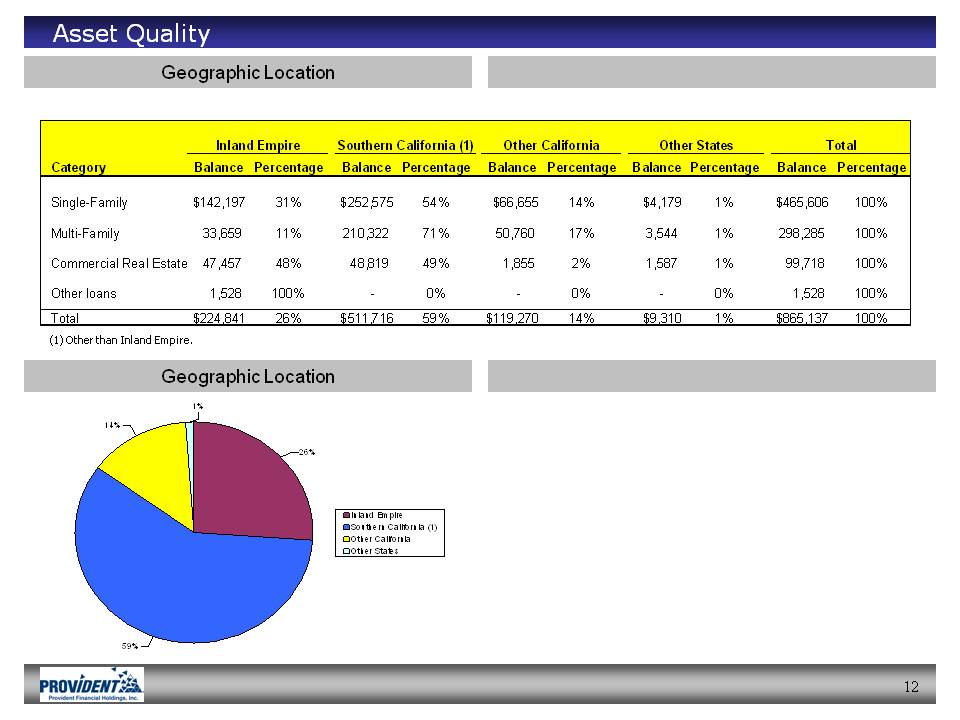
Non-performing assets, with underlying collateral primarily located in Southern California, decreased to $39.3 million, or 3.03 percent of total assets, at December 31, 2011, compared to $63.5 million, or 4.68 percent of total assets, at December 31, 2010 and $45.5 million, or 3.46 percent of total assets, at June 30, 2011. Non-performing loans at December 31, 2011 were primarily comprised of 89 single-family loans ($26.9 million); three commercial real estate loans ($1.3 million); three multi-family loans ($2.3 million); one other mortgage loan ($972,000); and four commercial business loans that
Page 7 of 22
|
|
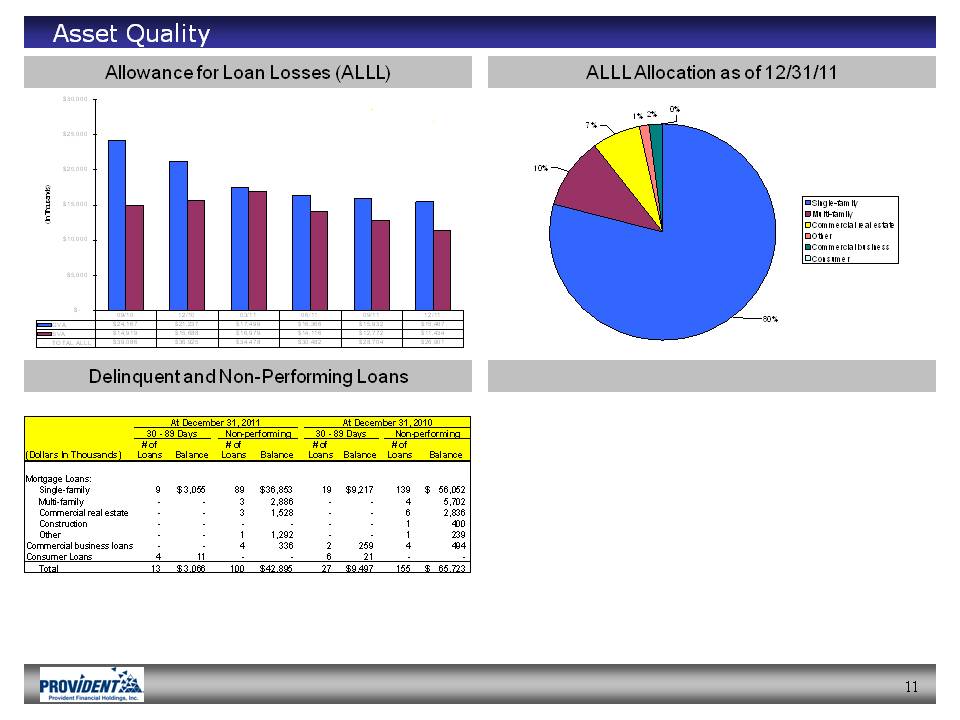
were fully reserved. Real estate owned acquired in the settlement of loans at December 31, 2011 was comprised of 27 single-family properties ($6.4 million), one multi-family property ($1.0 million), one partially constructed commercial real estate property ($26,000), one developed lot ($399,000) and two undeveloped lots ($9,000). Net charge-offs for the quarter ended December 31, 2011 were $2.94 million or 1.02 percent (annualized) of average loans receivable, compared to $3.21 million or 1.12 percent (annualized) of average loans receivable for the quarter ended December 31, 2010 and $2.75 million or 1.04 percent (annualized) of average loans receivable for the quarter ended September 30, 2011 (sequential quarter).
Classified assets at December 31, 2011 were $65.8 million, comprised of $16.9 million in the special mention category, $41.1 million in the substandard category and $7.8 million in real estate owned. Classified assets at June 30, 2011 were $66.6 million, comprised of $12.9 million in the special mention category, $45.4 million in the substandard category and $8.3 million in real estate owned.
For the quarter ended December 31, 2011, four loans for $1.0 million were re-underwritten and modified from their original terms, and were identified as restructured loans. This compares to the same quarter last year when the Bank modified 15 loans for $7.2 million. As of December 31, 2011, the outstanding balance of restructured loans was $30.5 million: 18 loans are classified as pass, are not included in the classified asset totals described earlier and remain on accrual status ($7.5 million); nine loans are classified as special mention and remain on accrual status ($6.3 million); and 45 loans are classified as substandard ($16.7 million total, with 38 of the 45 loans or $13.2 million on
Page 8 of 22
|
|
non-accrual status). As of December 31, 2011, $22.3 million, or 73 percent, of the restructured loans are current with respect to their payment status.
The allowance for loan losses was $26.9 million at December 31, 2011, or 3.08 percent of gross loans held for investment, compared to $30.5 million at June 30, 2011, or 3.34 percent of gross loans held for investment. The allowance for loan losses at December 31, 2011 includes $11.4 million of specific loan loss reserves and $15.5 million of general loan loss reserves, compared to $14.1 million of specific loan loss reserves and $16.4 million of general loan loss reserves at June 30, 2011. Management believes that, based on currently available information, the allowance for loan losses is sufficient to absorb potential losses inherent in loans held for investment as of December 31, 2011.
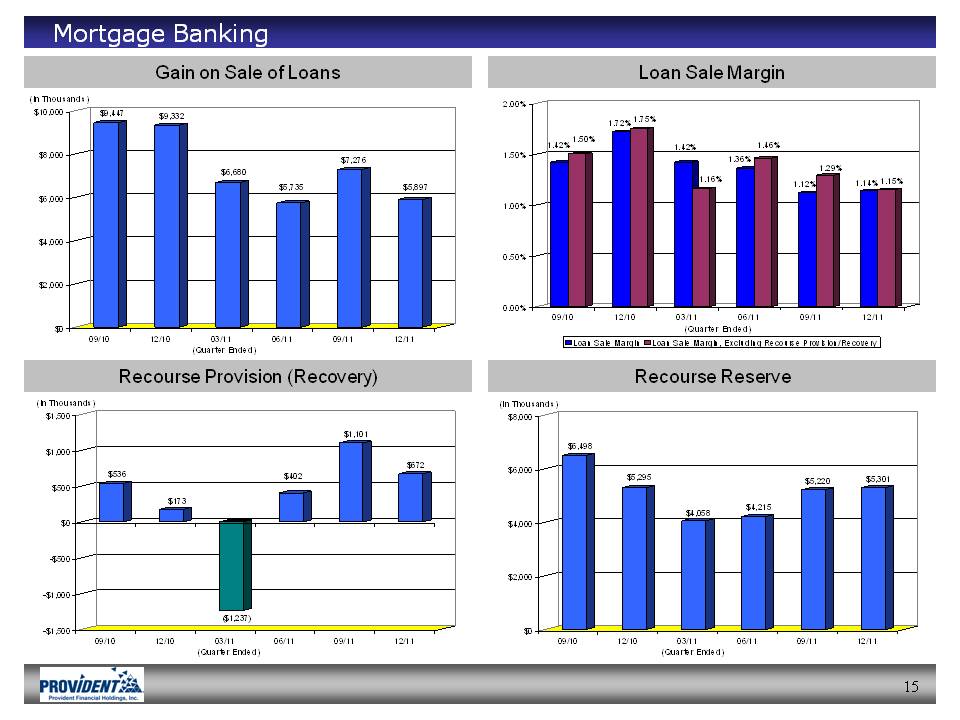
Non-interest income decreased to $7.31 million in the second quarter of fiscal 2012 compared to $10.10 million in the same period of fiscal 2011, primarily the result of a $3.43 million decrease in the gain on sale of loans, partly offset by an improvement in real estate owned operations to a net gain of $77,000 in comparison to a net loss of $(690,000) in the comparable prior period. On a sequential quarter basis, non-interest income decreased $1.24 million, primarily the result of a $1.38 million decrease in the gain on sale of loans.
The gain on sale of loans decreased to $5.90 million for the quarter ended December 31, 2011 from $9.33 million in the comparable quarter last year, reflecting the net impact of a lower average loan sale margin and a lower loan sale volume. The average loan sale margin for mortgage banking was 114 basis points for the quarter ended December 31, 2011, compared to 172 basis points in the comparable quarter last year.
Page 9 of 22
|
|
The gain on sale of loans includes an unfavorable fair-value adjustment on loans held for sale and derivative financial instruments (commitments to extend credit, commitments to sell loans, commitments to sell mortgage-backed securities, and option contracts) that amounted to a net loss of $(4.72) million in the second quarter of fiscal 2012, as compared to an unfavorable fair-value adjustment that amounted to a net loss of $(7.04) million in the same period last year. The gain on sale of loans for the second quarter of fiscal 2012 includes a $672,000 recourse provision for loans sold that are subject to repurchase, compared to a $173,000 recourse provision in the comparable quarter last year. As of December 31, 2011, the recourse reserve for loans sold that are subject to repurchase was $5.3 million, unchanged from the level at December 31, 2010 and somewhat higher as compared to $4.2 million at June 30, 2011.
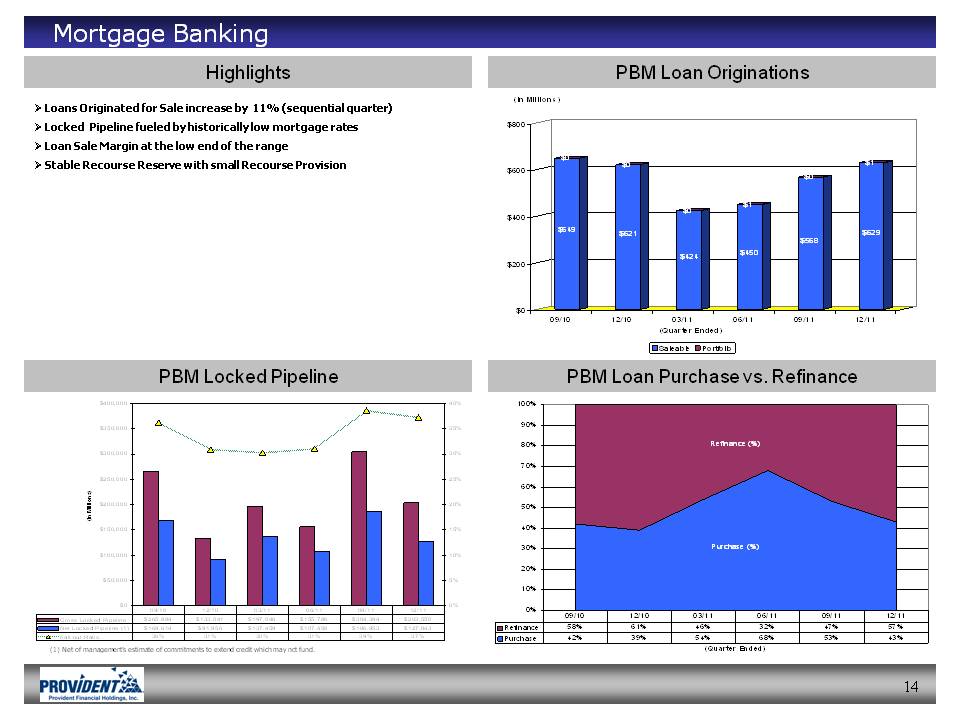
In the second quarter of fiscal 2012, a total of $628.9 million of loans were originated and purchased for sale, a slight increase from $620.5 million for the same period last year, and 11 percent higher than the $568.1 million in the first quarter of fiscal 2012 (sequential quarter). The loan origination volume remains favorable from a historical perspective as a result of continued liquidity in the secondary mortgage markets particularly in FHA/VA, Fannie Mae and Freddie Mac loan products and relatively low mortgage interest rates. Total loans sold during the quarter ended December 31, 2011 were $674.3 million, a slight decrease from $689.7 million during the same quarter last year, but 39 percent higher than the $485.7 million sold during the first quarter of fiscal 2012 (sequential quarter). Total loan originations (including loans originated and purchased for investment and loans originated and purchased for sale) were $649.3 million in the second quarter of fiscal 2012, an increase of five percent from $620.6
Page 10 of 22
|
|
million in the same quarter of fiscal 2011, and 11 percent higher than the $583.9 million in the first quarter of fiscal 2012 (sequential quarter).
The sale and operations of real estate owned acquired in the settlement of loans resulted in a net gain of $77,000 in the second quarter of fiscal 2012, as compared to a net loss of $(690,000) in the comparable period last year. Forty real estate owned properties, including 23 undeveloped lots in Coachella, California, were sold in the quarter ended December 31, 2011 compared to 35 real estate owned properties sold in the same quarter last year. Twenty real estate owned properties were acquired in the settlement of loans during the second quarter of fiscal 2012, compared to 29 real estate owned properties acquired in the settlement of loans in the comparable period last year. As of December 31, 2011, the real estate owned balance was $7.8 million (32 properties), compared to $13.5 million (78 properties) at December 31, 2010 and $8.3 million (54 properties) at June 30, 2011.
Non-interest expenses increased to $12.47 million in the second quarter of fiscal 2012 from $11.34 million in the same quarter last year, primarily as a result of an increase in compensation, premises and equipment and other operating expenses, partly offset by lower deposit insurance premiums resulting from an improvement in the Bank’s risk category rating, the change in methodology of calculating the premium and a subsequent accrual adjustment. The increase in compensation and other operating expenses was due primarily to mortgage banking loan production; and the increase in premises and equipment was due primarily to increases in routine maintenance costs and office lease expenses.
Page 11 of 22
|
|
The Company’s efficiency ratio increased to 74 percent in the second quarter of fiscal 2012 from 57 percent in the second quarter of fiscal 2011. The increase was the result of an increase in non-interest expense, and decreases in both net interest income and non-interest income.
The Company’s tax provision was $1.36 million for the second quarter of fiscal 2012, down $1.80 million from $3.16 million in the same quarter last year. The effective income tax rate for the quarter ended December 31, 2011 was 42.3 percent as compared to 42.6 percent in the same quarter last year. The Company believes that the tax provision recorded in the second quarter of fiscal 2012 reflects its current income tax obligations.
The Company repurchased 263,503 shares of its common stock during the quarter ended December 31, 2011 at an average cost of $9.27 per share. As of December 31, 2011, the Company has repurchased 58 percent of the shares authorized by the July 2011 Stock Repurchase Program, leaving 239,262 shares available for future repurchase activity.
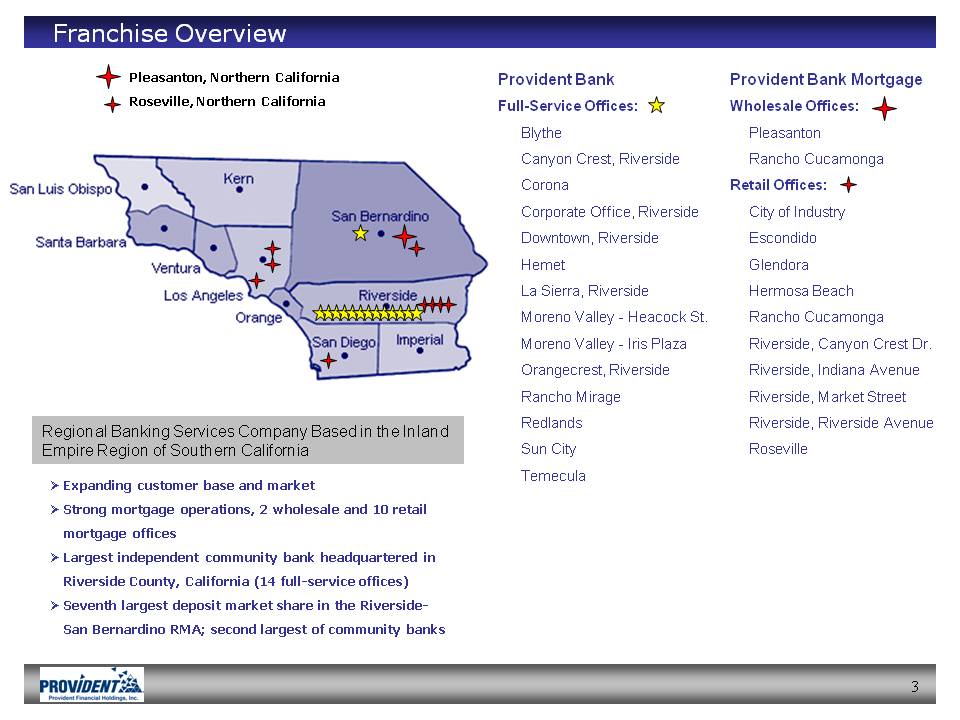
The Bank currently operates 14 retail/business banking offices in Riverside County and San Bernardino County (Inland Empire). Provident Bank Mortgage operates wholesale loan production offices in Pleasanton and Rancho Cucamonga, California and retail loan production offices in City of Industry, Escondido, Glendora, Hermosa Beach, Rancho Cucamonga, Riverside (4) and Roseville, California.
The Company will host a conference call for institutional investors and bank analysts on Wednesday, February 1, 2012 at 9:00 a.m. (Pacific) to discuss its financial results. The conference call can be accessed by dialing 1-800-230-1093 and requesting
Page 12 of 22
|
|
the Provident Financial Holdings Earnings Release Conference Call. An audio replay of the conference call will be available through Wednesday, February 15, 2012 by dialing 1-800-475-6701 and referencing access code number 234318.
For more financial information about the Company please visit the website at www.myprovident.com and click on the “Investor Relations” section.
Safe-Harbor Statement
This press release and the conference call noted above contain statements that the Company believes are “forward-looking statements.” These statements relate to the Company’s financial condition, results of operations, plans, objectives, future performance or business. You should not place undue reliance on these statements, as they are subject to risks and uncertainties. When considering these forward-looking statements, you should keep in mind these risks and uncertainties, as well as any cautionary statements the Company may make. Moreover, you should treat these statements as speaking only as of the date they are made and based only on information then actually known to the Company. There are a number of important factors that could cause future results to differ materially from historical performance and these forward-looking statements. Factors which could cause actual results to differ materially include, but are not limited to the credit risks of lending activities, including changes in the level and trend of loan delinquencies and write-offs and changes in our allowance for loan losses and provision for loan losses that may be impacted by deterioration in the housing and commercial real estate markets; changes in general economic conditions, either nationally or in our market areas; changes in the levels of general interest rates, and the relative differences between short and long term interest rates, deposit interest rates, our net interest margin and funding sources; fluctuations in the demand for loans, the number of unsold homes, land and other properties and fluctuations in real estate values in our market areas; secondary market conditions for loans and our ability to sell loans in the secondary market; results of examinations of us by the Board of Governors of the Federal Reserve System and our bank subsidiary by the Office of Comptroller of the Currency or other regulatory authorities, including the possibility that any such regulatory authority may, among other things, require us to increase our reserve for loan losses, write-down assets, change our regulatory capital position or affect our ability to borrow funds or maintain or increase deposits, which could adversely affect our liquidity and earnings; legislative or regulatory changes that adversely affect our business including changes in regulatory policies and principles, or the interpretation of regulatory capital or other rules; our ability to attract and retain deposits; further increases in premiums for deposit insurance; our ability to control operating costs and expenses; the use of estimates in determining fair value of certain of our assets, which estimates may prove to be incorrect and result in significant declines in valuation; difficulties in reducing risk associated with the loans on our balance sheet; staffing fluctuations in response to product demand or the implementation of corporate strategies that affect our workforce and potential associated charges; computer systems on which we depend could fail or experience a security breach; our ability to retain key members of our senior management team; costs and effects of litigation, including settlements and judgments; our ability to implement our branch expansion strategy; our ability to successfully integrate any assets, liabilities, customers, systems, and management personnel we have acquired or may in the future acquire into our operations and our ability to realize related revenue synergies and cost savings within expected time frames and any goodwill charges related thereto; increased competitive pressures among financial services companies; changes in consumer spending, borrowing and savings habits; the availability of resources to address changes in laws, rules, or regulations or to respond to regulatory actions; our ability to pay dividends on our common stock; adverse changes in the securities markets; inability of key third-party providers to perform their obligations to us; changes in accounting policies and practices, as may be adopted by the financial institution regulatory agencies or the Financial Accounting Standards Board, including additional guidance and interpretation on accounting issues and details of the implementation of new accounting methods; and other economic, competitive, governmental, regulatory, and technological factors affecting our operations, pricing, products and services and the other risks described in the Company’s reports filed with the Securities and Exchange Commission, including its Annual Report on Form 10-K for the fiscal year ended June 30, 2011.
Page 13 of 22
|
|
| Contacts: | Craig G. Blunden | Donavon P. Ternes |
| Chairman and | President, Chief Operating Officer, | |
| Chief Executive Officer | and Chief Financial Officer |
Page 14 of 22
|
|
|
PROVIDENT FINANCIAL HOLDINGS, INC.
Condensed Consolidated Statements of Financial Condition
(Unaudited –In Thousands, Except Share Information)
|
||||||||
|
December 31,
2011
|
June 30,
2011
|
|||||||
|
Assets
|
||||||||
|
Cash and cash equivalents
|
$ | 133,507 | $ | 142,550 | ||||
|
Investment securities – available for sale at fair value
|
24,106 | 26,193 | ||||||
|
Loans held for investment, net of allowance for loan losses of
|
||||||||
|
$26,901 and $30,482, respectively
|
845,476 | 881,610 | ||||||
|
Loans held for sale, at fair value
|
226,790 | 191,678 | ||||||
|
Accrued interest receivable
|
3,570 | 3,778 | ||||||
|
Real estate owned, net
|
7,853 | 8,329 | ||||||
|
FHLB – San Francisco stock
|
24,585 | 26,976 | ||||||
|
Premises and equipment, net
|
5,962 | 4,805 | ||||||
|
Prepaid expenses and other assets
|
26,710 | 28,630 | ||||||
|
Total assets
|
$ | 1,298,559 | $ | 1,314,549 | ||||
|
Liabilities and Stockholders’ Equity
|
||||||||
|
Liabilities:
|
||||||||
|
Non interest-bearing deposits
|
$ | 51,785 | $ | 45,437 | ||||
|
Interest-bearing deposits
|
902,071 | 900,330 | ||||||
|
Total deposits
|
953,856 | 945,767 | ||||||
|
Borrowings
|
176,573 | 206,598 | ||||||
|
Accounts payable, accrued interest and other liabilities
|
25,260 | 20,441 | ||||||
|
Total liabilities
|
1,155,689 | 1,172,806 | ||||||
|
Stockholders’ equity:
|
||||||||
|
Preferred stock, $.01 par value (2,000,000 shares authorized;
none issued and outstanding)
|
||||||||
| - | - | |||||||
|
Common stock, $.01 par value (40,000,000 and 40,000,000 shares
authorized, respectively; 17,610,865 and 17,610,865 shares
issued, respectively; 11,175,761 and 11,418,654 shares
outstanding, respectively)
|
||||||||
| 176 | 176 | |||||||
|
Additional paid-in capital
|
86,265 | 85,432 | ||||||
|
Retained earnings
|
151,633 | 148,147 | ||||||
|
Treasury stock at cost (6,435,104 and 6,192,211 shares,
respectively)
|
||||||||
| (95,757 | ) | (92,650 | ) | |||||
|
Accumulated other comprehensive income, net of tax
|
553 | 638 | ||||||
|
Total stockholders’ equity
|
142,870 | 141,743 | ||||||
|
Total liabilities and stockholders’ equity
|
$ | 1,298,559 | $ | 1,314,549 | ||||
Page 15 of 22
|
|
|
PROVIDENT FINANCIAL HOLDINGS, INC.
Condensed Consolidated Statements of Financial Condition – Sequential Quarter
(Unaudited –In Thousands, Except Share Information)
|
||||||||
|
December 31,
2011
|
September 30,
2011
|
|||||||
|
Assets
|
||||||||
|
Cash and cash equivalents
|
$ | 133,507 | $ | 80,156 | ||||
|
Investment securities – available for sale at fair value
|
24,106 | 25,253 | ||||||
|
Loans held for investment, net of allowance for loan losses of
|
||||||||
|
$26,901 and $28,704, respectively
|
845,476 | 859,649 | ||||||
|
Loans held for sale, at fair value
|
226,790 | 278,212 | ||||||
|
Accrued interest receivable
|
3,570 | 3,480 | ||||||
|
Real estate owned, net
|
7,853 | 7,300 | ||||||
|
FHLB – San Francisco stock
|
24,585 | 25,777 | ||||||
|
Premises and equipment, net
|
5,962 | 4,941 | ||||||
|
Prepaid expenses and other assets
|
26,710 | 35,100 | ||||||
|
Total assets
|
$ | 1,298,559 | $ | 1,319,868 | ||||
|
Liabilities and Stockholders’ Equity
|
||||||||
|
Liabilities:
|
||||||||
|
Non interest-bearing deposits
|
$ | 51,785 | $ | 46,044 | ||||
|
Interest-bearing deposits
|
902,071 | 915,832 | ||||||
|
Total deposits
|
953,856 | 961,876 | ||||||
|
Borrowings
|
176,573 | 186,586 | ||||||
|
Accounts payable, accrued interest and other liabilities
|
25,260 | 27,810 | ||||||
|
Total liabilities
|
1,155,689 | 1,176,272 | ||||||
|
Stockholders’ equity:
|
||||||||
|
Preferred stock, $.01 par value (2,000,000 shares authorized;
none issued and outstanding)
|
||||||||
| - | - | |||||||
|
Common stock, $.01 par value (40,000,000 and 40,000,000 shares
authorized, respectively; 17,610,865 and 17,610,865 shares
issued, respectively; 11,175,761 and 11,439,264 shares
outstanding, respectively)
|
||||||||
| 176 | 176 | |||||||
|
Additional paid-in capital
|
86,265 | 86,021 | ||||||
|
Retained earnings
|
151,633 | 150,120 | ||||||
|
Treasury stock at cost (6,435,104 and 6,171,601 shares,
respectively)
|
||||||||
| (95,757 | ) | (93,316 | ) | |||||
|
Accumulated other comprehensive income, net of tax
|
553 | 595 | ||||||
|
Total stockholders’ equity
|
142,870 | 143,596 | ||||||
|
Total liabilities and stockholders’ equity
|
$ | 1,298,559 | $ | 1,319,868 | ||||
Page 16 of 22
|
|
|
PROVIDENT FINANCIAL HOLDINGS, INC.
Condensed Consolidated Statements of Operations
(Unaudited - In Thousands, Except Earnings Per Share)
|
||||||||||||||||
|
Quarter Ended
December 31,
|
Six Months Ended
December 31,
|
|||||||||||||||
|
2011
|
2010
|
2011
|
2010
|
|||||||||||||
|
Interest income:
|
||||||||||||||||
|
Loans receivable, net
|
$ | 13,261 | $ | 14,888 | $ | 26,010 | $ | 30,449 | ||||||||
|
Investment securities
|
134 | 217 | 281 | 458 | ||||||||||||
|
FHLB – San Francisco stock
|
20 | 30 | 38 | 66 | ||||||||||||
|
Interest-earning deposits
|
37 | 65 | 134 | 130 | ||||||||||||
|
Total interest income
|
13,452 | 15,200 | 26,463 | 31,103 | ||||||||||||
|
Interest expense:
|
||||||||||||||||
|
Checking and money market deposits
|
176 | 271 | 376 | 576 | ||||||||||||
|
Savings deposits
|
191 | 287 | 416 | 627 | ||||||||||||
|
Time deposits
|
1,824 | 2,051 | 3,730 | 4,235 | ||||||||||||
|
Borrowings
|
1,755 | 2,883 | 3,637 | 6,145 | ||||||||||||
|
Total interest expense
|
3,946 | 5,492 | 8,159 | 11,583 | ||||||||||||
|
Net interest income, before provision for loan losses
|
9,506 | 9,708 | 18,304 | 19,520 | ||||||||||||
|
Provision for loan losses
|
1,132 | 1,048 | 2,104 | 1,925 | ||||||||||||
|
Net interest income, after provision for loan losses
|
8,374 | 8,660 | 16,200 | 17,595 | ||||||||||||
|
Non-interest income:
|
||||||||||||||||
|
Loan servicing and other fees
|
176 | 275 | 308 | 399 | ||||||||||||
|
Gain on sale of loans, net
|
5,897 | 9,332 | 13,173 | 18,779 | ||||||||||||
|
Deposit account fees
|
626 | 671 | 1,229 | 1,300 | ||||||||||||
|
Gain (loss) on sale and operations of real estate
owned acquired in the settlement of loans
|
77 | (690 | ) | 109 | (1,058 | ) | ||||||||||
|
Card and processing fees
|
309 | 312 | 640 | 628 | ||||||||||||
|
Other
|
228 | 197 | 402 | 384 | ||||||||||||
|
Total non-interest income
|
7,313 | 10,097 | 15,861 | 20,432 | ||||||||||||
|
Non-interest expense:
|
||||||||||||||||
|
Salaries and employee benefits
|
8,380 | 7,565 | 17,234 | 14,942 | ||||||||||||
|
Premises and occupancy
|
956 | 804 | 1,828 | 1,624 | ||||||||||||
|
Equipment
|
410 | 378 | 724 | 703 | ||||||||||||
|
Professional expenses
|
455 | 418 | 888 | 801 | ||||||||||||
|
Sales and marketing expenses
|
178 | 160 | 377 | 294 | ||||||||||||
|
Deposit insurance and regulatory assessments
|
461 | 664 | 632 | 1,345 | ||||||||||||
|
Other
|
1,634 | 1,353 | 3,094 | 2,843 | ||||||||||||
|
Total non-interest expense
|
12,474 | 11,342 | 24,777 | 22,552 | ||||||||||||
|
Income before taxes
|
3,213 | 7,415 | 7,284 | 15,475 | ||||||||||||
|
Provision for income taxes
|
1,359 | 3,160 | 3,112 | 6,691 | ||||||||||||
|
Net income
|
$ | 1,854 | $ | 4,255 | $ | 4,172 | $ | 8,784 | ||||||||
|
Basic earnings per share
|
$ | 0.16 | $ | 0.37 | $ | 0.37 | $ | 0.77 | ||||||||
|
Diluted earnings per share
|
$ | 0.16 | $ | 0.37 | $ | 0.36 | $ | 0.77 | ||||||||
|
Cash dividends per share
|
$ | 0.03 | $ | 0.01 | $ | 0.06 | $ | 0.02 | ||||||||
Page 17 of 22
|
|
|
PROVIDENT FINANCIAL HOLDINGS, INC.
Condensed Consolidated Statements of Operations – Sequential Quarter
(Unaudited – In Thousands, Except Share Information)
|
||||||||
|
Quarter Ended
|
||||||||
|
December 31,
|
September 30,
|
|||||||
|
2011
|
2011
|
|||||||
|
Interest income:
|
||||||||
|
Loans receivable, net
|
$ | 13,261 | $ | 12,749 | ||||
|
Investment securities
|
134 | 147 | ||||||
|
FHLB – San Francisco stock
|
20 | 18 | ||||||
|
Interest-earning deposits
|
37 | 97 | ||||||
|
Total interest income
|
13,452 | 13,011 | ||||||
|
Interest expense:
|
||||||||
|
Checking and money market deposits
|
176 | 200 | ||||||
|
Savings deposits
|
191 | 225 | ||||||
|
Time deposits
|
1,824 | 1,906 | ||||||
|
Borrowings
|
1,755 | 1,882 | ||||||
|
Total interest expense
|
3,946 | 4,213 | ||||||
|
Net interest income, before provision for loan losses
|
9,506 | 8,798 | ||||||
|
Provision for loan losses
|
1,132 | 972 | ||||||
|
Net interest income, after provision for loan losses
|
8,374 | 7,826 | ||||||
|
Non-interest income:
|
||||||||
|
Loan servicing and other fees
|
176 | 132 | ||||||
|
Gain on sale of loans, net
|
5,897 | 7,276 | ||||||
|
Deposit account fees
|
626 | 603 | ||||||
|
Gain on sale and operations of real estate owned
acquired in the settlement of loans, net
|
77 | 32 | ||||||
|
Card and processing fees
|
309 | 331 | ||||||
|
Other
|
228 | 174 | ||||||
|
Total non-interest income
|
7,313 | 8,548 | ||||||
|
Non-interest expense:
|
||||||||
|
Salaries and employee benefits
|
8,380 | 8,854 | ||||||
|
Premises and occupancy
|
956 | 872 | ||||||
|
Equipment
|
410 | 314 | ||||||
|
Professional expenses
|
455 | 433 | ||||||
|
Sales and marketing expenses
|
178 | 199 | ||||||
|
Deposit insurance premiums and regulatory assessments
|
461 | 171 | ||||||
|
Other
|
1,634 | 1,460 | ||||||
|
Total non-interest expense
|
12,474 | 12,303 | ||||||
|
Income before taxes
|
3,213 | 4,071 | ||||||
|
Provision for income taxes
|
1,359 | 1,753 | ||||||
|
Net income
|
$ | 1,854 | $ | 2,318 | ||||
|
Basic earnings per share
|
$ | 0.16 | $ | 0.20 | ||||
|
Diluted earnings per share
|
$ | 0.16 | $ | 0.20 | ||||
|
Cash dividends per share
|
$ | 0.03 | $ | 0.03 | ||||
Page 18 of 22
|
|
|
PROVIDENT FINANCIAL HOLDINGS, INC.
Financial Highlights
(Unaudited - Dollars in Thousands, Except Share Information )
|
||||||||||||||||
|
Quarter Ended
December 31,
|
Six Months Ended
December 31,
|
|||||||||||||||
|
2011
|
2010
|
2011
|
2010
|
|||||||||||||
|
SELECTED FINANCIAL RATIOS:
|
||||||||||||||||
|
Return on average assets
|
0.57 | % | 1.24 | % | 0.64 | % | 1.27 | % | ||||||||
|
Return on average stockholders’ equity
|
5.16 | % | 12.62 | % | 5.83 | % | 13.26 | % | ||||||||
|
Stockholders’ equity to total assets
|
11.00 | % | 10.07 | % | 11.00 | % | 10.07 | % | ||||||||
|
Net interest spread
|
2.90 | % | 2.83 | % | 2.79 | % | 2.83 | % | ||||||||
|
Net interest margin
|
3.02 | % | 2.96 | % | 2.90 | % | 2.95 | % | ||||||||
|
Efficiency ratio
|
74.17 | % | 57.27 | % | 72.52 | % | 56.45 | % | ||||||||
|
Average interest-earning assets to average
|
||||||||||||||||
|
interest-bearing liabilities
|
110.52 | % | 108.22 | % | 110.03 | % | 107.54 | % | ||||||||
|
SELECTED FINANCIAL DATA:
|
||||||||||||||||
|
Basic earnings per share
|
$ | 0.16 | $ | 0.37 | $ | 0.37 | $ | 0.77 | ||||||||
|
Diluted earnings per share
|
$ | 0.16 | $ | 0.37 | $ | 0.36 | $ | 0.77 | ||||||||
|
Book value per share
|
$ | 12.78 | $ | 11.99 | $ | 12.78 | $ | 11.99 | ||||||||
|
Shares used for basic EPS computation
|
11,352,954 | 11,377,186 | 11,410,403 | 11,369,469 | ||||||||||||
|
Shares used for diluted EPS computation
|
11,383,737 | 11,386,838 | 11,449,321 | 11,374,295 | ||||||||||||
|
Total shares issued and outstanding
|
11,175,761 | 11,407,454 | 11,175,761 | 11,407,454 | ||||||||||||
|
LOANS ORIGINATED AND PURCHASED FOR SALE:
|
||||||||||||||||
|
Retail originations
|
$ | 220,272 | $ | 220,794 | $ | 427,821 | $ | 454,533 | ||||||||
|
Wholesale originations and purchases
|
408,672 | 399,748 | 769,183 | 815,480 | ||||||||||||
|
Total loans originated and purchased for sale
|
$ | 628,944 | $ | 620,542 | $ | 1,197,004 | $ | 1,270,013 | ||||||||
|
LOANS SOLD:
|
||||||||||||||||
|
Servicing released
|
$ | 670,753 | $ | 689,724 | $ | 1,152,146 | $ | 1,280,313 | ||||||||
|
Servicing retained
|
3,537 | - | 7,863 | 185 | ||||||||||||
|
Total loans sold
|
$ | 674,290 | $ | 689,724 | $ | 1,160,009 | $ | 1,280,498 | ||||||||
|
As of
|
As of
|
As of
|
As of
|
As of
|
||||||||||||||||
|
12/31/11
|
09/30/11
|
06/30/11
|
03/31/11
|
12/31/10
|
||||||||||||||||
|
ASSET QUALITY RATIOS AND
DELINQUENT LOANS:
|
||||||||||||||||||||
|
Recourse reserve for loans sold
|
$ | 5,301 | $ | 5,221 | $ | 4,216 | $ | 4,059 | $ | 5,295 | ||||||||||
|
Allowance for loan losses
|
$ | 26,901 | $ | 28,704 | $ | 30,482 | $ | 34,478 | $ | 36,925 | ||||||||||
|
Non-performing loans to loans held for
investment, net
|
3.72 | % | 4.31 | % | 4.21 | % | 5.11 | % | 5.37 | % | ||||||||||
|
Non-performing assets to total assets
|
3.03 | % | 3.36 | % | 3.46 | % | 4.28 | % | 4.68 | % | ||||||||||
|
Allowance for loan losses to gross non-
performing loans
|
62.71 | % | 57.61 | % | 59.49 | % | 54.19 | % | 56.18 | % | ||||||||||
|
Allowance for loan losses to gross loans held for
|
||||||||||||||||||||
|
investment
|
3.08 | % | 3.23 | % | 3.34 | % | 3.64 | % | 3.81 | % | ||||||||||
|
Net charge-offs to average loans receivable
(annualized)
|
1.02 | % | 1.04 | % | 1.83 | % | 1.94 | % | 1.12 | % | ||||||||||
|
Non-performing loans
|
$ | 31,461 | $ | 37,055 | $ | 37,126 | $ | 46,649 | $ | 50,035 | ||||||||||
|
Loans 30 to 89 days delinquent
|
$ | 3,066 | $ | 2,517 | $ | 2,057 | $ | 5,662 | $ | 9,497 | ||||||||||
Page 19 of 22
|
|
|
PROVIDENT FINANCIAL HOLDINGS, INC.
Financial Highlights
(Unaudited)
|
||||||||||||||||||||
|
(Dollars in Thousands)
|
Quarter
Ended
|
Quarter
Ended
|
Quarter
Ended
|
Quarter
Ended
|
Quarter
Ended
|
|||||||||||||||
|
12/31/11
|
09/30/11
|
06/30/11
|
03/31/11
|
12/31/10
|
||||||||||||||||
|
Recourse provision (recovery) for loans sold
|
$ | 672 | $ | 1,101 | $ | 402 | $ | (1,236 | ) | $ | 173 | |||||||||
|
Provision for loan losses
|
$ | 1,132 | $ | 972 | $ | 847 | $ | 2,693 | $ | 1,048 | ||||||||||
|
Net charge-offs
|
$ | 2,935 | $ | 2,750 | $ | 4,843 | $ | 5,140 | $ | 3,209 | ||||||||||
|
As of
|
As of
|
As of
|
As of
|
As of
|
||||||||||||||||
|
12/31/11
|
09/30/11
|
06/30/11
|
03/31/11
|
12/31/10
|
||||||||||||||||
|
REGULATORY CAPITAL RATIOS (BANK):
|
||||||||||||||||||||
|
Tangible equity ratio
|
10.68 | % | 10.34 | % | 10.53 | % | 10.16 | % | 9.80 | % | ||||||||||
|
Core capital ratio
|
10.68 | % | 10.34 | % | 10.53 | % | 10.16 | % | 9.80 | % | ||||||||||
|
Total risk-based capital ratio
|
18.21 | % | 16.91 | % | 17.56 | % | 16.07 | % | 15.23 | % | ||||||||||
|
Tier 1 risk-based capital ratio
|
16.96 | % | 15.65 | % | 16.30 | % | 14.82 | % | 13.97 | % | ||||||||||
|
As of December 31,
|
||||||||||||||||
|
2011
|
2010
|
|||||||||||||||
|
INVESTMENT SECURITIES:
|
Balance
|
Rate (1)
|
Balance
|
Rate (1)
|
||||||||||||
|
Available for sale (at fair value):
|
||||||||||||||||
|
U.S. government sponsored enterprise debt securities
|
$ | - | - | % | $ | 3,259 | 4.00 | % | ||||||||
|
U.S. government agency MBS
|
13,083 | 2.12 | 15,421 | 2.77 | ||||||||||||
|
U.S. government sponsored enterprise MBS
|
9,779 | 2.44 | 11,024 | 2.59 | ||||||||||||
|
Private issue collateralized mortgage obligations
|
1,244 | 2.53 | 1,400 | 2.65 | ||||||||||||
|
Total investment securities available for sale
|
$ | 24,106 | 2.27 | % | $ | 31,104 | 2.83 | % | ||||||||
|
LOANS HELD FOR INVESTMENT:
|
||||||||||||||||
|
Single-family (1 to 4 units)
|
$ | 465,606 | 3.89 | % | $ | 531,686 | 4.51 | % | ||||||||
|
Multi-family (5 or more units)
|
298,285 | 5.84 | 320,279 | 6.13 | ||||||||||||
|
Commercial real estate
|
99,718 | 6.84 | 105,720 | 6.86 | ||||||||||||
|
Construction
|
- | - | 400 | 5.25 | ||||||||||||
|
Other mortgage
|
1,528 | 5.69 | 1,531 | 5.69 | ||||||||||||
|
Commercial business
|
4,332 | 7.43 | 5,723 | 7.12 | ||||||||||||
|
Consumer
|
604 | 8.02 | 792 | 7.71 | ||||||||||||
|
Total loans held for investment
|
870,073 | 4.92 | % | 966,131 | 5.32 | % | ||||||||||
|
Deferred loan costs, net
|
2,304 | 2,993 | ||||||||||||||
|
Allowance for loan losses
|
(26,901 | ) | (36,925 | ) | ||||||||||||
|
Total loans held for investment, net
|
$ | 845,476 | $ | 932,199 | ||||||||||||
|
Purchased loans serviced by others included above
|
$ | 19,701 | 4.72 | % | $ | 21,296 | 4.76 | % | ||||||||
|
DEPOSITS:
|
||||||||||||||||
|
Checking accounts – non interest-bearing
|
$ | 51,785 | - | % | $ | 45,475 | - | % | ||||||||
|
Checking accounts – interest-bearing
|
198,683 | 0.26 | 185,086 | 0.37 | ||||||||||||
|
Savings accounts
|
214,846 | 0.35 | 203,940 | 0.50 | ||||||||||||
|
Money market accounts
|
30,275 | 0.57 | 32,182 | 0.66 | ||||||||||||
|
Time deposits
|
458,267 | 1.51 | 459,897 | 1.68 | ||||||||||||
|
Total deposits
|
$ | 953,856 | 0.88 | % | $ | 926,580 | 1.04 | % | ||||||||
|
(1) The interest rate or yield/cost described in the rate or yield/cost column is the weighted-average interest rate or yield/cost of all instruments, which are included in the balance of the respective line item.
|
||||||||||||||||
Page 20 of 22
|
|
|
PROVIDENT FINANCIAL HOLDINGS, INC.
Financial Highlights
(Unaudited)
|
||||||||||||||||
|
As of December 31,
|
||||||||||||||||
|
(Dollars in Thousands)
|
2011
|
2010
|
||||||||||||||
|
Balance
|
Rate (1)
|
Balance
|
Rate (1)
|
|||||||||||||
|
BORROWINGS:
|
||||||||||||||||
|
Overnight
|
$ | - | - | % | $ | - | - | % | ||||||||
|
Three months or less
|
30,000 | 4.01 | 60,000 | 3.87 | ||||||||||||
|
Over three to six months
|
30,000 | 3.70 | 25,000 | 5.00 | ||||||||||||
|
Over six months to one year
|
- | - | 30,000 | 3.84 | ||||||||||||
|
Over one year to two years
|
75,000 | 3.80 | 60,000 | 3.86 | ||||||||||||
|
Over two years to three years
|
10,000 | 2.93 | 75,000 | 3.80 | ||||||||||||
|
Over three years to four years
|
- | - | 10,000 | 2.93 | ||||||||||||
|
Over four years to five years
|
- | - | - | - | ||||||||||||
|
Over five years
|
31,573 | 3.71 | 11,623 | 4.27 | ||||||||||||
|
Total borrowings
|
$ | 176,573 | 3.75 | % | $ | 271,623 | 3.93 | % | ||||||||
|
Quarter Ended
|
Six Months Ended
|
|||||||||||||||
|
December 31,
|
December 31,
|
|||||||||||||||
|
SELECTED AVERAGE BALANCE
|
2011
|
2010
|
2011
|
2010
|
||||||||||||
|
SHEETS:
|
Balance
|
Balance
|
Balance
|
Balance
|
||||||||||||
|
Loans receivable, net (2)
|
$ | 1,153,663 | $ | 1,146,220 | $ | 1,105,162 | $ | 1,155,746 | ||||||||
|
Investment securities
|
24,719 | 32,261 | 25,243 | 33,083 | ||||||||||||
|
FHLB – San Francisco stock
|
25,155 | 29,946 | 25,759 | 30,545 | ||||||||||||
|
Interest-earning deposits
|
57,201 | 103,643 | 104,765 | 102,975 | ||||||||||||
|
Total interest-earning assets
|
$ | 1,260,738 | $ | 1,312,070 | $ | 1,260,929 | $ | 1,322,349 | ||||||||
|
Total assets
|
$ | 1,307,733 | $ | 1,374,776 | $ | 1,310,852 | $ | 1,387,475 | ||||||||
|
Deposits
|
$ | 955,112 | $ | 932,980 | $ | 954,922 | $ | 935,376 | ||||||||
|
Borrowings
|
185,670 | 279,399 | 191,103 | 294,275 | ||||||||||||
|
Total interest-bearing liabilities
|
$ | 1,140,782 | $ | 1,212,379 | $ | 1,146,025 | $ | 1,229,651 | ||||||||
|
Total stockholders’ equity
|
$ | 143,599 | $ | 134,915 | $ | 143,060 | $ | 132,460 | ||||||||
|
Quarter Ended
|
Six Months Ended
|
|||||||
|
December 31,
|
December 31,
|
|||||||
|
2011
|
2010
|
2011
|
2010
|
|||||
|
Yield/Cost
|
Yield/Cost
|
Yield/Cost
|
Yield/Cost
|
|||||
|
Loans receivable, net (2)
|
4.60%
|
5.20%
|
4.71%
|
5.27%
|
||||
|
Investment securities
|
2.17%
|
2.69%
|
2.23%
|
2.77%
|
||||
|
FHLB – San Francisco stock
|
0.32%
|
0.40%
|
0.29%
|
0.43%
|
||||
|
Interest-earning deposits
|
0.25%
|
0.25%
|
0.25%
|
0.25%
|
||||
|
Total interest-earning assets
|
4.27%
|
4.63%
|
4.20%
|
4.70%
|
||||
|
Deposits
|
0.91%
|
1.11%
|
0.94%
|
1.15%
|
||||
|
Borrowings
|
3.75%
|
4.09%
|
3.78%
|
4.14%
|
||||
|
Total interest-bearing liabilities
|
1.37%
|
1.80%
|
1.41%
|
1.87%
|
||||
|
(1) The interest rate or yield/cost described in the rate or yield/cost column is the weighted-average interest rate or yield/cost of all instruments, which are included in the balance of the respective line item.
|
||||||||
|
(2) Includes loans held for investment and loans held for sale at fair value, net of allowance for loan losses.
|
||||||||
Page 21 of 22
|
|
|
PROVIDENT FINANCIAL HOLDINGS, INC.
Asset Quality
(Unaudited – Dollars in Thousands)
|
||||||||||||||||||||
|
As of
|
As of
|
As of
|
As of
|
As of
|
||||||||||||||||
|
12/31/11
|
09/30/11
|
06/30/11
|
03/31/11
|
12/31/10
|
||||||||||||||||
|
Loans on non-accrual status (excluding
restructured loans):
|
||||||||||||||||||||
|
Mortgage loans:
|
||||||||||||||||||||
|
Single-family
|
$ | 15,483 | $ | 17,614 | $ | 16,705 | $ | 20,160 | $ | 23,975 | ||||||||||
|
Multi-family
|
1,789 | 1,437 | 1,463 | 2,558 | 1,525 | |||||||||||||||
|
Commercial real estate
|
938 | 939 | 560 | 375 | 1,645 | |||||||||||||||
|
Construction
|
- | - | - | 250 | 250 | |||||||||||||||
|
Commercial business loans
|
- | - | - | - | 37 | |||||||||||||||
|
Total
|
18,210 | 19,990 | 18,728 | 23,343 | 27,432 | |||||||||||||||
|
Accruing loans past due 90 days or more:
|
- | - | - | - | - | |||||||||||||||
|
Total
|
- | - | - | - | - | |||||||||||||||
|
Restructured loans on non-accrual status:
|
||||||||||||||||||||
|
Mortgage loans:
|
||||||||||||||||||||
|
Single-family
|
11,424 | 13,940 | 15,133 | 17,185 | 18,620 | |||||||||||||||
|
Multi-family
|
490 | 490 | 490 | 2,368 | 2,622 | |||||||||||||||
|
Commercial real estate
|
365 | 1,660 | 1,660 | 2,405 | 983 | |||||||||||||||
|
Other
|
972 | 972 | 972 | 1,203 | 232 | |||||||||||||||
|
Commercial business loans
|
- | 3 | 143 | 145 | 146 | |||||||||||||||
|
Total
|
13,251 | 17,065 | 18,398 | 23,306 | 22,603 | |||||||||||||||
|
Total non-performing loans
|
31,461 | 37,055 | 37,126 | 46,649 | 50,035 | |||||||||||||||
|
Real estate owned, net
|
7,853 | 7,300 | 8,329 | 10,659 | 13,470 | |||||||||||||||
|
Total non-performing assets
|
$ | 39,314 | $ | 44,355 | $ | 45,455 | $ | 57,308 | $ | 63,505 | ||||||||||
|
Restructured loans on accrual status:
|
||||||||||||||||||||
|
Mortgage loans:
|
||||||||||||||||||||
|
Single-family
|
$ | 10,092 | $ | 12,940 | $ | 15,589 | $ | 19,929 | $ | 16,149 | ||||||||||
|
Multi-family
|
4,168 | 4,172 | 3,665 | 914 | 918 | |||||||||||||||
|
Commercial real estate
|
2,772 | 1,473 | 1,142 | 536 | 1,830 | |||||||||||||||
|
Other
|
- | 236 | 237 | - | 1,292 | |||||||||||||||
|
Commercial business loans
|
219 | 189 | 125 | 90 | 94 | |||||||||||||||
|
Total
|
$ | 17,251 | $ | 19,010 | $ | 20,758 | $ | 21,469 | $ | 20,283 | ||||||||||