UNITED STATES
SECURITIES AND EXCHANGE COMMISSION
Washington, D.C. 20549
FORM N-CSR
CERTIFIED SHAREHOLDER REPORT OF
REGISTERED
MANAGEMENT INVESTMENT COMPANIES
Investment Company Act file number: 811-07583
HSBC ADVISOR FUNDS TRUST
(Exact name
of registrant as specified in charter)
452 FIFTH AVENUE
NEW YORK, NY 10018
(Address of principal executive offices) (Zip
code)
CITI FUND SERVICES
3435 STELZER ROAD
COLUMBUS, OH 43219
(Name and address of agent for service)
Registrant’s telephone number, including area code: 1-800-782-8183
|
Date of fiscal year end: October 31 Date of reporting period: October 31, 2013 |
Item 1. Reports to Stockholders.
HSBC Global Asset Management (USA) Inc.
HSBC Funds
Annual Report
October 31, 2013
| EQUITY FUNDS | Class A | Class B | Class C | Class I | ||||
| HSBC Growth Fund | HOTAX | HOTBX | HOTCX | HOTYX | ||||
| HSBC Opportunity Fund | HSOAX | HOPBX | HOPCX | RESCX |
![]()
| Table of Contents |
Annual Report - October 31, 2013
| Glossary of Terms | ||
| President’s Message | 4 | |
| Commentary From the Investment Manager | 5 | |
| Portfolio Reviews | 6 | |
| Portfolio Composition | 10 | |
| Statements of Assets and Liabilities | 11 | |
| Statements of Operations | 12 | |
| Statements of Changes in Net Assets | 13 | |
| Financial Highlights | 17 | |
| Notes to Financial Statements | 20 | |
| Report of Independent Registered Public Accounting Firm | 28 | |
| Other Federal Income Tax Information | 29 | |
| Table of Shareholder Expenses | 30 | |
| HSBC Portfolios | ||
| Schedules of Portfolio Investments | ||
| HSBC Growth Portfolio | 32 | |
| HSBC Opportunity Portfolio | 34 | |
| Statements of Assets and Liabilities | 36 | |
| Statements of Operations | 37 | |
| Statements of Changes in Net Assets | 38 | |
| Financial Highlights | 39 | |
| Notes to Financial Statements | 40 | |
| Report of Independent Registered Public Accounting Firm | 45 | |
| Table of Shareholder Expenses | 46 | |
| Board of Trustees and Officers | 47 | |
| Other Information | 49 |
| Glossary of Terms |
Barclays U.S. Aggregate Bond Index is an unmanaged index generally representative of investment-grade, USD-denominated, fixed-rate debt issues, taxable bond market, including Treasuries, government-related and corporate securities, asset-backed, mortgage-backed and commercial mortgage-backed securities, with maturities of at least one year.
Barclays U.S. Corporate High-Yield Bond Index is an unmanaged index that measures the non-investment grade, USD-denominated, fixed-rate, taxable corporate bond market. Securities are classified as high-yield if the middle rating of Moody’s, Fitch, and S&P is Ba1/BB+/BB+ or below. The index excludes emerging markets debt.
Gross Domestic Product (“GDP”) measures the market value of the goods and services produced by labor and property in the United States.
Lipper Large-Cap Growth Funds Average is an equally weighted average of mutual funds that, by portfolio practice, invest at least 75% of their equity assets in companies with market capitalizations (on a three-year weighted basis) above Lipper’s U.S. Diversified Equity large-cap floor. Large-cap growth funds typically have an above-average price-to-earnings ratio, price-to-book ratio, and three-year sales-per-share growth value, compared to the S&P 500 Index.
Lipper Mid-Cap Growth Funds Average is an equally weighted average of mutual funds that, by portfolio practice, invest at least 75% of their equity assets in companies with market capitalizations (on a three-year weighted basis) below Lipper’s U.S. Diversified Equity large-cap floor. Mid-cap growth funds typically have an above-average price-to-earnings ratio, price-to-book ratio, and three-year sales-per-share growth value, compared to the S&P MidCap 400 Index.
Morgan Stanley Capital International Europe Australasia and Far East (“MSCI EAFE”) Index is an unmanaged equity index which captures large and mid cap representation across Developed Markets countries: Australia, Austria, Belgium, Denmark, Finland, France, Germany, Greece, Hong Kong, Ireland, Israel, Italy, Japan, the Netherlands, New Zealand, Norway, Portugal, Singapore, Spain, Sweden, Switzerland and the UK (excluding the US and Canada). With 910 constituents, the index covers approximately 85% of the free float-adjusted market capitalization in each country.
Morgan Stanley Capital International Emerging Market (“MSCI EM”) Index is an unmanaged index that captures large and mid cap representation across 21 Emerging Markets (EM) countries: Brazil, Chile, China, Colombia, Czech Republic, Egypt, Hungary, India, Indonesia, Korea, Malaysia, Mexico, Morocco, Peru, Philippines, Poland, Russia, South Africa, Taiwan, Thailand and Turkey. With 818 constituents, the index covers approximately 85% of the free float-adjusted market capitalization in each country.
Russell 1000® Growth Index is an unmanaged index that measures the performance of the large-cap growth segment of the U.S. equity universe. It includes those Russell 1000 companies with higher price-to-book ratios and higher forecasted growth values.
Russell 2000® Index is an unmanaged index that measures the performance of the small-cap segment of the U.S. equity universe. The Russell 2000® Index is a subset of the Russell 3000® Index representing approximately 10% of the total market capitalization of that index. It includes approximately 2000 of the smallest securities based on a combination of their market cap and current index membership.
Russell 2500™ Growth Index is an unmanaged index that measures the performance of the small- to mid-cap growth segment of the U.S. equity universe. It includes those Russell 2500 companies with higher price-to-book ratios and higher forecasted growth values.
Standard & Poor’s 500 (“S&P 500”) Index is an unmanaged index that is widely regarded as a gauge of the U.S. equities market. This index includes 500 leading companies in leading industries of the U.S. economy. The S&P 500 Index focuses on the large-cap segment of the market, with approximately 75% coverage of U.S. equities.
Lipper is an independent mutual fund performance monitor whose results are based on total return and do not reflect a sales charge.
Securities indices assume reinvestment of all distributions and interest payments and do not take in account brokerage fees or expenses. Securities in the Funds do not match those in the indices and performance of the Funds will differ. Investors cannot invest directly in an index.
| President’s Message |
Dear Shareholder,
We are pleased to send to you the HSBC Funds annual report, covering the fiscal year ended October 31, 2013. This report contains detailed information about your Funds’ portfolio of investments and operating results. We encourage you to review it carefully.
This report includes commentary from the Funds’ portfolio managers in which they discuss the investment markets and their respective Fund’s performance. The portfolio manager commentary is accompanied by the Fund’s return for the period, listed alongside the returns of its benchmark index and peer group average for comparative purposes.
In closing, we would like to thank you for investing in the HSBC Funds. We continue to focus the HSBC Fund Family on investment solutions to assist our shareholders in reaching their financial goals. We appreciate the trust you place in us, and will continue working to earn it. Please contact us at any time with questions or concerns.
Sincerely,
Richard
A. Fabietti
President
4 HSBC FAMILY OF FUNDS
| Commentary From the Investment Manager |
| HSBC Global Asset Management (USA) Inc. |
U.S. Economic Review
Economic growth picked up pace in developing economies throughout the world during the 12-month period between November 1, 2012 and October 31, 2013. Many major economies, including the United States, reported improved economic data during the period, indicating new momentum for a modest but sustained recovery. The U.S. equity markets made strong gains during the period, boosted by improvements in the labor and housing markets and healthy corporate profits. Markets continued to benefit from the Federal Reserve Board’s (the “Fed”) decision to maintain the federal funds rate—a key factor in lending rates—at a historically low target range between 0.00% and 0.25%. Economic headwinds remained, however, including relatively high unemployment in some areas, low consumer spending and reduced government spending caused by sequestration.
Investor confidence declined mid-year due in part to expectations that the Fed would begin tapering its bond purchasing program. Concerns about the impact of tapering diminished, however, when the Fed announced in September that it would delay winding down its stimulus efforts until the unemployment rate fell significantly lower. The first shutdown of the U.S. government in 17 years occurred in October. This political crisis, along with the related standoff over raising the country’s borrowing limit, was another factor weighing on investor sentiment. The uncertainty surrounding the crisis dragged on equities, although markets regained momentum once a political deal was struck that reopened the government and raised the debt ceiling. Broad U.S. stock market indices ended the period significantly above where they were positioned 12 months earlier.
Improving political circumstances in the eurozone and positive economic data helped boost stocks in developed economies across the world. The economies of both Japan and Europe transitioned out of recession. Progress was made toward alleviating the sovereign debt crisis in Europe. The European Central Bank’s aggressive efforts, including its government bond-buying program known as Outright Monetary Transactions, reassured investors. Still, many developments in Europe revealed ongoing economic weaknesses, including a controversial bailout in Cyprus, political uncertainty in Italy and high unemployment throughout the eurozone.
Economic growth in many emerging markets slowed during the period, as concerns grew about rising inflation and potential decreases in global liquidity. In addition, signs of softening in China’s economy led to a fall in commodity prices, which dragged on stocks throughout emerging markets. Central banks in both India and Brazil fought rising inflation by raising interest rates.
The recovery of the U.S. housing market remained robust. New home sales and housing starts increased, though the pace of growth slowed late in the period. Although the unemployment rate gradually edged downward, it remained well above pre-recession levels. Moreover, the number of long-term unemployed individuals, including those who dropped out of the labor market entirely, remained high. Real income grew at a modest pace, but consumer spending remained weak, consumer confidence dropped sharply and personal savings rates slowed. Economic activity in the manufacturing sector expanded during the period, though the rate of growth slowed.
U.S. Gross Domestic Product1 growth increased each quarter during the period, expanding at a rate of 0.1% during the fourth quarter of 2012 and quickening to a rate of 2.8% in the third quarter of 2013, according to preliminary estimates.
Market Review
The period began with U.S. markets retreating slightly due to the political face-off over the “fiscal cliff” and concerns about ongoing turmoil related to eurozone sovereign debt.
Equities then regained momentum in the first quarter of 2013 and began a steady rally that persisted through the duration of the period with only a few brief interruptions. The strong performance of equities was undeterred by uncertainty about government policy and concerns that the onset of automatic budget cuts—known as sequestration—would undermine economic growth. A political compromise that avoided the direst consequences of the fiscal cliff, along with improvement in the housing market, helped buoy investor confidence and fuel gains in the equity markets.
During the middle of the period equity prices fell as investors anticipated an imminent decrease in central bank liquidity. Stocks rebounded after the Fed delayed tapering its bond-purchasing program, with the S&P 500 Index1 hitting a then-record high following the announcement. Equities ended the period in a rally that was spurred by the political deal that partially resolved the government shutdown and a second standoff over the debt ceiling.
Small- and mid-cap stocks outperformed large-cap stocks during the period, and emerging markets generally underperformed developed economies. The Russell 2000® Index1 of small-company stocks returned 36.28% and the MSCI Emerging Market Index1 of emerging market stocks returned 6.90%.
Stocks in developed economies rose. Japanese equities performed well due to optimism regarding its central bank’s ambitious monetary easing schedule, which aimed to double the size of the monetary base over the next two years. International stocks made strong gains, slightly outperforming U.S. markets. The S&P 500 Index of large-company U.S. stocks returned 27.18% for the 12 months through October 2013. That compared to a 27.40% return for the MSCI EAFE Index1 of international stocks in developed markets.
Rising interest rates, widening credit spreads and uncertainty about government policy resulted in weak performance in the U.S. fixed-income market during the period. Yields on U.S. Treasury bonds increased during the period, sending prices lower. Investment-grade corporate bonds also declined. Investors sought the more attractive yields offered by high-yield corporate bonds and high-yield municipal bonds, which were among the best-performing fixed-income sectors during the period. The Barclays U.S. Aggregate Bond Index1, which tracks the broad investment-grade fixed-income market, returned -1.08% for the 12 months through October, while the Barclays U.S. Corporate High-Yield Bond Index1 returned 8.87%. Fixed-income markets in Europe generated modest returns, while fixed-income in emerging markets ended the period significantly lower, despite a modest rebound in the final months of the period.
1 For additional information, please refer to the Glossary of Terms.
HSBC FAMILY OF FUNDS 5
| Portfolio Reviews (Unaudited) |
(Class A Shares, Class B Shares, Class C Shares and Class I Shares)
by Clark J. Winslow, CEO/Portfolio
Manager
Justin H. Kelly, CFA, CIO/Portfolio Manager
Patrick M. Burton, Managing Director/Portfolio
Manager
Winslow Capital Management, LLC
The HSBC Growth Fund (the “Fund”) seeks long-term growth of capital. Under normal market conditions, the Fund invests primarily in U.S. and foreign equity securities of high-quality companies with market capitalization generally in excess of $2 billion, which the subadviser believes have the potential to generate superior levels of long-term profitability and growth. The Fund utilizes a two-tier structure, commonly known as a “master-feeder” structure, in which the Fund invests all of its investable assets in the HSBC Growth Portfolio (the “Portfolio”). The Portfolio employs Winslow Capital Management, LLC as its subadviser.
Investment Concerns
Equity securities (stocks) are more volatile and carry more risk than other forms of investments, including investments in high-grade fixed income securities.
The growth investment style may fall out of favor in the marketplace and result in significant declines in the value of the Portfolio’s securities. Securities of companies considered to be growth investments may have rapid price swings in the event of earnings disappointments or during periods of market, political, regulatory and economic uncertainty.
For a complete description of these and other risks associated with investment in a mutual fund, please refer to the Fund’s prospectus.
Market Commentary
The Fund returned 32.17%* (without sales charge) for the Class A Shares and 32.49%* for the Class I Shares for the year ended October 31, 2013. That compared to a 28.30% total return for the Russell 1000® Growth Index1, the Fund’s primary performance benchmark, and a 29.24% total return for the Lipper Large-Cap Growth Funds Average1.
Portfolio Performance
Stocks performed well during the period as investors gained confidence that the U.S. economy was not headed back into recession and that the risk of sovereign default in Portugal, Spain, and Italy was receding. As concerns about systematic risk waned, company fundamentals returned as a main driver of equity prices. Stable, dividend-paying companies that had performed well in the riskier environment appeared relatively overvalued to the Fund’s portfolio managers later in the period. As a result, investors began to favor shares of smaller, growth-oriented companies, which outperformed their larger counterparts during the final four months of the period.
In this environment, the Fund outperformed its Russell benchmark primarily due to stock selection in the consumer discretionary and information technology sectors. For example, an investment in an online travel company that posted strong earnings contributed to the gains in the portfolio’s consumer discretionary holdings. Similarly, a cloud-based relationship company that reported strong earnings boosted performance among the portfolio’s information technology holdings.†
Moreover, the Fund benefited from moves made during the period to increase holdings of smaller, growth-oriented companies in anticipation of declining systematic risk. Additionally, a long-standing decision to underweight consumer staples boosted the Fund’s performance when the sector suffered as investors shifted away from defensive investments.†
However, sector-weighting decisions detracted from the Fund’s performance. For instance, an overweight position in the financial sector hurt the Fund when that sector underperformed. Stock selection in the financial and industrial sectors also detracted from the Fund’s returns. For example, legal risks caused an investment in a financial content and analytics provider to underperform, while an investment in a shipping and delivery company underperformed due to slower than anticipated overnight business. Both stocks were sold during the period.†
| * |
The recent appreciation in the stock market has helped to produce short-term returns that are not typical and may not continue in the future. Because of ongoing market volatility, fund performance may be subject to substantial short-term changes. | |
| † |
Portfolio composition is subject to change. | |
| 1 |
For additional information, please refer to the Glossary of Terms. |
Past performance does not guarantee future results. The performance data quoted represents past performance and current returns may be lower or higher. Total return figures include change in share price, reinvestment of dividends and capital gains and do not reflect taxes that a shareholder would pay on Fund distributions or on the redemption of Fund shares. Investment return and principal value will fluctuate so that an investor’s shares, when redeemed may be worth more or less than the original cost. To obtain performance information current to the most recent month end, please call 1-800-782-8183.
6 HSBC FAMILY OF FUNDS
| Portfolio Reviews (Unaudited) | |
| HSBC Growth Fund |
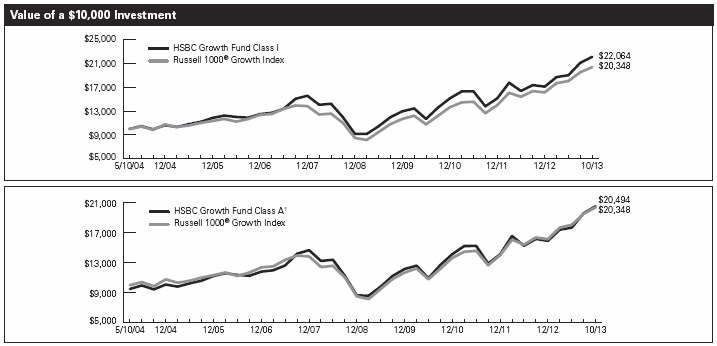
The charts above represent a historical since inception performance comparison of a hypothetical $10,000 investment in the indicated share class versus a similar investment in the Fund’s benchmark and represents the reinvestment of dividends and capital gains in the Fund.
| Average Annual | Expense | |||||||||||||
| Fund Performance | Total Return (%) | Ratio (%)6 | ||||||||||||
| Since | ||||||||||||||
| As of October 31, 2013 | Inception Date | 1 Year | 5 Year | Inception | Gross | Net | ||||||||
| HSBC Growth Fund Class A1 | 5/7/045 | 25.64 | 9 | 16.06 | 7.87 | 1.40 | 1.20 | |||||||
| HSBC Growth Fund Class B2 | 5/7/045 | 27.16 | 9 | 16.36 | 7.93 | 2.15 | 1.95 | |||||||
| HSBC Growth Fund Class C3 | 5/7/045 | 30.15 | 9 | 16.36 | 7.64 | 2.15 | 1.95 | |||||||
| HSBC Growth Fund Class I | 5/7/045 | 32.49 | 9 | 17.55 | 8.71 | 1.15 | 0.95 | |||||||
| Russell 1000® Growth Index4 | — | 28.30 | 17.51 | 7.79 | 7 | N/A | N/A | |||||||
| Lipper Large-Cap Growth Funds Average4 | — | 29.24 | 15.72 | 7.05 | 8 | N/A | N/A | |||||||
Past performance does not guarantee future results. The performance data quoted represents past performance and current returns may be lower or higher. Total return figures include change in share price, reinvestment of dividends and capital gains and do not reflect the taxes that a shareholder would pay on Fund distributions or on the redemption of Fund shares. Investment return and principal value will fluctuate so that an investor’s shares, when redeemed may be worth more or less than the original cost. To obtain performance information current to the most recent month end, please call 1-800-782-8183.
The performance above reflects any fee waivers that have been in effect during the applicable periods, as well as any expense reimbursements that have periodically been made. Absent such waivers and reimbursements, returns would have been lower. Currently, contractual fee waivers are in effect for the Fund through March 1, 2014.
Certain returns shown include monies received by the Portfolio, in which the Fund invests, in respect of one-time class action settlements and a one-time reimbursement from HSBC Global Asset Management (USA) Inc. (the “Adviser”) to the Fund related to past marketing arrangements. As a result, the Fund’s total returns for those periods were higher than they would have been had the Portfolio and the Fund not received the payments. Investment in initial public offerings during the current fiscal year ended October 31, 2013 have benefited the Fund’s overall performance by approximately 0.06%. This effect on performance is not typical and may not continue in the future.
| 1 | Reflects the maximum sales charge of 5.00%. | |
| 2 | Reflects the applicable contingent deferred sales charge, maximum of 4.00%. | |
| 3 | Reflects the applicable contingent deferred sales charge, maximum of 1.00%. | |
| 4 | For additional information, please refer to the Glossary of Terms. | |
| 5 | The HSBC Growth Fund was initially offered for purchase effective May 7, 2004; however, no shareholder activity occurred until May 10, 2004. | |
| 6 | Reflects the expense ratios as reported in the prospectus dated February 28, 2013. The Adviser has entered into a contractual expense limitation agreement with the Fund under which it will limit total expenses of the Fund (excluding interest, taxes, brokerage commissions, extraordinary expenses and estimated indirect expenses attributable to the Fund’s investments in investment companies) to an annual rate of 1.20%, 1.95%, 1.95% and 0.95% for Class A Shares, Class B Shares, Class C Shares and Class I Shares, respectively. The expense limitation shall be in effect until March 1, 2014. Additional information pertaining to the October 31, 2013 expense ratios can be found in the financial highlights. | |
| 7 | Return for the period May 10, 2004 to October 31, 2013. | |
| 8 | Return for the period April 30, 2004 to October 31, 2013. | |
| 9 | The recent appreciation in the stock market has helped to produce short-term returns that are not typical and may not continue in the future. Because of ongoing market volatility, fund performance may be subject to substantial short-term changes. |
The Fund’s performance is measured against the Russell 1000® Growth Index, an unmanaged index that measures the performance of the large-cap growth segment of the U.S. equity universe. It includes those Russell 1000 companies with higher price-to-book ratios and higher forecasted growth values. The performance of the index does not reflect the deduction of expenses associated with a mutual fund, such as investment management and fund accounting fees. The Fund’s performance reflects the deduction of fees for these value-added services. Investors cannot invest directly in an index.
HSBC FAMILY OF FUNDS 7
| Portfolio Reviews (Unaudited) |
(Class I Shares)
HSBC Opportunity Fund
(Class A Shares, Class B Shares and Class C Shares)
by William A. Muggia, Committee
Lead/Portfolio Manager
Ethan J. Myers, CFA, Portfolio Manager
John M.
Montgomery, Portfolio Manager
Hamlen Thompson, Portfolio Manager
Bruce N.
Jacobs, CFA, Portfolio Manager
Westfield Capital Management Company,
L.P.
The HSBC Opportunity Fund and HSBC Opportunity Fund (Advisor) (collectively the “Fund”) seek long-term growth of capital by investing in equity securities of small- and mid-cap companies. Small- and mid-cap companies generally are defined as those that have market capitalizations within the range of market capitalizations represented in the Russell 2500™ Growth Index. The Fund may also invest in equity securities of larger, more established companies and may invest up to 20% of its assets in securities of foreign companies. The Fund employs a two-tier structure, commonly referred to as a “master-feeder” structure, in which the Fund invests all of its investable assets in the HSBC Opportunity Portfolio (the “Portfolio”). The Portfolio employs Westfield Capital Management Company, L.P. as its subadviser.
Investment Concerns
Equity securities (stocks) are more volatile and carry more risk than other forms of investments, including investments in high-grade fixed income securities.
Small- to mid-capitalization funds typically carry additional risks since smaller companies generally have a higher risk of failure, and historically, their stocks have experienced a greater degree of market volatility than stocks on average.
The growth investment style may fall out of favor in the marketplace and result in significant declines in the value of the Portfolio’s securities. Securities of companies considered to be growth investments may have rapid price swings in the event of earnings disappointments or during periods of market, political, regulatory and economic uncertainty.
There are risks associated with investing in foreign companies, such as erratic market conditions, economic and political instability and fluctuations in currency and exchange rates.
For a complete description of these and other risks associated with investment in a mutual fund, please refer to the Fund’s prospectus.
Market Commentary
For the year ended October 31, 2013, the Class I Shares of the HSBC Opportunity Fund (Advisor) produced a 34.70%* total return, and the Class A Shares of the Fund produced a 34.02%* total return (without sales charge). The Russell 2500™ Growth Index1, the Fund’s primary performance benchmark, and the Lipper Mid-Cap Growth Funds Average1 returned 37.60% and 32.81%, respectively.
Portfolio Performance
U.S. equities continued to post strong returns for the period as investors brushed off concerns about interest rate volatility and worries about a potential U.S. government shutdown. The continuing stimulus efforts by the Federal Reserve, as well as signs of a gradually improving employment picture, helped boost investor confidence during the period. In this environment, small-cap stocks outperformed their large-cap counterparts. The information technology and financial sectors benefited the most from this growing confidence among investors, and were two of the strongest contributors to the Fund’s absolute returns.
The Fund lagged its benchmark for the period. Stock selection in the Fund’s energy holdings was a major detractor. In particular, the Fund was hurt by holdings of an oil field services company that underperformed when it missed analysts’ earnings expectations. The Fund’s sub-sector weighting in consumer discretionary further detracted from relative performance. An overweight position in the apparel retail sub-industry dragged on relative returns, as retailers were hurt by shifting consumer confidence during the period. The Fund was also hurt by underweight positions in Internet retailers and automobile manufacturers, which performed relatively well during the period.†
However, strong stock selection in the information technology and materials sectors helped offset a portion of the Fund’s underperformance. Shares of a payment processor that consistently exceeded earnings expectations provided the biggest boost to the Fund’s relative performance. In the materials sector, stock selection across multiple subsectors—namely paper packaging, commodity chemicals, and fertilizers and agricultural chemicals—contributed to the Fund’s relative performance. In particular, holdings of a cardboard packaging manufacturer contributed positively as that company executed a strategic acquisition near the end of the period, which helped boost its earnings.†
Furthermore, holdings of a specialty retail store and consumer electronics retailer helped offset some of the negative effects of sector weighting in the consumer discretionary sector. An underweight position in the gold sub-industry helped to boost the Fund’s relative performance, since gold prices fell, as investors grew more confident in the sustainability of the economic recovery.†
| * |
The recent appreciation in the stock market has helped to produce short-term returns that are not typical and may not continue in the future. Because of ongoing market volatility, fund performance may be subject to substantial short-term changes. | |
| † |
Portfolio composition is subject to change. | |
| 1 |
For additional information, please refer to the Glossary of Terms. |
Past performance does not guarantee future results. The performance data quoted represents past performance and current returns may be lower or higher. Total return figures include change in share price, reinvestment of dividends and capital gains and do not reflect taxes that a shareholder would pay on Fund distributions or on the redemption of Fund shares. Investment return and principal value will fluctuate so that an investor’s shares, when redeemed may be worth more or less than the original cost. To obtain performance information current to the most recent month end, please call 1-800-782-8183.
8 HSBC FAMILY OF FUNDS
| Portfolio Reviews (Unaudited) |
HSBC Opportunity Fund |
![]()
The charts above represent a historical 10-year performance comparison of a hypothetical $10,000 investment in the indicated share class versus a similar investment in the Fund’s benchmark and represents the reinvestment of dividends and capital gains in the Fund.
| Average Annual | Expense | |||||||||||||
| Fund Performance | Total Return (%) | Ratio (%)5 | ||||||||||||
| As of October 31, 2013 | Inception Date | 1 Year | 5 Year | 10 Year | Gross | Net | ||||||||
| HSBC Opportunity Fund Class A1 | 9/23/96 | 27.356 | 18.54 | 10.75 | 2.20 | 1.65 | ||||||||
| HSBC Opportunity Fund Class B2 | 1/6/98 | 29.106 | 18.84 | 10.82 | 2.95 | 2.40 | ||||||||
| HSBC Opportunity Fund Class C3 | 11/4/98 | 32.156 | 18.86 | 10.51 | 2.95 | 2.40 | ||||||||
| HSBC Opportunity Fund Class I† | 9/3/96 | 34.706 | 20.36 | 11.79 | 1.08 | 1.08 | ||||||||
| Russell 2500™ Growth Index4 | — | 37.60 | 20.87 | 9.85 | N/A | N/A | ||||||||
| Lipper Mid-Cap Growth Funds Average4 | — | 32.81 | 18.15 | 8.69 | N/A | N/A | ||||||||
Past performance does not guarantee future results. The performance data quoted represents past performance and current returns may be lower or higher. Total return figures include change in share price, reinvestment of dividends and capital gains and do not reflect the taxes that a shareholder would pay on Fund distributions or on the redemption of Fund shares. Investment return and principal value will fluctuate so that an investor’s shares, when redeemed may be worth more or less than the original cost. To obtain performance information current to the most recent month end, please call 1-800-782-8183.
The performance above reflects any fee waivers that have been in effect during the applicable periods, as well as any expense reimbursements that have periodically been made. Absent such waivers and reimbursements, returns would have been lower. Currently, contractual fee waivers are in effect for the Fund through March 1, 2014 for Class A Shares, Class B Shares and Class C Shares.
Certain returns shown include monies received by the Portfolio, in which the Fund invests, in respect of one-time class action settlements and a one-time reimbursement from HSBC Global Asset Management (USA) Inc. (the “Adviser”) to the Fund related to past marketing arrangements. As a result, the Fund’s total returns for those periods were higher than they would have been had the Portfolio and the Fund not received the payments.
| † | The Class I Shares are issued by a series of HSBC Advisor Funds Trust, also named the HSBC Opportunity Fund. | |
| 1 | Reflects the maximum sales charge of 5.00%. | |
| 2 | Reflects the applicable contingent deferred sales charge, maximum of 4.00%. | |
| 3 | Reflects the applicable contingent deferred sales charge, maximum of 1.00%. | |
| 4 | For additional information, please refer to the Glossary of Terms. | |
| 5 |
Reflects the expense ratios as reported in the prospectus dated February 28, 2013. The Adviser has entered into a contractual expense limitation agreement with the Fund under which it will limit total expenses of the Fund (excluding interest, taxes, brokerage commissions, extraordinary expenses and estimated indirect expenses attributable to the Fund’s investments in investment companies other than the Portfolio) to an annual rate of 1.65%, 2.40%, and 2.40% for Class A Shares, Class B Shares, and Class C Shares, respectively. The expense limitation shall be in effect until March 1, 2014. Additional information pertaining to the October 31, 2013 expense ratios can be found in the financial highlights. | |
| 6 |
The recent appreciation in the stock market has helped to produce short-term returns that are not typical and may not continue in the future. Because of ongoing market volatility, fund performance may be subject to substantial short-term changes. |
The Fund’s performance is measured against the Russell 2500™ Growth Index, an unmanaged index that measures the performance of the small- to mid-cap growth segment of the U.S. equity universe. It includes those Russell 2500 companies with higher price-to-book ratios and higher forecasted growth values. The performance for the index does not reflect the deduction of expenses associated with a mutual fund, such as investment management and fund accounting fees. The Fund’s performance reflects the deduction of fees for these value-added services. Investors cannot invest directly in an index.
HSBC FAMILY OF FUNDS 9
| Portfolio Reviews |
| Portfolio Composition* |
| October 31, 2013 (Unaudited) |
| HSBC Growth Portfolio | ||
| Percentage of | ||
| Investment Allocation | Investments at Value (%) | |
| Internet Software & Services | 9.4 | |
| Biotechnology | 9.1 | |
| Internet & Catalog Retail | 6.8 | |
| IT Services | 6.4 | |
| Specialty Retail | 5.9 | |
| Media | 5.0 | |
| Chemicals | 4.1 | |
| Oil, Gas & Consumable Fuels | 4.1 | |
| Road & Rail | 4.1 | |
| Hotels, Restaurants & Leisure | 3.8 | |
| Capital Markets | 3.7 | |
| Software | 3.4 | |
| Aerospace & Defense | 3.2 | |
| Textiles, Apparel & Luxury Goods | 3.2 | |
| Computers & Peripherals | 3.1 | |
| Semiconductors & Semiconductor | ||
| Equipment | 3.1 | |
| Machinery | 2.7 | |
| Food & Staples Retailing | 2.4 | |
| Pharmaceuticals | 2.1 | |
| Health Care Technology | 1.7 | |
| Communications Equipment | 1.5 | |
| Real Estate Investment Trusts (REITs) | 1.5 | |
| Energy Equipment & Services | 1.5 | |
| Wireless Telecommunication Services | 1.4 | |
| Diversified Financial Services | 1.2 | |
| Auto Components | 1.2 | |
| Personal Products | 1.1 | |
| Trading Companies & Distributors | 1.0 | |
| Health Care Providers & Services | 0.9 | |
| Airlines | 0.7 | |
| Investment Companies | 0.7 | |
| 100.0 | ||
| HSBC Opportunity Portfolio | ||
| Percentage of | ||
| Investment Allocation | Investments at Value (%) | |
| Specialty Retail | 8.1 | |
| IT Services | 6.8 | |
| Chemicals | 6.2 | |
| Household Durables | 5.5 | |
| Oil, Gas & Consumable Fuels | 5.1 | |
| Biotechnology | 5.0 | |
| Health Care Equipment & Supplies | 3.7 | |
| Life Sciences Tools & Services | 3.4 | |
| Trading Companies & Distributors | 3.3 | |
| Software | 3.2 | |
| Aerospace & Defense | 3.1 | |
| Semiconductors & Semiconductor | ||
| Equipment | 3.0 | |
| Investment Companies | 2.9 | |
| Commercial Banks | 2.8 | |
| Containers & Packaging | 2.7 | |
| Pharmaceuticals | 2.7 | |
| Electrical Equipment | 2.7 | |
| Internet Software & Services | 2.6 | |
| Machinery | 2.1 | |
| Professional Services | 2.1 | |
| Insurance | 2.0 | |
| Energy Equipment & Services | 1.9 | |
| Health Care Providers & Services | 1.9 | |
| Hotels, Restaurants & Leisure | 1.9 | |
| Media | 1.6 | |
| Commercial Services & Supplies | 1.6 | |
| Capital Markets | 1.6 | |
| Diversified Consumer Services | 1.5 | |
| Auto Components | 1.5 | |
| Road & Rail | 1.3 | |
| Distributors | 1.1 | |
| Real Estate Investment Trusts (REITs) | 1.1 | |
| Real Estate Management & | ||
| Development | 1.1 | |
| Health Care Technology | 0.8 | |
| Construction Materials | 0.8 | |
| Communications Equipment | 0.7 | |
| Electronic Equipment, | ||
| Instruments & Components | 0.6 | |
| 100.0 | ||
| * | Portfolio composition is subject to change. |
10 HSBC FAMILY OF FUNDS
HSBC FAMILY OF FUNDS
Statements of Assets and Liabilities — as of October 31, 2013
| Opportunity | ||||||||||||||||||
| Growth | Opportunity | Fund | ||||||||||||||||
| Fund | Fund | (Advisor) | ||||||||||||||||
| Assets: | ||||||||||||||||||
| Investments in Affiliated Portfolios | $ | 82,541,055 | $ | 15,489,119 | $ | 208,208,427 | ||||||||||||
| Receivable for capital shares issued | 70,519 | 4,512 | 204,270 | |||||||||||||||
| Receivable from Investment Adviser | — | 5,872 | — | |||||||||||||||
| Prepaid expenses | 13,198 | 5,280 | 6,891 | |||||||||||||||
| Total Assets | 82,624,772 | 15,504,783 | 208,419,588 | |||||||||||||||
| Liabilities: | ||||||||||||||||||
| Payable for capital shares redeemed | 81,215 | 25,608 | 46,940 | |||||||||||||||
| Accrued expenses and other liabilities: | ||||||||||||||||||
| Investment Management | 22,883 | — | — | |||||||||||||||
| Administration | 1,730 | 320 | 4,306 | |||||||||||||||
| Distribution | 700 | 760 | — | |||||||||||||||
| Shareholder Servicing | 2,985 | 6,919 | — | |||||||||||||||
| Compliance Services | 8 | 1 | 24 | |||||||||||||||
| Accounting | — | — | 1 | |||||||||||||||
| Transfer Agent | 15,719 | 8,174 | 12,353 | |||||||||||||||
| Trustee | 92 | 21 | 322 | |||||||||||||||
| Other | 19,910 | 13,124 | 34,504 | |||||||||||||||
| Total Liabilities | 145,242 | 54,927 | 98,450 | |||||||||||||||
| Net Assets | $ | 82,479,530 | $ | 15,449,856 | $ | 208,321,138 | ||||||||||||
| Composition of Net Assets: | ||||||||||||||||||
| Capital | 47,816,585 | 10,080,559 | 139,710,690 | |||||||||||||||
| Accumulated net investment income (loss) | (99,109 | ) | 2,125 | 152,233 | ||||||||||||||
| Accumulated net realized gains (losses) from investments | 13,033,403 | 1,631,777 | 21,498,432 | |||||||||||||||
| Unrealized appreciation/depreciation on investments | 21,728,651 | 3,735,395 | 46,959,783 | |||||||||||||||
| Net Assets | $ | 82,479,530 | $ | 15,449,856 | $ | 208,321,138 | ||||||||||||
| Net Assets: | ||||||||||||||||||
| Class A Shares | $ | 12,760,503 | $ | 14,258,647 | $ | — | ||||||||||||
| Class B Shares | 492,917 | 480,139 | — | |||||||||||||||
| Class C Shares | 602,299 | 711,070 | — | |||||||||||||||
| Class I Shares | 68,623,811 | — | 208,321,138 | |||||||||||||||
| $ | 82,479,530 | $ | 15,449,856 | $ | 208,321,138 | |||||||||||||
| Shares Outstanding | ||||||||||||||||||
| ($0.001 par value, unlimited number of shares authorized): | ||||||||||||||||||
| Class A Shares | 587,363 | 1,115,750 | — | |||||||||||||||
| Class B Shares | 25,459 | 48,629 | — | |||||||||||||||
| Class C Shares | 30,900 | 70,141 | — | |||||||||||||||
| Class I Shares | 3,099,018 | — | 12,062,607 | |||||||||||||||
| Net Asset Value, Offering Price and Redemption Price per share: | ||||||||||||||||||
| Class A Shares | $ | 21.73 | $ | 12.78 | $ | — | ||||||||||||
| Class B Shares(a) | $ | 19.36 | $ | 9.87 | $ | — | ||||||||||||
| Class C Shares(a) | $ | 19.49 | $ | 10.14 | $ | — | ||||||||||||
| Class I Shares | $ | 22.14 | $ | — | $ | 17.27 | ||||||||||||
| Maximum Sales Charge - Class A Shares | 5.00 | % | 5.00 | % | — | % | ||||||||||||
| Maximum Offering Price per share | ||||||||||||||||||
| (Net Asset Value/(100%-maximum sales charge)) - Class A Shares | $ | 22.87 | $ | 13.45 | $ | — | ||||||||||||
| (a) | Redemption Price per share varies by length of time shares are held. |
| See notes to financial statements. | HSBC FAMILY OF FUNDS | 11 |
HSBC FAMILY OF FUNDS
Statements of Operations — For the year ended October 31, 2013
| Opportunity | ||||||||||||||||||
| Growth | Opportunity | Fund | ||||||||||||||||
| Fund | Fund | (Advisor) | ||||||||||||||||
| Investment Income: | ||||||||||||||||||
| Investment Income from Affiliated Portfolios | $ | 877,071 | $ | 138,747 | $ | 1,795,937 | ||||||||||||
| Expenses from Affiliated Portfolios | (525,304 | ) | (115,917 | ) | (1,500,945 | ) | ||||||||||||
| Total Investment Income | 351,767 | 22,830 | 294,992 | |||||||||||||||
| Expenses: | ||||||||||||||||||
| Administration: | ||||||||||||||||||
| Class A Shares | 2,917 | 2,944 | — | |||||||||||||||
| Class B Shares | 130 | 119 | — | |||||||||||||||
| Class C Shares | 137 | 182 | — | |||||||||||||||
| Class I Shares | 15,792 | — | 42,091 | |||||||||||||||
| Distribution: | ||||||||||||||||||
| Class B Shares | 3,967 | 3,603 | — | |||||||||||||||
| Class C Shares | 4,117 | 5,447 | — | |||||||||||||||
| Shareholder Servicing: | ||||||||||||||||||
| Class A Shares | 29,132 | 28,974 | — | |||||||||||||||
| Class B Shares | 1,323 | 1,202 | — | |||||||||||||||
| Class C Shares | 1,372 | 1,808 | — | |||||||||||||||
| Accounting | 23,949 | 18,950 | 9,001 | |||||||||||||||
| Audit | 16,973 | 17,915 | 17,998 | |||||||||||||||
| Compliance Services | 649 | 109 | 1,426 | |||||||||||||||
| Printing | 77 | 2,382 | 6,617 | |||||||||||||||
| Transfer Agent | 96,259 | 50,527 | 64,598 | |||||||||||||||
| Trustee | 1,958 | 334 | 4,273 | |||||||||||||||
| Registration fees | 35,000 | 15,867 | 14,920 | |||||||||||||||
| Other | 11,412 | 4,676 | 20,266 | |||||||||||||||
| Total expenses before fee reductions | 245,164 | 155,039 | 181,190 | |||||||||||||||
| Fees voluntarily reduced by Investment Adviser | — | (13,058 | ) | — | ||||||||||||||
| Fees contractually reduced by Investment Adviser | (5,267 | ) | (46,445 | ) | — | |||||||||||||
| Net Expenses | 239,897 | 95,536 | 181,190 | |||||||||||||||
| Net Investment Income (Loss) | 111,870 | (72,706 | ) | 113,802 | ||||||||||||||
| Net Realized/Unrealized Gains (Losses) from Investments: (a) | ||||||||||||||||||
| Net realized gains (losses) from investment securities | 9,661,220 | 1,860,103 | 22,059,925 | |||||||||||||||
| Change in unrealized appreciation/depreciation on investments | 11,851,661 | 2,027,660 | 28,194,578 | |||||||||||||||
| Net realized/unrealized gains (losses) from investments | 21,512,881 | 3,887,763 | 50,254,503 | |||||||||||||||
| Change In Net Assets Resulting From Operations | $ | 21,624,751 | $ | 3,815,057 | $ | 50,368,305 | ||||||||||||
| (a) | Represents amounts allocated from the respective Affiliated Portfolios. |
| 12 | HSBC FAMILY OF FUNDS | See notes to financial statements. |
HSBC FAMILY OF FUNDS
Statements of Changes in Net Assets
| Growth Fund | Opportunity Fund | |||||||||||||||||||||
| For the | For the | For the | For the | |||||||||||||||||||
| year ended | year ended | year ended | year ended | |||||||||||||||||||
| October 31, 2013 | October 31, 2012 | October 31, 2013 | October 31, 2012 | |||||||||||||||||||
| Investment Activities: | ||||||||||||||||||||||
| Operations: | ||||||||||||||||||||||
| Net investment income (loss) | $ | 111,870 | $ | (133,004 | ) | $ | (72,706 | ) | $ | (67,015 | ) | |||||||||||
| Net realized gains (losses) from investments | 9,661,220 | 8,364,394 | 1,860,103 | 786,559 | ||||||||||||||||||
| Change in unrealized appreciation/depreciation | ||||||||||||||||||||||
| on investments | 11,851,661 | (3,332,031 | ) | 2,027,660 | 610,433 | |||||||||||||||||
| Change in net assets resulting from operations | 21,624,751 | 4,899,359 | 3,815,057 | 1,329,977 | ||||||||||||||||||
| Dividends: | ||||||||||||||||||||||
| Net investment income: | ||||||||||||||||||||||
| Class I Shares | (77,975 | ) | — | — | — | |||||||||||||||||
| Net realized gains: | ||||||||||||||||||||||
| Class A Shares | (789,480 | ) | — | (613,652 | ) | (1,598,939 | ) | |||||||||||||||
| Class B Shares | (47,389 | ) | — | (37,922 | ) | (93,318 | ) | |||||||||||||||
| Class C Shares | (38,688 | ) | — | (41,509 | ) | (76,609 | ) | |||||||||||||||
| Class I Shares | (4,180,730 | ) | — | — | — | |||||||||||||||||
| Change in net assets resulting from shareholder dividends | (5,134,262 | ) | — | (693,083 | ) | (1,768,866 | ) | |||||||||||||||
| Change in net assets resulting from capital transactions | (4,356,680 | ) | (8,338,642 | ) | 1,079,236 | (429,918 | ) | |||||||||||||||
| Change in net assets | 12,133,809 | (3,439,283 | ) | 4,201,210 | (868,807 | ) | ||||||||||||||||
| Net Assets: | ||||||||||||||||||||||
| Beginning of period | 70,345,721 | 73,785,004 | 11,248,646 | 12,117,453 | ||||||||||||||||||
| End of period | $ | 82,479,530 | $ | 70,345,721 | $ | 15,449,856 | $ | 11,248,646 | ||||||||||||||
| Accumulated net investment income (loss) | $ | (99,109 | ) | $ | (133,004 | ) | $ | 2,125 | $ | (49,006 | ) | |||||||||||
| See notes to financial statements. | HSBC FAMILY OF FUNDS | 13 |
HSBC FAMILY OF FUNDS
Statements of Changes in Net Assets (continued)
| Growth Fund | Opportunity Fund | |||||||||||||||||||||
| For the | For the | For the | For the | |||||||||||||||||||
| year ended | year ended | year ended | year ended | |||||||||||||||||||
| October 31, 2013 | October 31, 2012 | October 31, 2013 | October 31, 2012 | |||||||||||||||||||
| CAPITAL TRANSACTIONS: | ||||||||||||||||||||||
| Class A Shares: | ||||||||||||||||||||||
| Proceeds from shares issued | $ | 513,267 | $ | 871,476 | $ | 3,386,291 | $ | 772,149 | ||||||||||||||
| Dividends reinvested | 760,894 | — | 601,275 | 1,562,653 | ||||||||||||||||||
| Value of shares redeemed | (2,349,534 | ) | (5,909,138 | ) | (2,790,702 | ) | (2,900,653 | ) | ||||||||||||||
| Class A Shares capital transactions | (1,075,373 | ) | (5,037,662 | ) | 1,196,864 | (565,851 | ) | |||||||||||||||
| Class B Shares: | ||||||||||||||||||||||
| Proceeds from shares issued | 18,851 | 111,305 | 22,345 | 69,230 | ||||||||||||||||||
| Dividends reinvested | 47,204 | — | 37,922 | 93,292 | ||||||||||||||||||
| Value of shares redeemed | (290,302 | ) | (516,256 | ) | (182,066 | ) | (160,269 | ) | ||||||||||||||
| Class B Shares capital transactions | (224,247 | ) | (404,951 | ) | (121,799 | ) | 2,253 | |||||||||||||||
| Class C Shares: | ||||||||||||||||||||||
| Proceeds from shares issued | 51,639 | 261,486 | 365,351 | 112,981 | ||||||||||||||||||
| Dividends reinvested | 38,495 | — | 41,448 | 76,317 | ||||||||||||||||||
| Value of shares redeemed | (81,414 | ) | (42,587 | ) | (402,628 | ) | (55,618 | ) | ||||||||||||||
| Class C Shares capital transactions | 8,720 | 218,899 | 4,171 | 133,680 | ||||||||||||||||||
| Class I Shares: | ||||||||||||||||||||||
| Proceeds from shares issued | 9,187,688 | 17,658,774 | — | — | ||||||||||||||||||
| Dividends reinvested | 4,246,858 | — | — | — | ||||||||||||||||||
| Value of shares redeemed | (16,500,326 | ) | (20,773,702 | ) | — | — | ||||||||||||||||
| Class I Shares capital transactions | (3,065,780 | ) | (3,114,928 | ) | — | — | ||||||||||||||||
| Change in net assets resulting from capital transactions | $ | (4,356,680 | ) | $ | (8,338,642 | ) | $ | 1,079,236 | $ | (429,918 | ) | |||||||||||
| SHARE TRANSACTIONS: | ||||||||||||||||||||||
| Class A Shares: | ||||||||||||||||||||||
| Issued | 27,668 | 49,445 | 295,105 | 77,300 | ||||||||||||||||||
| Reinvested | 45,103 | — | 59,888 | 175,974 | ||||||||||||||||||
| Redeemed | (125,574 | ) | (334,366 | ) | (246,880 | ) | (293,635 | ) | ||||||||||||||
| Change in Class A Shares | (52,803 | ) | (284,921 | ) | 108,113 | (40,361 | ) | |||||||||||||||
| Class B Shares: | ||||||||||||||||||||||
| Issued | 1,163 | 6,924 | 2,603 | 8,496 | ||||||||||||||||||
| Reinvested | 3,120 | — | 4,862 | 13,196 | ||||||||||||||||||
| Redeemed | (17,588 | ) | (31,749 | ) | (21,126 | ) | (20,335 | ) | ||||||||||||||
| Change in Class B Shares | (13,305 | ) | (24,825 | ) | (13,661 | ) | 1,357 | |||||||||||||||
| Class C Shares: | ||||||||||||||||||||||
| Issued | 3,117 | 16,065 | 40,827 | 14,173 | ||||||||||||||||||
| Reinvested | 2,526 | — | 5,175 | 10,526 | ||||||||||||||||||
| Redeemed | (4,667 | ) | (2,629 | ) | (42,252 | ) | (6,916 | ) | ||||||||||||||
| Change in Class C Shares | 976 | 13,436 | 3,750 | 17,783 | ||||||||||||||||||
| Class I Shares: | ||||||||||||||||||||||
| Issued | 491,350 | 981,882 | — | — | ||||||||||||||||||
| Reinvested | 247,171 | — | — | — | ||||||||||||||||||
| Redeemed | (859,037 | ) | (1,163,041 | ) | — | — | ||||||||||||||||
| Change in Class I Shares | (120,516 | ) | (181,159 | ) | — | — | ||||||||||||||||
| 14 | HSBC FAMILY OF FUNDS | See notes to financial statements. |
HSBC FAMILY OF FUNDS
Statements of Changes in Net Assets (continued)
| Opportunity Fund (Advisor) | |||||||||||
| For the | For the | ||||||||||
| year ended | year ended | ||||||||||
| October 31, 2013 | October 31, 2012 | ||||||||||
| Investment Activities: | |||||||||||
| Operations: | |||||||||||
| Net investment income (loss) | $ | 113,802 | $ | (19,624 | ) | ||||||
| Net realized gains (losses) from investments | 22,059,925 | 7,509,207 | |||||||||
| Change in unrealized appreciation/depreciation on investments | 28,194,578 | 7,623,444 | |||||||||
| Change in net assets resulting from operations | 50,368,305 | 15,113,027 | |||||||||
| Dividends: | |||||||||||
| Net realized gains: | |||||||||||
| Class I Shares | (6,472,825 | ) | (18,686,312 | ) | |||||||
| Change in net assets resulting from shareholder dividends | (6,472,825 | ) | (18,686,312 | ) | |||||||
| Change in net assets resulting from capital transactions | 29,328,028 | 16,653,597 | |||||||||
| Change in net assets | 73,223,508 | 13,080,312 | |||||||||
| Net Assets: | |||||||||||
| Beginning of period | 135,097,630 | 122,017,318 | |||||||||
| End of period | $ | 208,321,138 | $ | 135,097,630 | |||||||
| Accumulated net investment income (loss) | $ | 152,233 | $ | 38,431 | |||||||
| See notes to financial statements. | HSBC FAMILY OF FUNDS | 15 |
HSBC FAMILY OF FUNDS
Statements of Changes in Net Assets (continued)
| Opportunity Fund (Advisor) | |||||||||||
| For the | For the | ||||||||||
| year ended | year ended | ||||||||||
| October 31, 2013 | October 31, 2012 | ||||||||||
| CAPITAL TRANSACTIONS: | |||||||||||
| Class I Shares: | |||||||||||
| Proceeds from shares issued | $ | 43,552,792 | $ | 20,813,526 | |||||||
| Dividends reinvested | 6,463,988 | 17,155,964 | |||||||||
| Value of shares redeemed | (20,688,752 | ) | (21,315,893 | ) | |||||||
| Class I Shares capital transactions | 29,328,028 | 16,653,597 | |||||||||
| Change in net assets resulting from capital transactions | $ | 29,328,028 | $ | 16,653,597 | |||||||
| SHARE TRANSACTIONS: | |||||||||||
| Class I Shares: | |||||||||||
| Issued | 2,895,000 | 1,554,122 | |||||||||
| Reinvested | 478,814 | 1,465,070 | |||||||||
| Redeemed | (1,392,961 | ) | (1,642,101 | ) | |||||||
| Change in Class I Shares | 1,980,853 | 1,377,091 | |||||||||
| 16 | HSBC FAMILY OF FUNDS | See notes to financial statements. |
| HSBC GROWTH FUND |
| Financial Highlights |
Selected data for a share outstanding throughout the periods indicated.*
|
Investment Activities |
Dividends |
Ratios/Supplementary Data | ||||||||||||||||||||||||||||||||||||||||||||||||||||||||||||
|
Net
Asset |
Net |
Net Realized |
Total from
|
Net |
Net Realized |
Total |
Net |
Total |
Net |
Ratio |
Ratio of Net
|
Ratios |
Portfolio
| |||||||||||||||||||||||||||||||||||||||||||||||||
| CLASS A SHARES | ||||||||||||||||||||||||||||||||||||||||||||||||||||||||||||||
| Year Ended October 31, 2009 | $ | 10.55 | (0.04 | ) | 2.03 | 1.99 | — | — | — | $ | 12.54 | 18.86 | %(d) | $ | 15,896 | 1.20 | % | (0.33 | )% | 1.31 | % | 66 | % | |||||||||||||||||||||||||||||||||||||||
| Year Ended October 31, 2010 | 12.54 | (0.07 | ) | 2.55 | 2.48 | — | — | — | 15.02 | 19.78 | %(e)(f) | 16,452 | 1.20 | % | (0.54 | )%(f) | 1.23 | % | 89 | % | ||||||||||||||||||||||||||||||||||||||||||
| Year Ended October 31, 2011 | 15.02 | (0.07 | ) | 1.64 | 1.57 | — | — | — | 16.59 | 10.45 | %(g) | 15,349 | 1.18 | % | (0.45 | )% | 1.18 | % | 56 | % | ||||||||||||||||||||||||||||||||||||||||||
| Year Ended October 31, 2012 | 16.59 | (0.06 | ) | 1.16 | 1.10 | — | — | — | 17.69 | 6.63 | %(h) | 11,327 | 1.20 | % | (0.36 | )% | 1.27 | % | 53 | % | ||||||||||||||||||||||||||||||||||||||||||
| Year Ended October 31, 2013 | 17.69 | (0.01 | ) | 5.34 | 5.33 | — | (1.29 | ) | (1.29 | ) | 21.73 | 32.24 | %(i) | 12,761 | 1.20 | % | (0.05 | )% | 1.21 | % | 75 | % | ||||||||||||||||||||||||||||||||||||||||
| CLASS B SHARES | ||||||||||||||||||||||||||||||||||||||||||||||||||||||||||||||
| Year Ended October 31, 2009 | $ | 9.85 | (0.10 | ) | 1.85 | 1.75 | — | — | — | $ | 11.60 | 17.87 | %(d) | $ | 2,059 | 1.95 | % | (1.06 | )% | 2.06 | % | 66 | % | |||||||||||||||||||||||||||||||||||||||
| Year Ended October 31, 2010 | 11.60 | (0.16 | ) | 2.36 | 2.20 | — | — | — | 13.80 | 18.97 | %(e)(f) | 1,213 | 1.95 | % | (1.28 | )%(f) | 1.98 | % | 89 | % | ||||||||||||||||||||||||||||||||||||||||||
| Year Ended October 31, 2011 | 13.80 | (0.18 | ) | 1.51 | 1.33 | — | — | — | 15.13 | 9.64 | %(g) | 962 | 1.93 | % | (1.19 | )% | 1.93 | % | 56 | % | ||||||||||||||||||||||||||||||||||||||||||
| Year Ended October 31, 2012 | 15.13 | (0.17 | ) | 1.06 | 0.89 | — | — | — | 16.02 | 5.88 | %(h) | 621 | 1.95 | % | (1.10 | )% | 2.03 | % | 53 | % | ||||||||||||||||||||||||||||||||||||||||||
| Year Ended October 31, 2013 | 16.02 | (0.12 | ) | 4.75 | 4.63 | — | (1.29 | ) | (1.29 | ) | 19.36 | 31.16 | %(i) | 493 | 1.95 | % | (0.72 | )% | 1.96 | % | 75 | % | ||||||||||||||||||||||||||||||||||||||||
| CLASS C SHARES | ||||||||||||||||||||||||||||||||||||||||||||||||||||||||||||||
| Year Ended October 31, 2009 | $ | 9.91 | (0.12 | ) | 1.89 | 1.77 | — | — | — | $ | 11.68 | 17.86 | %(d) | $ | 120 | 1.95 | % | (1.12 | )% | 2.05 | % | 66 | % | |||||||||||||||||||||||||||||||||||||||
| Year Ended October 31, 2010 | 11.68 | (0.17 | ) | 2.38 | 2.21 | — | — | — | 13.89 | 18.92 | %(e)(f) | 184 | 1.95 | % | (1.30 | )%(f) | 1.99 | % | 89 | % | ||||||||||||||||||||||||||||||||||||||||||
| Year Ended October 31, 2011 | 13.89 | (0.18 | ) | 1.52 | 1.34 | — | — | — | 15.23 | 9.65 | %(g) | 251 | 1.94 | % | (1.21 | )% | 1.94 | % | 56 | % | ||||||||||||||||||||||||||||||||||||||||||
| Year Ended October 31, 2012 | 15.23 | (0.18 | ) | 1.07 | 0.89 | — | — | — | 16.12 | 5.84 | %(h) | 482 | 1.95 | % | (1.14 | )% | 2.03 | % | 53 | % | ||||||||||||||||||||||||||||||||||||||||||
| Year Ended October 31, 2013 | 16.12 | (0.14 | ) | 4.80 | 4.66 | — | (1.29 | ) | (1.29 | ) | 19.49 | 31.15 | %(i) | 602 | 1.95 | % | (0.81 | )% | 1.96 | % | 75 | % | ||||||||||||||||||||||||||||||||||||||||
| CLASS I SHARES | ||||||||||||||||||||||||||||||||||||||||||||||||||||||||||||||
| Year Ended October 31, 2009 | $ | 10.62 | (0.01 | ) | 2.04 | 2.03 | — | — | — | $ | 12.65 | 19.11 | %(d) | $ | 39,400 | 0.95 | % | (0.08 | )% | 1.06 | % | 66 | % | |||||||||||||||||||||||||||||||||||||||
| Year Ended October 31, 2010 | 12.65 | (0.04 | ) | 2.58 | 2.54 | — | — | — | 15.19 | 20.08 | %(e)(f) | 49,474 | 0.95 | % | (0.30 | )%(f) | 0.99 | % | 89 | % | ||||||||||||||||||||||||||||||||||||||||||
| Year Ended October 31, 2011 | 15.19 | (0.04 | ) | 1.68 | 1.64 | — | — | — | 16.83 | 10.80 | %(g) | 57,222 | 0.94 | % | (0.22 | )% | 0.94 | % | 56 | % | ||||||||||||||||||||||||||||||||||||||||||
| Year Ended October 31, 2012 | 16.83 | (0.02 | ) | 1.18 | 1.16 | — | — | — | 17.99 | 6.89 | %(h) | 57,916 | 0.95 | % | (0.12 | )% | 1.04 | % | 53 | % | ||||||||||||||||||||||||||||||||||||||||||
| Year Ended October 31, 2013 | 17.99 | 0.04 | 5.42 | 5.46 | (0.02 | ) | (1.29 | ) | (1.31 | ) | 22.14 | 32.49 | %(i) | 68,624 | 0.95 | % | 0.20 | % | 0.96 | % | 75 | % | ||||||||||||||||||||||||||||||||||||||||
| * |
The per share amounts and percentages reflect income and expenses assuming inclusion of the Fund’s proportionate share of the income and expenses of the HSBC Growth Portfolio. | |
| (a) | Calculated based on average shares outstanding. | |
| (b) | Total return calculations do not include any sales or redemption charges. | |
| (c) | Portfolio turnover rate is calculated on the basis of the respective Portfolio in which the Fund invests all of its investable assets. Portfolio turnover rate is calculated on the basis of the Fund as a whole without distinguishing between the classes of shares issued. | |
| (d) | During the year ended October 31, 2009, the Portfolio, in which the Fund invests, received monies related to certain nonrecurring litigation settlements. The corresponding impact to the total return was 0.50%, 0.54%, 0.53% and 0.49% for Class A Shares, Class B Shares, Class C Shares and Class I Shares, respectively. | |
| (e) | During the year ended October 31, 2010, the Portfolio, in which the Fund invests, received monies related to certain nonrecurring litigation settlements. The corresponding impact to the total return was 0.17%, 0.17%, 0.17% and 0.17% for Class A Shares, Class B Shares, Class C Shares and Class I Shares, respectively. | |
| (f) | During the year ended October 31, 2010, the Fund received a distribution from a “fair fund” established by the SEC in connection with a consent order against BISYS Fund Services, Inc. (See Note 7 in the Notes to Financial Statements). The corresponding impact to the net income ratio and the total return was 0.02%, 0.02%, 0.02% and 0.02% for Class A Shares, Class B Shares, Class C Shares and Class I Shares, respectively. | |
| (g) | During the year ended October 31, 2011, the Portfolio, in which the Fund invests, received monies related to certain nonrecurring litigation settlements. The corresponding impact to the total return was 0.28%, 0.28%, 0.28% and 0.28% for Class A Shares, Class B Shares, Class C Shares and Class I Shares, respectively. | |
| (h) | During the year ended October 31, 2012, the Portfolio, in which the Fund invests, received monies related to certain nonrecurring litigation settlements. The corresponding impact to the total return was 0.12%, 0.12%, 0.12% and 0.12% for Class A Shares, Class B Shares, Class C Shares and Class I Shares, respectively. | |
| (i) | During the year ended October 31, 2013, the Portfolio, in which the Fund invests, received monies related to certain nonrecurring litigation settlements. The corresponding impact to the total return was 0.16%, 0.16%, 0.16% and 0.16% for Class A Shares, Class B Shares, Class C Shares and Class I Shares, respectively. |
|
See notes to financial statements. |
HSBC FAMILY OF FUNDS 17 |
| HSBC OPPORTUNITY FUND |
| Financial Highlights |
Selected data for a share outstanding throughout the periods indicated.*
|
Investment Activities |
Dividends |
Ratios/Supplementary Data | |||||||||||||||||||||||||||||||||||||||||||||||||||||||
|
Net
Asset |
Net |
Net Realized |
Total from
|
Net Realized |
Total |
Net Asset Value, End of Period |
Total |
Net |
Ratio |
Ratio |
Ratios |
Portfolio | |||||||||||||||||||||||||||||||||||||||||||||
| CLASS A SHARES | |||||||||||||||||||||||||||||||||||||||||||||||||||||||||
| Year Ended October 31, 2009 | $ | 7.09 | (0.07 | ) | 0.97 | 0.90 | (0.43 | ) | (0.43 | ) | $ | 7.56 | 14.85 | % | $ | 9,687 | 1.55 | % | (1.02 | )% | 2.30 | % | 65 | % | |||||||||||||||||||||||||||||||||
| Year Ended October 31, 2010 | 7.56 | (0.09 | ) | 2.20 | 2.11 | — | — | 9.67 | 27.91 | %(d)(e) | 11,282 | 1.55 | % | (1.00 | )%(e) | 2.07 | % | 68 | % | ||||||||||||||||||||||||||||||||||||||
| Year Ended October 31, 2011 | 9.67 | (0.07 | ) | 1.19 | 1.12 | (0.16 | ) | (0.16 | ) | 10.63 | 11.59 | %(f) | 11,145 | 1.55 | % | (0.62 | )% | 1.85 | % | 69 | % | ||||||||||||||||||||||||||||||||||||
| Year Ended October 31, 2012 | 10.63 | (0.05 | ) | 1.11 | 1.06 | (1.56 | ) | (1.56 | ) | 10.13 | 12.08 | %(g) | 10,204 | 1.55 | % | (0.51 | )% | 2.20 | % | 59 | % | ||||||||||||||||||||||||||||||||||||
| Year Ended October 31, 2013 | 10.13 | (0.06 | ) | 3.34 | 3.28 | (0.63 | ) | (0.63 | ) | 12.78 | 34.02 | %(h) | 14,259 | 1.55 | % | (0.49 | )% | 2.01 | % | 70 | % | ||||||||||||||||||||||||||||||||||||
| CLASS B SHARES | |||||||||||||||||||||||||||||||||||||||||||||||||||||||||
| Year Ended October 31, 2009 | $ | 6.10 | (0.10 | ) | 0.80 | 0.70 | (0.43 | ) | (0.43 | ) | $ | 6.37 | 13.92 | % | $ | 1,082 | 2.30 | % | (1.77 | )% | 3.10 | % | 65 | % | |||||||||||||||||||||||||||||||||
| Year Ended October 31, 2010 | 6.37 | (0.13 | ) | 1.85 | 1.72 | — | — | 8.09 | 27.00 | %(d)(e) | 658 | 2.30 | % | (1.78 | )%(e) | 2.86 | % | 68 | % | ||||||||||||||||||||||||||||||||||||||
| Year Ended October 31, 2011 | 8.09 | (0.12 | ) | 0.99 | 0.87 | (0.16 | ) | (0.16 | ) | 8.80 | 10.75 | %(f) | 536 | 2.30 | % | (1.36 | )% | 2.64 | % | 69 | % | ||||||||||||||||||||||||||||||||||||
| Year Ended October 31, 2012 | 8.80 | (0.10 | ) | 0.87 | 0.77 | (1.56 | ) | (1.56 | ) | 8.01 | 11.15 | %(g) | 499 | 2.30 | % | (1.25 | )% | 2.99 | % | 59 | % | ||||||||||||||||||||||||||||||||||||
| Year Ended October 31, 2013 | 8.01 | (0.11 | ) | 2.60 | 2.49 | (0.63 | ) | (0.63 | ) | 9.87 | 33.10 | %(h) | 480 | 2.30 | % | (1.24 | )% | 2.77 | % | 70 | % | ||||||||||||||||||||||||||||||||||||
| CLASS C SHARES | |||||||||||||||||||||||||||||||||||||||||||||||||||||||||
| Year Ended October 31, 2009 | $ | 6.21 | (0.10 | ) | 0.81 | 0.71 | (0.43 | ) | (0.43 | ) | $ | 6.49 | 13.83 | % | $ | 267 | 2.30 | % | (1.78 | )% | 3.08 | % | 65 | % | |||||||||||||||||||||||||||||||||
| Year Ended October 31, 2010 | 6.49 | (0.13 | ) | 1.89 | 1.76 | — | — | 8.25 | 27.12 | %(d)(e) | 341 | 2.30 | % | (1.75 | )%(e) | 2.86 | % | 68 | % | ||||||||||||||||||||||||||||||||||||||
| Year Ended October 31, 2011 | 8.25 | (0.13 | ) | 1.02 | 0.89 | (0.16 | ) | (0.16 | ) | 8.98 | 10.79 | %(f) | 437 | 2.30 | % | (1.38 | )% | 2.64 | % | 69 | % | ||||||||||||||||||||||||||||||||||||
| Year Ended October 31, 2012 | 8.98 | (0.10 | ) | 0.89 | 0.79 | (1.56 | ) | (1.56 | ) | 8.21 | 11.14 | %(g) | 545 | 2.30 | % | (1.19 | )% | 3.03 | % | 59 | % | ||||||||||||||||||||||||||||||||||||
| Year Ended October 31, 2013 | 8.21 | (0.11 | ) | 2.67 | 2.56 | (0.63 | ) | (0.63 | ) | 10.14 | 33.15 | %(h) | 711 | 2.30 | % | (1.21 | )% | 2.76 | % | 70 | % | ||||||||||||||||||||||||||||||||||||
| * |
The per share amounts and percentages reflect income and expenses assuming inclusion of the Fund’s proportionate share of the income and expenses of the HSBC Opportunity Portfolio. | |
| (a) | Calculated based on average shares outstanding. | |
| (b) | Total return calculations do not include any sales or redemption charges. | |
| (c) | Portfolio turnover rate is calculated on the basis of the respective Portfolio in which the Fund invests all of its investable assets. Portfolio turnover rate is calculated on the basis of the Fund as a whole without distinguishing between the classes of shares issued. | |
| (d) | During the year ended October 31, 2010, the Portfolio, in which the Fund invests, received monies related to certain nonrecurring litigation settlements. The corresponding impact to the total return was 0.15%, 0.15% and 0.15% for Class A Shares, Class B Shares and Class C Shares, respectively. | |
| (e) | During the year ended October 31, 2010, the Fund received a distribution from a “fair fund” established by the SEC in connection with a consent order against BISYS Fund Services, Inc. (See Note 7 in the Notes to Financial Statements). Corresponding impact to the net income ratio and the total return was 0.01%, 0.01% and 0.01% for Class A Shares, Class B Shares and Class C Shares, respectively. | |
| (f) | During the year ended October 31, 2011, the Portfolio, in which the Fund invests, received monies related to certain nonrecurring litigation settlements. The corresponding impact to the total return was 0.10%, 0.10% and 0.10% for Class A Shares, Class B Shares and Class C Shares, respectively. | |
| (g) | During the year ended October 31, 2012, the Portfolio, in which the Fund invests, received monies related to certain nonrecurring litigation settlements. The corresponding impact to the total return was 0.10%, 0.10% and 0.10% for Class A Shares, Class B Shares and Class C Shares, respectively. | |
| (h) | During the year ended October 31, 2013, the Portfolio, in which the Fund invests, received monies related to certain nonrecurring litigation settlements. The corresponding impact to the total return was 0.13%, 0.13% and 0.13% for Class A Shares, Class B Shares and Class C Shares, respectively. |
|
18 HSBC FAMILY OF FUNDS |
See notes to financial statements. |
| HSBC OPPORTUNITY FUND (ADVISOR) |
| Financial Highlights |
Selected data for a share outstanding throughout the periods indicated.*
|
Investment Activities |
Dividends |
Ratios/Supplementary Data | |||||||||||||||||||||||||||||||||||||||||||||||||||||||
|
Net
Asset |
Net |
Net Realized |
Total from
|
Net Realized |
Total |
Net |
Total |
Net |
Ratio |
Ratio |
Ratios |
Portfolio | |||||||||||||||||||||||||||||||||||||||||||||
| CLASS I SHARES | |||||||||||||||||||||||||||||||||||||||||||||||||||||||||
| Year Ended October 31, 2009 | $ | 8.91 | (0.04 | ) | 1.32 | 1.28 | (0.26 | ) | (0.26 | ) | $ | 9.93 | 15.47 | % | $ | 100,285 | 1.02 | % | (0.50 | )% | 1.02 | % | 65 | % | |||||||||||||||||||||||||||||||||
| Year Ended October 31, 2010 | 9.93 | (0.06 | ) | 2.90 | 2.84 | — | — | 12.77 | 28.60 | %(c)(d) | 117,064 | 1.01 | % | (0.46 | )%(d) | 1.01 | % | 68 | % | ||||||||||||||||||||||||||||||||||||||
| Year Ended October 31, 2011 | 12.77 | (0.01 | ) | 1.57 | 1.56 | (0.31 | ) | (0.31 | ) | 14.02 | 12.25 | %(e) | 122,017 | 1.01 | % | (0.07 | )% | 1.01 | % | 69 | % | ||||||||||||||||||||||||||||||||||||
| Year Ended October 31, 2012 | 14.02 | (0.01 | ) | 1.46 | 1.45 | (2.07 | ) | (2.07 | ) | 13.40 | 12.50 | %(f) | 135,098 | 1.08 | % | (0.01 | )% | 1.08 | % | 59 | % | ||||||||||||||||||||||||||||||||||||
| Year Ended October 31, 2013 | 13.40 | 0.01 | 4.47 | 4.48 | (0.61 | ) | (0.61 | ) | 17.27 | 34.70 | %(g) | 208,321 | 0.99 | % | 0.07 | % | 0.99 | % | 70 | % | |||||||||||||||||||||||||||||||||||||
| * |
The per share amounts and percentages reflect income and expense assuming inclusion of the Fund’s proportionate share of the income and expenses of the HSBC Opportunity Portfolio. | |
| (a) | Total return calculations do not include any sales or redemption charges. | |
| (b) | Portfolio turnover rate is calculated on the basis of the respective Portfolio in which the Fund invests all of its investable assets. Portfolio turnover rate is calculated on the basis of the Fund as a whole without distinguishing between the classes of shares issued. | |
| (c) | During the year ended October 31, 2010, the Portfolio, in which the Fund invests, received monies related to certain nonrecurring litigation settlements. The corresponding impact to the total return was 0.15% for Class I Shares. | |
| (d) | During the year ended October 31, 2010, the Fund received a distribution from a “fair fund” established by the SEC in connection with a consent order against BISYS Fund Services, Inc. (See Note 7 in the Notes to Financial Statements). The corresponding impact to the net income ratio and the total return was 0.01% for the Class I Shares. | |
| (e) | During the year ended October 31, 2011, the Portfolio, in which the Fund invests, received monies related to certain nonrecurring litigation settlements. The corresponding impact to the total return was 0.10% for Class I Shares. | |
| (f) | During the year ended October 31, 2012, the Portfolio, in which the Fund invests, received monies related to certain nonrecurring litigation settlements. The corresponding impact to the total return was 0.10% for Class I Shares. | |
| (g) | During the year ended October 31, 2013, the Portfolio, in which the Fund invests, received monies related to certain nonrecurring litigation settlements. The corresponding impact to the total return was 0.13% for Class I Shares. |
|
See notes to financial statements. |
HSBC FAMILY OF FUNDS 19 |
| HSBC FAMILY OF FUNDS |
| Notes to Financial Statements — as of October 31, 2013 |
1. Organization:
The HSBC Funds (the “Trust”), a Massachusetts business trust organized on April 22, 1987, and the HSBC Advisor Funds Trust (the “Advisor Trust”), a Massachusetts business trust organized on April 5, 1996, are registered under the Investment Company Act of 1940, as amended (the “Act”), as open-end management investment companies. As of October 31, 2013, the Trust is comprised of 15 separate operational funds and the Advisor Trust is comprised of 1 operational fund, each a series of the HSBC Family of Funds, which also includes the HSBC Portfolios (the “Portfolio Trust”) (collectively the “Trusts”). The accompanying financial statements are presented for the following 3 funds (individually a “Fund”, collectively the “Funds”) of the Trust and Advisor Trust:
| Fund | Short Name | Trust | |||||
| HSBC Growth Fund | Growth Fund | Trust | |||||
| HSBC Opportunity Fund | Opportunity Fund | Trust | |||||
| HSBC Opportunity Fund (Advisor) | Opportunity Fund (Advisor) | Advisor Trust | |||||
All the Funds are diversified funds. Financial statements for all other funds of the Trusts are published separately.
Each Fund utilizes a master-feeder fund structure and seeks to achieve its investment objectives by investing all of its investable assets in its respective Portfolio (as defined below).
| Proportionate | ||||||||
| Ownership | ||||||||
| Interest on | ||||||||
| Fund | Respective Portfolio | October 31, 2013(%) | ||||||
| Growth Fund | HSBC Growth Portfolio |
93.1 |
||||||
| Opportunity Fund | HSBC Opportunity Portfolio |
6.8 |
||||||
| Opportunity Fund (Advisor) | HSBC Opportunity Portfolio |
91.7 |
||||||
The HSBC Growth Portfolio and HSBC Opportunity Portfolio (individually a “Portfolio”, collectively the “Portfolios”) are diversified series of the Portfolio Trust. The Portfolios operate as master funds in master-feeder arrangements and also may receive investments from certain fund of funds.
The financial statements of the Portfolios, including the Schedules of Portfolio Investments, are included elsewhere in this report. The financial statements of the Portfolios should be read in conjunction with the financial statements of the Funds.
The Funds are authorized to issue an unlimited number of shares of beneficial interest with a par value of $ 0.001 per share. The Growth Fund offers four classes of shares: Class A Shares, Class B Shares, Class C Shares, and Class I Shares. The Opportunity Fund offers three classes of shares: Class A Shares, Class B Shares, and Class C Shares. The Opportunity Fund (Advisor) offers one class of shares: Class I Shares. Class A Shares of the Funds have a maximum sales charge of 5.00% as a percentage of the original purchase price. Class B Shares of the Funds are offered without any front-end sales charge but will be subject to a contingent deferred sales charge (“CDSC”) ranging from a maximum of 4.00% if redeemed less than one year after purchase to 0.00% if redeemed more than four years after purchase. Class C Shares of the Funds are offered without any front-end sales charge but will be subject to a maximum CDSC of 1.00% if redeemed less than one year after purchase. No sales charges are assessed with respect to Class I Shares of the Funds. Each class of shares in the Funds has identical rights and privileges except with respect to arrangements pertaining to shareholder servicing and/or distribution, class-related expenses, voting rights on matters affecting a single class of shares, and the exchange privilege of each class of shares. Effective as of August 1, 2013, Class B Shares of the Funds may no longer be purchased or acquired by any new or existing Class B shareholder, except through dividend and/or capital gains reinvestment.
20 HSBC FAMILY OF FUNDS
| HSBC FAMILY OF FUNDS |
| Notes to Financial Statements — as of October 31, 2013 (continued) |
Under the Trusts’ organizational documents, the Trusts’ officers and Trustees are indemnified against certain liabilities arising out of the performance of their duties to the Funds. In addition, in the normal course of business, the Trusts enter into contracts with service providers, which also provide for indemnifications by the Funds. The Funds’ maximum exposure under these arrangements is unknown, as this would involve any future claims that may be made against the Funds. However, based on experience, the Trusts expect that risk of loss to be remote.
2. Significant Accounting Policies:
The following is a summary of the significant accounting policies followed by the Funds in the preparation of their financial statements. The policies are in conformity with U.S. generally accepted accounting principles (“GAAP”). The preparation of financial statements requires management to make certain estimates and assumptions that affect the reported amounts of assets and liabilities and disclosure of contingent assets and liabilities at the date of the financial statements and the reported amounts of increases and decreases in net assets from operations during the reporting period. Actual results could differ from those estimates.
Securities Valuation:
The Funds record their investments at fair value. Fair value is defined as the price that would be received to sell an asset or paid to transfer a liability in an orderly transaction between market participants at the measurement date. The valuation techniques used to determine fair value are further described in Note 3 below.
Investment Transactions and Related Income:
The Funds record investments into the Portfolios on a trade date basis. The Funds record daily their proportionate share of income, expenses, changes in unrealized appreciation and depreciation and realized gains and losses derived from their respective Portfolios. In addition, the Funds accrue their own expenses daily as incurred.
Allocations:
Expenses directly attributable to a Fund are charged to that Fund. Expenses not directly attributable to a Fund are allocated proportionately among the applicable series within the Trusts in relation to the net assets of each fund or on another reasonable basis. Class specific expenses are charged directly to the class incurring the expense. In addition, income, expenses (other than class specific expenses), and unrealized and realized gains and losses are allocated to each class based on relative net assets on a daily basis.
Dividends to Shareholders:
Dividends to shareholders from net investment income, if any, are declared and distributed semi-annually in the case of the Funds.
The Funds’ net realized gains, if any, are distributed to shareholders at least annually. Additional distributions are also made to the Funds’ shareholders to the extent necessary to avoid the federal excise tax on certain undistributed income and net capital gains of regulated investment companies.
The amount and character of net investment income and net realized gains distributions are determined in accordance with federal income tax regulations which may differ from GAAP. These “book/tax” differences are either considered temporary or permanent in nature. To the extent these differences are permanent in nature (e.g., reclassification of market discounts, certain gain/loss, paydowns, and certain distributions), such amounts are reclassified within the composition of net assets; temporary differences (e.g., wash losses and post-October loss deferrals) do not require reclassification. The Funds may utilize equalization accounting for tax purposes and designate earnings and profits, including net realized gains distributed to shareholders on redemption of shares, as a part of the dividends paid deduction for income tax purposes. To the extent distributions to shareholders from net investment income and net realized gains exceed net investment income and net realized gains for tax purposes, they are reported as distributions of capital.
HSBC FAMILY OF FUNDS 21
| HSBC FAMILY OF FUNDS |
| Notes to Financial Statements — as of October 31, 2013 (continued) |
Federal Income Taxes:
Each Fund is a separate taxable entity for federal income tax purposes. Each Fund has qualified and intends to continue to qualify each year as a “regulated investment company” under Subchapter M of the Internal Revenue Code, as amended, and to distribute substantially all of its taxable net investment income and net realized gains, if any, to its shareholders. Accordingly, no provision for federal income or excise tax is required.
Management of the Funds has reviewed tax positions taken in tax years that remain subject to examination by all major tax jurisdictions, including federal (i.e., the last four tax year ends and the interim tax period since then, as applicable). Management believes that there is no tax liability resulting from unrecognized tax benefits related to uncertain tax positions taken.
New Accounting Pronouncements:
In January 2013, the Financial Accounting Standards Board issued Accounting Standards Update (“ASU”) No. 2013-01 “Clarifying the Scope of Disclosures about Offsetting Assets and Liabilities” (“ASU 2013-01”), which amended Accounting Standards Codification Subtopic 210-20, Balance Sheet Offsetting. ASU 2013-01 clarified the scope of ASU No. 2011-11 “Disclosures about Offsetting Assets and Liabilities” (“ASU 2011-11”). ASU 2011-11 requires an entity to disclose information about offsetting and related arrangements to enable users of the financial statements to understand the effect of those arrangements on the entity’s financial position. ASU 2013-01 clarifies the scope of ASU 2011-11 as applying to derivatives accounted for in accordance with Topic 815, Derivatives and Hedging, including bifurcated embedded derivatives, repurchase agreements and reverse repurchase agreements, and securities borrowing and securities lending transactions that are offset either in accordance with other requirements of GAAP or subject to an enforceable master netting arrangement or similar agreement. The guidance in ASU 2013-01 and ASU 2011-11 is effective for interim and annual periods beginning on or after January 1, 2013. Management is evaluating any impact ASU 2013-01 and ASU 2011-11 may have on the Funds’ financial statements.
3. Investment Valuation Summary:
The valuation techniques employed by the Funds, as described below, maximize the use of observable inputs and minimize the use of unobservable inputs in determining fair value. The inputs used for valuing the Funds’ investments are summarized in the three broad levels listed below:
- Level 1: quoted prices in active markets for
identical assets
- Level 2: other significant observable inputs
(including quoted prices for similar securities, interest rates, prepayment speeds, credit risk, etc.)
- Level 3: significant unobservable inputs (including a Fund’s own assumptions in determining the fair value of investments)
Changes in valuation techniques may result in transfers in or out of an assigned level within the disclosure hierarchy. The Funds determine transfers between fair value hierarchy levels at the reporting period end. The inputs or methodology used for valuing investments are not necessarily an indication of the risk associated with investing in those investments.
The Funds record their investments in their respective Portfolios at fair value, which is typically categorized as Level 2 in the fair value hierarchy. The underlying securities of the Portfolios are recorded at fair value, as discussed more fully in the Notes to Financial Statements of the Portfolios included elsewhere in this report.
22 HSBC FAMILY OF FUNDS
| HSBC FAMILY OF FUNDS |
| Notes to Financial Statements — as of October 31, 2013 (continued) |
For the year ended October 31, 2013, there were no Level 3 investments for which significant unobservable inputs were used to determine fair value. The following is a summary of the valuation inputs used as of October 31, 2013 in valuing the Funds’ investments based upon the three levels defined above:
| LEVEL 1 ($) | LEVEL 2 ($) | LEVEL 3 ($) | Total ($) | |||||
| Growth Fund | ||||||||
| Investment Securities: | ||||||||
| Affiliated Portfolios(a) | — | 82,541,055 | — | 82,541,055 | ||||
| Total Investment Companies | — | 82,541,055 | — | 82,541,055 | ||||
| Opportunity Fund | ||||||||
| Investment Securities: | ||||||||
| Affiliated Portfolios(a) | — | 15,489,119 | — | 15,489,119 | ||||
| Total Investment Companies | — | 15,489,119 | — | 15,489,119 | ||||
| Opportunity Fund (Advisor) | ||||||||
| Investment Companies: | ||||||||
| Affiliated Portfolios(a) | — | 208,208,427 | — | 208,208,427 | ||||
| Total Investment Companies | — | 208,208,427 | — | 208,208,427 | ||||
| (a) | Investments in Affiliated Portfolios represent ownership interests in the Portfolios. Due to the Funds’ master-feeder structure, the inputs used for valuing these instruments are categorized as Level 2. |
4. Related Party Transactions and Other Agreements and Plans:
Investment Management:
HSBC Global Asset Management (USA) Inc. (“HSBC” or the “Investment Adviser”), a wholly owned subsidiary of HSBC Bank USA, N.A., a national bank organized under the laws of the United States, acts as Investment Adviser to the Portfolios. As Investment Adviser, HSBC manages the investments of the Portfolios and continuously reviews, supervises, and administers the Portfolios’ investments. The Funds are not directly charged any investment management fees.
Administration:
HSBC serves the Funds as Administrator. Under the terms of the Administration Agreement, HSBC receives from the Funds (as well as other funds in the Trusts combined) a fee, accrued daily and paid monthly, at an annual rate of:
| Based on Combined Average Daily Net Assets of | Fee Rate(%) | ||
| Up to $10 billion | 0.0550 | ||
| In excess of $10 billion but not exceeding $20 billion | 0.0350 | ||
| In excess of $20 billion but not exceeding $50 billion | 0.0275 | ||
| In excess of $50 billion | 0.0250 | ||
The fee rates and breakpoints are determined on the basis of the aggregate average daily net assets of the Trusts. The total administration fee paid to HSBC is allocated to each series based upon its proportionate share of the aggregate net assets of the Trusts. For assets invested in the Portfolios by the Funds, the Portfolios pay half of the administration fee and the Funds pay half, for a combination of the total fee rate as set forth above. Certain administration fees of the Portfolios also may be reduced by treating them as apportioned in part to other funds making investments in the Portfolios. An amount equal to 50% of the administration fee is deemed to be class specific.
HSBC FAMILY OF FUNDS 23
| HSBC FAMILY OF FUNDS |
| Notes to Financial Statements — as of October 31, 2013 (continued) |
Pursuant to a Sub-Administration Agreement with HSBC, Citi Fund Services Ohio, Inc. (“Citi”), a wholly-owned subsidiary of Citigroup, Inc., serves as the Trusts’ Sub-Administrator, subject to the general supervision by the Trusts’ Board of Trustees (the “Board”) and HSBC. For these services, Citi is entitled to a fee, payable by HSBC, at an annual rate equivalent to the fee rates set forth above subject to certain reductions associated with services provided to new funds, minus 0.02% which is retained by HSBC.
Under a Compliance Services Agreement between the Trusts and Citi (the “CCO Agreement”), Citi makes an employee available to serve as the Trusts’ Chief Compliance Officer (the “CCO”). Under the CCO Agreement, Citi also provides infrastructure and support in implementing the written policies and procedures comprising the Trusts’ compliance program, including support services to the CCO. For the services provided under the CCO Agreement, the Trusts paid Citi $287,560 for the year ended October 31, 2013, plus reimbursement of certain out of pocket expenses. Expenses incurred by each Fund are reflected on the Statements of Operations as “Compliance Services.” Citi pays the salary and other compensation earned by individuals performing these services, as employees of Citi.
Distribution Arrangements:
Foreside Distribution Services, L.P. (“Foreside”), a wholly-owned subsidiary of Foreside Financial Group LLC, serves the Trust as Distributor (the “Distributor”). The Trust has adopted a non-compensatory Distribution Plan and Agreement (the “Distribution Plan”) pursuant to Rule 12b-1 of the Act. The Distribution Plan provides for reimbursement of expenses incurred by the Distributor related to distribution and marketing, at a rate not to exceed 0.25%, 1.00%, and 1.00% of the average daily net assets of Class A Shares (currently not being charged), Class B Shares (currently charging 0.75%), and Class C Shares (currently charging 0.75%) of the Funds, respectively. For the year ended October 31, 2013, Foreside, as Distributor, also received $213,520, $105,439, and $49,940 in commissions from sales of the Trusts, for Class A Shares, Class B Shares, and Class C Shares, respectively of which $584, $89, and $0 were reallocated to HSBC-affiliated brokers and dealers, for Class A Shares, Class B Shares, and Class C Shares, respectively.
Shareholder Servicing:
The Trust has adopted a Shareholder Services Plan, which provides for payments to shareholder servicing agents (which primarily consist of HSBC and its affiliates) for providing various shareholder services. For performing these services, the shareholder servicing agents receive a fee that is computed daily and paid monthly up to 0.25%, 0.25%, and 0.25% of the average daily net assets of Class A Shares, Class B Shares, and Class C Shares of the Funds, respectively. The fees paid to the Distributor pursuant to the Distribution Plan and to shareholder servicing agents pursuant to the Shareholder Services Plan will not exceed in the aggregate 0.25% of the average daily net assets of Class A Shares, and 1.00% of the average daily net assets of Class B Shares and Class C Shares.
Fund Accounting and Transfer Agency:
Citi provides fund accounting and transfer agency services for each Fund. As transfer agent, Citi receives a fee based on the number of funds and shareholder accounts, subject to certain minimums, reductions associated with services provided to new funds and reimbursement of certain expenses. As fund accountant, Citi receives an annual fee per Fund and share class, subject to minimums, reductions associated with services provided to new funds and reimbursement of certain expenses. Citi receives additional fees paid by the Trust and the Advisor Trust for blue sky exemption services.
Independent Trustees:
The Trusts pay each Independent Trustee an annual retainer of $100,000. The Trusts pay a fee of $10,000 for each regular meeting of the Board attended and a fee of $ 3,000 for each special meeting attended. The Trusts pay each Committee Chair an annual retainer of $ 3,000, with the exception of the Chair of the Audit Committee, who receives a retainer of $ 6,000. The Trusts also pay the Chairman of the Board, an additional annual retainer of $24,000. In addition, for time expended on Board duties outside normal meetings, which is authorized by the Board, a Trustee is compensated at the rate of $ 500 per hour, up to a maximum of $3,000 per day.
24 HSBC FAMILY OF FUNDS
| HSBC FAMILY OF FUNDS |
| Notes to Financial Statements — as of October 31, 2013 (continued) |
Fee Reductions:
The Investment Adviser has agreed to contractually limit, through March 1, 2014, the annual total expenses, exclusive of interest, taxes, brokerage commissions, extraordinary expenses, and estimated indirect expenses attributed to a Fund’s investment in investment companies of certain Funds. Each affected Fund Class has its own expense limitations based on the average daily net assets for any full fiscal year as follows:
| Current Contractual | |||||
| Expense | |||||
| Fund | Class | Limitation(%) | |||
| Growth Fund | A | 1.20 | |||
| Growth Fund | B | 1.95 | |||
| Growth Fund | C | 1.95 | |||
| Growth Fund | I | 0.95 | |||
| Opportunity Fund | A | 1.65 | |||
| Opportunity Fund | B | 2.40 | |||
| Opportunity Fund | C | 2.40 | |||
| Opportunity Fund (Advisor) | I | 1.10 | |||
Any amounts contractually waived or reimbursed by the Investment Adviser will be subject to repayment by the respective Fund to the Investment Adviser within three years to the extent that the repayment will not cause the Fund’s operating expenses to exceed the contractual expense limit that was in effect at the time of such waiver or reimbursement. During the year ended October 31, 2013, the Investment Adviser did not recapture any of its prior contractual waivers or reimbursements. As of October 31, 2013, the repayments that may potentially be made by the Funds are as follows:
| Fund | 2016($) | 2015($) | 2014($) | Total | |||||
| Growth Fund | 5,267 | 65,181 | — | 70,448 | |||||
| Opportunity Fund | 46,445 | 65,241 | 27,228 | 138,914 | |||||
The Administrator and Citi may voluntarily waive/reimburse fees to help support the expense limits of the Funds. In addition, HSBC, in its role as Investment Adviser and Administrator, may waive/reimburse additional fees at its discretion. Any voluntary fee waivers/reimbursements are not subject to recoupment in subsequent fiscal periods. Voluntary waivers/reimbursements may be stopped at any time. Amounts waived/reimbursed by the Investment Adviser, Administrator and Citi are reported separately on the Statements of Operations, as applicable.
5. Investment Transactions:
Contributions and withdrawals of the respective Portfolios for the year ended October 31, 2013 totaled:
| Fund | Contributions($) | Withdrawals($) | |||||||
| Growth Fund | 4,105,330 | 13,848,759 | |||||||
| Opportunity Fund | 2,826,611 | 2,492,440 | |||||||
| Opportunity Fund (Advisor) | 34,440,619 | 11,972,238 | |||||||
HSBC FAMILY OF FUNDS 25
| HSBC FAMILY OF FUNDS |
| Notes to Financial Statements — as of October 31, 2013 (continued) |
6. Federal Income Tax Information:
The tax character of dividends paid by the Funds for the tax year ended October 31, 2013 was as follows:
| Dividends paid from | ||||||||||||||||
| Total | ||||||||||||||||
| Ordinary | Net Long Term | Total Taxable | Return of | Dividends | ||||||||||||
| Income ($) | Capital Gains ($) | Dividends ($) | Capital ($) | Paid ($)(1) | ||||||||||||
| Growth Fund | 77,975 | 5,056,287 | 5,134,262 | — | 5,134,262 | |||||||||||
| Opportunity Fund | — | 693,083 | 693,083 | — | 693,083 | |||||||||||
| Opportunity Fund (Advisor) | — | 6,472,825 | 6,472,825 | — | 6,472,825 | |||||||||||
The tax character of dividends paid by the Funds for the tax year ended October 31, 2012 was as follows:
| Dividends paid from | ||||||||||||
| Total | ||||||||||||
| Ordinary | Net Long Term | Total Taxable | Return of | Dividends | ||||||||
| Income ($) | Capital Gains ($) | Dividends ($) | Capital ($) | Paid ($)(1) | ||||||||
| Opportunity Fund | 122,612 | 1,646,254 | 1,768,866 | — | 1,768,866 | |||||||
| Opportunity Fund (Advisor) | 2,322,165 | 16,364,147 | 18,686,312 | — | 18,686,312 | |||||||
| (1) | Total dividends paid may differ from the amount reported in the Statement of Changes in Net Assets because dividends are recognized when actually paid for tax purposes. |
As of the tax year October 31, 2013, the components of accumulated earnings/(deficit) on a tax basis for the Funds were as follows:
| Undistributed | Accumulated | Unrealized | Total | ||||||||||||||||||||||||
| Undistributed | Undistributed | Long Term | Capital and | Appreciation/ | Accumulated | ||||||||||||||||||||||
| Ordinary | Tax Exempt | Capital | Accumulated | Dividends | Other | (Depreciation) | Earnings/ | ||||||||||||||||||||
| Income ($) | Income ($) | Gains ($) | Earnings ($) | Payable ($) | Losses ($) | ($)(1) | (Deficit) ($) | ||||||||||||||||||||
| Growth Fund | 848,249 | — | 8,732,299 | 9,580,548 | — | (99,109) | 21,764,615 | 31,246,054 | |||||||||||||||||||
| Opportunity Fund | 61,565 | — | 1,630,496 | 1,692,061 | — | — | 3,677,236 | 5,369,297 | |||||||||||||||||||
| Opportunity Fund | |||||||||||||||||||||||||||
| (Advisor) | 2,210,509 | — | 19,414,139 | 21,624,648 | — | — | 46,985,800 | 68,610,448 | |||||||||||||||||||
| (1) | The differences between book-basis and tax-basis unrealized appreciation/depreciation are attributable primarily to: tax deferral of losses on wash sales, the realization for tax purposes of unrealized gains/losses on certain derivative instruments, the difference between book and tax amortization methods for premium and market discount, the realization for tax purposes of unrealized gains/losses on investments in passive foreign investment companies and the return of capital adjustments from real estate investment trusts. |
Under current law, capital losses and specified ordinary losses realized after October 31st and non-specified ordinary losses incurred after December 31st (ordinary losses collectively known as “late year ordinary loss”) may be deferred and treated as occurring on the first business day of the following fiscal year. As of the tax year ended October 31, 2013, the following Funds had deferred losses, which will be treated as arising on the first day of the fiscal year ending October 31, 2014.
| Late Year | |
| Ordinary Losses ($) | |
| Growth Fund | 99,109 |
26 HSBC FAMILY OF FUNDS
| HSBC FAMILY OF FUNDS |
| Notes to Financial Statements — as of October 31, 2013 (continued) |
7. Legal and Regulatory Matters:
On September 26, 2006 BISYS Fund Services, Inc. (“BISYS”), an affiliate of BISYS Fund Services Ohio, Inc. which provided various services to the Funds, reached a settlement with the Securities and Exchange Commission (the “SEC”) regarding the SEC’s investigation related to BISYS’ past payment of certain marketing and other expenses with respect to certain of its mutual fund clients. The related settlement monies were received by the Funds during the year ended October 31, 2010. The corresponding impact to the net income ratio and total return for the year ended October 31, 2010 are disclosed in the Funds’ Financial Highlights.
8. Subsequent Events:
Management has evaluated events and transactions through the date the financial statements were issued, for purposes of recognition or disclosure in these financial statements and there are no subsequent events to report.
HSBC FAMILY OF FUNDS 27
REPORT OF INDEPENDENT REGISTERED PUBLIC ACCOUNTING FIRM
To the Shareholders and Board of
Trustees of HSBC Funds and
HSBC Advisor Funds Trust:
We have audited the accompanying statements of assets and liabilities of HSBC Growth Fund, HSBC Opportunity Fund and HSBC Opportunity Fund (Advisor) (the Funds), as of October 31, 2013, and the related statements of operations for the year then ended, the statements of changes in net assets for each of the years in the two-year period then ended, and the financial highlights for each of the years in the five-year period then ended. These financial statements and financial highlights are the responsibility of the Funds’ management. Our responsibility is to express an opinion on these financial statements and financial highlights based on our audits.
We conducted our audits in accordance with the standards of the Public Company Accounting Oversight Board (United States). Those standards require that we plan and perform the audit to obtain reasonable assurance about whether the financial statements and financial highlights are free of material misstatement. An audit includes examining, on a test basis, evidence supporting the amounts and disclosures in the financial statements. Our procedures included confirmation of securities owned as of October 31, 2013, by correspondence with the transfer agent of the HSBC Portfolios. An audit also includes assessing the accounting principles used and significant estimates made by management, as well as evaluating the overall financial statement presentation. We believe that our audits provide a reasonable basis for our opinion.
In our opinion, the financial statements and financial highlights referred to above present fairly, in all material respects, the financial position of the Funds as of October 31, 2013, the results of their operations for the year then ended, the changes in their net assets for each of the years in the two-year period then ended, and the financial highlights for each of the years in the five-year period then ended, in conformity with U.S. generally accepted accounting principles.

Columbus, Ohio
December 27,
2013
28 HSBC FAMILY OF FUNDS
| HSBC FAMILY OF FUNDS |
| Other Federal Income Tax Information — as of October 31, 2013 (Unaudited) |
During the year ended October 31, 2013, the following Funds declared capital gain distributions:
| Short Term | Long Term | |||||
| Capital Gain | Capital Gain | |||||
| Distributions ($) | Distributions ($) | |||||
| Growth Fund | — | 5,056,287 | ||||
| Opportunity Fund | — | 693,083 | ||||
| Opportunity Fund (Advisor) | — | 6,472,825 | ||||
For the year ended October 31, 2013, the following percentages of the total ordinary income dividends paid by the Fund qualify for the corporate dividends received deduction available to corporate shareholders:
| Dividends | ||
| Received | ||
| Deduction (%) | ||
| Growth Fund | 87.17 |
For the year ended October 31, 2013, dividends paid by the following Fund may be subject to a maximum tax rate of 15%, as provided for by the Jobs and Growth Tax Relief Reconciliation Act of 2003. The Fund intends to designate the maximum amount allowable as taxed at a maximum rate of 15%. Complete information will be reported in conjunction with your 2013 Form 1099-DIV:
| Qualified | ||
| Dividend | ||
| Income (%) | ||
| Growth Fund | 79.00 |
HSBC FAMILY OF FUNDS 29
| HSBC FAMILY OF FUNDS |
| Table of Shareholder Expenses — as of October 31, 2013 (Unaudited) |
As a shareholder of the Funds, you incur two types of costs: (1) transaction costs, including sales charges (loads) on purchases, redemption fees and exchange fees; and (2) ongoing costs, including management fees, distribution fees and/or shareholder servicing fees and other Fund expenses (including expenses allocated from the Portfolios). These examples are intended to help you understand your ongoing costs (in dollars) of investing in the Funds and to compare these costs with the ongoing costs of investing in other mutual funds.
These examples are based on an investment of $1,000 invested at the beginning of the period and held for the entire period from May 1, 2013 through October 31, 2013.
Actual Example
The table below provides information about actual account values and actual expenses. You may use the information below, together with the amount you invested, to estimate the expenses that you paid over the period. Simply divide your account value by $1,000 (for example, an $8,600 account value divided by $1,000 = 8.6), then multiply the result by the number in the table under the heading entitled “Expenses Paid During Period” to estimate the expenses you paid on your account during this period.
| Annualized | ||||||||||||||||||||
| Beginning | Ending | Expenses Paid | Expense Ratio | |||||||||||||||||
| Account Value | Account Value | During Period* | During Period | |||||||||||||||||
| 5/1/13 | 10/31/13 | 5/1/13 - 10/31/13 | 5/1/13 - 10/31/13 | |||||||||||||||||
| Growth Fund | Class A Shares | $ | 1,000.00 | $ | 1,167.70 | $ | 6.56 | 1.20 | % | |||||||||||
| Class B Shares | 1,000.00 | 1,162.80 | 10.63 | 1.95 | % | |||||||||||||||
| Class C Shares | 1,000.00 | 1,162.90 | 10.63 | 1.95 | % | |||||||||||||||
| Class I Shares | 1,000.00 | 1,168.30 | 5.19 | 0.95 | % | |||||||||||||||
| Opportunity Fund | Class A Shares | 1,000.00 | 1,136.00 | 8.35 | 1.55 | % | ||||||||||||||
| Class B Shares | 1,000.00 | 1,131.90 | 12.36 | 2.30 | % | |||||||||||||||
| Class C Shares | 1,000.00 | 1,131.70 | 12.36 | 2.30 | % | |||||||||||||||
| Opportunity Fund (I Shares) | Class I Shares | 1,000.00 | 1,138.40 | 5.28 | 0.98 | % | ||||||||||||||
| * | Expenses are equal to the average account value over the period, multiplied by the Fund’s annualized expense ratio, multiplied by 184/365 (to reflect the one half year period). |
30 HSBC FAMILY OF FUNDS
| HSBC FAMILY OF FUNDS |
| Table of Shareholder Expenses — as of October 31, 2013 (Unaudited) (continued) |
Hypothetical Example for Comparison Purposes
The table below provides information about hypothetical account values and hypothetical expenses based on each Fund’s actual expense ratio and an assumed rate of return of 5% per year before expenses, which is not the Fund’s actual return. The hypothetical account values and expenses may not be used to estimate the actual ending account balance or expenses you paid for the period. You may use this information to compare this 5% hypothetical example with the 5% hypothetical examples that appear in the shareholder reports of other funds.
Please note that the expenses shown in the table are meant to highlight your ongoing costs only and do not reflect any transactional costs, such as sales charges (loads), redemption fees, or exchange fees. Therefore, the table is useful in comparing ongoing costs only, and will not help you determine the relative total costs of owning different funds. In addition, if these transactional costs were included, your costs would have been higher.
| Annualized | ||||||||||||||||||||
| Beginning | Ending | Expenses Paid | Expense Ratio | |||||||||||||||||
| Account Value | Account Value | During Period* | During Period | |||||||||||||||||
| 5/1/13 | 10/31/13 | 5/1/13 - 10/31/13 | 5/1/13 - 10/31/13 | |||||||||||||||||
| Growth Fund | Class A Shares | $ | 1,000.00 | $ | 1,019.16 | $ | 6.11 | 1.20 | % | |||||||||||
| Class B Shares | 1,000.00 | 1,015.38 | 9.91 | 1.95 | % | |||||||||||||||
| Class C Shares | 1,000.00 | 1,015.38 | 9.91 | 1.95 | % | |||||||||||||||
| Class I Shares | 1,000.00 | 1,020.42 | 4.84 | 0.95 | % | |||||||||||||||
| Opportunity Fund | Class A Shares | 1,000.00 | 1,017.39 | 7.88 | 1.55 | % | ||||||||||||||
| Class B Shares | 1,000.00 | 1,013.61 | 11.67 | 2.30 | % | |||||||||||||||
| Class C Shares | 1,000.00 | 1,013.61 | 11.67 | 2.30 | % | |||||||||||||||
| Opportunity Fund (I Shares) | Class I Shares | 1,000.00 | 1,020.27 | 4.99 | 0.98 | % | ||||||||||||||
| * | Expenses are equal to the average account value over the period, multiplied by the Fund’s annualized expense ratio, multiplied by 184/365 (to reflect the one half year period). |
HSBC FAMILY OF FUNDS 31
| HSBC GROWTH PORTFOLIO |
| Schedule of Portfolio Investments — as of October 31, 2013 |
| Common Stocks – 98.9% | ||||
| Shares | Value ($) | |||
| Aerospace & Defense – 3.1% | ||||
| Precision Castparts Corp. | 6,300 | 1,596,735 | ||
| United Technologies Corp. | 11,250 | 1,195,312 | ||
| 2,792,047 | ||||
| Airlines – 0.7% | ||||
| Delta Air Lines, Inc. | 23,050 | 608,059 | ||
| Auto Components – 1.2% | ||||
| BorgWarner, Inc. | 10,200 | 1,051,926 | ||
| Biotechnology – 9.1% | ||||
| Alexion Pharmaceuticals, Inc. (a) | 7,300 | 897,535 | ||
| Amgen, Inc. | 13,850 | 1,606,600 | ||
| Biogen Idec, Inc. (a) | 6,900 | 1,684,911 | ||
| Celgene Corp. (a) | 14,050 | 2,086,284 | ||
| Gilead Sciences, Inc. (a) | 25,650 | 1,820,894 | ||
| 8,096,224 | ||||
| Capital Markets – 3.7% | ||||
| BlackRock, Inc. | 5,365 | 1,613,846 | ||
| Morgan Stanley | 45,900 | 1,318,707 | ||
| The Charles Schwab Corp. | 13,800 | 312,570 | ||
| 3,245,123 | ||||
| Chemicals – 4.1% | ||||
| Ecolab, Inc. | 9,500 | 1,007,000 | ||
| Monsanto Co. | 25,149 | 2,637,627 | ||
| 3,644,627 | ||||
| Communications Equipment – 1.5% | ||||
| F5 Networks, Inc. (a) | 6,200 | 505,362 | ||
| Qualcomm, Inc. | 12,350 | 857,955 | ||
| 1,363,317 | ||||
| Computers & Peripherals – 3.1% | ||||
| Apple, Inc. | 5,210 | 2,721,444 | ||
| Diversified Financial Services – 1.2% | ||||
| American Express Co. | 13,100 | 1,071,580 | ||
| Energy Equipment & Services – 1.5% | ||||
| Schlumberger Ltd. | 14,000 | 1,312,080 | ||
| Food & Staples Retailing – 2.4% | ||||
| Costco Wholesale Corp. | 6,900 | 814,200 | ||
| CVS Caremark Corp. | 15,400 | 958,804 | ||
| Whole Foods Market, Inc. | 5,400 | 340,902 | ||
| 2,113,906 | ||||
| Health Care Providers & Services – 0.9% | ||||
| Catamaran Corp. (a) | 16,400 | 770,144 | ||
| Health Care Technology – 1.7% | ||||
| athenahealth, Inc. (a) | 3,600 | 480,636 | ||
| Cerner Corp. (a) | 18,000 | 1,008,540 | ||
| 1,489,176 | ||||
| Hotels, Restaurants & Leisure – 3.8% | ||||
| Chipotle Mexican Grill, Inc. (a) | 1,170 | 616,555 | ||
| Starbucks Corp. | 23,200 | 1,880,360 | ||
| Wynn Resorts Ltd. | 5,200 | 864,500 | ||
| 3,361,415 | ||||
| Internet & Catalog Retail – 6.8% | ||||
| Amazon.com, Inc. (a) | 8,235 | 2,997,787 | ||
| Priceline.com, Inc. (a) | 2,920 | 3,077,184 | ||
| 6,074,971 | ||||
| Internet Software & Services – 9.4% | ||||
| Baidu, Inc. (a) | 4,400 | 707,960 | ||
| eBay, Inc. (a) | 30,150 | 1,589,206 | ||
| Facebook, Inc., Class A(a) | 35,100 | 1,764,126 | ||
| Google, Inc., Class A(a) | 3,550 | 3,658,559 | ||
| LinkedIn Corp., Class A(a) | 2,900 | 648,643 | ||
| 8,368,494 | ||||
| IT Services – 6.3% | ||||
| Cognizant Technology Solutions Corp., | ||||
| Class A(a) | 12,100 | 1,051,853 | ||
| MasterCard, Inc., Class A | 1,955 | 1,401,930 | ||
| Visa, Inc., Class A | 16,100 | 3,166,387 | ||
| 5,620,170 | ||||
| Machinery – 2.7% | ||||
| Danaher Corp. | 33,000 | 2,378,970 | ||
| Media – 5.0% | ||||
| CBS Corp., Class B | 19,600 | 1,159,144 | ||
| Liberty Global plc, Class A(a) | 11,700 | 916,929 | ||
| The Walt Disney Co. | 14,400 | 987,696 | ||
| tt Century Fox, Inc., Class A | 39,750 | 1,354,680 | ||
| 4,418,449 | ||||
| Oil, Gas & Consumable Fuels – 4.1% | ||||
| EOG Resources, Inc. | 4,300 | 767,120 | ||
| Noble Energy, Inc. | 14,000 | 1,049,020 | ||
| Pioneer Natural Resources Co. | 4,700 | 962,466 | ||
| Range Resources Corp. | 11,400 | 863,094 | ||
| 3,641,700 | ||||
| Personal Products – 1.1% | ||||
| The Estee Lauder Cos., Inc., Class A | 13,150 | 933,124 | ||
| Pharmaceuticals – 2.1% | ||||
| Bristol-Myers Squibb Co. | 15,400 | 808,808 | ||
| Zoetis, Inc. | 34,000 | 1,076,440 | ||
| 1,885,248 | ||||
| Real Estate Investment Trusts (REITs) – 1.5% | ||||
| American Tower Corp. | 16,700 | 1,325,145 | ||
| Road & Rail – 4.1% | ||||
| The Kansas City Southern Railway Co. | 3,600 | 437,472 | ||
| Union Pacific Corp. | 21,150 | 3,202,110 | ||
| 3,639,582 | ||||
| 32 HSBC PORTFOLIOS | See notes to financial statements. |
| HSBC GROWTH PORTFOLIO |
| Schedule of Portfolio Investments — as of October 31, 2013 (continued) |
| Common Stocks, continued | |||
| Shares | Value ($) | ||
| Semiconductors & Semiconductor Equipment – 3.0% | |||
| Applied Materials, Inc. | 47,800 | 853,230 | |
| ARM Holdings plc ADR | 20,100 | 948,519 | |
| NXP Semiconductors NV (a) | 21,250 | 895,050 | |
| 2,696,799 | |||
| Software – 3.4% | |||
| Salesforce.com, Inc. (a) | 47,150 | 2,515,924 | |
| ServiceNow, Inc. (a) | 8,700 | 475,107 | |
| 2,991,031 | |||
| Specialty Retail – 5.9% | |||
| Best Buy Co., Inc. | 7,350 | 314,580 | |
| Dollar General Corp. (a) | 22,300 | 1,288,494 | |
| Lowe’s Cos., Inc. | 22,300 | 1,110,094 | |
| Ross Stores, Inc. | 12,600 | 974,610 | |
| Ulta Salon, Cosmetics & Fragrance, | |||
| Inc. (a) | 11,700 | 1,507,545 | |
| 5,195,323 | |||
| Textiles, Apparel & Luxury Goods – 3.1% | |||
| Lululemon Athletica, Inc. (a) | 8,500 | 586,925 | |
| NIKE, Inc., Class B | 18,300 | 1,386,408 | |
| Ralph Lauren Corp. | 4,900 | 811,636 | |
| 2,784,969 | |||
| Trading Companies & Distributors – 1.0% | |||
| W. W. Grainger, Inc. | 3,365 | 905,084 | |
| Wireless Telecommunication Services – 1.4% | |||
| SBA Communications Corp., | |||
| Class A(a) | 14,250 | 1,246,448 | |
| TOTAL COMMON STOCKS | |||
| (COST $62,689,144) | 87,746,575 | ||
| Investment Companies – 0.7% | |||
| Northern Institutional Diversified Assets | |||
| Portfolio, Institutional Shares, | |||
| 0.01% (b) | 606,946 | 606,946 | |
| TOTAL INVESTMENT COMPANIES | |||
| (COST $606,946) | 606,946 | ||
| TOTAL INVESTMENT SECURITIES | |||
| (COST $63,296,090) — 99.6% | 88,353,521 | ||
| Percentages indicated are based on net assets of $88,684,466. | ||
| (a) | Represents non-income producing security. | |
| (b) | The rate represents the annualized one-day yield that was in effect on October 31, 2013. | |
ADR American Depositary Receipt
| See notes to financial statements. | HSBC PORTFOLIOS | 33 |
| HSBC OPPORTUNITY PORTFOLIO |
| Schedule of Portfolio Investments — as of October 31, 2013 |
| Common Stocks – 96.4% | ||||
| Shares | Value ($) | |||
| Aerospace & Defense – 3.1% | ||||
| BE Aerospace, Inc. (a) | 46,990 | 3,813,708 | ||
| TransDigm Group, Inc. | 22,385 | 3,255,003 | ||
| 7,068,711 | ||||
| Auto Components – 1.5% | ||||
| Gentex Corp. | 114,150 | 3,360,576 | ||
| Biotechnology – 4.9% | ||||
| ACADIA Pharmaceuticals, Inc. (a) | 102,800 | 2,336,644 | ||
| Alkermes plc (a) | 124,810 | 4,392,064 | ||
| Cubist Pharmaceuticals, Inc. (a) | 72,520 | 4,496,240 | ||
| 11,224,948 | ||||
| Capital Markets – 1.6% | ||||
| Raymond James Financial, Inc. | 77,760 | 3,549,744 | ||
| Chemicals – 6.2% | ||||
| Celanese Corp., Series A | 19,010 | 1,064,750 | ||
| Cytec Industries, Inc. | 35,570 | 2,955,511 | ||
| Huntsman Corp. | 153,470 | 3,563,573 | ||
| Rockwood Holdings, Inc. | 42,700 | 2,700,775 | ||
| The Scotts Mircale-Gro Co. | 63,830 | 3,748,098 | ||
| 14,032,707 | ||||
| Commercial Banks – 2.8% | ||||
| Comerica, Inc. | 59,470 | 2,575,051 | ||
| First Republic Bank | 74,640 | 3,811,865 | ||
| 6,386,916 | ||||
| Commercial Services & Supplies – 1.6% | ||||
| Waste Connections, Inc. | 83,135 | 3,553,190 | ||
| Communications Equipment – 0.7% | ||||
| JDS Uniphase Corp. (a) | 118,500 | 1,551,165 | ||
| Construction Materials – 0.7% | ||||
| Martin Marietta Materials, Inc. | 17,245 | 1,691,562 | ||
| Containers & Packaging – 2.7% | ||||
| Crown Holdings, Inc. (a) | 48,790 | 2,127,244 | ||
| Packaging Corp. of America | 65,400 | 4,073,112 | ||
| 6,200,356 | ||||
| Distributors – 1.1% | ||||
| LKQ Corp. (a) | 78,070 | 2,578,652 | ||
| Diversified Consumer Services – 1.5% | ||||
| Service Corp. International | 188,540 | 3,395,605 | ||
| Electrical Equipment – 2.7% | ||||
| Generac Holdings, Inc. | 43,690 | 2,156,102 | ||
| Hubbell, Inc., Class B | 36,500 | 3,925,210 | ||
| 6,081,312 | ||||
| Electronic Equipment, Instruments & Components – 0.6% | ||||
| IPG Photonics Corp. | 19,110 | 1,266,420 | ||
| Energy Equipment & Services – 1.9% | ||||
| Rowan Cos. plc, Class A(a) | 116,860 | 4,216,309 | ||
| Health Care Equipment & Supplies – 3.7% | ||||
| ArthroCare Corp. (a) | 61,740 | 2,311,546 | ||
| IDEXX Laboratories, Inc. (a) | 30,700 | 3,311,302 | ||
| Wright Medical Group, Inc. (a) | 99,300 | 2,697,981 | ||
| 8,320,829 | ||||
| Health Care Providers & Services – 1.9% | ||||
| Community Health Systems, Inc. | 96,490 | 4,209,859 | ||
| Health Care Technology – 0.8% | ||||
| Allscripts Healthcare Solutions, Inc. (a) | 134,470 | 1,859,720 | ||
| Hotels, Restaurants & Leisure – 1.8% | ||||
| Arcos Dorados Holdings, Inc., Class A | 113,250 | 1,363,530 | ||
| Brinker International, Inc. | 63,240 | 2,809,121 | ||
| 4,172,651 | ||||
| Household Durables – 5.4% | ||||
| Harman International Industries, Inc. | 29,540 | 2,393,331 | ||
| Jarden Corp. (a) | 70,115 | 3,881,566 | ||
| NVR, Inc. (a) | 2,427 | 2,226,336 | ||
| Taylor Morrison Home Corp., Class A(a) | 95,750 | 2,129,480 | ||
| Tempur Sealy International, Inc. (a) | 44,480 | 1,705,808 | ||
| 12,336,521 | ||||
| Insurance – 1.9% | ||||
| Everest Re Group Ltd. | 10,390 | 1,597,358 | ||
| Genworth Financial, Inc., Class A(a) | 194,860 | 2,831,316 | ||
| 4,428,674 | ||||
| Internet Software & Services – 2.6% | ||||
| MercadoLibre, Inc. | 24,020 | 3,233,933 | ||
| Pandora Media, Inc. (a) | 105,680 | 2,655,738 | ||
| 5,889,671 | ||||
| IT Services – 6.9% | ||||
| Alliance Data Systems Corp. (a) | 29,245 | 6,932,820 | ||
| FleetCor Technologies, Inc. (a) | 29,575 | 3,411,476 | ||
| Genpact Ltd. (a) | 111,310 | 2,207,277 | ||
| Total System Services, Inc. | 100,930 | 3,010,742 | ||
| 15,562,315 | ||||
| Life Sciences Tools & Services – 3.3% | ||||
| Covance, Inc. (a) | 35,000 | 3,124,100 | ||
| Mettler-Toledo International, Inc. (a) | 18,120 | 4,483,975 | ||
| 7,608,075 | ||||
| Machinery – 2.1% | ||||
| Lincoln Electric Holdings, Inc. | 34,780 | 2,408,167 | ||
| The Timken Co. | 44,450 | 2,347,405 | ||
| 4,755,572 | ||||
| Media – 1.6% | ||||
| Manchester United plc, Class A(a) | 84,360 | 1,375,068 | ||
| Nexstar Broadcasting Group, Inc., | ||||
| Class A | 51,270 | 2,275,875 | ||
| 3,650,943 | ||||
| 34 | HSBC PORTFOLIOS | See notes to financial statements. |
| HSBC OPPORTUNITY PORTFOLIO |
| Schedule of Portfolio Investments — as of October 31, 2013 (continued) |
| Common Stocks, continued | ||||
| Shares | Value ($) | |||
| Oil, Gas & Consumable Fuels – 5.0% | ||||
| CONSOL Energy, Inc. | 72,100 | 2,631,650 | ||
| Denbury Resources, Inc. (a) | 140,980 | 2,677,210 | ||
| Tesoro Corp. | 124,510 | 6,087,294 | ||
| 11,396,154 | ||||
| Pharmaceuticals – 2.7% | ||||
| ViroPharma, Inc. (a) | 157,970 | 6,132,395 | ||
| Professional Services – 2.0% | ||||
| IHS, Inc., Class A(a) | 22,515 | 2,455,261 | ||
| Robert Half International, Inc. | 56,730 | 2,185,807 | ||
| 4,641,068 | ||||
| Real Estate Investment Trusts (REITs) – 1.1% | ||||
| Starwood Property Trust, Inc. | 96,270 | 2,473,176 | ||
| Real Estate Management & Development – 1.1% | ||||
| Jones Lang LaSalle, Inc. | 25,440 | 2,421,888 | ||
| Road & Rail – 1.3% | ||||
| Landstar System, Inc. | 52,290 | 2,891,114 | ||
| Semiconductors & Semiconductor Equipment – 3.0% | ||||
| Avago Technologies Ltd. | 37,670 | 1,711,348 | ||
| NXP Semiconductors NV (a) | 80,230 | 3,379,288 | ||
| Skyworks Solutions, Inc. (a) | 66,800 | 1,722,104 | ||
| 6,812,740 | ||||
| Software – 3.2% | ||||
| Concur Technologies, Inc. (a) | 21,270 | 2,224,842 | ||
| Informatica Corp. (a) | 58,240 | 2,248,064 | ||
| QLIK Technologies, Inc. (a) | 108,820 | 2,757,499 | ||
| 7,230,405 | ||||
| Specialty Retail – 8.1% | ||||
| Best Buy Co., Inc. | 118,510 | 5,072,228 | ||
| GNC Holdings, Inc., Class A | 30,610 | 1,800,480 | ||
| Signet Jewelers Ltd. | 45,130 | 3,369,406 | ||
| Tractor Supply Co. | 35,170 | 2,509,380 | ||
| Urban Outfitters, Inc. (a) | 93,210 | 3,530,795 | ||
| Williams-Sonoma, Inc. | 42,094 | 2,207,409 | ||
| 18,489,698 | ||||
| Trading Companies & Distributors – 3.3% | ||||
| United Rentals, Inc. (a) | 47,670 | 3,079,005 | ||
| WESCO International, Inc. (a) | 52,080 | 4,450,757 | ||
| 7,529,762 | ||||
| TOTAL COMMON STOCKS | ||||
| (COST $167,155,410) | 218,971,403 | |||
| Investment Companies – 2.9% | ||||
| Northern Institutional Government | ||||
| Select Portfolio, Institutional Shares, | ||||
| 0.01% (b) | 6,563,134 | 6,563,134 | ||
| TOTAL INVESTMENT COMPANIES | ||||
| (COST $6,563,134) | 6,563,134 | |||
| TOTAL INVESTMENT SECURITIES | ||||
| (COST $173,718,544) — 99.3% | 225,534,537 | |||
| Percentages indicated are based on net assets of $227,068,664. | ||
| (a) | Represents non-income producing security. | |
| (b) | The rate represents the annualized one-day yield that was in effect on October 31, 2013. | |
| See notes to financial statements. | HSBC PORTFOLIOS | 35 |
HSBC PORTFOLIOS
Statements of Assets and Liabilities — as of October 31, 2013
| Growth | Opportunity | |||||||||
| Portfolio | Portfolio | |||||||||
| Assets: | ||||||||||
| Investments in non-affiliates, at value | $ | 88,353,521 | $ | 225,534,537 | ||||||
| Dividends receivable | 19,861 | 32,244 | ||||||||
| Receivable for investments sold | 1,517,261 | 2,269,970 | ||||||||
| Prepaid expenses | 594 | 1,339 | ||||||||
| Total Assets | 89,891,237 | 227,838,090 | ||||||||
| Liabilities: | ||||||||||
| Payable for investments purchased | 1,134,982 | 584,366 | ||||||||
| Accrued expenses and other liabilities: | ||||||||||
| Investment Management | 49,082 | 150,660 | ||||||||
| Administration | 2,318 | 5,839 | ||||||||
| Compliance Services | 8 | 27 | ||||||||
| Accounting | 212 | 223 | ||||||||
| Custodian | 5,200 | 6,773 | ||||||||
| Trustee | 83 | 346 | ||||||||
| Other | 14,886 | 21,192 | ||||||||
| Total Liabilities | 1,206,771 | 769,426 | ||||||||
| Applicable to investors’ beneficial interest | $ | 88,684,466 | $ | 227,068,664 | ||||||
| Total Investments, at cost | $ | 63,296,090 | $ | 173,718,544 | ||||||
| 36 | HSBC PORTFOLIOS | See notes to financial statements. |
HSBC PORTFOLIOS
Statements of Operations — For the year ended October 31, 2013
| Growth | Opportunity | |||||||||
| Portfolio | Portfolio | |||||||||
| Investment Income: | ||||||||||
| Dividends | $ | 975,963 | $ | 1,973,053 | ||||||
| Total Investment Income | 975,963 | 1,973,053 | ||||||||
| Expenses: | ||||||||||
| Investment Management | 472,689 | 1,486,877 | ||||||||
| Administration | 26,895 | 58,975 | ||||||||
| Accounting | 44,063 | 44,249 | ||||||||
| Compliance Services | 719 | 1,518 | ||||||||
| Custodian | 9,900 | 13,555 | ||||||||
| Printing | 1,791 | 4,180 | ||||||||
| Professional | 20,043 | 25,426 | ||||||||
| Trustee | 2,176 | 4,700 | ||||||||
| Other | 4,584 | 9,513 | ||||||||
| Total Expenses | 582,860 | 1,648,993 | ||||||||
| Net Investment Income (Loss) | 393,103 | 324,060 | ||||||||
| Net Realized/Unrealized Gains (Losses) from Investments: | ||||||||||
| Net realized gains (losses) from investment securities | 12,024,769 | 24,604,589 | ||||||||
| Change in unrealized appreciation/depreciation on investments | 11,744,016 | 30,628,121 | ||||||||
| Net realized/unrealized gains (losses) from investments | 23,768,785 | 55,232,710 | ||||||||
| Change In Net Assets Resulting From Operations | $ | 24,161,888 | $ | 55,556,770 | ||||||
| See notes to financial statements. | HSBC PORTFOLIOS | 37 |
HSBC PORTFOLIOS
Statements of Changes in Net Assets
| Growth | Opportunity | |||||||||||||||||||||||
| Portfolio | Portfolio | |||||||||||||||||||||||
| For the | For the | For the | For the | |||||||||||||||||||||
| year ended | year ended | year ended | year ended | |||||||||||||||||||||
| October 31, 2013 | October 31, 2012 | October 31, 2013 | October 31, 2012 | |||||||||||||||||||||
| Investment Activities: | ||||||||||||||||||||||||
| Operations: | ||||||||||||||||||||||||
| Net investment income (loss) | $ | 393,103 | $ | 116,496 | $ | 324,060 | $ | 224,890 | ||||||||||||||||
| Net realized gains (losses) from investments | 12,024,769 | 12,654,581 | 24,604,589 | 8,826,465 | ||||||||||||||||||||
| Change in unrealized appreciation/depreciation | ||||||||||||||||||||||||
| from investments | 11,744,016 | (6,525,872 | ) | 30,628,121 | 8,291,618 | |||||||||||||||||||
| Change in net assets resulting from operations | 24,161,888 | 6,245,205 | 55,556,770 | 17,342,973 | ||||||||||||||||||||
| Proceeds from contributions | 5,010,619 | 10,142,030 | 37,719,433 | 15,884,698 | ||||||||||||||||||||
| Value of withdrawals | (19,506,375 | ) | (42,657,788 | ) | (16,266,064 | ) | (24,493,548 | ) | ||||||||||||||||
| Change in net assets resulting from transactions | ||||||||||||||||||||||||
| in investors’ beneficial interest | (14,495,756 | ) | (32,515,758 | ) | 21,453,369 | (8,608,850 | ) | |||||||||||||||||
| Change in net assets | 9,666,132 | (26,270,553 | ) | 77,010,139 | 8,734,123 | |||||||||||||||||||
| Net Assets: | ||||||||||||||||||||||||
| Beginning of period | 79,018,334 | 105,288,887 | 150,058,525 | 141,324,402 | ||||||||||||||||||||
| End of period | $ | 88,684,466 | $ | 79,018,334 | $ | 227,068,664 | $ | 150,058,525 | ||||||||||||||||
| 38 | HSBC PORTFOLIOS | See notes to financial statements. |
| HSBC PORTFOLIOS |
| Financial Highlights |
Selected data for a share outstanding throughout the periods indicated.
| Ratios/Supplementary Data | ||||||||||||||||||||||||||||
| Ratios of | ||||||||||||||||||||||||||||
| Ratio of Net | Expenses | |||||||||||||||||||||||||||
| Ratio of Net | Investment | to Average | ||||||||||||||||||||||||||
| Net Assets at | Expenses to | Income (Loss) | Net Assets | |||||||||||||||||||||||||
| Total | End of Period | Average Net | to Average Net | (Excluding Fee | Portfolio | |||||||||||||||||||||||
| Return | (000’s) | Assets | Assets | Reductions) | Turnover | |||||||||||||||||||||||
| GROWTH PORTFOLIO | ||||||||||||||||||||||||||||
| Year Ended October 31, 2009 | 19.31 | % | $ | 88,163 | 0.69 | % | 0.17 | % | 0.69 | % | 66 | % | ||||||||||||||||
| Year Ended October 31, 2010 | 20.34 | % | $ | 98,751 | 0.68 | % | (0.04 | )% | 0.68 | % | 89 | % | ||||||||||||||||
| Year Ended October 31, 2011 | 11.07 | % | $ | 105,289 | 0.66 | % | 0.07 | % | 0.66 | % | 56 | % | ||||||||||||||||
| Year Ended October 31, 2012 | 7.18 | % | $ | 79,018 | 0.71 | % | 0.13 | % | 0.71 | % | 53 | % | ||||||||||||||||
| Year Ended October 31, 2013 | 32.84 | % | $ | 88,684 | 0.69 | % | 0.46 | % | 0.69 | % | 75 | % | ||||||||||||||||
| OPPORTUNITY PORTFOLIO | ||||||||||||||||||||||||||||
| Year Ended October 31, 2009 | 15.41 | % | $ | 129,748 | 0.90 | % | (0.37 | )% | 0.90 | % | 65 | % | ||||||||||||||||
| Year Ended October 31, 2010 | 28.74 | % | $ | 139,402 | 0.89 | % | (0.35 | )% | 0.89 | % | 68 | % | ||||||||||||||||
| Year Ended October 31, 2011 | 12.40 | % | $ | 141,324 | 0.88 | % | 0.05 | % | 0.88 | % | 69 | % | ||||||||||||||||
| Year Ended October 31, 2012 | 12.71 | % | $ | 150,059 | 0.91 | % | 0.15 | % | 0.91 | % | 59 | % | ||||||||||||||||
| Year Ended October 31, 2013 | 34.84 | % | $ | 227,069 | 0.89 | % | 0.17 | % | 0.89 | % | 70 | % | ||||||||||||||||
| See notes to financial statements. | HSBC PORTFOLIOS | 39 |
| HSBC PORTFOLIOS |
| Notes to Financial Statements — as of October 31, 2013 |
1. Organization:
The HSBC Portfolios (the “Portfolio Trust”), is an open-end management investment company organized as a New York trust under the laws of the State of New York on November 1, 1994. The Portfolio Trust contains the following master funds (individually a “Portfolio,” collectively the “Portfolios”):
| Portfolio | Short Name | |||
| HSBC Growth Portfolio | Growth Portfolio | |||
| HSBC Opportunity Portfolio | Opportunity Portfolio | |||
The Portfolios operate as master funds in master-feeder arrangements, in which other funds invest all or part of their investable assets in the Portfolios. The Portfolios also receive investments from funds of funds. The Declaration of Trust permits the Board of Trustees (the “Board”) to issue an unlimited number of beneficial interests in the Portfolios.
The Portfolios are diversified series of the Portfolio Trust and are part of the HSBC Family of Funds, which also includes the HSBC Advisor Funds Trust and HSBC Funds (collectively, the “Trusts”). Financial statements for all other funds of the Trusts are published separately.
Under the Portfolio Trust’s organizational documents, the Portfolio Trust’s officers and Trustees are indemnified against certain liabilities arising out of the performance of their duties to the Portfolios. In addition, in the normal course of business, the Portfolio Trust enters into contracts with its service providers, which also provide for indemnifications by the Portfolios. The Portfolios’ maximum exposure under these arrangements is unknown as this would involve any future claims that may be made against the Portfolios. However, based on experience, the Portfolio Trust expects that risk of loss to be remote.
2. Significant Accounting Policies:
The following is a summary of the significant accounting policies followed by the Portfolios in the preparation of their financial statements. The policies are in conformity with U.S. generally accepted accounting principles (“GAAP”). The preparation of financial statements requires management to make certain estimates and assumptions that affect the reported amounts of assets and liabilities and disclosure of contingent assets and liabilities at the date of the financial statements and the reported amounts of increases and decreases in net assets from operations during the reporting period. Actual results could differ from those estimates.
Securities Valuation:
The Portfolios record their investments at fair value. Fair value is defined as the price that would be received to sell an asset or paid to transfer a liability in an orderly transaction between market participants at the measurement date. The valuation techniques used to determine fair value are further described in Note 3 below.
Investment Transactions and Related Income:
Investment transactions are accounted for no later than one business day after trade date. However, for financial reporting purposes, investment transactions are accounted for on trade date. Investment gains and losses are calculated on the identified cost basis. Interest income is recognized on the accrual basis and includes, where applicable, the amortization or accretion of premium or discount. Dividend income is recorded on the ex-dividend date.
Expense Allocations:
Expenses directly attributable to a Portfolio are charged to that Portfolio. Expenses not directly attributable to a Portfolio are allocated proportionally among the applicable portfolios or funds within the Trusts in relation to net assets or on another reasonable basis.
40 HSBC PORTFOLIOS
| HSBC PORTFOLIOS |
| Notes to Financial Statements — as of October 31, 2013 (continued) |
Federal Income Taxes:
Each Portfolio will be treated as a partnership for U.S. federal income tax purposes. Accordingly, each Portfolio passes through all of its net investment income and gains and losses to its feeder funds, and is therefore not subject to U.S. federal income tax. As such, investors in the Portfolios will be taxed on their respective share of the Portfolios’ ordinary income and realized gains. It is intended that the Portfolios will be managed in such a way that an investor will be able to satisfy the requirements of the Internal Revenue Code, as amended, applicable to regulated investment companies.
Management of the Portfolios has reviewed tax positions taken in tax years that remain subject to examination by all major tax jurisdictions, including federal (i.e., the last four tax year ends and the interim tax period since then, as applicable). Management believes that there is no tax liability resulting from unrecognized tax benefits related to uncertain tax positions taken.
New Accounting Pronouncements:
In January 2013, the Financial Accounting Standards Board issued Accounting Standards Update (“ASU”) No. 2013-01 “Clarifying the Scope of Disclosures about Offsetting Assets and Liabilities” (“ASU 2013-01”) which amended Accounting Standards Codification Subtopic 210-20, Balance Sheet Offsetting. ASU 2013-01 clarified the scope of ASU No. 2011-11 “Disclosures about Offsetting Assets and Liabilities” (“ASU 2011-11”). ASU 2011-11 requires an entity to disclose information about offsetting and related arrangements to enable users of the financial statements to understand the effect of those arrangements on the entity’s financial position. ASU 2013-01 clarifies the scope of ASU 2011-11 as applying to derivatives accounted for in accordance with Topic 815, Derivatives and Hedging, including bifurcated embedded derivatives, repurchase agreements and reverse repurchase agreements, and securities borrowing and securities lending transactions that are offset either in accordance with other requirements of GAAP or subject to an enforceable master netting arrangement or similar agreement. The guidance in ASU 2013-01 and ASU 2011-11 is effective for interim and annual periods beginning on or after January 1, 2013. Management is evaluating any impact ASU 2013-01 and ASU 2011-11 may have on the Portfolios’ financial statements.
3. Investment Valuation Summary:
The valuation techniques employed by the Portfolios, as described below, maximize the use of observable inputs and minimize the use of unobservable inputs in determining fair value. The inputs used for valuing the Portfolios’ investments are summarized in the three broad levels listed below:
- Level 1: quoted prices in active markets for
identical assets
- Level 2: other significant observable inputs
(including quoted prices for similar securities, interest rates, prepayment speeds, credit risk, etc.)
- Level 3: significant unobservable inputs (including a Portfolio’s own assumptions in determining the fair value of investments)
Changes in valuation techniques may result in transfers in or out of an assigned level within the disclosure hierarchy. The Portfolios determine transfers between fair value hierarchy levels at the reporting period end. The inputs or methodology used for valuing investments are not necessarily an indication of the risk associated with investing in those investments.
Exchange traded, domestic equity securities are valued at the last sale price on a national securities exchange, or in the absence of recorded sales, at the readily available closing bid price on such exchanges, or at the quoted bid price in the over-the-counter market and are typically categorized as Level 1 in the fair value hierarchy.
Shares of exchange traded and closed-end registered investment companies are valued in the same manner as other equity securities and are typically categorized as Level 1 in the fair value hierarchy. Mutual funds are valued at their net asset values, as reported by such companies and are typically categorized as Level 1 in the fair value hierarchy.
HSBC PORTFOLIOS 41
| HSBC PORTFOLIOS |
| Notes to Financial Statements — as of October 31, 2013 (continued) |
Repurchase agreements are valued at original cost and are typically categorized as Level 2 in the fair value hierarchy.
Securities or other assets for which market quotations are not readily available, or are deemed unreliable due to a significant event or otherwise, are valued pursuant to procedures adopted by the Trusts’ Board (“Procedures”). Depending on the source and relative significance of valuation inputs, these instruments may be classified as Level 2 or Level 3 in the fair value hierarchy. Examples of potentially significant events that could affect the value of an individual security and thus require pricing under the Procedures include corporate actions by the issuer, announcements by the issuer relating to its earnings or products, regulatory news, natural disasters, and litigation. Examples of potentially significant events that could affect multiple securities held by a Portfolio include governmental actions, natural disasters, and armed conflicts. Fair value pricing may require subjective determinations about the value of a security. While the Portfolio Trust’s policy is intended to result in a calculation of a Portfolio’s net asset value that fairly reflects security values as of the time of pricing, the Portfolio Trust cannot ensure that fair values determined would accurately reflect the price that a Portfolio could obtain for a security if it were to dispose of that security as of the time of pricing. The prices used by a Portfolio may differ from the value that would be realized if the securities were sold and the differences could be material to the financial statements.
For the year ended October 31, 2013, there were no Level 3 investments for which significant unobservable inputs were used to determine fair value.
The following is a summary of the valuation inputs used as of October 31, 2013 in valuing the Portfolios’ investments based upon the three levels defined above. The breakdown of investment categorization is disclosed in the Schedule of Portfolio Investments for each Portfolio:
| LEVEL 1 ($) | LEVEL 2 ($) | LEVEL 3 ($) | Total ($) | |||||
| Growth Portfolio | ||||||||
| Investment Securities: | ||||||||
| Common Stocks | 87,746,575 | — | — | 87,746,575 | ||||
| Investment Companies | 606,946 | — | — | 606,946 | ||||
| Total Investment Securities | 88,353,521 | — | — | 88,353,521 | ||||
| Opportunity Portfolio | ||||||||
| Investment Securities: | ||||||||
| Common Stocks | 218,971,403 | — | — | 218,971,403 | ||||
| Investment Companies | 6,563,134 | — | — | 6,563,134 | ||||
| Total Investment Securities | 225,534,537 | — | — | 225,534,537 | ||||
4. Related Party Transactions and Other Agreements:
Investment Management:
HSBC Global Asset Management (USA) Inc. (“HSBC” or the “Investment Adviser”), a wholly owned subsidiary of HSBC Bank USA, N.A., a national bank organized under the laws of the United States, acts as the Investment Adviser to the Portfolios pursuant to an investment management contract with the Portfolio Trust. As Investment Adviser, HSBC manages the investments of the Portfolios and continuously reviews, supervises, and administers the Portfolios’ investments. Winslow Capital Management, LLC (“Winslow”) and Westfield Capital Management Company, L.P. (“Westfield”) serve as subadvisers for the Growth Portfolio and Opportunity Portfolio, respectively, and are paid for their services directly by the respective Portfolios.
42 HSBC PORTFOLIOS
| HSBC PORTFOLIOS |
| Notes to Financial Statements — as of October 31, 2013 (continued) |
For their services, the Investment Adviser and Winslow receive in aggregate, from the Growth Portfolio, a fee, accrued daily and paid monthly, at an annual rate of:
| Based on Average Daily Net Assets of all Sub-Adviser serviced funds and separate accounts affiliated | |||
| with HSBC: | Fee Rate(%)* | ||
| Up to $250 million | 0.575 | ||
| In excess of $250 million but not exceeding $500 million | 0.525 | ||
| In excess of $500 million but not exceeding $750 million | 0.475 | ||
| In excess of $750 million but not exceeding $1 billion | 0.425 | ||
| In excess of $1 billion | 0.375 | ||
| * | The Growth Portfolio may pay the Investment Adviser and Winslow an aggregate maximum fee of up to 0.68%. Currently, the Investment Adviser’s contractual fee is 0.175% and Winslow’s maximum contractual fee is 0.40%. Accordingly, the current aggregate maximum fee rate is 0.575%. |
For their services, the Investment Adviser and Westfield receive in aggregate, a fee, accrued daily and paid monthly, at an annual rate of 0.80% of the Opportunity Portfolio’s average daily net assets.
Administration:
HSBC serves the Portfolios as Administrator. Under the terms of the Administration Agreement, HSBC receives from the Portfolios (as well as other funds in the Trusts combined) a fee, accrued daily and paid monthly at an annual rate of:
| Based on Combined Average Daily Net Assets of | Fee Rate(%) | ||
| Up to $10 billion | 0.0550 | ||
| In excess of $10 billion but not exceeding $20 billion | 0.0350 | ||
| In excess of $20 billion but not exceeding $50 billion | 0.0275 | ||
| In excess of $50 billion | 0.0250 | ||
The fee rates and breakpoints are determined on the basis of the aggregate average daily net assets of the Trusts, however, the assets of the funds of the HSBC Funds and HSBC Advisor Funds Trust that invest in the Portfolios are not double-counted. The total administration fee paid to HSBC is allocated to each series based upon its proportionate share of the aggregate net assets of the Trusts. For assets invested in the Portfolios by the funds of the HSBC Funds and HSBC Advisor Funds Trust, the Portfolios pay half of the administration fee and the other funds pay half of the administration fee, for a combination of the total fee rate set forth above.
Pursuant to a Sub-Administration Agreement with HSBC, Citi Fund Services Ohio, Inc. (“Citi”), a wholly-owned subsidiary of Citigroup, Inc., serves as the Trusts’ Sub-Administrator subject to the general supervision by the Trusts’ Board and HSBC. For these services, Citi is entitled to a fee, payable by HSBC, at an annual rate equivalent to the fee rates set forth above subject to certain reductions associated with services provided to new portfolios, minus 0.02% which is retained by HSBC.
Under a Compliance Services Agreement between the Trusts and Citi (the “CCO Agreement”), Citi makes an employee available to serve as the Trusts’ Chief Compliance Officer (the “CCO”). Under the CCO Agreement, Citi also provides infrastructure and support in implementing the written policies and procedures comprising the Trusts’ compliance program, including support services to the CCO. For the services provided under the CCO Agreement, the Trusts paid Citi $287,560 for the year ended October 31, 2013, plus reimbursement of certain out of pocket expenses. Expenses incurred by each Portfolio are reflected on the Statements of Operations as “Compliance Services.” Citi pays the salary and other compensation earned by individuals performing these services, as employees of Citi.
Fund Accounting:
Citi provides fund accounting services for the Portfolio Trust. For its services to the Portfolios, Citi receives an annual fee per portfolio, including reimbursement of certain expenses, that is accrued daily and paid monthly.
HSBC PORTFOLIOS 43
| HSBC PORTFOLIOS |
| Notes to Financial Statements — as of October 31, 2013 (continued) |
Independent Trustees:
The Trusts pay each Independent Trustee an annual retainer of $100,000. The Trusts pay a fee of $10,000 for each regular meeting of the Board attended and a fee of $ 3,000 for each special meeting attended. The Trusts pay each Committee Chair an annual retainer of $ 3,000, with the exception of the Chair of the Audit Committee, who receives a retainer of $ 6,000. The Trusts also pay the Chairman of the Board an additional annual retainer of $24,000. In addition, for time expended on Board duties outside normal meetings, which is authorized by the Board, a Trustee is compensated at the rate of $ 500 per hour, up to a maximum of $ 3,000 per day.
5. Investment Transactions:
Cost of purchases and proceeds from sales of securities (excluding securities maturing less than one year from acquisition) for the year ended October 31, 2013 were as follow:
| Purchases ($) | Sales ($) | |||
| Growth Portfolio | 62,055,996 | 74,114,396 | ||
| Opportunity Portfolio | 144,039,393 | 126,127,698 |
For the year ended October 31, 2013, there were no long-term U.S. government securities held by the Portfolio Trust.
6. Federal Income Tax Information:
At October 31, 2013, the cost basis of securities for federal income tax purposes, gross unrealized appreciation, gross unrealized depreciation and net unrealized appreciation/depreciation were as follows:
| Net Unrealized | |||||||||||
| Tax Unrealized | Tax Unrealized | Appreciation/ | |||||||||
| Tax Cost ($) | Appreciation ($) | Depreciation ($) | (Depreciation) ($)* | ||||||||
| Growth Portfolio | 59,903,953 | 28,711,719 | (262,151 | ) | 28,449,568 | ||||||
| Opportunity Portfolio | 174,027,654 | 53,521,776 | (2,014,893 | ) | 51,506,883 | ||||||
| * | The difference between book-basis unrealized appreciation (depreciation) is attributable primarily to tax deferral of losses on wash sales. |
7. Subsequent Events:
Management has evaluated events and transactions through the date the financial statements were issued, for purposes of recognition or disclosure in these financial statements and there are no subsequent events to report.
44 HSBC PORTFOLIOS
Report of Independent Registered Public Accounting Firm
To the Shareholders and Board of
Trustees of
HSBC Portfolios:
We have audited the accompanying statements of assets and liabilities of HSBC Portfolios – HSBC Growth Portfolio and HSBC Opportunity Portfolio (the Funds), including the schedules of portfolio investments, as of October 31, 2013, and the related statements of operations for the year then ended, the statements of changes in net assets for each of the years in the two-year period then ended, and the financial highlights for each of the years in the five-year period then ended. These financial statements and financial highlights are the responsibility of the Funds’ management. Our responsibility is to express an opinion on these financial statements and financial highlights based on our audits.
We conducted our audits in accordance with the standards of the Public Company Accounting Oversight Board (United States). Those standards require that we plan and perform the audit to obtain reasonable assurance about whether the financial statements and financial highlights are free of material misstatement. An audit includes examining, on a test basis, evidence supporting the amounts and disclosures in the financial statements. Our procedures included confirmation of securities owned as of October 31, 2013, by correspondence with custodians and brokers or by other appropriate auditing procedures. An audit also includes assessing the accounting principles used and significant estimates made by management, as well as evaluating the overall financial statement presentation. We believe that our audits provide a reasonable basis for our opinion.
In our opinion, the financial statements and financial highlights referred to above present fairly, in all material respects, the financial position of the Funds as of October 31, 2013, the results of their operations for the year then ended, the changes in their net assets for each of the years in the two-year period then ended, and the financial highlights for each of the years in the five-year period then ended, in conformity with U.S. generally accepted accounting principles.

Columbus, Ohio
December 27, 2013
HSBC PORTFOLIOS 45
| HSBC PORTFOLIOS |
| Table of Shareholder Expenses — as of October 31, 2013 (Unaudited) |
As a shareholder of the Portfolios, you incur ongoing costs, including management fees and other Fund expenses.
These examples are intended to help you understand your ongoing costs (in dollars) of investing in the Portfolios and to compare these costs with the ongoing costs of investing in other mutual funds.
These examples are based on an investment of $1,000 invested at the beginning of the period and held for the entire period from May 1, 2013 through October 31, 2013.
Actual Example
The table below provides information about actual account values and actual expenses. You may use the information below, together with the amount you invested, to estimate the expenses that you paid over the period. Simply divide your account value by $1,000 (for example, an $8,600 account value divided by $1,000 = 8.6), then multiply the result by the number in the table under the heading entitled “Expenses Paid During Period” to estimate the expenses you paid on your account during this period.
| Annualized | ||||||||||||||||||||
| Beginning | Ending | Expenses Paid | Expense Ratio | |||||||||||||||||
| Account Value | Account Value | During Period* | During Period | |||||||||||||||||
| 5/1/13 | 10/31/13 | 5/1/13 - 10/31/13 | 5/1/13 - 10/31/13 | |||||||||||||||||
| Growth Portfolio | $ | 1,000.00 | $ | 1,170.40 | $ | 3.61 | 0.66 | % | ||||||||||||
| Opportunity Portfolio | 1,000.00 | 1,139.50 | 4.75 | 0.88 | % | |||||||||||||||
Hypothetical Example for Comparison Purposes
The table below provides information about hypothetical account values and hypothetical expenses based on each Portfolio’s actual expense ratio and an assumed rate of return of 5% per year before expenses, which is not the Portfolio’s actual return. The hypothetical account values and expenses may not be used to estimate the actual ending account balance or expenses you paid for the period. You may use this information to compare this 5% hypothetical example with the 5% hypothetical examples that appear in the shareholder reports of other funds.
Please note that the expenses shown in the table are meant to highlight your ongoing costs only and do not reflect any transactional costs, such as sales charges (loads), redemption fees, or exchange fees. Therefore, the table is useful in comparing ongoing costs only, and will not help you determine the relative total costs of owning different funds. In addition, if these transactional costs were included, your costs would have been higher.
| Annualized | ||||||||||||||||||||
| Beginning | Ending | Expenses Paid | Expense Ratio | |||||||||||||||||
| Account Value | Account Value | During Period* | During Period | |||||||||||||||||
| 5/1/13 | 10/31/13 | 5/1/13 - 10/31/13 | 5/1/13 - 10/31/13 | |||||||||||||||||
| Growth Portfolio | $ | 1,000.00 | $ | 1,021.88 | $ | 3.36 | 0.66 | % | ||||||||||||
| Opportunity Portfolio | 1,000.00 | 1,020.77 | 4.48 | 0.88 | % | |||||||||||||||
| * | Expenses are equal to the average account value over the period, multiplied by the Portfolio's annualized expense ratio, multiplied by 184/365 (to reflect the one half year period). |
46 HSBC PORTFOLIOS
| HSBC PORTFOLIOS |
| Board of Trustees and Officers (Unaudited) |
MANAGEMENT OF THE TRUST
The following table contains information regarding the HSBC Family of Funds’ Board of Trustees (“Trustees”). Asterisks indicate those Trustees who are “interested persons,” as defined in the Investment Company Act of 1940, as amended, of the HSBC Family of Funds. The HSBC Family of Funds’ Statement of Additional Information includes additional information about the Trustees and is available, without charge, upon request by calling (888) 525-5757.
| Portfolios in | ||||||||||
| Position(s) | Term of Office | Fund Complex | Other | |||||||
| Name, | Held with | and Length of | Principal Occupation(s) | Overseen By | Directorships | |||||
| Address, Age | Funds | Time Served | During Past 5 Years | Trustee* | Held by Trustee | |||||
| NON-INTERESTED | ||||||||||
| TRUSTEES | ||||||||||
|
MARCIA L. BECK |
Trustee |
Indefinite; |
Private Investor (June 1999 – present); Executive Vice President, Prudential Investments (1997 – 1999); President and Trustee, The Goldman Sachs Mutual Funds (1992 – 1996) |
21 |
None | |||||
|
SUSAN C. GAUSE |
Trustee |
Indefinite; |
Since 2003, Private
Investor; Independent Trustee of Met Investors Series Trust (2008-2012);
Chief Executive Officer, Dresdner RCM Global Investors and Allianz
Dresdner Asset Management (2000-2002); Board Member of Dresdner Global
Asset Management Board (2000-2002); Chief Operating Officer and Senior
Managing Director of Dresdner RCM Global Investors
(1998-2000) |
21 |
Since 2012,
Trustee, | |||||
|
SUSAN S. HUANG |
Trustee |
Indefinite; |
Private Investor (2000- present); Senior Vice President, Schroder Investment Management (2001 – 2004); Managing Director, Chase Asset Management (1995-2000) |
21 |
None | |||||
|
ALAN S. PARSOW |
Trustee |
Indefinite; |
General Partner, Elkhorn Partners, L.P. (a private investment partnership) (1989 – present) |
21 |
None | |||||
|
THOMAS F. ROBARDS |
Trustee |
Indefinite; |
Partner, Robards & Co. LLC (investment and advisory services) (2005-present); Chief Financial Officer, American Museum of Natural History (2003- 2004); Chief Financial Officer, Datek Online Holdings (2000-2003); Previously EVP and CFO Republic New York Corporation |
21 |
Overseas Shipholding | |||||
MICHAEL
SEELY |
Chairman
and |
Indefinite; |
Private Investor (2003-present); General Partner, Global Multi Manager Partners (1999-2003); President of Investor Access Corporation (1981-2003) |
21 |
None | |||||
|
INTERESTED TRUSTEE |
||||||||||
|
DEBORAH HAZELL |
Trustee |
Indefinite; |
CEO, HSBC Global Asset Management (USA) Inc. (2011-present); President and CEO, Fisher Francis Trees & Watts (“FFTW”) (investment advisor), February 2008-June 2011; Head of Client Service, Business Development and Marketing Group, FFTW (October 1999-February 2008) |
21 |
None |
| * | Includes the Trust, the HSBC Advisor Fund Trust and the HSBC Portfolios. |
HSBC PORTFOLIOS 47
| HSBC PORTFOLIOS | |
| Board of Trustees and Officers (Unaudited) (continued) | |
| Position(s) Held | Term of Office and | Principal Occupation(s) | ||||
| Name, Address, Age | with Funds | Length of Time Served | During Past 5 Years | |||
| OFFICERS | ||||||
|
RICHARD A. FABIETTI |
President |
One year; |
Senior Vice President, Head of
Product Management, HSBC Global Asset Management (USA) Inc. | |||
|
STEPHEN SIVILLO |
Vice President |
One year; |
Vice President of Product Administration, HSBC Global Asset Management (USA) Inc. (2010 - present); Chief Compliance Officer, Managers Funds (2009 – 2010); Director, Mutual Fund Compliance, AllianceBernstein (2007-2009) | |||
|
TY EDWARDS* |
Treasurer |
One year; |
Senior Vice President, Citi Fund Services (2010– present); Director, Product Management, Columbia Management (2007-2009); Deputy Treasurer, Columbia Funds, (2006-2007) | |||
|
JENNIFER A. ENGLISH* |
Secretary |
One year; |
Senior Vice President, Regulatory Administration, Citi (2005 - present) | |||
|
FREDERICK J. SCHMIDT* |
Chief Compliance
|
One year; |
Director and Chief Compliance Officer, CCO Services, Citi (2004 - present) |
| * | Mr. Edwards, Mr. Schmidt, and Ms. English also are officers of other investment companies of which Citi (or an affiliate) is the administrator or sub-administrator. |
48 HSBC PORTFOLIOS
Other Information (Unaudited):
Information regarding how the Funds voted proxies relating to portfolio securities during the most recent 12-month period ended June 30th is available (i) without charge, upon request, by calling 1-800-525-5757 for HSBC Bank USA and HSBC Brokerage (USA) Inc. clients and 1-800-782-8183 for all other shareholders; (ii) on the Funds’ website at www.investorfunds.us.hsbc.com; and (iii) on the Security and Exchange Commission’s (“Commission”) website at http://www.sec.gov.
The Funds file their complete schedules of portfolio holdings with the Commission for the first and third quarters of each fiscal year on Form N-Q. The Funds’ Forms N-Q are available on the Commission’s website at http://www.sec.gov. The Funds’ Forms N-Q may be reviewed and copied at the Commission’s Public Reference Room in Washington, D.C. and information on the operation of the Public Reference Room may be obtained by calling 1-800-SEC-0330. The Funds’ Schedules of Investments will be available no later than 60 days after each period end, without charge, on the Funds’ website at www.investorfunds.us.hsbc.com.
An investment in a Fund is not a deposit of HSBC Bank USA, National Association, and is not insured or guaranteed by the Federal Deposit Insurance Corporation or any other government agency.
HSBC PORTFOLIOS 49
|
HSBC FAMILY OF FUNDS: INVESTMENT ADVISER AND ADMINISTRATOR HSBC Global Asset Management
(USA) Inc. SUB-ADVISERS HSBC Growth
Portfolio HSBC Opportunity
Portfolio |
SHAREHOLDER SERVICING AGENTS For HSBC Bank USA, N.A.
and HSBC Bank USA, N.A. For All Other Shareholders HSBC Funds TRANSFER AGENT Citi Fund Services DISTRIBUTOR Foreside Distribution
Services, L.P. CUSTODIAN The Northern Trust Company
INDEPENDENT REGISTERED PUBLIC ACCOUNTING FIRM KPMG LLP LEGAL COUNSEL Dechert LLP |

| Investment products: | ||
| ARE NOT A
BANK DEPOSIT OR OBLIGATION OF THE BANK OR ANY OF ITS AFFILIATES |
ARE NOT FDIC INSURED |
ARE
NOT INSURED BY ANY FEDERAL GOVERNMENT AGENCY |
| ARE NOT
GUARANTEED BY THE BANK OR ANY OF ITS AFFILIATES |
MAY
LOSE VALUE | |
Investment products are offered by HSBC Securities (USA) Inc. (HSI), member NYSE/FINRA/SIPC. HSI is an affiliate of HSBC Bank USA, N.A. Investment products: Are not a deposit or other obligation of the bank or any of its affiliates; Not FDIC insured or insured by any federal government agency of the United States; Not guaranteed by the bank or any of its affiliates; and are subject to investment risk, including possible loss of principal invested.
| HSB-AR-RTL-1213 | 12/13 |
Item 2. Code of Ethics.
(a) The registrant has adopted a code of ethics that applies to the registrant’s principal executive officer, principal financial officer, principal accounting officer or controller, or persons performing similar functions. This code of ethics is included as an Exhibit.
(b) During the period covered by the report, with respect to the registrant's code of ethics that applies to its principal executive officer, principal financial officer, principal accounting officer or controller, or persons performing similar functions; there have been no amendments to, nor any waivers granted from, a provision that relates to any element of the code of ethics definition enumerated in paragraph (b) of this Item 2.
Item 3. Audit Committee Financial Expert.
3(a)(1) The registrant’s board of directors has determined that the registrant has at least one audit committee financial expert serving on its audit committee.
3(a)(2) The audit committee financial expert is Thomas Robards, who is “independent” for purposes of this Item 3 of Form N-CSR.
| (a) Audit Fees, | |||
| 2012 | $11,765 | ||
| 2013 | $11,765 | ||
| (b) Audit-Related Fees, | |||
| 2012 | $350 | ||
| 2013 | $389 | ||
2012
– Fees of $350 relate to the consent of N-1A
filing.
2013 – Fees of $389
relate to the consent of N-1A filing.
| (c) Tax Fees, | |||
| 2012 | $11,090 | ||
| 2013 | $5,700 | ||
Fees for both 2012 and 2013 relate to the preparation of federal income and excise tax returns and the review of excise tax distributions.
| (d) All Other Fees, | |||
| 2012 | $0 | ||
| 2013 | $0 | ||
(e)(1) The audit committee is required to pre-approve all audit and permitted non-audit services performed by the registrant’s independent auditors in accordance with the audit committee charter and the Investment Company Act of 1940.
| 2012 | 0% | ||
| 2013 | 0% |
(f) Not applicable.
| (g) Non-Audit Fees. | |||
| 2012 | $11,440 | ||
| 2013 | $6,089 | ||
(h) The audit committee considered the nonaudit services rendered to the registrant’s investment adviser and any entity controlling, controlled by, or under common control with the investment adviser, and believes the services are compatible with the principal accountant’s independence.
Item 5. Audit Committee of Listed Registrants.
Not applicable.
Item 6. Investments.
(a)
Included as a part of the report to shareholders
filed under Item 1.
(b) Not applicable.
Item 7. Disclosure of Proxy Voting Policies and Procedures for Closed-End Management Investment Companies.
Not applicable.
Item 8. Portfolio Managers of Closed-End Management Investment Companies.
Not applicable.
Item 9. Purchases of Equity Securities by Closed-End Management Investment Company and Affiliated Purchasers.
Not applicable.
Item 10. Submission of Matters to a Vote of Security Holders.
Not applicable.
Item 11. Controls and Procedures.
(a)The registrant’s principal executive officer and principal financial officer have concluded, based on their evaluation of the registrant's disclosure controls and procedures as conducted within 90 days of the filing date of this report, that these disclosure controls and procedures are adequately designed and are operating effectively to ensure that information required to be disclosed by the registrant on Form N-CSR is recorded, processed, summarized and reported within the time periods specified in the Securities and Exchange Commission's rules and forms.
(b)There were no changes in the registrant’s internal control over financial reporting (as defined in Rule 30a-3(d) under the Act (17 CFR 270.30a-3(d)) that occurred during the second fiscal quarter of the period covered by this report that have materially affected or are reasonably likely to materially affect, the registrant’s internal control over financial reporting.
Item 12. Exhibits.
(a)(1) The code of ethics that is the subject of the disclosure required by Item 2 is attached hereto.
(a)(2) Certifications pursuant to Rule 30a-2(a) are attached hereto.
(a)(3) Not applicable.
(b) Certifications pursuant to Rule 30a-2(b) are furnished herewith.
SIGNATURES
Pursuant to the requirements of the Securities Exchange Act of 1934 and the Investment Company Act of 1940, the registrant has duly caused this report to be signed on its behalf by the undersigned, thereunto duly authorized.
| (Registrant) | HSBC ADVISOR FUNDS TRUST |
| By (Signature and Title) | /s/ Richard A. Fabietti |
| Richard A. Fabietti | |
| President |
| Date | 12/23/13 |
Pursuant to the requirements of the Securities Exchange Act of 1934 and the Investment Company Act of 1940, this report has been signed below by the following persons on behalf of the registrant and in the capacities and on the dates indicated.
| By (Signature and Title) | /s/ Richard A. Fabietti |
| Richard A. Fabietti | |
| President |
| Date | 12/23/13 |
| By (Signature and Title) | /s/ Ty Edwards |
| Ty Edwards | |
| Treasurer |
| Date | 12/23/13 |