SEC Exhibit
Q2 FY 2016 Earnings
Prepared Comments and Slides
May 19, 2016
Michael Iburg
Investor Relations
Phone: 408-333-0233
miburg@Brocade.com
Ed Graczyk
Media Relations
Phone: 408-333-1836
egraczyk@Brocade.com
NASDAQ: BRCD
Brocade Q2 FY 2016 Earnings 5/19/2016
Prepared comments provided by Michael Iburg, Investor Relations
Thank you for your interest in Brocade’s Q2 Fiscal 2016 earnings presentation, which includes prepared remarks, cautionary statements and disclosures, slides, and a press release detailing fiscal second quarter 2016 results. The press release, along with these prepared comments and slides, has been furnished to the SEC on Form 8-K and has been made available on the Brocade Investor Relations website at www.brcd.com. The press release will be issued subsequently via Marketwired.
© 2016 Brocade Communications Systems, Inc. Page 2 of 24
Brocade Q2 FY 2016 Earnings 5/19/2016
© 2016 Brocade Communications Systems, Inc. Page 3 of 24
Brocade Q2 FY 2016 Earnings 5/19/2016
© 2016 Brocade Communications Systems, Inc. Page 4 of 24
Brocade Q2 FY 2016 Earnings 5/19/2016
Today’s prepared comments include remarks by Lloyd Carney, Brocade CEO, regarding the company’s quarterly results, its strategy, and a review of operations, as well as industry trends and market/technology drivers related to its business; and by Dan Fairfax, Brocade CFO, who will provide a financial review.
A management discussion and live question and answer conference call will be webcast at
2:30 p.m. Pacific Time on May 19 at www.brcd.com and will be archived on the Brocade Investor Relations website.
© 2016 Brocade Communications Systems, Inc. Page 5 of 24
Brocade Q2 FY 2016 Earnings 5/19/2016
Prepared comments provided by Lloyd Carney, CEO
© 2016 Brocade Communications Systems, Inc. Page 6 of 24
Brocade Q2 FY 2016 Earnings 5/19/2016
While we saw many successes in fiscal Q2, including the announcement of our intention to acquire Ruckus Wireless, revenue for the quarter fell short of our expectations, consistent with the softer demand environment reported by many of our partners and peers. This was the result of lower than anticipated SAN revenue, coupled with ongoing headwinds in IP Networking. We are addressing the current market environment by continuing to maintain careful financial management of our business, focusing on expense control and prioritized investments.
Despite these challenges, Q2 was a highly productive and exciting quarter for Brocade. We continue to demonstrate our leadership in storage networking with the launch of our Gen 6 Fibre Channel technology that, once again, sets the standard for performance and innovation in our industry.
We also achieved our first revenue-generating customer wins for the disruptive new mobility platform we announced early in Q2, the Brocade Virtual Core for Mobile. This offering, which is the culmination of internal R&D coupled with a targeted, strategic acquisition, expands our TAM into new markets and is generating strong customer interest.
Finally, we continue to execute on our strategy to build a pure-play networking company that supports the rapidly evolving requirements of the digital transformation era. During Q2, we acquired StackStorm, underscoring our commitment to open source software, datacenter automation, and DevOps models.
We also announced our intent to acquire Ruckus Wireless, a pioneer in wireless infrastructure, in a transaction that is expected to close in our fiscal Q3. This acquisition enhances our scale and competitive positioning in both enterprise networking and service provider markets, and seamlessly complements the mobility strategy that we announced in February. We believe this acquisition provides exciting opportunity to expand our market reach, diversify our revenue mix, and drive incremental opportunities for growth.
© 2016 Brocade Communications Systems, Inc. Page 7 of 24
Brocade Q2 FY 2016 Earnings 5/19/2016
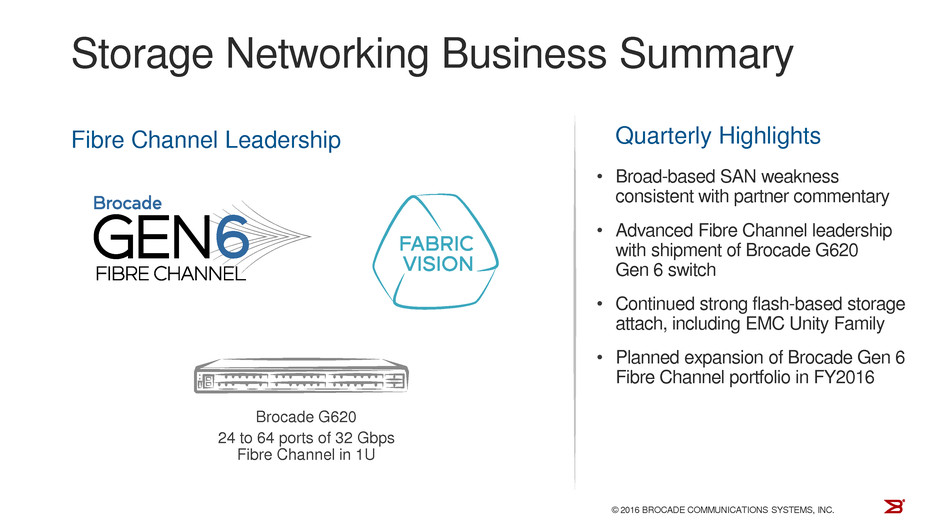
Reflecting the general storage market sentiment, our revenue results came in below our expectations for both directors and switches. The weakness was broadly spread across our partner base, and appears to indicate lower overall storage spending.
During Q2, we began shipping the industry’s first Gen 6 Fibre Channel solution, the Brocade G620 switch, advancing our sustained leadership in Fibre Channel technology. This new purpose-built, high-density solution delivers the performance, reliability and scalability to support exponential data growth and mission-critical workloads. In addition, our Gen 6 Fabric Vision technology also includes Brocade’s IO Insight to help organizations achieve greater visibility into network performance.
We expect that Fibre Channel will continue to be an integral part of every wave of storage innovation in the data center. For example, Gen 6 Fibre Channel is especially well suited for new technologies, such as flash-based storage. It can deliver the low-latency, high-capacity bandwidth and reliability for optimal application performance, as well as always-on business operations.
In conjunction with EMC World, we announced that our Gen 6 Fibre Channel and IP storage networking technologies are providing a network foundation for the recently announced EMC Unity all-flash and hybrid storage family of solutions.
Over the course of fiscal year 2016, we expect to further expand our Gen 6 portfolio of high-performance products with additional solutions, including directors and embedded switches, to support a variety of environments and customer needs.
© 2016 Brocade Communications Systems, Inc. Page 8 of 24
Brocade Q2 FY 2016 Earnings 5/19/2016
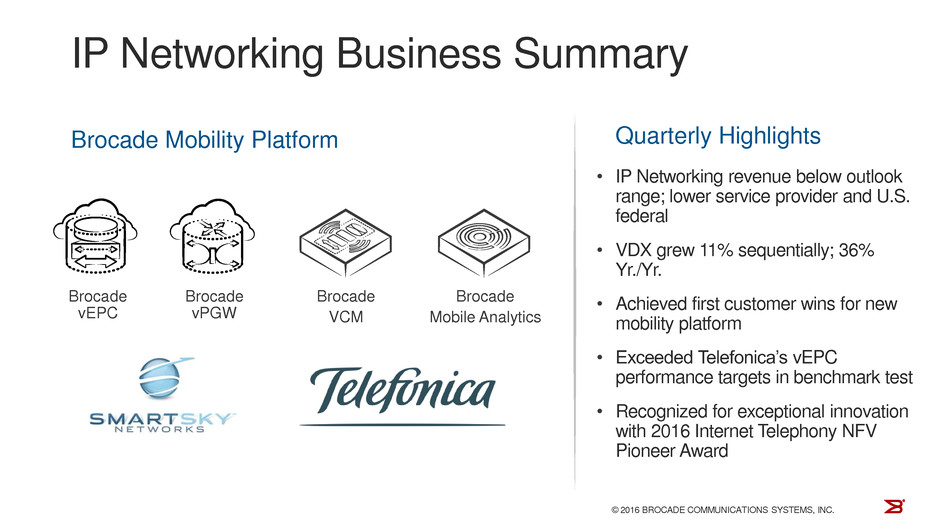
IP Networking revenue in Q2 was below our outlook range. The year-over-year decline was largely the result of lower router sales to service provider customers and slower U.S. federal market spending within the programs and projects where we are engaged.
From a product perspective, we achieved some encouraging results. We grew VDX® sales by 11% sequentially and 36% year over year. This reflects demand from both traditional data center deployments, as well as increasing IP storage deployments, including sales of the EMC Connectrix VDX-6740B IP storage switch.
In addition, customer response to our new mobility platform has been positive. We drew heavy traffic at our booth at Mobile World Congress in February, and were also featured in the booths of more than a dozen ecosystem partners. Our solutions solve unique challenges faced by mobile network operators and mobile virtual network operators, providing a New IP technology foundation well in advance of 5G availability.
During the quarter, we were pleased to announce our first customer win for this platform with SmartSky Networks. SmartSky is building an air-to-ground broadband network, deploying the Brocade Virtual Evolved Packet Core (vEPC) running on VMware vCloud NFV. This solution enables SmartSky to take a software-defined approach to network infrastructure that is more agile, flexible and cost-effective than a pure hardware-based approach.
In addition, this week Brocade and Telefonica announced that we have completed critical performance benchmark testing for the vEPC implementation within Telefonica’s NFV Reference Lab framework. We were pleased with the results of this testing, which established the stability and capacity of our vEPC solution across a wide range of packet sizes in a standard test environment and exceeded the performance expectations.
In addition to customer success, our mobility platform is also winning the accolades of industry groups. The Brocade Virtual Packet Broker and its mobile edge virtual infrastructure offering were each recognized for exceptional innovation with a 2016 Internet Telephony NFV Pioneer Award.
© 2016 Brocade Communications Systems, Inc. Page 9 of 24
Brocade Q2 FY 2016 Earnings 5/19/2016
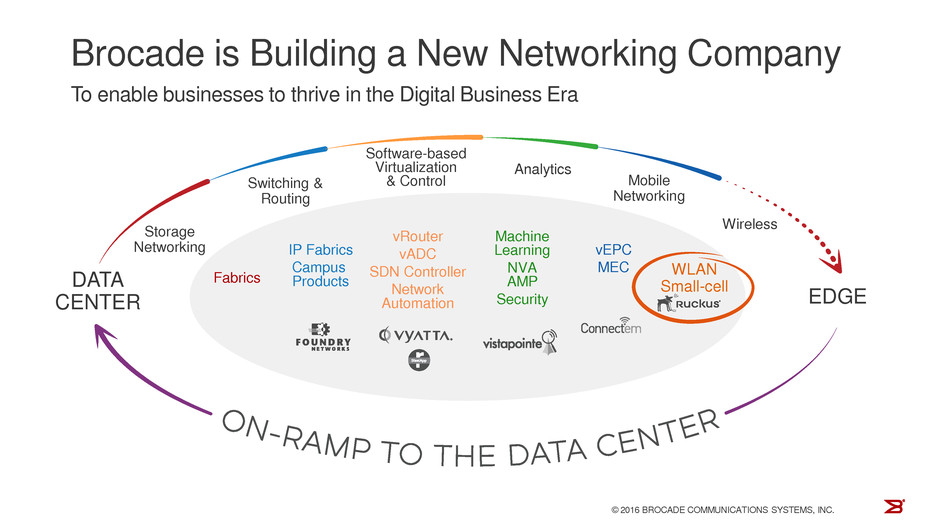
For the past four years, Brocade has been focused on helping customers transform their networks into an open platform for business innovation. As such, we have developed or acquired critical technologies for New IP architectures in areas such as fabrics, software-based virtualization, network analytics and mobile networking. Our recent announcement of our intent to acquire Ruckus is another important step in this journey as it adds a critical access technology for New IP networks.
In our core business, the Ruckus portfolio is complementary to our enterprise networking portfolio and is expected to strengthen our position in the broader service provider market.
The combined company is also expected to accelerate our cross-selling activities across a variety of vertical markets and industry segments, including large enterprise, government, hospitality, higher education, and K-12 education.
In the growth areas of SDN and NFV, Ruckus builds upon our current portfolio of industry leading virtual routers, and virtual application delivery controllers, analytics solutions, and SDN controllers. We believe we can leverage the strength of the Ruckus Virtual SmartZone NFV-based Wireless LAN controller to expand the reach of the combined portfolio with leading cloud and telco providers.
In the longer term, we see emerging opportunities in analytics, mobility, and security. We believe that this acquisition will further strengthen the mobility strategy we announced in February, and will enhance our ability to pursue emerging opportunities around 5G mobile services, Internet of Things (IoT), Smart Cities, in-building LTE, and wireless/Wi-Fi convergence.
© 2016 Brocade Communications Systems, Inc. Page 10 of 24
Brocade Q2 FY 2016 Earnings 5/19/2016
In closing, recent market softness impacted our Q2 revenue results, and is expected to provide a headwind in Q3. As such, we will continue to take the appropriate actions to control expenses and manage our investments in line with our stated priorities.
At a strategic level, we continue to drive our evolution as a pure-play networking provider for the digital transformation era. Through focused investments in our product and technology portfolio, we are bringing to market innovative solutions that are being recognized by both our industry and customers. We expect to further our roadmap this fiscal year with advancements across our portfolio that set the stage for expanded opportunities in the quarters to come.
© 2016 Brocade Communications Systems, Inc. Page 11 of 24
Brocade Q2 FY 2016 Earnings 5/19/2016
Prepared comments provided by Dan Fairfax, CFO
© 2016 Brocade Communications Systems, Inc. Page 12 of 24
Brocade Q2 FY 2016 Earnings 5/19/2016
Fiscal Q2 16 was weaker than anticipated, with a larger than expected seasonal decline in SAN revenue in addition to a sequential decline in IP Networking revenue.
Q2 16 revenue of $523M was down 4% Yr./Yr. primarily due to lower SAN and IP Networking revenue, partially offset by higher Global Services revenue. SAN product revenue was down 5% Yr./Yr. as director revenue decreased 6% and switch and embedded revenues were down 4% and 9%, respectively. IP Networking product revenue was down 9% Yr./Yr. due to lower service provider and U.S. federal sales.
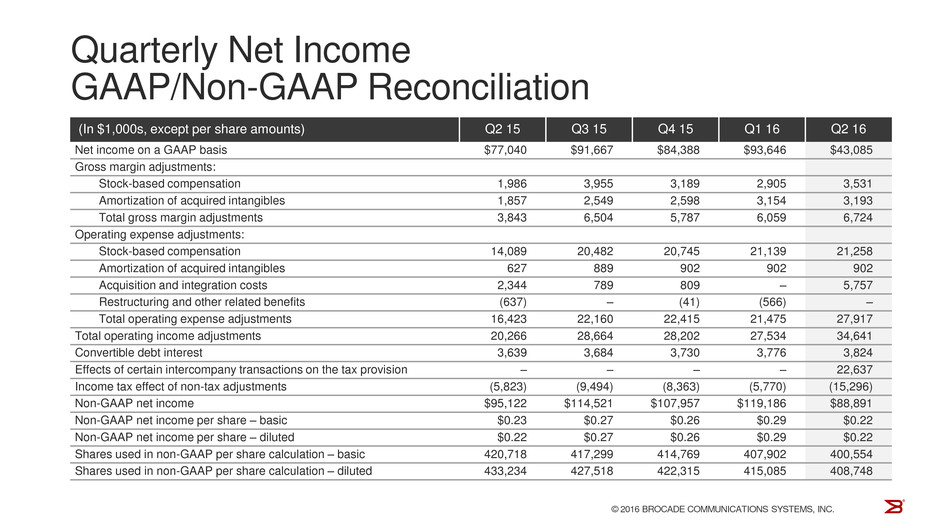
Non-GAAP gross margin was 68.2% in Q2 16, down 60 basis points year-over-year due primarily to lower revenue. Non-GAAP operating margin was 22.4% in Q2 16, down 220 basis points from Q2 15, primarily due to higher operating expenses and lower revenue.
Q2 16 non-GAAP diluted EPS of $0.22 was flat year-over-year.
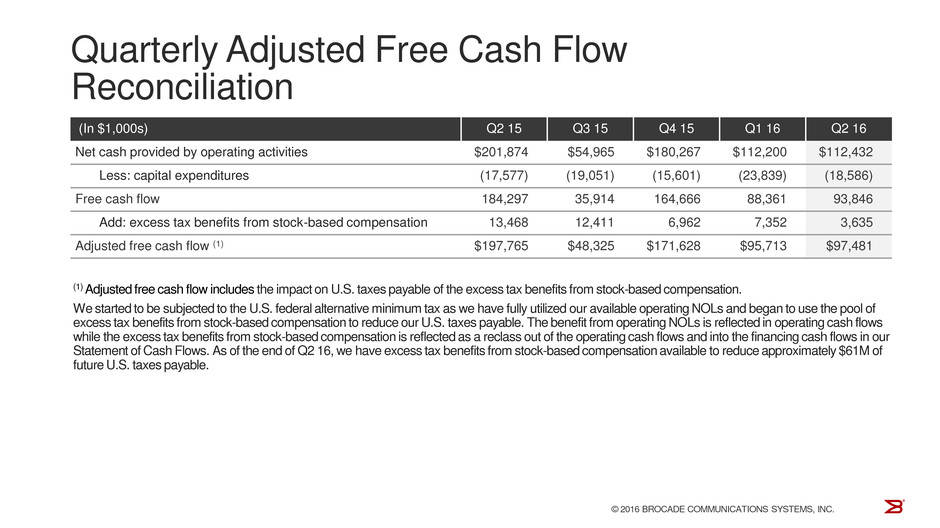
Operating cash flow and adjusted free cash flow were below the forecasted ranges of $120-140M and $100-120M, respectively, as DSOs expanded to 36 days in the quarter due to weaker shipment linearity and revenue was below our expected range.
Inventory turns improved slightly year-over-year.
From a total revenue perspective, including SAN and IP Networking, our channels to market have remained relatively stable over time. Total OEM revenue was 63%, flat year-over-year, with the balance coming from Channel and Direct routes to market.
© 2016 Brocade Communications Systems, Inc. Page 13 of 24
Brocade Q2 FY 2016 Earnings 5/19/2016
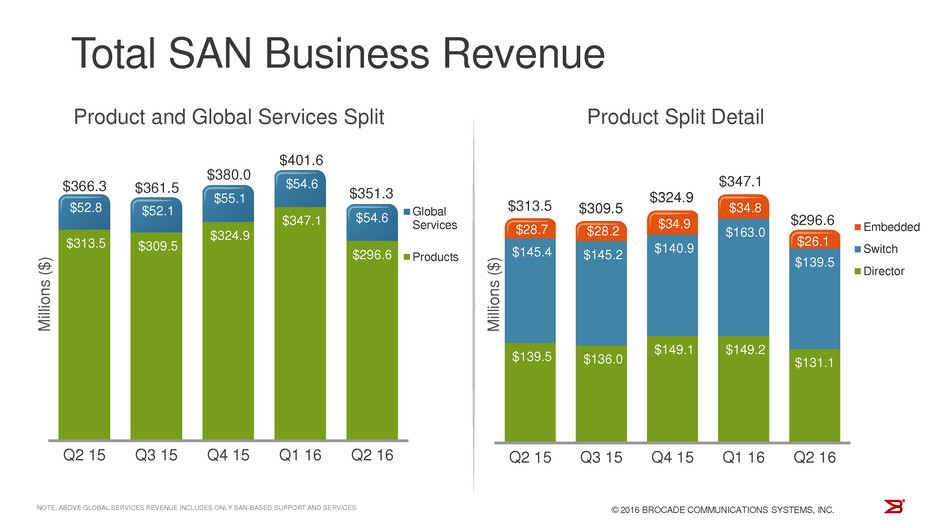
Revenue from our total SAN business, including products and SAN-based support and services, in Q2 16 was $351M, down 4% from Q2 15 as overall product revenue was down 5%. This decline was partially offset by a 4% increase in SAN global services revenue. We believe the year-over-year decline in our SAN revenue reflects an overall slowdown in storage spending and is consistent with commentary from many of our partners and peers.
Our SAN product revenue was $297M in the quarter, down 5% Yr./Yr., as director revenue was down 6%, fixed-configuration switches were down 4%, and embedded server switches were down 9% year-over-year.
SAN-based global services revenue was $55M, up 4% Yr./Yr.
© 2016 Brocade Communications Systems, Inc. Page 14 of 24
Brocade Q2 FY 2016 Earnings 5/19/2016
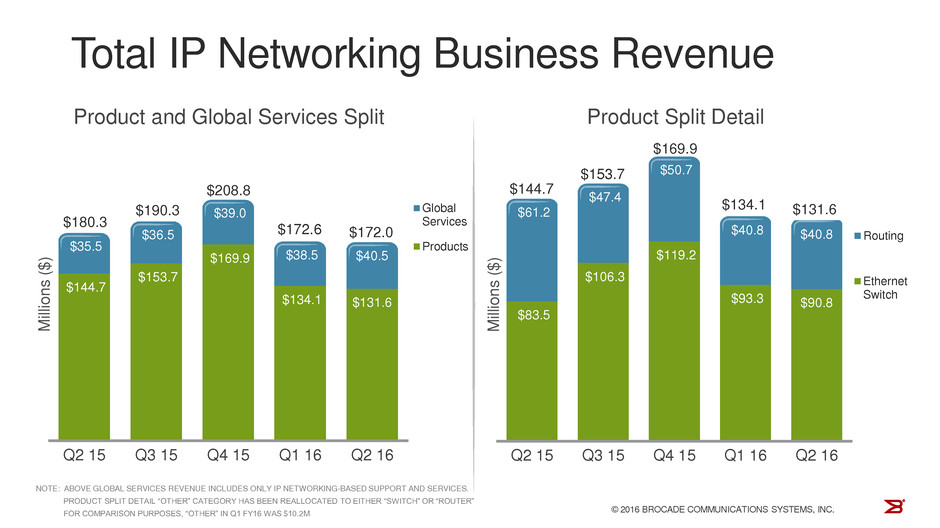
Revenue from our total IP Networking business, including products and IP-based support and services, was $172M, down 5% Yr./Yr. The Yr./Yr. revenue decline was primarily due to lower sales to service provider and U.S. federal customers. Geographically, the Americas (excluding U.S. federal) was down 11%, while EMEA was up 9%, Japan grew 23%, and Asia Pacific grew 15%.
Q2 16 IP Networking product revenue was $132M, down 9% Yr./Yr., as router sales declined 33%. The decline was partially offset by Ethernet switch sales growth of 9%. The routing decline was primarily due to a lower sales of both new chassis and next-gen line cards into service providers.
IP-based Global Services revenue was $40M, up 14% Yr./Yr., primarily due to incremental maintenance revenue associated with the virtual application delivery software acquired during fiscal Q2 2015.
We track our IP Networking business based on the identification of customer use cases. Although it is difficult to identify all end users and their specific network deployments due to our two-tier distribution channel, we provide estimates of the split of our IP Networking business. Our data center customers(1) represented approximately 54% of IP Networking revenue in Q2 16, compared with 62% in Q2 15 and 53% in Q1 16.
(1)The estimated percentage of revenue coming from data center IP Networking customers may fluctuate quarter-to-quarter due to the timing of large data center customer transactions, minor changes to classification from improved visibility of actual customer deployments, as well as the seasonality of the public sector, including federal. Other use cases, such as enterprise campus and carrier networks (MAN/WAN) represent the balance of the business.
© 2016 Brocade Communications Systems, Inc. Page 15 of 24
Brocade Q2 FY 2016 Earnings 5/19/2016
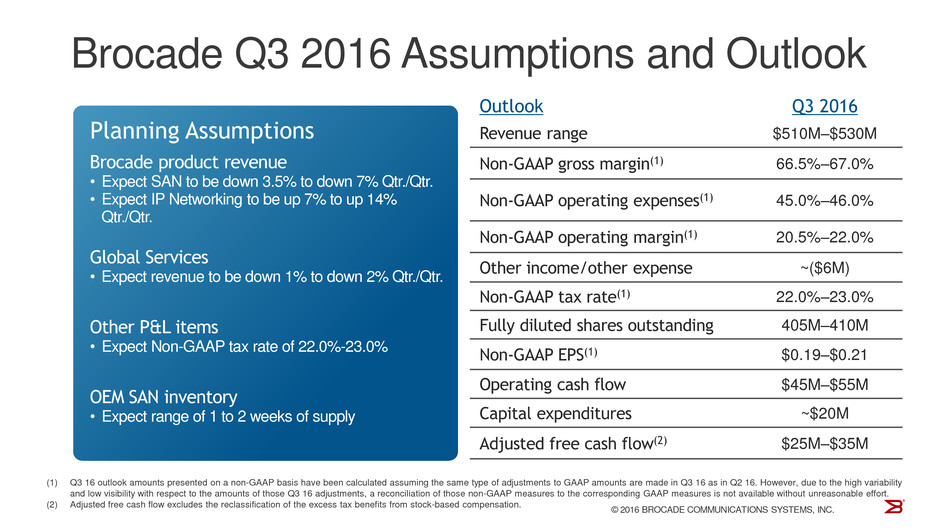
The outlook provided on this page is for Brocade standalone and does not contemplate the Ruckus Wireless acquisition.
Looking forward to Q3 16, we have set the following outlook for the current quarter:
| |
• | For Q3 16, we expect SAN product revenue to be down 3.5% to 7% Qtr./Qtr. as we expect the overall storage environment to remain weak at least through our third quarter. |
| |
• | We expect Q3 16 IP Networking product revenue to be up 7% to 14% Qtr./Qtr. as we anticipate stronger Americas and U.S. federal revenue. |
| |
• | We expect our Global Services revenue to be down 1% to 2% Qtr./Qtr. |
| |
• | We expect Q3 16 non-GAAP gross margin to be between 66.5% to 67.0%, and non-GAAP operating margin to be between 20.5% to 22.0%, primarily due to lower overall revenue and the expected mix of SAN and IP revenues. |
| |
• | Operating cash flow is expected to be in the range of $45M - $55M in fiscal Q3 16. We expect DSOs to remain in the mid-30’s. |
| |
• | At the end of Q2 16, OEM SAN inventory was approximately 1.5 weeks of supply based on SAN business revenue. We expect inventory to be between one to two weeks in Q3 16. |
© 2016 Brocade Communications Systems, Inc. Page 16 of 24
Brocade Q2 FY 2016 Earnings 5/19/2016
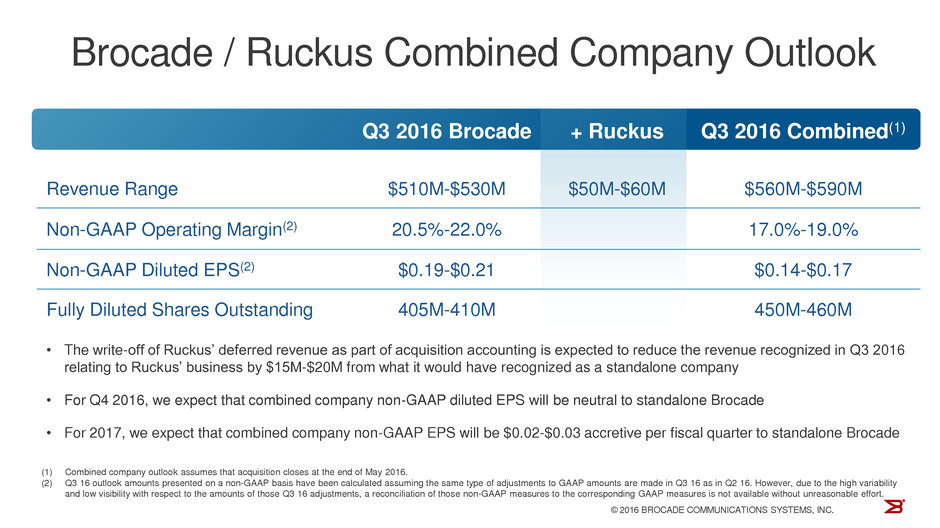
As we expect to close the Ruckus acquisition in fiscal Q3, we are providing a basic framework for modeling the combined companies.
Assuming, for purposes of this model only, the Ruckus acquisition closes at the end of May, our fiscal Q3 will be a stub quarter for the combined company with the Ruckus revenue and expenses impacting the Brocade P&L for only a portion of the quarter. In addition, the acquisition accounting rules will reduce Ruckus’ deferred revenue and will also necessitate a revaluation of all channel inventory, reducing gross margins until that inventory is eventually sold through the channel. In addition, with the closing of the transaction, Brocade expects to issue approximately 75 million shares of common stock, and shortly thereafter resume its share repurchase program. These assumptions have all been reflected in the combined outlook provided above.
Looking forward to fiscal Q4 2016, we expect the impact of the Ruckus acquisition to be neutral to non-GAAP diluted EPS.
For modeling purposes, we are preliminarily estimating that the Ruckus acquisition will be $0.02-$0.03 accretive to non-GAAP diluted EPS in each fiscal quarter in fiscal year 2017. A more complete 2-year financial model will be provided at our Investor Day in September 2016.
© 2016 Brocade Communications Systems, Inc. Page 17 of 24
Brocade Q2 FY 2016 Earnings 5/19/2016
Prepared comments provided by Michael Iburg, Investor Relations
That concludes Brocade’s prepared comments. At 2:30 p.m. Pacific Time on May 19, Brocade will host a webcast conference call at www.brcd.com.
Thank you for your interest in Brocade.
© 2016 Brocade Communications Systems, Inc. Page 18 of 24
Brocade Q2 FY 2016 Earnings 5/19/2016
© 2016 Brocade Communications Systems, Inc. Page 19 of 24
Brocade Q2 FY 2016 Earnings 5/19/2016
© 2016 Brocade Communications Systems, Inc. Page 20 of 24
Brocade Q2 FY 2016 Earnings 5/19/2016
Additional Financial Information:
|
| | | | | | |
| Q2 15 |
| Q1 16 |
| Q2 16 |
|
GAAP product gross margin | 70.0 | % | 70.1 | % | 69.1 | % |
Non-GAAP product gross margin | 70.6 | % | 70.9 | % | 70.2 | % |
| | | |
GAAP services gross margin | 58.4 | % | 55.6 | % | 57.1 | % |
Non-GAAP services gross margin | 59.6 | % | 57.6 | % | 59.3 | % |
© 2016 Brocade Communications Systems, Inc. Page 21 of 24
Brocade Q2 FY 2016 Earnings 5/19/2016
© 2016 Brocade Communications Systems, Inc. Page 22 of 24
Brocade Q2 FY 2016 Earnings 5/19/2016
© 2016 Brocade Communications Systems, Inc. Page 23 of 24
Brocade Q2 FY 2016 Earnings 5/19/2016
© 2016 Brocade Communications Systems, Inc. Page 24 of 24