BRCD-8K EPR - FY14Q4 - Ex 99.2
Q4 FY 2014 Earnings
Prepared Comments and Slides
November 24, 2014
Michael Iburg
Investor Relations
Phone: 408-333-0233
miburg@Brocade.com
Katie Bromley
Public Relations
Phone: 408-333-0429
kbromley@Brocade.com
NASDAQ: BRCD
Brocade Q4 FY 2014 Earnings 11/24/2014
Prepared comments provided by Michael Iburg, Investor Relations
Thank you for your interest in Brocade’s Q4 fiscal year 2014 earnings presentation, which includes prepared remarks, safe harbor, slides, and a press release detailing fiscal fourth quarter and fiscal year 2014 results. The press release, along with these prepared comments and slides, has been furnished to the SEC on Form 8-K and has been made available on the Brocade Investor Relations website at www.brcd.com. The press release will be issued subsequently via Marketwired.
© 2014 Brocade Communications Systems, Inc. Page 2 of 27
Brocade Q4 FY 2014 Earnings 11/24/2014
© 2014 Brocade Communications Systems, Inc. Page 3 of 27
Brocade Q4 FY 2014 Earnings 11/24/2014
Today’s prepared comments include remarks by Lloyd Carney, Brocade CEO, regarding the company’s quarterly and full-year results, its strategy, and a review of operations, as well as industry trends and market/technology drivers related to its business; and by Dan Fairfax, Brocade CFO, who will provide a financial review.
A management discussion and live question and answer conference call will be webcast at
2:30 p.m. PT on November 24 at www.brcd.com and will be archived on the Brocade Investor Relations website.
© 2014 Brocade Communications Systems, Inc. Page 4 of 27
Brocade Q4 FY 2014 Earnings 11/24/2014
Prepared comments provided by Lloyd Carney, CEO
© 2014 Brocade Communications Systems, Inc. Page 5 of 27
Brocade Q4 FY 2014 Earnings 11/24/2014
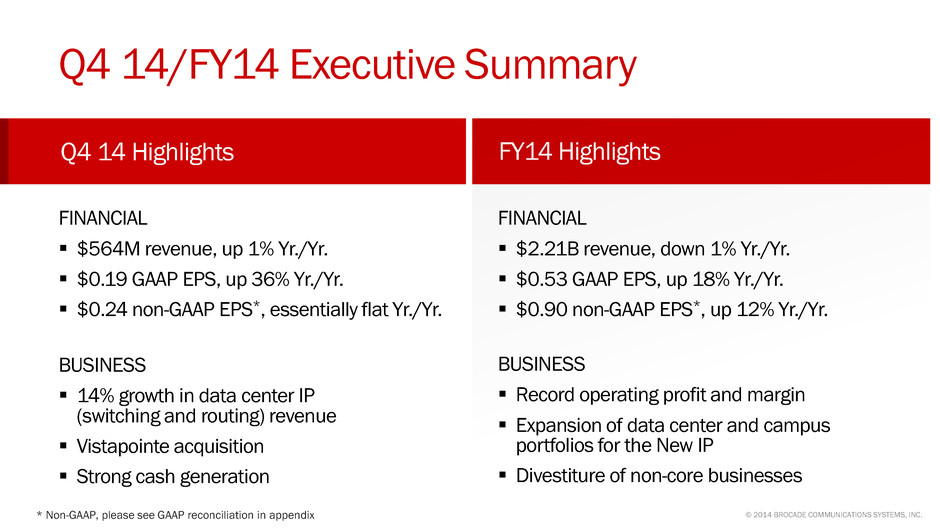
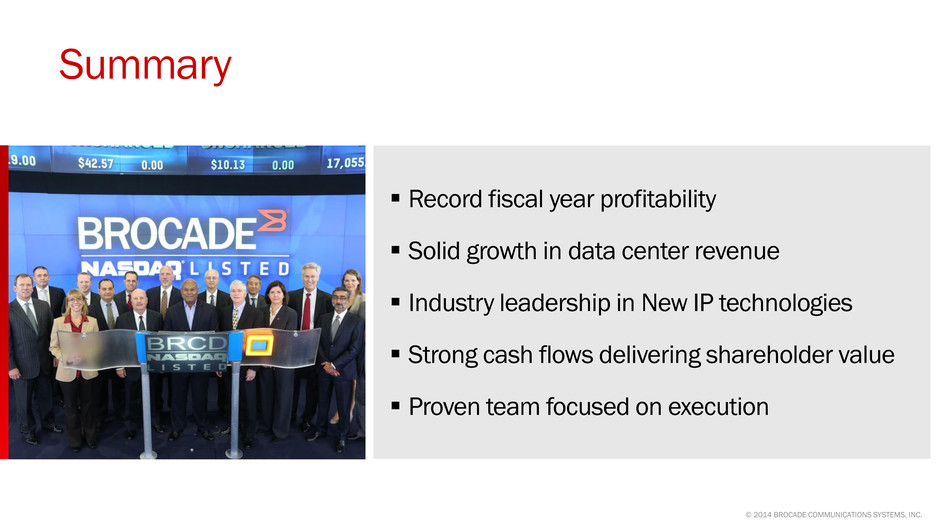
Demonstrating our focus and ability to deliver on the commitments we have made, in Q4 we achieved year-over-year growth in both SAN and IP Networking product revenue, including a 14% increase in data center IP revenue based on use case. We increased profitability through both gross margin expansion and greater operational efficiency. We also generated cash well above our targeted range in Q4, primarily through higher profits and better-than-expected use of working capital.
Turning to the fiscal year, 2014 was the most profitable year in the company’s history, reflecting a strong focus on efficiency and delivering on the leverage in our business model. We completed the divestment and strategic shift of the non-core businesses we identified last year, focusing our energy and investment in growth areas. We also exceeded our commitment to return at least 60% of free cash flow to shareholders, including the payment of Brocade’s first dividend. From a product perspective, we expanded our data center and campus portfolios, providing differentiated solutions designed to help our customers transform their networks into strategic assets.
We are rapidly emerging as a leader for the New IP technologies, and are aligning our focus, investment, and innovation with the evolving cloud, social, and mobile requirements. We are confident in our strategy to enable open, software-driven, agile, and secure network architectures and are excited by the expanding business opportunity the New IP creates for Brocade.
We believe we are well positioned for continued growth and success in our strategic markets, with a strong financial model, appropriately focused resources, and a proven and dedicated team.
© 2014 Brocade Communications Systems, Inc. Page 6 of 27
Brocade Q4 FY 2014 Earnings 11/24/2014
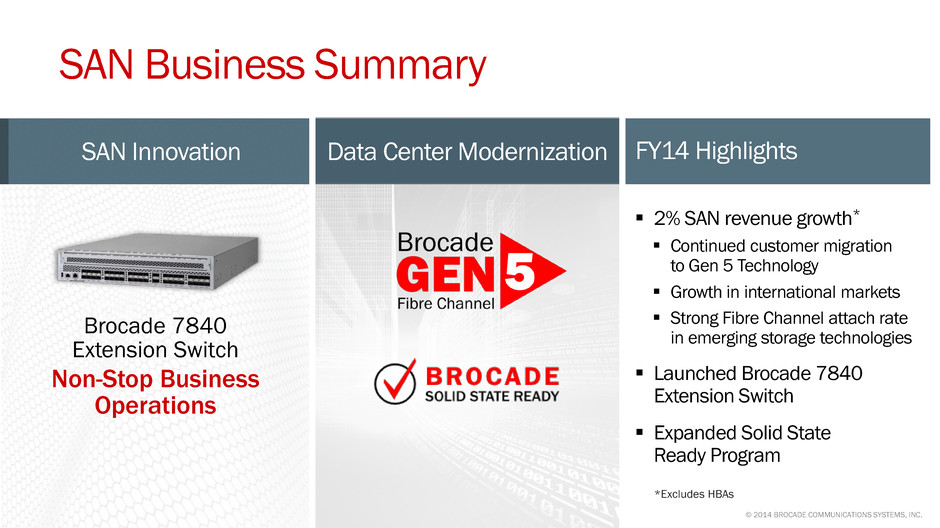
In FY14, we gained SAN market share through solid execution, growth in emerging markets, and the successful migration of customers to our industry-leading Gen 5 Fibre Channel technology. Our continued innovation in storage fabrics is driving new levels of performance and efficiency for our customers. For example, during Q4 we announced the Brocade 7840 Extension Switch that enables enterprises to achieve faster replication and data recovery times to help support always-on operations. We also extended our Fabric Vision technology to allow customers to automate monitoring, increase insight, and simplify troubleshooting between data centers.
The scalability, reliability, and deterministic performance of Fibre Channel is well aligned to the increasingly rigorous demands of today’s storage networks. In fact, market research indicates that Fibre Channel-attached storage capacity is expected to grow at a 34% CAGR for the next several years. We continue to see strong attach rates from emerging storage technologies, such as Solid State Disk (SSD), as Fibre Channel can enable the full benefit of these arrays in application performance. We believe that growth in the deployment of emerging storage technologies is contributing to Brocade Gen 5 (16 Gbps) adoption and will also be a key factor in the industry migration to Gen 6 (32+ Gbps) beginning in the first half of calendar 2016.
We continue to work closely with both our existing OEM storage partners and the SSD startup community to test and certify these new storage arrays with our Fibre Channel SAN technology. During the fourth quarter, we expanded the scope of our Solid State Ready program to better support the efforts of SSD vendors in helping their customers achieve seamless deployment and optimum performance of solid-state storage.
© 2014 Brocade Communications Systems, Inc. Page 7 of 27
Brocade Q4 FY 2014 Earnings 11/24/2014
Fiscal year 2014 was a productive year for our IP Networking business. We grew our data center IP revenue, demonstrating solid execution in this strategic area. We also expanded our data center and campus product portfolios, enabling differentiated capabilities that support the strategic goals of our customers. We extended our leadership in software networking through innovation and active engagement with Tier-1 service providers and cloud service providers. Finally, we completed the divestment of non-core businesses, enabling us to focus our investment in strategic growth areas.
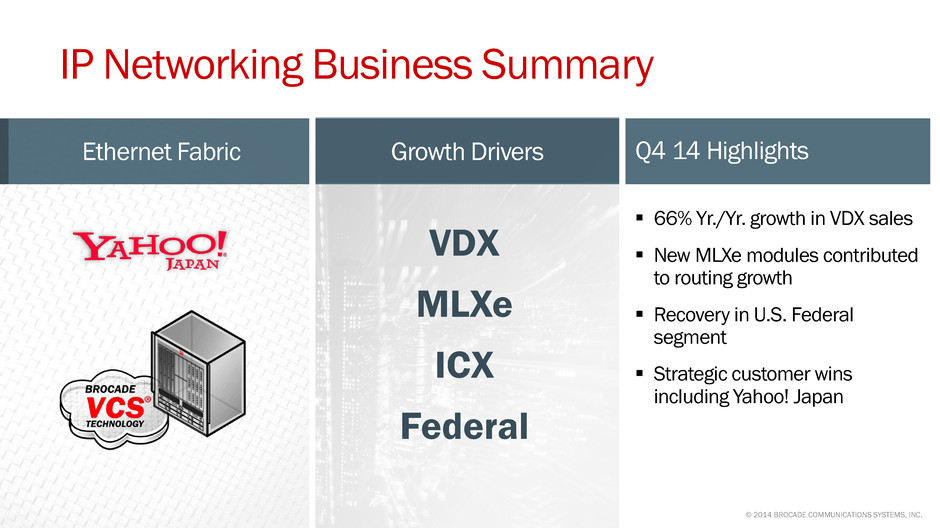
Turning to our fourth quarter performance, we achieved 9% year-over-year revenue growth from continuing IP Networking products. Routing was a strong contributor to this growth, with record revenue driven by the launch of new high-density, feature-enhanced 10 Gbps and 100 Gbps modules for the Brocade MLXe platform.
Another important contributor to our growth in Q4 was the Brocade VDX® data center switch product line, which grew 66% year-over-year. This switch features Brocade VCS Fabric technology and provides customers with an optimal underlay for virtualization and SDN. We were pleased to announce this quarter that Yahoo! Japan completed the deployment of a Brocade Ethernet fabric solution as the network foundation for an enterprise-wide Big Data project. Our solution, which replaced a competitor’s legacy network, enables hundreds of servers to support Hadoop-based analytics across the entire enterprise. Yahoo! Japan is representative of the increased adoption of our Ethernet fabric switches supporting enterprise Big Data initiatives.
And finally, our U.S. Federal business, which had been a challenge for our IP Networking growth earlier this fiscal year, continued to recover in Q4. During the quarter, Brocade co-sponsored the third annual Federal Forum and I was particularly encouraged by the discourse surrounding emerging network technologies, open standards, and multivendor networks as the building blocks for government network infrastructure modernization. We are increasingly seeing agencies embrace industry-leading networking standards and best practices in order to achieve their missions.
© 2014 Brocade Communications Systems, Inc. Page 8 of 27
Brocade Q4 FY 2014 Earnings 11/24/2014
Brocade continues to lead the industry in the development of open, software-driven programmable networks for the New IP-based data center. This focus is a guiding principle of our product and technology roadmap, as well as our acquisition strategy.
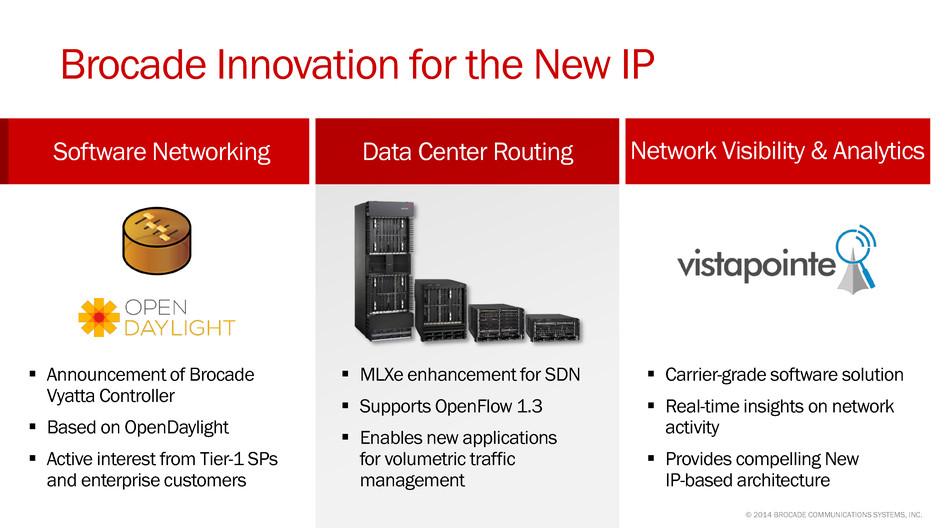
During Q4, we introduced the Brocade Vyatta Controller, based on the OpenDaylight open source project, which underscores our commitment to an open networking platform. This groundbreaking controller enables customers to simplify the control of Layer 2 through 7 networks, whether the components are physical or virtual, from Brocade or other vendors. We are already experiencing active interest from Tier-1 service providers and early enterprise adopters, who are building application development and deployment platforms for the New IP.
Moreover, we continue to enhance our data center and campus portfolios for the New IP requirements. For example, we are enabling support for OpenFlow 1.3 across the Brocade VDX, ICX and MLXe product families. During Q4, we began shipping high-density Brocade MLXe modules featuring significant software enhancements. Leveraging the Brocade Vyatta Controller and Hybrid OpenFlow ports on the Brocade MLX, we will enable SDN applications throughout the coming year that deliver concrete business value for large enterprise and service provider customers. The first of these applications will help to address the constant denial-of-service attacks that virtually all large customers see at the edge of their networks. We are actively developing extensions to this application to assist customers in the management of bandwidth-hungry flows for optimal use of network capacity.
Through targeted technology investments, we are building upon our software networking capabilities and employing our cash for strategic opportunities. During Q4, we acquired the carrier-grade network visibility and analytics technology assets from Vistapointe. This acquisition enables Brocade to address the emerging opportunities and requirements of global Mobile Network Operators (MNOs) as they navigate the significant transitions occurring in their industry. Through enhanced network visibility and analytics, these customers will be better equipped to classify, visualize, manage, and secure subscriber data traffic to deliver a superior mobile user experience as well as generate new revenue opportunities. The Vistapointe acquisition directly complements the existing Brocade MLX-based network packet broker solution to provide MNOs with an end-to-end solution that leverages a New IP-based architecture that is virtualized through Network Functions Virtualization (NFV), and is open and programmable with SDN.
Finally, we were pleased to collaborate with Dell and Intel on Dell’s new open-standard NFV platform that leverages the high-performance Brocade Vyatta 5600 vRouter. This is a great example of the innovation that is possible with open platforms and the value of industry partnerships in the creation of best-of-breed solutions. This platform is designed to accelerate NFV adoption by providing telecommunication service providers a complete open system.
© 2014 Brocade Communications Systems, Inc. Page 9 of 27
Brocade Q4 FY 2014 Earnings 11/24/2014
In closing, the disruptive effect of the network transition to the New IP is creating exciting and incremental growth opportunities for Brocade. Open, software-enabled network architectures are allowing innovative technology solutions and flexible product acquisition models to unseat entrenched competitors.
We have been focused on the opportunity created by this network transition in making key decisions regarding our product portfolio, sales approach, partnerships, leadership appointments, corporate identity, and utilization of financial resources this past year. We are proud of the results we delivered in FY14 and remain focused on those areas in which we can further improve.
As we begin FY15, our goals include:
| |
• | Maintain our innovation leadership in SAN while executing on opportunities to drive growth and achieve market share gains |
| |
• | Grow our overall IP networking business at twice the market rate, with an emphasis on the critical data center market |
| |
• | Extend our early market leadership in the emerging SDN/NFV spaces through innovation and by converting software networking proof-of-concept trials into revenue accounts |
| |
• | Use our strong cash generation to enhance shareholder value |
| |
• | Achieve the FY15 Target Financial Model from our September Investor Day |
| |
• | Deliver a world-class customer experience |
I want to finish by thanking our customers, partners, and investors for their ongoing support of Brocade. I also want to credit our tremendous base of employees worldwide and my executive team for the successes we have achieved this past year, and to thank them for their dedication to our continued progress in fiscal year 2015.
© 2014 Brocade Communications Systems, Inc. Page 10 of 27
Brocade Q4 FY 2014 Earnings 11/24/2014
Prepared comments provided by Dan Fairfax, CFO
© 2014 Brocade Communications Systems, Inc. Page 11 of 27
Brocade Q4 FY 2014 Earnings 11/24/2014
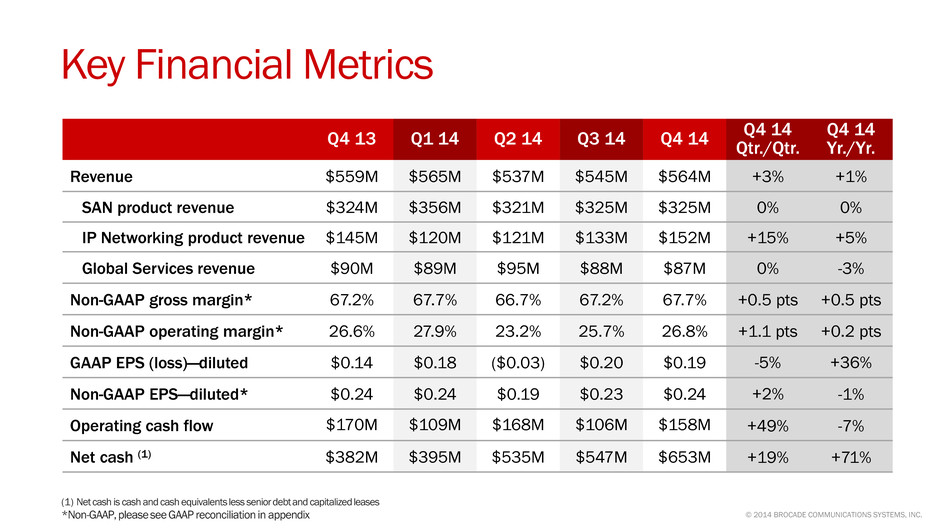
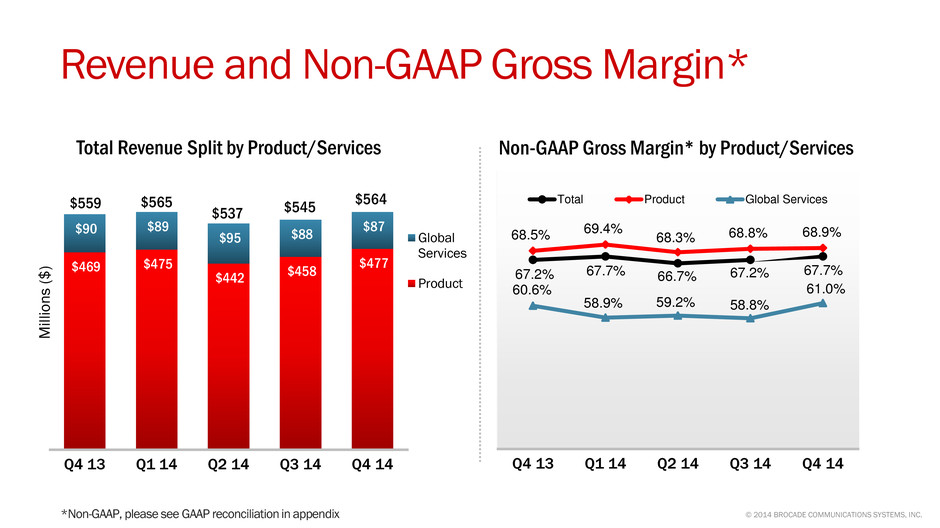
In Q4 14, revenue was $564M, up 1% Yr./Yr. and up 3% Qtr./Qtr. SAN product revenue was $325M, flat both Yr./Yr. and sequentially. Revenue from our IP Networking products in Q4 14 was $152M, up 5% Yr./Yr. and up 15% Qtr./Qtr. Q4 14 Global Services revenue was $87M, down 3% Yr./Yr. and flat sequentially.
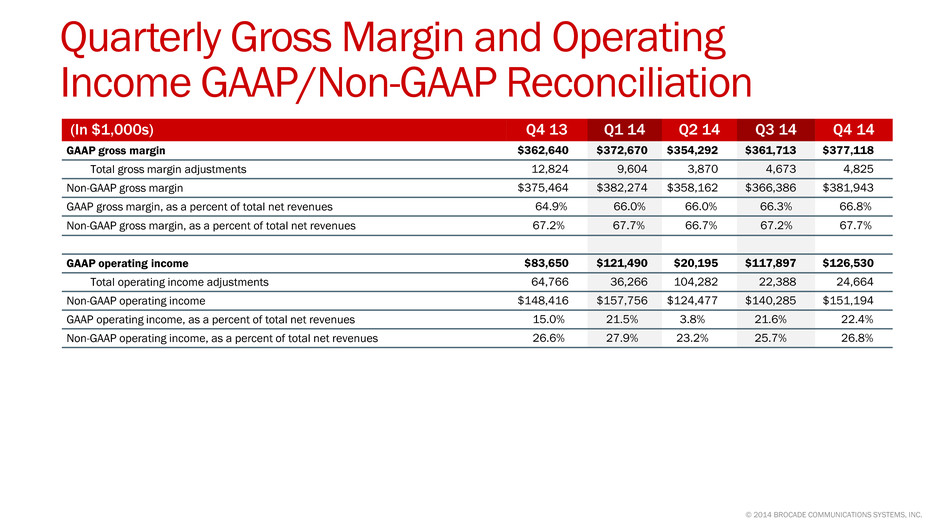
Non-GAAP gross margin was 67.7% in Q4 14, up 50 basis points from both Q4 13 and Q3 14. The improvement in gross margin was due to higher revenues combined with lower overhead costs. Non-GAAP operating margin was 26.8% in Q4, up 20 basis points from Q4 13 and up 110 basis points from Q3 14. The sequential increase was primarily due to higher gross margins and lower spending as a percent of revenue.
Q4 14 GAAP earnings per share (EPS) was $0.19, up $0.05 Yr./Yr., and down $0.01 Qtr./Qtr. Non-GAAP diluted EPS was $0.24 in the quarter, essentially flat Yr./Yr. and up $0.01 Qtr./Qtr.
In Q4 14, the effective GAAP tax rate was 29.1% and the effective non-GAAP tax rate was 26.6%. The effective GAAP and non-GAAP tax rates for Q4 14 were higher year-over-year primarily due to a higher mix of domestic revenue and the benefit of the federal R&D tax credit in calendar year 2013, which has not been reinstated for calendar year 2014.
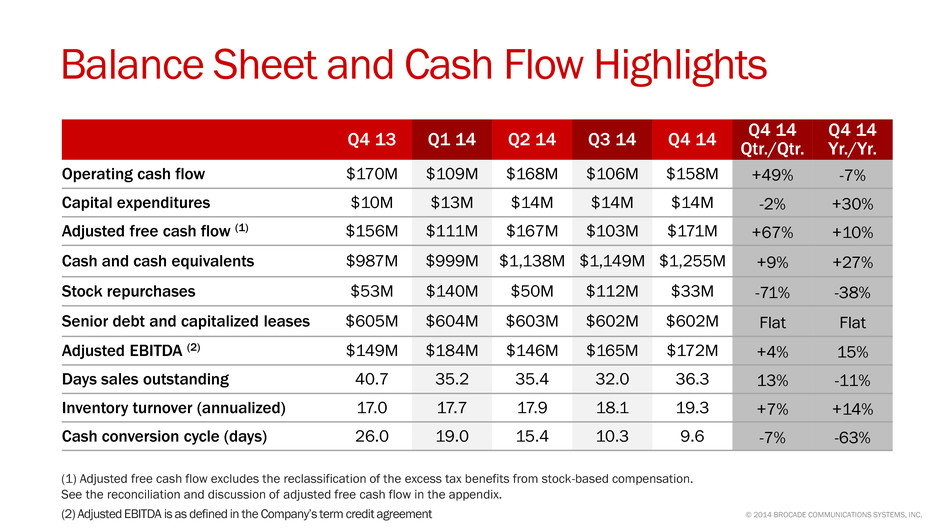
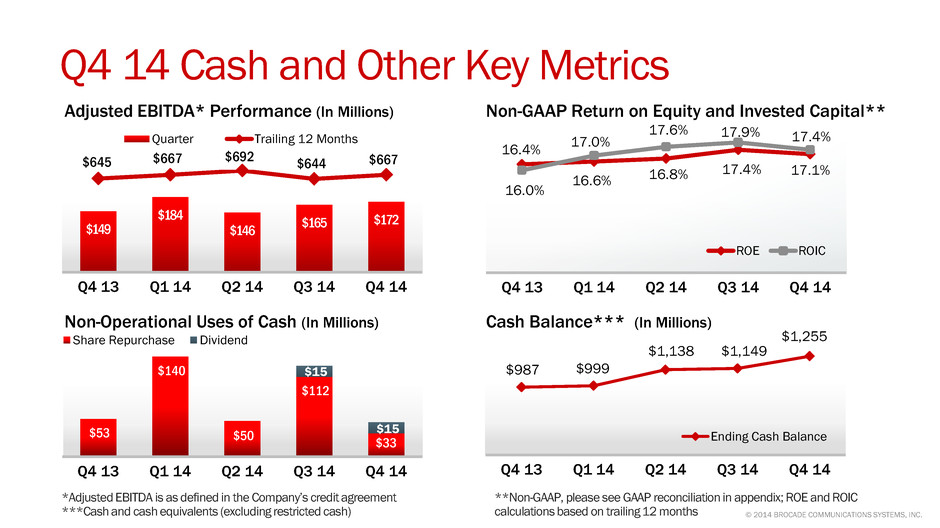
In Q4 14, we generated $158M in operating cash flow, down 7% Yr./Yr. and up 49% Qtr./Qtr. The year-over-year decrease in operating cash flow was primarily due to an increase in the reported excess tax benefit from stock-based compensation. The increase in operating cash flow from Q3 14 was due to the timing of variable compensation and long-term debt interest payments, which are both paid semi-annually in fiscal Q1 and Q3. Average diluted shares outstanding for Q4 14 was 442 million shares, down 4% Yr./Yr. and flat Qtr./Qtr.
© 2014 Brocade Communications Systems, Inc. Page 12 of 27
Brocade Q4 FY 2014 Earnings 11/24/2014
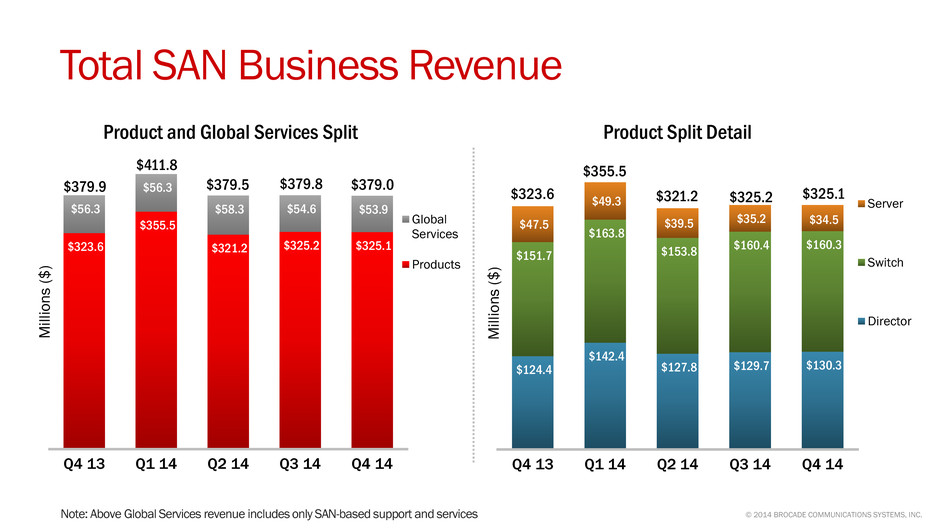
Revenue from our total SAN business, including hardware products and SAN-based support and services, in Q4 14 was $379M, flat Yr./Yr. and sequentially. SAN product revenue was $325M in the quarter, flat Yr./Yr. and sequentially. When adjusted for the divested HBA business, our SAN product revenue from continuing products grew 2% year-over-year due to strong performance in our switch and director product families, partially offset by a decrease in our server product family.
Looking at SAN revenue by product family, director revenue was up 5% Yr./Yr. and flat sequentially. The year-over-year growth was due to continued customer migration to Gen 5. SAN switch revenue was up 6% Yr./Yr. and flat Qtr./Qtr., similar to our Director revenue performance. Our Server product group, including embedded switches and server adapter products, was down 27% Yr./Yr. and down 2% Qtr./Qtr. The year-over-year decline was due to certain OEM specific operational factors and a shift in end-user buying patterns, as well as the divestiture of the HBA business in Q1 14. SAN-based support and services revenue was $54M in the quarter, down 4% Yr./Yr. and down 1% sequentially.
© 2014 Brocade Communications Systems, Inc. Page 13 of 27
Brocade Q4 FY 2014 Earnings 11/24/2014
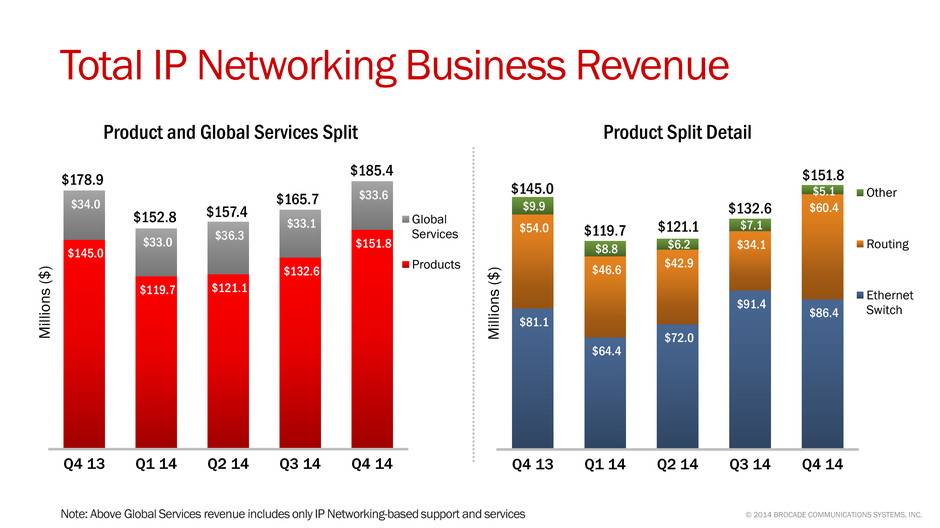
Revenue from our total IP Networking business, including hardware and IP-based support and services, in Q4 14 was $185M, up 4% Yr./Yr. and 12% sequentially. The increase was principally due to higher sales to the U.S. Federal government and a rebound in router sales, including the shipment of new Brocade MLXe high density, feature-enhanced modules. Our Federal revenue was approximately $33M in the quarter, up 38% Yr./Yr. and 43% Qtr./Qtr.
Q4 14 IP Networking product revenue was $152M, up 5% Yr./Yr. and 15% sequentially. Excluding network adapters, wireless, and Brocade ADX®hardware products, the IP Networking product revenue grew 9% Yr./Yr. and 17% Qtr./Qtr. The year-over-year improvement was due to higher sales of Ethernet switching products, primarily to the U.S. Federal government, and stronger router sales into both federal and service provider customers.
As we look at the product mix for IP Networking in the quarter, our Ethernet switch revenue, which includes products for the data center and campus LAN environments, was $86M, up 7% Yr./Yr. and down 6% Qtr./Qtr. The Yr./Yr. increase was due to strong Brocade VDX sales, up 66% Yr./Yr., offset by lower campus LAN revenue. The sequential decline was due to seasonal buying patterns of our educational customers and a mix shift from switches to routers within federal. Our routing products generated $60M in revenue, up 12% Yr./Yr. and 77% Qtr./Qtr. due to the mix shift in federal and pent-up demand for the new Brocade MLXe modules released in fiscal Q4 14. IP Networking-based support and services revenue was $34M in the quarter, down 1% Yr./Yr. and up 1% sequentially.
The split of our IP Networking product revenue based on customer use cases is an important measurement of the progress we are making on our data center strategy. Although it is difficult to identify all end users and their specific network deployments due to our two-tier distribution channel, we are providing estimates of the split of our IP Networking product revenue. Our data center customers represented approximately 58% of IP Networking product revenue in Q4 14, compared with 55% in Q3 14 and 53% in Q4 13. The estimated percentage of revenue coming from data center IP Networking customers may fluctuate quarter-to-quarter due to the timing of large customer transactions, minor changes to classification from improved visibility of actual customer deployments, as well as the seasonality of the public sector, including federal. Other use cases, such as enterprise campus and carrier networks (MAN/WAN) represent the balance of the business.
© 2014 Brocade Communications Systems, Inc. Page 14 of 27
Brocade Q4 FY 2014 Earnings 11/24/2014
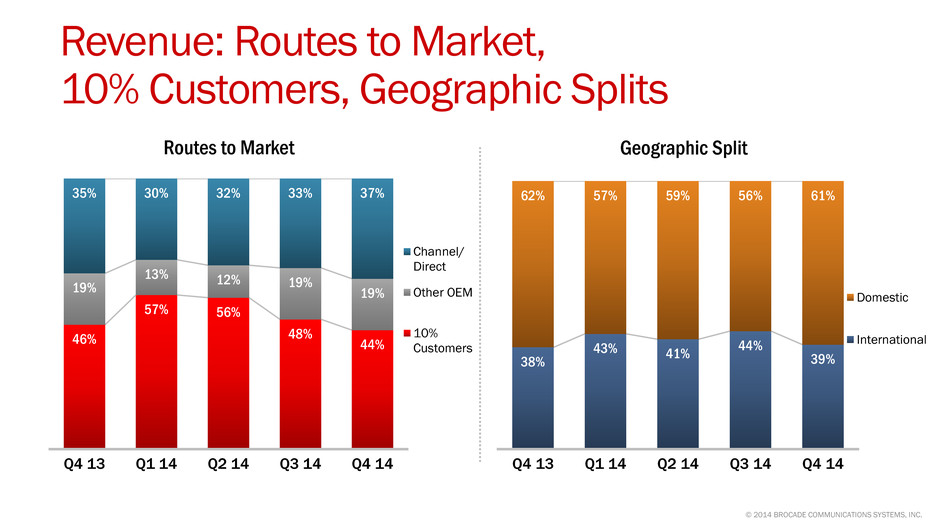
In Q4 14, three customers (EMC, HP , and IBM) each contributed at least 10% of total Company revenue. Our 10% customers collectively contributed 44% of revenue in Q4 14, down 4% from Q3 14 and down 2% from Q4 13. All other OEMs represented 19% of revenue in Q4 14, flat from both Q4 13 and Q3 14. Channel and direct routes to market contributed 37% of revenue in Q4 14, up 4% from Q3 14 and up 2% from Q4 13.
The mix of business based on ship-to location was 61% domestic and 39% international in the quarter, a higher domestic share compared with 56% in Q3 14 and down 1% compared with Q4 13. Since some of our OEMs take delivery of our products domestically and then ship internationally to their end users, the percentage of international revenue based on end-user location would be higher.
As a further breakdown of our IP Networking business revenue based on ship-to location, the Americas region (excluding U.S. Federal) was 53% of total IP Networking business revenue, a decrease of 2% Yr./Yr. but up 4% sequentially. Federal was 18% of total IP Networking business revenue, an increase of 4% Yr./Yr and up 4% sequentially. International was 29% of total IP Networking business revenue, a decrease of 2% Yr./Yr. and down 7% sequentially, both primarily driven by EMEA.
© 2014 Brocade Communications Systems, Inc. Page 15 of 27
Brocade Q4 FY 2014 Earnings 11/24/2014
Q4 14 non-GAAP company gross margin of 67.7% exceeded our original guidance range for the quarter primarily due to a favorable product mix and lower overhead spending. Q4 14 non-GAAP product gross margin was 68.9%, above our FY14 target model range of 66.0% to 68.0%. This represents an increase of approximately 10 basis points from Q3 14 and an increase of approximately 40 basis points from Q4 13. The year-over-year and sequential improvement was primarily due to favorable product and customer mix within the IP Networking business.
Q4 14 non-GAAP SAN product gross margin percentage was in the mid-70’s, slightly better
quarter-over-quarter and year-over-year. Q4 14 non-GAAP IP Networking product gross margin percentage was in the mid-50’s, slightly up quarter-over-quarter and up over the prior year.
Non-GAAP Global Services gross margin was 61.0% in Q4 14, up 40 basis points year-over-year and up 220 basis points quarter-over-quarter primarily due to improved efficiencies and lower overhead spending.
© 2014 Brocade Communications Systems, Inc. Page 16 of 27
Brocade Q4 FY 2014 Earnings 11/24/2014
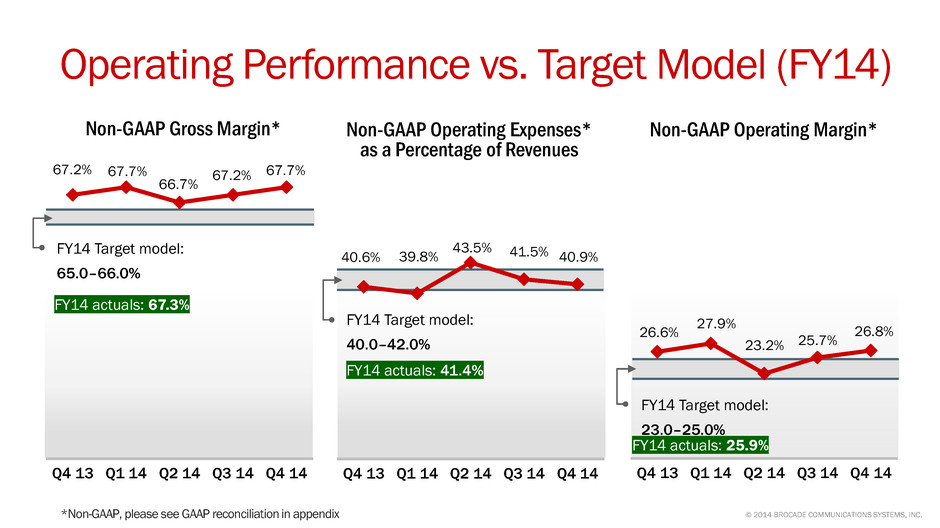
Non-GAAP gross margin was 67.7% in Q4 14 and was 67.3% for the fiscal full year, higher than our FY14 target model range of 65.0% to 66.0%. The over-performance in fiscal Q4 was due to higher revenue, favorable mix shift to higher margin products within both the SAN and IP product families, and lower manufacturing overhead costs.
On a non-GAAP basis, total operating expenses of $230.7M, or 40.9% of revenues in Q4 14, were within our FY14 target model range of 40.0% to 42.0%. Total operating expenses were 41.4% of revenues in FY14, in the middle of our target range.
Non-GAAP operating margin was 26.8% in Q4 14, an improvement of 20 basis points compared with Q4 13 and a 110 basis-point improvement compared with Q3 14. The sequential increase was primarily due to higher revenue, improved gross margins, and lower spending as a percent of revenue. For the full fiscal year, non-GAAP operating margin was 25.9%, higher than the FY14 target model range of 23.0% to 25.0%.
Ending headcount was 4,161 in Q4 14, up 58 from 4,103 in Q3 14, and down 8 from 4,169
in Q4 13.
© 2014 Brocade Communications Systems, Inc. Page 17 of 27
Brocade Q4 FY 2014 Earnings 11/24/2014
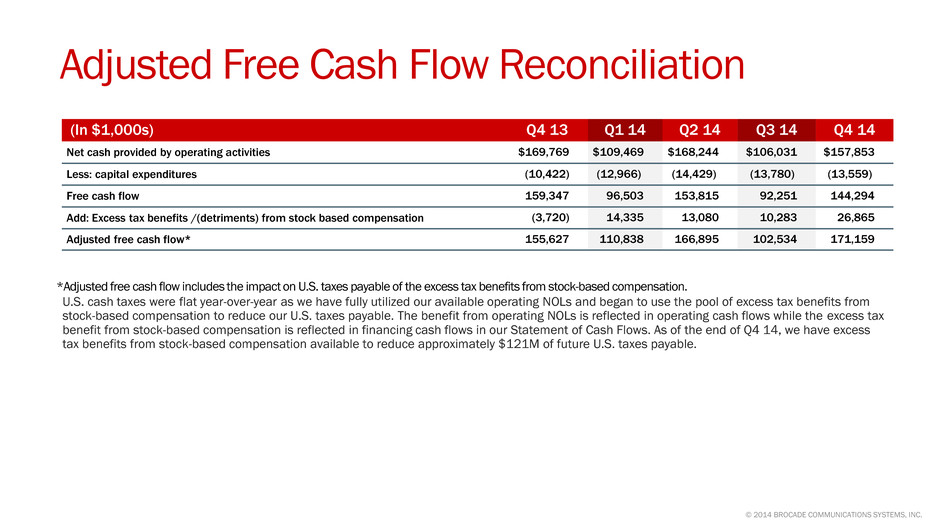
Operating cash flow was $158M in Q4 14, down 7% Yr./Yr. and up 49% sequentially. The decrease in operating cash flow from the prior year was primarily due to an increase in the reported excess tax benefit from stock-based compensation. We describe the free cash flow impact of the excess tax benefit from stock-based compensation in the appendix. The sequential increase in cash from operations was primarily due to the timing of variable compensation and long-term debt interest payments, which are both paid semiannually in fiscal Q1 and Q3. We saw good shipment linearity in Q4 14, resulting in DSOs of 36 days, a solid improvement from 41 days in Q4 13.
Total capital expenditures in the quarter were $14M. Cash and cash equivalents were $1,255M in Q4 14, up $106M from Q3 14 and up $268M from Q4 13. The U.S. cash balance was $495M at the end of Q4 14.
In Q4 14, we continued our quarterly cash dividend of $0.035 per share of common stock and repurchased $33M of common stock at an average purchase price of $9.95. For fiscal year 2014, we repurchased $335M of common stock. Combined with the dividends paid during the year, this represents a total return to our shareholders of 66% of adjusted free cash flow for FY14.
© 2014 Brocade Communications Systems, Inc. Page 18 of 27
Brocade Q4 FY 2014 Earnings 11/24/2014
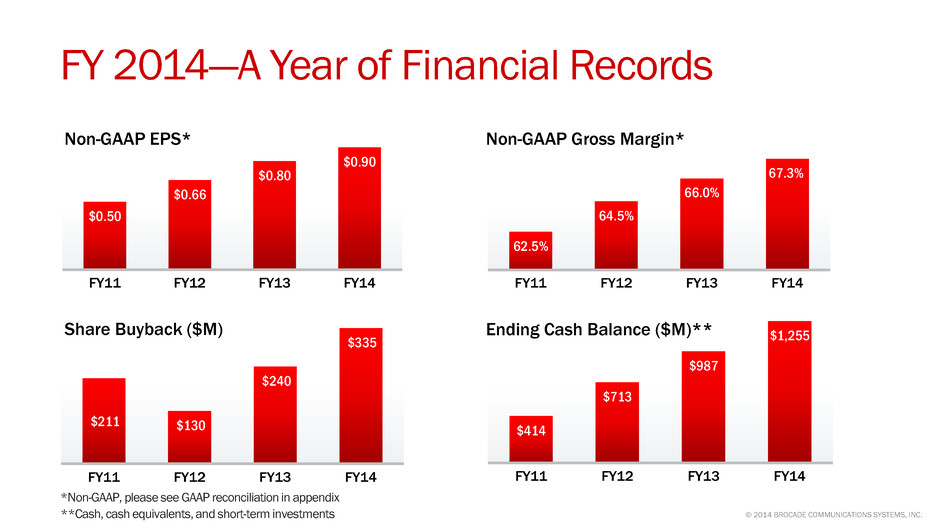
Reflecting back on FY14, it was a year of improved financial results. Non-GAAP EPS for FY14 increased 12% Yr./Yr. This was largely driven by improvements in gross margins, reductions in operating expenses, and share repurchases.
We reported strong non-GAAP gross margin of 67.3% for FY14, an increase of 130 basis points year-over-year and 280 basis points from FY12. The increase in gross margin was the result of improvements in the cost structure of our IP Networking products, increased revenue contribution from Ethernet fabrics products, and lower manufacturing and service overhead.
We accelerated our share repurchase program in FY14, up 40% Yr./Yr., retiring 38 million shares. We also initiated the first dividend in company history.
Lastly, our ending cash balance exiting FY14 was $1,255 million, an increase of 27% Yr./Yr. Increased profitability, focused attention on working capital, and improvements in our operational efficiency all contributed to the increase in cash.
© 2014 Brocade Communications Systems, Inc. Page 19 of 27
Brocade Q4 FY 2014 Earnings 11/24/2014
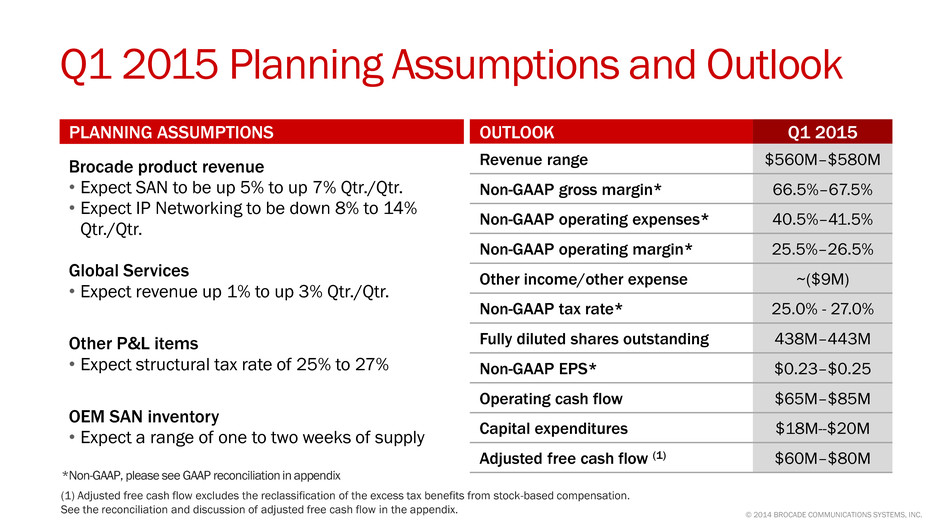
Looking forward to Q1 15, we considered a number of factors, including the following, in setting our outlook:
• For Q1 15, we expect SAN revenue to be up 5% to 7% Qtr./Qtr. Typically we see stronger buying patterns from our OEM partners in calendar Q4.
• We expect our Q1 15 IP Networking revenue to be down 8% to 14% Qtr./Qtr., principally driven by lower federal and service provider revenue, as well as normal seasonal enterprise spending patterns.
• We expect our Global Services revenue to be up 1% to 3% Qtr./Qtr. and service gross margins to decline slightly as we make investments in our support and service infrastructure.
• We expect non-GAAP operating expenses to be flat to up 2% Qtr./Qtr.
• At the end of Q4 14, OEM inventory was approximately 1.1 weeks of supply based on SAN business revenue. We expect inventory to be between one to two weeks in Q1 15, as OEM inventory levels may fluctuate due to both seasonality and large end-user order patterns at the OEMs.
• We have assumed a structural non-GAAP tax rate of 25% to 27% for FY15.
• We expect Q1 15 operating cash flow to be lower sequentially due to the timing of variable compensation and bond interest payments.
• We expect Q1 15 non-GAAP gross margin to be within or slightly above our recently introduced FY15-16 two-year target model range of 66.0% - 67.0%, and non-GAAP operating margin to be within our recently introduced FY15-16 two-year target model range of 25.0% to 27.0%.
© 2014 Brocade Communications Systems, Inc. Page 20 of 27
Brocade Q4 FY 2014 Earnings 11/24/2014
Prepared comments provided by Michael Iburg, Investor Relations
That concludes Brocade’s prepared comments. At 2:30 p.m. Pacific Time on November 24, Brocade will host a webcast conference call at www.brcd.com.
Thank you for your interest in Brocade.
© 2014 Brocade Communications Systems, Inc. Page 21 of 27
Brocade Q4 FY 2014 Earnings 11/24/2014
© 2014 Brocade Communications Systems, Inc. Page 22 of 27
Brocade Q4 FY 2014 Earnings 11/24/2014
Additional Financial Information:
|
| | | | | | |
| Q4 13 |
| Q3 14 |
| Q4 14 |
|
GAAP gross margin | 64.9 | % | 66.3 | % | 66.8 | % |
Non-GAAP gross margin | 67.2 | % | 67.2 | % | 67.7 | % |
| | | |
GAAP product gross margin | 66.1 | % | 68.2 | % | 68.3 | % |
Non-GAAP product gross margin | 68.5 | % | 68.8 | % | 68.9 | % |
| | | |
GAAP services gross margin | 58.8 | % | 56.4 | % | 58.6 | % |
Non-GAAP services gross margin | 60.6 | % | 58.8 | % | 61.0 | % |
| | | |
GAAP operating margin | 15.0 | % | 21.6 | % | 22.4 | % |
Non-GAAP operating margin | 26.6 | % | 25.7 | % | 26.8 | % |
© 2014 Brocade Communications Systems, Inc. Page 23 of 27
Brocade Q4 FY 2014 Earnings 11/24/2014
© 2014 Brocade Communications Systems, Inc. Page 24 of 27
Brocade Q4 FY 2014 Earnings 11/24/2014
© 2014 Brocade Communications Systems, Inc. Page 25 of 27
Brocade Q4 FY 2014 Earnings 11/24/2014
© 2014 Brocade Communications Systems, Inc. Page 26 of 27
Brocade Q4 FY 2014 Earnings 11/24/2014
© 2014 Brocade Communications Systems, Inc. Page 27 of 27

